
ATHENS, Greece, Aug. 25, 2026 (GLOBE NEWSWIRE) — Euroseas Ltd. (NASDAQ: ESEA, the “Company” or “Euroseas”), an owner and operator of container carrier vessels and provider of seaborne transportation for containerized cargoes, announced today a time charter contract extension for its 2006-built 1,740 teu feeder containership, M/V Jonathan P, for a minimum period of 24 to a maximum period of 26 months, at the option of the charterer, at a gross daily rate of $26,000. The new period will commence at the end of October 2026, following the completion of the vessel’s scheduled dry-dock, and will run in direct continuation of the current charter contract.
Aristides Pittas, Chairman and CEO of Euroseas, commented: “We are very pleased to announce the extension of the time charter contract for our feeder containership, M/V Jonathan P, in direct continuation of her present charter, for 24-26 months at a profitable rate of $26,000/day. Despite the typical summer slowdown and ongoing geopolitical uncertainty, the containership charter market has remained active with strong operator demand and limited vessel availability continuing to firm charter terms both in terms of rates and contract periods. The charter is expected to generate approximately $12.7 million of EBITDA over the minimum contracted period and increases our charter coverage for 2026, 2027, and 2028 to about 97%, 86% and 50%, respectively.”
Fleet Profile: The Euroseas Ltd. fleet profile is currently as follows:
Notes: (*) TC denotes time charter. Charter duration indicates the earliest redelivery date; all dates listed are the earliest redelivery dates under each TC unless the contract rate is lower than the current market rate in which cases the latest redelivery date is assumed; vessels with the latest redelivery date shown are marked by (+). (**) Charterer has the option to convert to a five-year charter at $32,500/day for the entire period. (***) The entity owning the vessel is 51% owned by Euroseas Ltd. and 49% by NRP Investors.
About Euroseas Ltd.
Euroseas Ltd. was formed on May 5, 2005 under the laws of the Republic of the Marshall Islands to consolidate the ship owning interests of the Pittas family of Athens, Greece, which has been in the shipping business over the past 150 years. Euroseas trades on the NASDAQ Capital Market under the ticker ESEA.
Euroseas operates in the container shipping market. Euroseas’ operations are managed by Eurobulk Ltd., an ISO 9001:2008 and ISO 14001:2004 certified affiliated ship management company, which is responsible for the day-to-day commercial and technical management and operations of the vessels. Euroseas employs its vessels on spot and period charters and through pool arrangements.
The Company has a fleet of 21 vessels, including 15 Feeder containerships and 6 Intermediate containerships with a cargo capacity of 61,144 teu. After the delivery of four intermediate and eight feeder containership newbuildings between 2027 and 2029, Euroseas’ fleet will consist of 33 vessels with a total carrying capacity of 97,396 teu.
Forward Looking Statement
This press release contains forward-looking statements (as defined in Section 27A of the Securities Act of 1933, as amended, and Section 21E of the Securities Exchange Act of 1934, as amended) concerning future events and the Company’s growth strategy and measures to implement such strategy; including expected vessel acquisitions and entering into further time charters. Words such as “expects,” “intends,” “plans,” “believes,” “anticipates,” “hopes,” “estimates,” and variations of such words and similar expressions are intended to identify forward-looking statements. Although the Company believes that the expectations reflected in such forward-looking statements are reasonable, no assurance can be given that such expectations will prove to have been correct. These statements involve known and unknown risks and are based upon a number of assumptions and estimates that are inherently subject to significant uncertainties and contingencies, many of which are beyond the control of the Company. Actual results may differ materially from those expressed or implied by such forward-looking statements. Factors that could cause actual results to differ materially include, but are not limited to changes in the demand for containerships, competitive factors in the market in which the Company operates; risks associated with operations outside the United States; and other factors listed from time to time in the Company’s filings with the Securities and Exchange Commission. The Company expressly disclaims any obligations or undertaking to release publicly any updates or revisions to any forward-looking statements contained herein to reflect any change in the Company’s expectations with respect thereto or any change in events, conditions or circumstances on which any statement is based.
Selections of CRO and European Clinical Sites Represent Significant Milestones Toward Initiation of the GEO-MVA Immunobridging Study
ATLANTA, GA – August 25, 2026 – GeoVax Labs, Inc. (Nasdaq: GOVX), a clinical-stage biotechnology company developing vaccines and immunotherapies against infectious diseases and solid tumor cancers, today announced that it has selected the contract research organization (CRO) and European clinical trial sites planned to support the critical immunobridging portion of GEO-MVA-301, the Company’s pivotal Phase 3 clinical program evaluating GEO-MVA as a vaccine against mpox and smallpox.
The selections represent another important operational readiness milestone as GeoVax advances preparations for the European immunobridging study. The randomized, double-blind study is designed to compare the immunogenicity and safety of GEO-MVA with the licensed MVA vaccine in healthy adults.
The selected European clinical sites have extensive experience conducting late-stage vaccine studies and were evaluated for their ability to support timely recruitment across the study’s required adult age groups, intensive immunogenicity sampling, participant retention and high-quality clinical execution. GeoVax has also established contingency site capacity intended to provide additional recruitment flexibility if required. The immunobridging study is designed to be completed within 8-12 weeks, initiated in Q4 2026, with results announced by mid-2027.
“Selection of our CRO and European clinical sites moves GEO-MVA another important step from development planning toward clinical execution,” said David Dodd, Chairman and Chief Executive Officer of GeoVax. “We now have critical components of the pivotal study infrastructure identified and aligned, and the program is increasingly taking shape as an execution-ready clinical program.”
Dodd continued, “These milestones are particularly important because they reflect progress across multiple workstreams – not simply clinical-site selection. Manufacturing readiness, regulatory planning, clinical operations, comparator strategy and site preparation are being brought together around a defined pivotal development pathway. We believe these activities position us to move efficiently toward study initiation as the remaining requirements are completed.”
A Focused Pivotal Development Strategy
The immunobridging study is planned to enroll 500 healthy adult participants at European clinical sites and evaluate whether immune responses generated by GEO-MVA are non-inferior to those generated by the licensed MVA comparator vaccine. GeoVax expects meeting the non-inferiority criteria will form the basis for approval by the European Medicines Agency (EMA), providing eligibility for GEO-MVA procurement.
The study will evaluate neutralizing antibody responses and seroconversion against vaccinia and mpox viruses, together with additional immunogenicity and safety measures. Enrollment is planned across multiple adult age groups to support a representative clinical dataset.
The study design incorporates an initial safety lead-in cohort, followed by enrollment of the remaining immunobridging study participants. The CRO and site-selection process emphasized capabilities considered important for efficient execution of the pivotal program, including:
Experience conducting Phase 2 and Phase 3 vaccine trials;
Established clinical and regulatory infrastructure in Europe;
Ability to support intensive immunogenicity sampling and rigorous safety oversight; and
Recruitment capacity and contingency planning designed to protect program timelines.
“Our objective has been to systematically remove the operational dependencies between GEO-MVA and initiation of the pivotal study,” Dodd said. “With each readiness milestone, the program becomes more tangible: the clinical pathway is defined, the vaccine has been manufactured, and we are now putting the clinical execution infrastructure in place. There is still work ahead, including regulatory and financing requirements, but the pieces necessary to execute the program are increasingly coming together.”
About GEO-MVA
GEO-MVA is GeoVax’s MVA-based vaccine candidate being developed for prevention of mpox and smallpox. GEO-MVA is a highly attenuated, replication-deficient poxvirus vaccine derived from the same original MVA lineage as currently licensed MVA vaccines. The planned GEO-MVA-301 pivotal program is designed to evaluate the immunogenicity and safety of GEO-MVA relative to an approved MVA comparator vaccine and, if successful, support regulatory submissions seeking marketing authorization.
About GeoVax
GeoVax Labs, Inc. is a clinical-stage biotechnology company focused on the development of vaccines and immunotherapies addressing high-consequence infectious diseases and solid tumor cancers. GeoVax’s priority program is GEO-MVA, a Modified Vaccinia Ankara (MVA)–based vaccine targeting mpox and smallpox. The program is advancing under an expedited regulatory pathway, with plans to initiate a pivotal Phase 3 clinical trial in the second half of 2026, to address critical global needs for expanded orthopoxvirus vaccine supply and biodefense preparedness. In oncology, GeoVax is developing Gedeptin®, a gene-directed enzyme prodrug therapy (GDEPT) designed to enhance immune checkpoint inhibitor activity. Gedeptin has completed a multicenter Phase 1/2 clinical trial in advanced head and neck cancer and is being advanced into combination strategies, including planned neoadjuvant and first-line settings. GeoVax maintains a global intellectual property portfolio supporting its infectious disease and oncology programs and continues to evaluate strategic partnerships and funding opportunities aligned with its development priorities. For more information, visit www.geovax.com.
Forward-Looking Statements
This release contains forward-looking statements regarding GeoVax’s business plans. The words “believe,” “look forward to,” “may,” “estimate,” “continue,” “anticipate,” “intend,” “should,” “plan,” “could,” “target,” “potential,” “is likely,” “will,” “expect” and similar expressions, as they relate to us, are intended to identify forward-looking statements. We have based these forward-looking statements largely on our current expectations and projections about future events and financial trends that we believe may affect our financial condition, results of operations, business strategy and financial needs. Actual results may differ materially from those included in these statements due to a variety of factors, including whether: GeoVax is able to obtain acceptable results from ongoing or future clinical trials of its investigational products, GeoVax’s immuno-oncology products and preventative vaccines can provoke the desired responses, and those products or vaccines can be used effectively, GeoVax’s viral vector technology adequately amplifies immune responses to cancer antigens, GeoVax can develop and manufacture its immuno-oncology products and preventative vaccines with the desired characteristics in a timely manner, GeoVax’s immuno-oncology products and preventative vaccines will be safe for human use, GeoVax’s vaccines will effectively prevent targeted infections in humans, GeoVax’s immuno-oncology products and preventative vaccines will receive regulatory approvals necessary to be licensed and marketed, GeoVax raises required capital to complete development, there is development of competitive products that may be more effective or easier to use than GeoVax’s products, GeoVax will be able to enter into favorable manufacturing and distribution agreements, and other factors, over which GeoVax has no control.
Further information on our risk factors is contained in our periodic reports on Form 10-Q and Form 10-K that we have filed and will file with the SEC. Any forward-looking statement made by us herein speaks only as of the date on which it is made. Factors or events that could cause our actual results to differ may emerge from time to time, and it is not possible for us to predict all of them. We undertake no obligation to publicly update any forward-looking statement, whether as a result of new information, future developments or otherwise, except as may be required by law.
Multiple High-Grade Drill Intercepts, Broad Intervals and Holes Ending in Mineralization Signal a Growing Gold System; Six Additional Drill Holes Pending
VANCOUVER, B.C., August 25, 2026 – Tectonic Metals Inc. (“Tectonic” or the “Company”) (TSX-V: TECT; OTCQX: TETOF) today reported new drill assay results from Black Creek, one of six intrusion-related district targets located within the Company’s flagship 99,840-acre Flat Gold Project (“Flat”) in southwest Alaska, U.S. The results confirm a second consecutive season of high-grade gold mineralization at Black Creek and strengthen the Company’s view that the target has the potential to emerge as a second gold intrusive centre at Flat, approximately six kilometres (“km”) northeast of the main bulk-tonnage, heap leach Chicken Mountain target.
2026 Black Creek Drill Assay Highlights
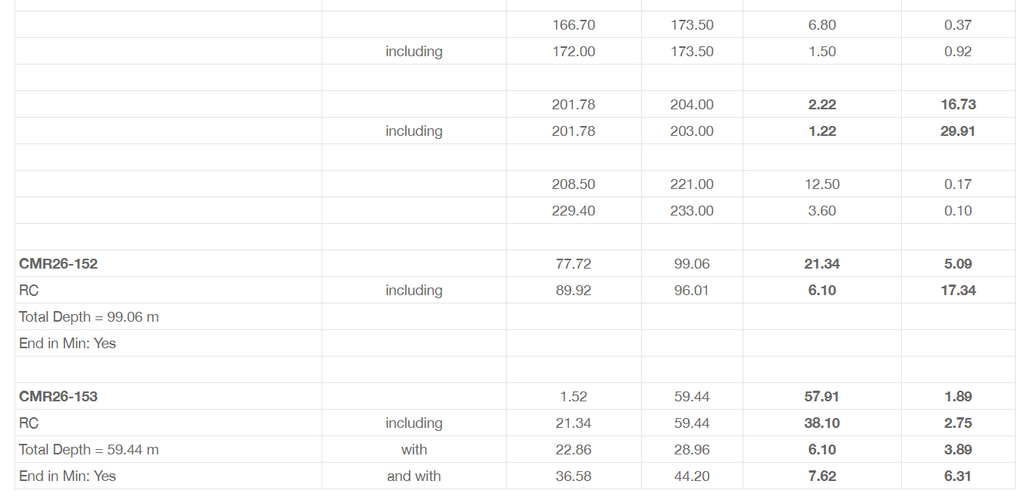
CMR26-152: 5.09 grams per tonne gold (“g/t Au”) over 21.34 metres (“m”) including 17.34 g/t Au over 6.10 m;
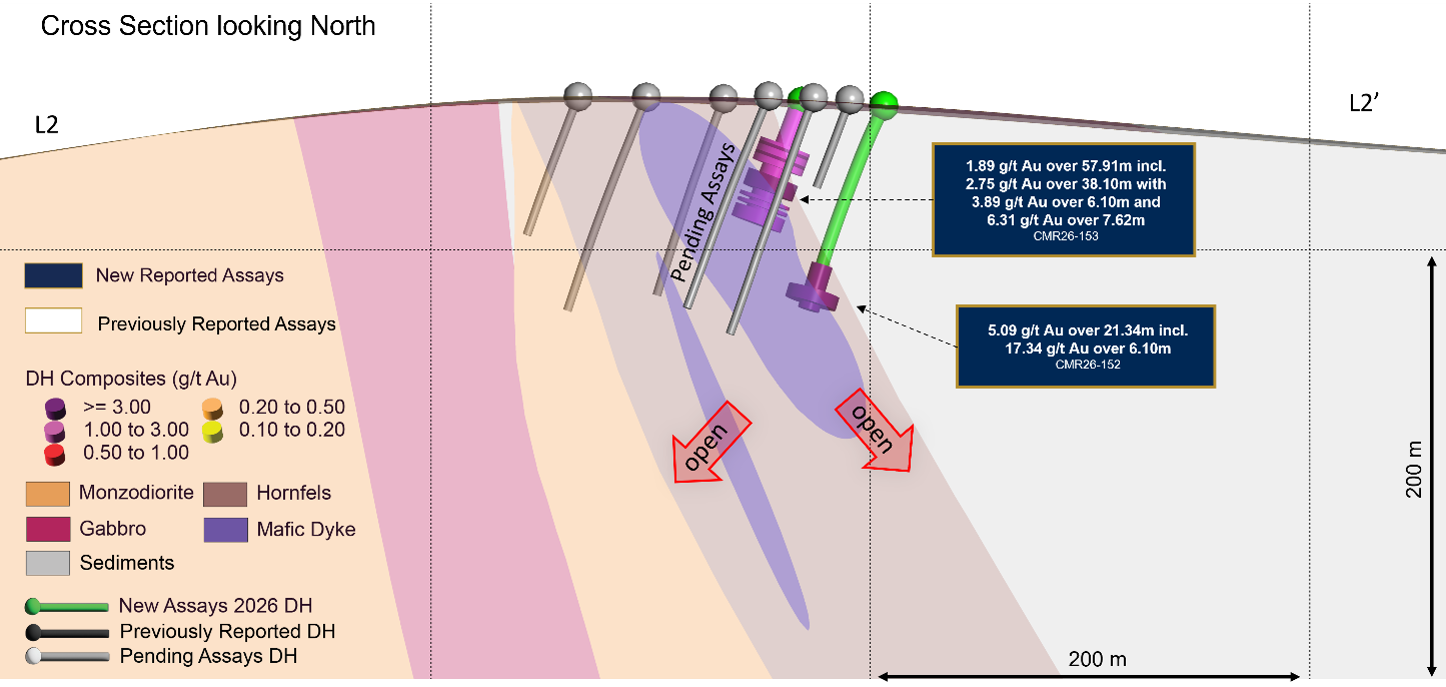
CMR26-153:1.89 g/t Au over 57.91.c m, including 2.75 g/t Au over 38.10 m with 6.31 g/t Au over 7.62 m and 3.89 g/t Au over 6.10 m; and,
CMD26-041: 3.26 g/t Au over 5.06m and 16.73 g/t Au over 2.20 m, including 29.91 g/t Au over 1.22 m.
Importantly, both reverse-circulation (“RC”) holes CMR26-152 and CMR26-153 ended in mineralization, providing clear opportunities to expand the system further at depth and along strike.
Assays are also pending from six additional Black Creek drill holes, including holes that intersected prospective hornfels and mafic dykes, features typically associated with higher-grade mineralization at Black Creek and other Reduced Intrusion Related Gold Systems (RIRGS).
The latest results build on Black Creek’s initial 2025 drilling, reported by the Company on January 29, 20261, which returned 4.50 g/t Au over 48.77 m, including 7.79 g/t Au over 24.38 m and 15.19 g/t Au over 6.10 m. Together, the recurring high-grade results, broad mineralized intervals, large exploration footprint and improving geological model strengthen Tectonic’s view that Black Creek has the potential to emerge as a second gold intrusive centre at Flat.
Tony Reda, Co-Founder, President & CEO of Tectonic Metals, commented:
“Our 2025 drilling established Black Creek as a compelling high-grade discovery. These 2026 results take it further, delivering multiple high-grade intercepts over meaningful widths with the system remaining open in all directions. Importantly, high-grade gold is now recurring across multiple holes and successive drill programs within the same prospective hornfelsed intrusion-margin setting. Together, these results are defining a coherent geological pattern and providing growing evidence of a potentially significant gold system.
“I have always believed that big gold systems leave big footprints. At Black Creek, drilling lies within a much larger, kilometre-scale convergence of gold-in-soil anomalies, geophysics, favourable geology and significant historical placer and lode gold production. We have tested only a small portion of that footprint, yet we are already seeing important indicators of grade and scale. Our next step is to further understand the geological controls, establish continuity and systematically test the scale of the system.
“Located six kilometres from Chicken Mountain, Black Creek is emerging as a potential second significant gold centre within Flat’s more than 20-kilometre-long volcano-plutonic complex. Its high-grade mineralization occurs in a different host rock than the monzonite-dominant mineralization at Chicken Mountain, demonstrating that gold at Flat is not confined to a single intrusion or geological setting. Black Creek is one of six kilometre-scale intrusion-related targets identified to date, collectively highlighting an opportunity that extends well beyond one potential deposit, one intrusion and one host rock.”
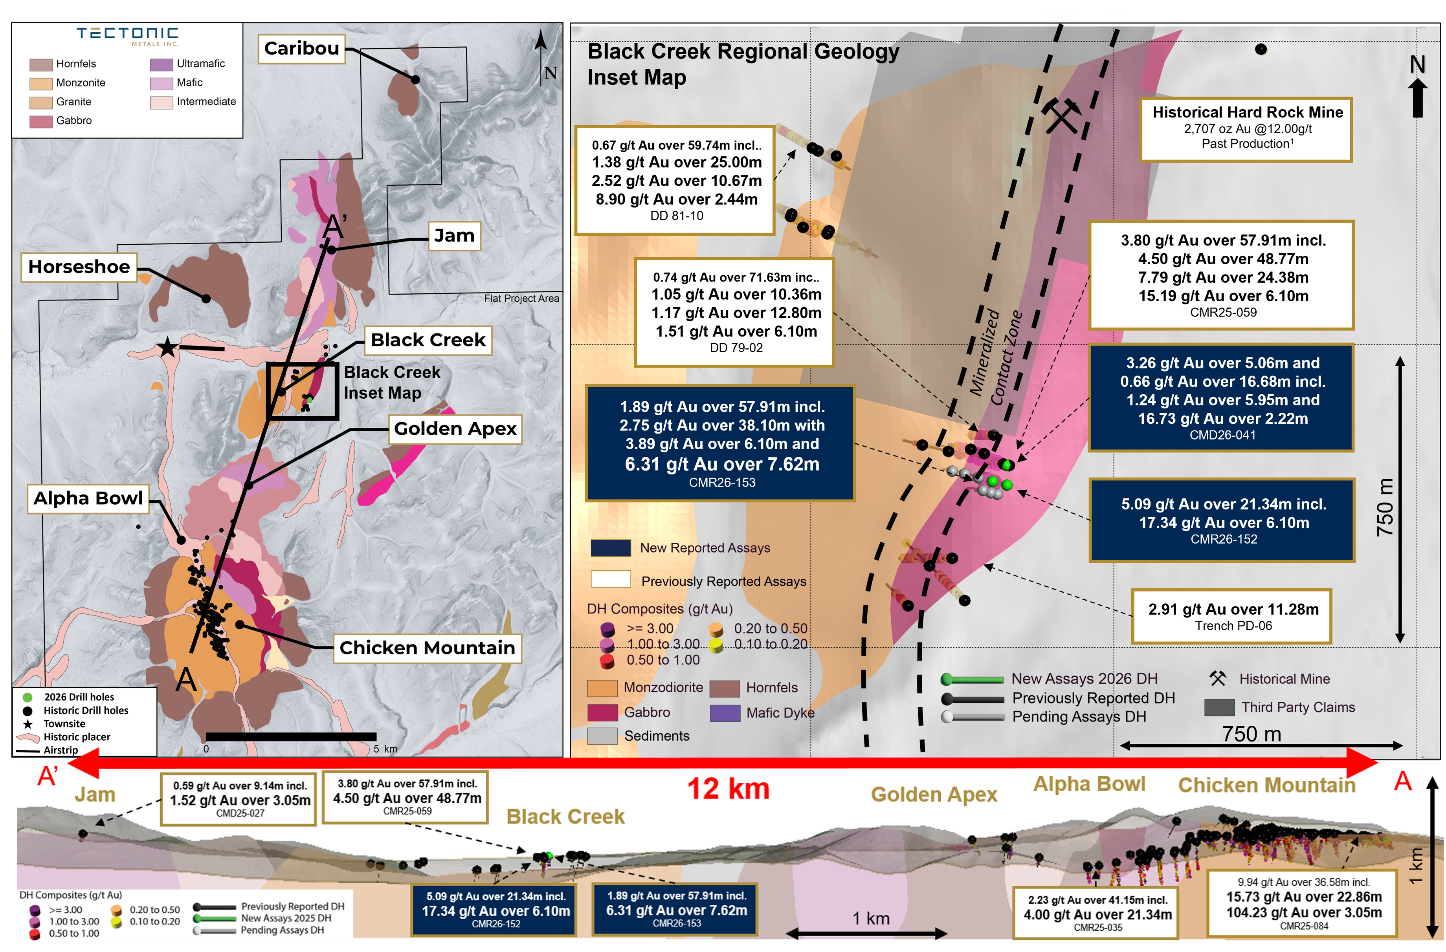
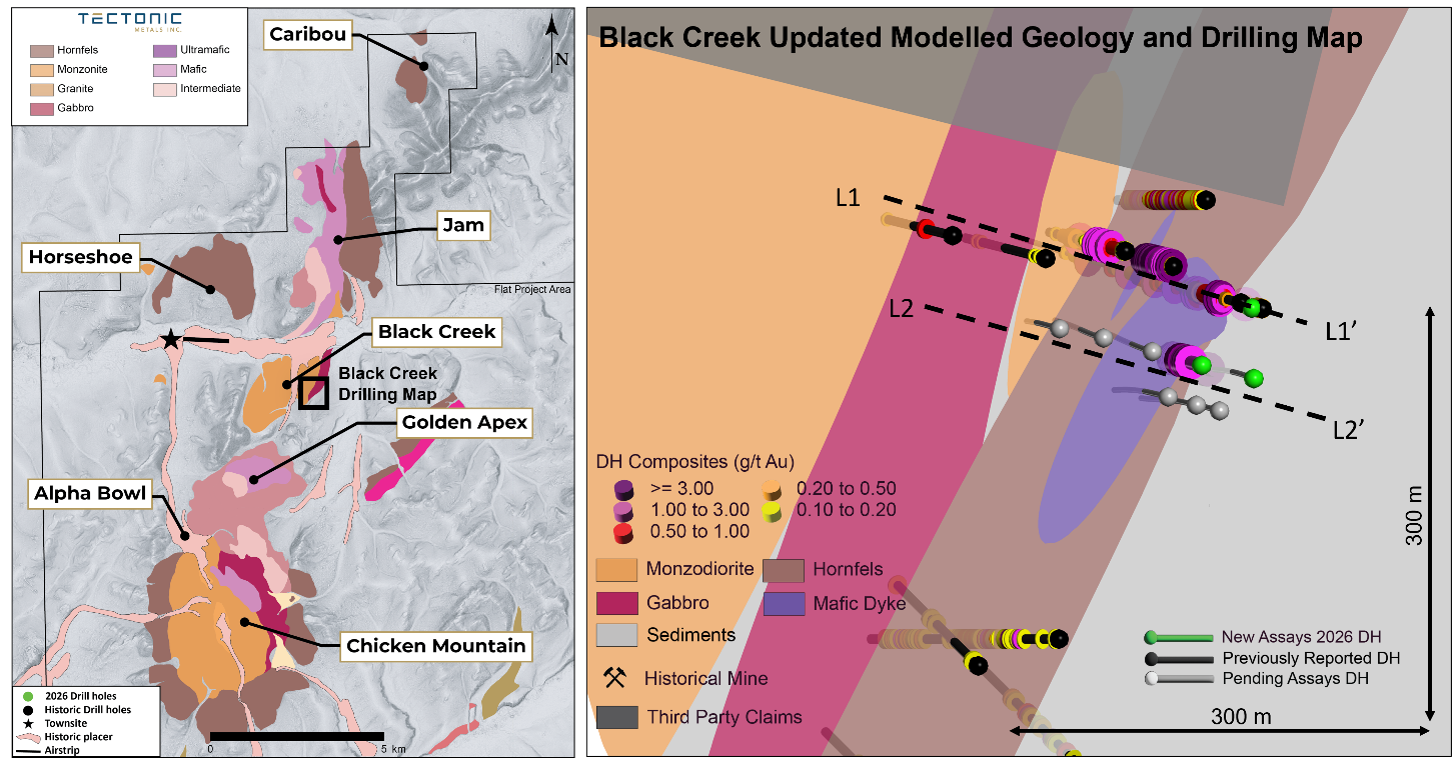
Figure 1: Simplified regional geology map of the Flat Gold Project, highlighting the Black Creek drilling area.
Black Creek: Building Evidence of a Second Gold Centre
Tectonic prioritized Black Creek for follow-up drilling in 2026 after its first-ever program at the target returned near-surface high-grade gold in hornfelsed sedimentary rock: 4.50 g/t Au over 48.77 m in hole CMR25-059, including 7.79 g/t Au over 24.38 m and 15.19 g/t Au over 6.10 m. The 2026 program was designed to test whether the 2025 drill discovery was part of a broader mineralized system.
The new drilling was successful in expanding the Black Creek system. High-grade gold has now been intersected in multiple holes and successive drill campaigns, with broad mineralized envelopes surrounding higher-grade internal intervals. Both 2026 RC holes ended in mineralization, and the deepest high-grade interval in diamond hole CMD26-041 occurs at approximately 202 m downhole, demonstrating gold mineralization through a substantial vertical range.
Broader mineralization of 0.39 g/t Au over 29.50 m, 0.66 g/t Au over 16.68 m and 0.41 g/t Au over 27.25 m was hosted in heavily fractured oxidized and non-oxidized hornfels and altered mafic dyke units with centimetre- to millimetre-scale quartz-to-quartz carbonate veining. Higher grade intervals, represented by 16.73 g/t Au over 2.22 m. were hosted within quartz-carbonate-stibnite veining. This newly intersected mineralization in the diamond drilling suggests that mineralization continues at depth from near-surface high-grade mineralization and remains open in all directions.
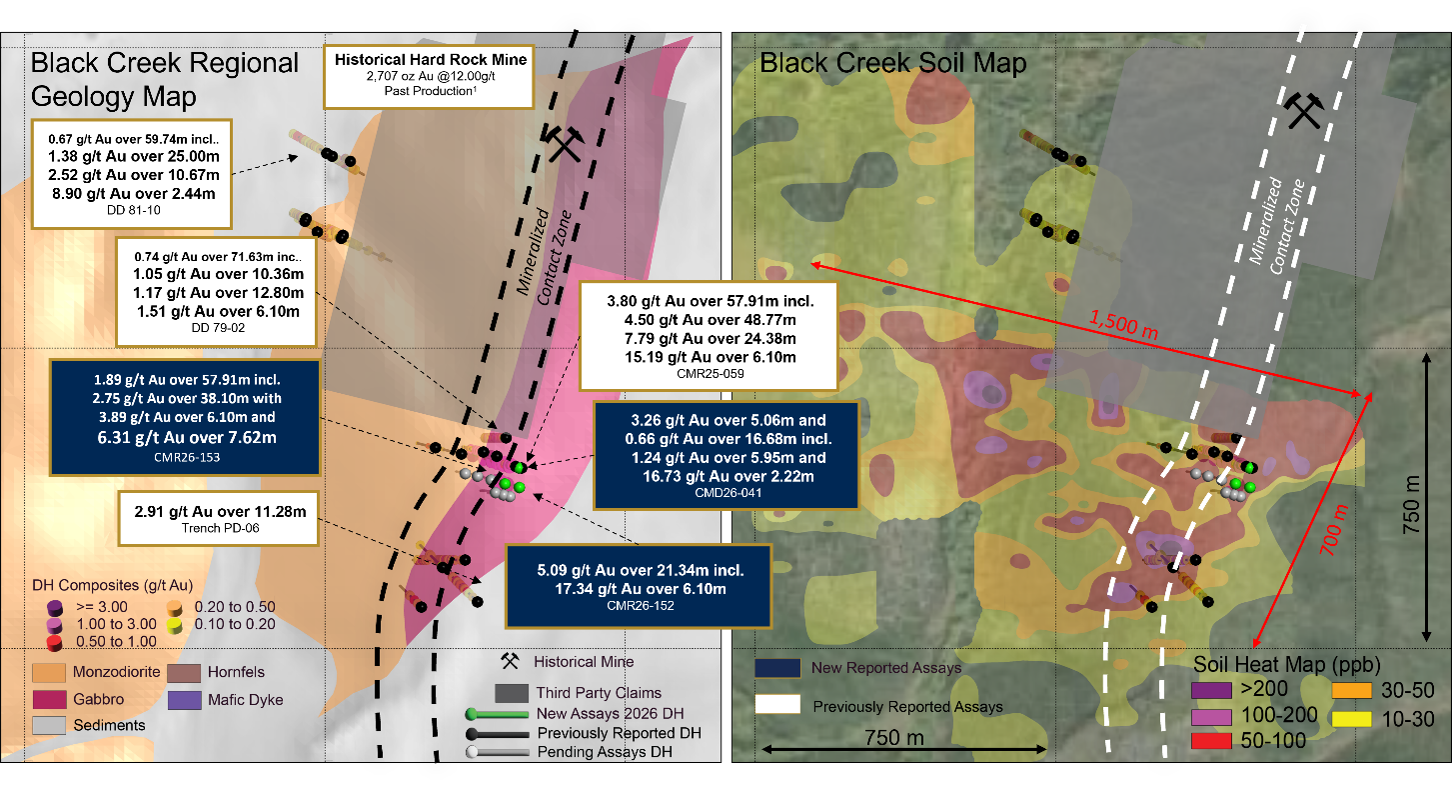
The Black Creek intrusion lies approximately six km northeast of Chicken Mountain within the more than 20-kilometre-long Flat volcano-plutonic complex. The target is supported by a 2.3 km by 1.5 km resistive electromagnetic anomaly and an approximately 1,500 m by 700 m gold-in-soil anomaly, providing a large exploration framework relative to the area tested by drilling to date.
The broader target area also has a substantial historical gold endowment and a long history of placer gold production, totalling approximately 450,000 ounces from Black Creek and upper Otter Creek. The historical hard rock mine at Black Creek reportedly produced approximately 2,707 ounces of gold at an average grade of 12.00 g/t Au between 1925 and 1938.2,
The convergence of historical gold production, kilometre-scale soil and electromagnetic anomalies, and repeat high-grade bedrock intercepts signals a compelling, multi-dataset exploration vector. Drilling has tested only a small portion of that broader footprint.
Figure 2: Black Creek regional geology, drilling area, and soil contour map, highlighting the mineralized corridors and the gold-in-soil anomaly
Drilling Refines the Geological Model at Black Creek and Other Regional Targets, Providing Clearer Vectors to Higher-Grade Gold
The 2026 program is materially improving Tectonic’s understanding of the lithological and structural controls on gold at Black Creek and providing a vectoring framework that may be applicable elsewhere across the Flat district.
Gold is hosted principally in altered and hornfelsed Kuskokwim Group clastic sedimentary rocks and is associated with quartz to quartz-carbonate-stibnite veining, oxidation, fracturing and mafic dykes. Higher-grade intervals occur within this broader mineralized hornfels package, locally near mapped or modelled mafic dykes.
This host setting is geologically important because hornfelsed sedimentary rocks occur along intrusion margins elsewhere at Flat, including Chicken Mountain, Golden Apex, Horseshoe, Jam and Caribou. As a result, Black Creek establishes a district-relevant exploration model in a host rock that significantly expands the prospective search space beyond intrusion-hosted mineralization alone.
Updated geologic modelling is integrating lithology, hornfels intensity, mafic dykes, intrusion contacts, veining and assay data. The emerging model will be used to test whether higher-grade shoots are controlled by intrusive contacts, dyke margins, structural permeability, or the intersection of these features. Oriented follow-up drilling is required to resolve geometry and true widths.
Figure 3: Updated geological model of the Black Creek Target Area, notably updated hornfels and mafic dyke units that have been observed and characterized to host higher-grade gold mineralization.
Maggie Layman, Vice President Exploration, commented:
“The 2026 drilling is providing an important step forward in our understanding of Black Creek. The association of mineralization with hornfels, mafic dykes and intrusion contacts is helping us refine our geological model and identify priority targets for follow-up drilling.
“With mineralization remaining open in multiple directions and additional assays pending, we see a strong opportunity to continue expanding and defining not only the Black Creek system but also to apply these geological insights to other priority targets across the Flat district.”
Multiple Catalysts Ahead
Tectonic is advancing Black Creek alongside Chicken Mountain and a portfolio of kilometre-scale intrusion-related targets as part of a systematic strategy to test the full district-scale potential of Flat. Near-term catalysts and exploration activities include:
Assays pending from six additional Black Creek drill holes, several of which intersected prospective hornfels and mafic dykes;
Follow-up drilling below CMR26-152 and CMR26-153 and along strike to test continuity, orientation and true width;
Integration of assay, structural, lithological and geophysical data into the three-dimensional geological model; and
Application of the emerging Black Creek targeting model to other intrusion-margin targets across the Flat district.
Additional assay results from Chicken Mountain are also expected as Tectonic continues expansion and resource-definition drilling toward a maiden mineral resource estimate targeted for early 2027.
Figure 4: Cross section L1-L1’ showing updated Mafic Dyke units and Hornfels, highlighting the higher-grade mineralization across the drilled section
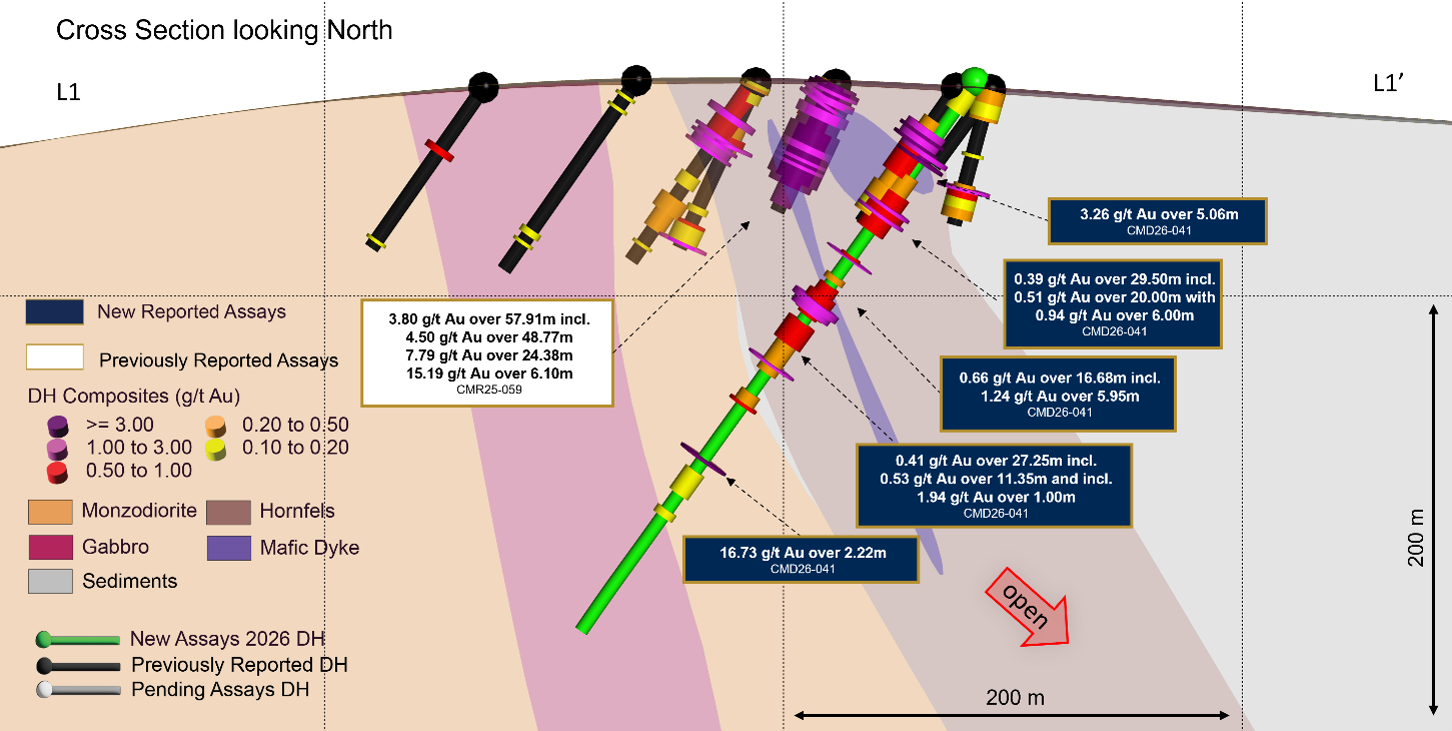
Figure 5: Cross section L2-L2’ showing updated geological model, highlighting the latest high-grade drill composites and holes with assays pending.
A summary of the assay results is presented in Table 1.
Table 1 – 2026 Black Creek Drill Assay Results
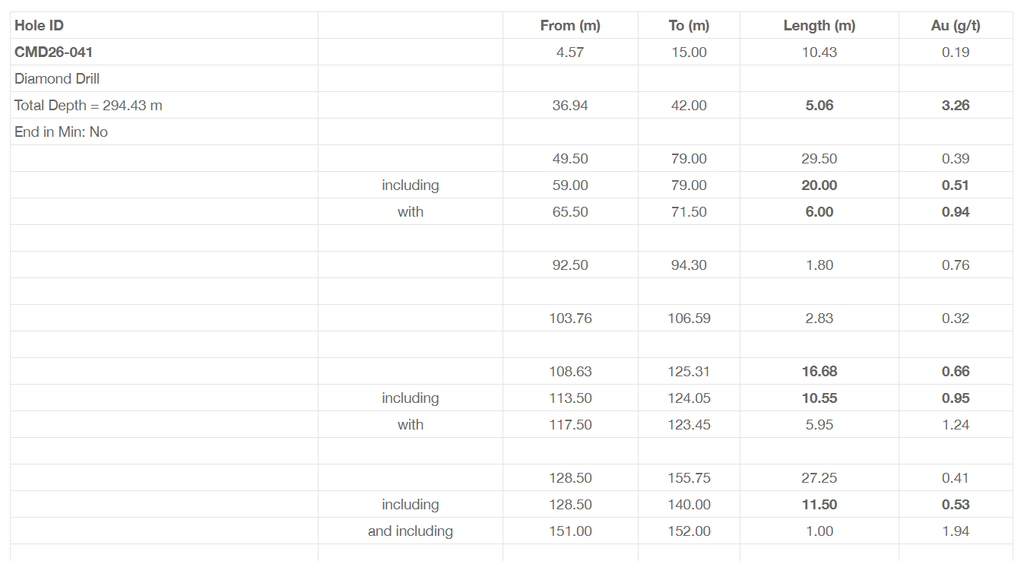
Note: All reported intercepts are downhole lengths, as insufficient data exist to determine true widths. Select composites utilize 0.10, 0.30 or 0.50 g/t Au cut-offs, with a maximum continuous interval of 3.20 m (two sample) below the applicable cut-off inclusion.
Table 2. Drill Hole Details at Black Creek

Qualified Person
Tectonic Metals’ disclosure of technical or scientific information in this press release has been reviewed, verified and approved by Peter Kleespies, M.Sc., P.Geo., Chief Geological Officer, who is a Qualified Person in accordance with Canadian regulatory requirements set out in National Instrument 43-101.
Analytical work for the 2026 Flat project drilling program was performed by ALS Global (“ALS”), an internationally recognized and accredited laboratory independent of Tectonic. On-site, core and reverse circulation samples were sealed in security-tagged bags and shipped under strict chain-of-custody protocols to the Lynden Transport logistics operator in Anchorage, Alaska, for delivery to ALS facilities in Vancouver, British Columbia.
Upon arrival at the laboratory, samples were dried, crushed to 2 mm and riffle split into nominal 500-gram subsample aliquots (prep codes CRU-31, SPL-32a). One portion was analyzed for gold using PhotonAssay™ (ALS code Au-PA01). PhotonAssay™ uses high-energy X-rays to determine gold content from a large sample aliquot, typically 500 g of crushed material. The method is non-destructive and is particularly suited to gold systems where larger sample aliquots may improve representativity. If additional nominal 500-gram PhotonAssayTM analysis splits are conducted for a given sample, results from all splits are combined on a weight average basis. A second portion was pulverized such that 85% of the sample passed 75 µm, (PUL-31) and was analyzed by four-acid digestion with ICP-MS finish for 48 elements (ME-MS61), along with aqua regia digestion with ICP-MS finish for trace levels of mercury (Hg-MS42).
Quality assurance and quality control (QA/QC) protocols included the insertion of certified reference material every 20 samples, blank samples at rate of approximately every 25 samples and field duplicate samples (split from the original approximately 1.5 m for RC or 1.5 m for core intervals) every 25 samples. All QA/QC results returned values within acceptable limits.
About Tectonic Metals Inc.
Tectonic Metals Inc. is a mineral exploration company led by an experienced and well-respected technical and financial team with a track record of wealth creation for shareholders. The Company is focused on exploring and developing its flagship Flat Gold Project in southwestern Alaska, covering 99,840 acres of predominantly Native-owned land belonging to Doyon, Ltd., a leading Alaska Native Regional Corporation and one of Tectonic’s largest shareholders. The current focus is on advancing the Chicken Mountain target, one of six multi-kilometre-scale intrusion zones at the Flat Gold Project, where drilling has achieved a 100% success rate across 191 holes to date.
Founded by key members of the Kaminak Gold team behind the discovery and advancement of the Coffee Gold Project, which was acquired by Goldcorp for $520 million in 2016, Tectonic brings a proven track record in exploration, project advancement, capital markets and value creation. Collectively, the team has helped identify more than 30 million ounces of gold, advanced 18 projects through to feasibility, permitted 20 projects, completed over $3 billion in mergers and acquisitions and raised more than $2 billion in capital.
Tectonic ’s mission is to be a shift in the game: working for our shareholders and the communities where we operate, putting people first, playing big and staying true to our word every step of the way.
On behalf of Tectonic Metals Inc.,
Tony Reda President and Chief Executive Officer
For further information about Tectonic Metals Inc. or this news release, please visit our website at www.tectonicmetals.com or contact:
Cautionary Note Regarding Forward-Looking Statements, Historical Information and Visual Observations
This news release contains “forward-looking statements” and “forward-looking information” (collectively, “forward-looking statements”) within the meaning of applicable Canadian securities laws. All statements herein that are not statements of historical fact may be deemed to be forward-looking statements. Forward-looking statements are often, but not always, identified by words such as “may,” “will,” “should,” “anticipate,” “believe,” “expect,” “intend,” “plan,” “estimate,” “potential,” “target,” or similar terminology, or that events or conditions “may” or “will” occur.
Forward-looking statements in this release include, but are not limited to, statements regarding: the potential for mineralization at Tectonic’s projects; the nature, scope, and timing of future exploration activities; the interpretation of geological observations; the possible size or scale of mineralized systems; the receipt of regulatory approvals, and the anticipated benefits of current and future exploration programs.
This release also refers to historical information, including results from past exploration activities and placer production figures. Such historical information has not been independently verified by Tectonic, may not be reliable, and should not be relied upon as current, NI 43-101 compliant data.
In addition, this release contains, detailed geological notes, and descriptive observations such as alteration styles, mineralogy and visible gold. These observations are preliminary in nature, may not be representative of the entire interval or system, and should not be relied upon as a guarantee of mineralized assay results or as the basis for any investment decision. Investors and readers are cautioned that visual estimates, core photographs, and geological descriptions are not substitutes for laboratory assay results and do not demonstrate the economic viability of any mineral deposit.
Forward-looking statements are not guarantees of future performance. They are based on a number of assumptions made as of the date such statements are provided, including, among others: assumptions regarding future gold and other metal prices; currency exchange and interest rates; favourable operating and political conditions; timely receipt of permits and regulatory approvals; availability of labour, equipment, and services; stability of financial and capital markets; availability of financing on acceptable terms; accuracy of exploration data and geological models; and the ability to successfully advance planned exploration programs. Many of these assumptions are beyond the control of Tectonic and may prove to be incorrect.
Forward-looking statements are subject to known and unknown risks, uncertainties, and other factors that may cause actual results, performance, or achievements to differ materially from those expressed or implied. These risks include, without limitation: risks inherent to mineral exploration and development; volatility of commodity prices; changes in laws, regulations, and policies; delays or inability to obtain required approvals and permits; availability of financing; general economic, political, and market conditions; labour disputes and shortages; equipment and supply risks; environmental and social risks; competition; inaccuracies in exploration results or geological interpretations; and other risks detailed from time to time in the Company’s continuous disclosure filings.
Although management believes the expectations expressed in such forward-looking statements are reasonable as of the date made, there can be no assurance they will prove to be correct. Readers are cautioned not to place undue reliance on forward-looking statements, historical information, or preliminary visual geological observations. Actual results and future events may differ materially from those anticipated. All forward-looking statements contained in this news release are expressly qualified by this cautionary statement. Tectonic disclaims any intention or obligation to update or revise forward-looking statements, whether as a result of new information, future events, or otherwise, except as required by applicable securities laws.
Neither the TSX Venture Exchange nor its Regulation Services Provider (as that term is defined in the policies of the TSX Venture Exchange) accepts responsibility for the adequacy or accuracy of this release.

Fourth Quarter of Fiscal Year 2026 – Consolidated Earnings Highlights
Revenue of $321.7 million
Net loss of $(16.8) million
Adjusted EBITDA* of $11.9 million
Fiscal Year 2027 Guidance Ranges:
Revenue expected in a range of $1.35 billion to $1.45 billion
Adjusted EBITDA* expected in a range of $90 million to $115 million
Operating Cash Flow expected to be more than $60 million
Fourth Quarter Fiscal Year 2026 – Segment Highlights
Senior
Revenue of $72.5 million
Adjusted EBITDA of $8.0 million
Approved Medicare Advantage policies of 72,180
Healthcare Services
Revenue of $193.5 million
Adjusted EBITDA of $12.1 million
109,039 SelectRx members
Life
Revenue of $47.9 million
Adjusted EBITDA of $9.8 million
OVERLAND PARK, Kan.–(BUSINESS WIRE)– SelectQuote, Inc. (NYSE: SLQT) reported consolidated revenue for the fourth quarter of fiscal year 2026 of $321.7 million compared to consolidated revenue for the fourth quarter of fiscal year 2025 of $345.1 million. Consolidated net loss for the fourth quarter of fiscal year 2026 was $16.8 million compared to consolidated net income for the fourth quarter of fiscal year 2025 of $12.9 million. Consolidated Adjusted EBITDA* for the fourth quarter of fiscal year 2026 was $11.9 million compared to consolidated Adjusted EBITDA* for the fourth quarter of fiscal year 2025 of $2.7 million. Consolidated cash used in operations during the fourth quarter of fiscal year 2026 was $3.3 million compared to $37.5 million used during the fourth quarter of fiscal year 2025.
SelectQuote reported consolidated revenue for the fiscal year 2026 of $1.6 billion compared to consolidated revenue for fiscal year 2025 of $1.5 billion. Consolidated net income for the fiscal year 2026 was $62.2 million compared to consolidated net income for fiscal year 2025 of $47.6 million. Consolidated Adjusted EBITDA* for the fiscal year 2026 was $109.1 million compared to consolidated Adjusted EBITDA* for the fiscal year 2025 of $126.3 million. Consolidated cash generated from operations was $31.9 million for the fiscal year 2026 compared to consolidated cash used in operations of $11.7 million during the fiscal year 2025. For the fiscal year 2026, SelectQuote improved operating cash flow by $44 million compared to fiscal 2025, driven largely by the scale in Healthcare Services and improved operating efficiency across SelectQuote.
SelectQuote Chief Executive Officer Tim Danker commented, “It was a highly successful 4th quarter and full-year fiscal 2026 for our business. Our Senior Medicare Advantage distribution business excelled through another turbulent year for the industry. Insurance carriers continued to modify policy benefits and optimize volumes but through it all, SelectQuote remained the reliable partner of choice. SelectQuote’s Senior business delivered another strong year with an Adjusted EBITDA margin of 26%, which marks the 4th consecutive year with margins solidly above our long-term 20%+ operating target. We have high confidence in our Senior platform’s ability to generate durable returns across a range of Medicare Advantage environments and view fiscal 2027 as an important year to further compound cash flow while remaining disciplined in our growth investments as carrier profitability improves.”
* See “Non-GAAP Financial Measures” below.
“We also increasingly realized our goal to scale Healthcare Services profitability and cash flow through our SelectRx business. We are excited to exit fiscal 2026 with run-rate Adjusted EBITDA of nearly $50 million, which will increasingly drive operating cash flow and ultimately accrue value to our shareholders.”
Mr. Danker continued, “Looking to fiscal 2027, we have conviction that the $44 million improvement in operating cash flow in fiscal 2026 will continue. As we have emphasized, our highest strategic priority is to deliver shareholder value through growth in profitability and scaled cash flow. In the year ahead, we plan to accelerate equity value accretion in multiple ways. Exiting 2026, we have successfully implemented technology-enabled workstream efficiencies that we expect will drive annual expense savings of over $30 million. Paired with the demonstrated durability of our Senior profitability and continued scale of Healthcare Services, we expect full-year 2027 operating cash flow to approximately double to over $60 million, with free cash flow generation of around $50 million. Best of all, we see opportunity to compound cash flow growth in the future through continued optimization of our leverage and funding costs, and we are excited to deliver this value to our shareholders in the years ahead.”
Segment Results
We currently have three reportable segments: 1) Senior, 2) Healthcare Services and 3) Life. The performance measures of the segments include total revenue and adjusted EBITDA. Costs of commissions and other services revenue, cost of goods sold-pharmacy revenue, marketing and advertising, selling, general, and administrative, and technical development operating expenses that are directly attributable to a segment are reported within the applicable segment. Indirect costs of revenue, marketing and advertising, selling, general, and administrative, and technical development operating expenses are allocated to each segment based on varying metrics such as headcount.
Senior
Financial Results
The following table provides the financial results for the Senior segment for the periods presented:
Operating Metrics
Submitted Policies
Submitted policies are counted when an individual completes an application with our licensed agent and provides authorization to the agent to submit the application to the insurance carrier partner. The applicant may have additional actions to take before the application will be reviewed by the insurance carrier.
The following table shows the number of submitted policies for the periods presented:
Approved Policies
Approved policies represents the number of submitted policies that were approved by our insurance carrier partners for the identified product during the indicated period. Not all approved policies will go in force.
The following table shows the number of approved policies for the periods presented:
Lifetime Value of Commissions per Approved Policy
Lifetime value of commissions per approved policy represents commissions estimated to be collected over the estimated life of an approved policy based on multiple factors, including but not limited to, contracted commission rates, carrier mix and expected policy persistency with applied constraints. The lifetime value of commissions per approved policy is equal to the sum of the commission revenue due upon the initial sale of a policy, and when applicable, an estimate of future renewal commissions.
The following table shows the lifetime value of commissions per approved policy for the periods presented:
Healthcare Services
Financial Results
The following table provides the financial results for the Healthcare Services segment for the periods presented:
Operating Metrics
Members
The total number of SelectRx members represents the amount of active customers to which an order has been shipped and the prescriptions per day represents the total average prescriptions shipped per business day. These two metrics are the primary drivers of revenue for Healthcare Services.
The following table shows the total number of SelectRx members as of the periods presented:
The total number of SelectRx members increased by 1% as of June 30, 2026, compared to June 30, 2025, due to a growth in membership during the AEP season.
The following table shows the average prescriptions shipped per day for the periods presented:
Combined Senior and Healthcare Services – Consumer Per Unit Economics
Combined Senior and Healthcare Services consumer per unit economics represents total MA and MS commissions; other product commissions; other revenues, including revenues from Healthcare Services; and operating expenses associated with Senior and Healthcare Services, each shown per number of approved MA and MS policies over a given time period. Management assesses the business on a per-unit basis to help ensure that the revenue opportunity associated with a successful policy sale is attractive relative to the marketing acquisition cost. Because not all acquired leads result in a successful policy sale, all per-policy metrics are based on approved policies, which is the measure that triggers revenue recognition.
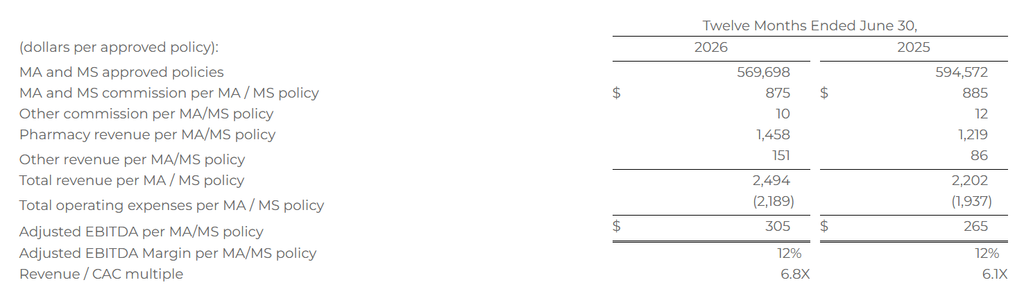
The MA and MS commission per MA/MS policy represents the LTV for policies sold in the period. Other commission per MA/MS policy represents the LTV for other products sold in the period, including DVH prescription drug plan, and other products, which management views as additional commission revenue on our agents’ core function of MA/MS policy sales. Pharmacy revenue per MA/MS policy represents revenue from SelectRx, and other revenue per MA/MS policy represents revenue from Healthcare Select, production bonuses, marketing development funds, lead generation revenue, and adjustments from the Company’s reassessment of its cohorts’ transaction prices. Total operating expenses per MA/MS policy represents all of the operating expenses within Senior and Healthcare Services. The revenue to customer acquisition cost (“CAC”) multiple represents total revenue as a multiple of total marketing acquisition cost, which represents the direct costs of acquiring leads. These costs are included in marketing and advertising expense within the total operating expenses per MA/MS policy.
The following table shows combined Senior and Healthcare Services consumer per unit economics for the periods presented. Based on the seasonality of Senior and the fluctuations between quarters, we believe that the most relevant view of per unit economics is on a rolling 12-month basis. All per MA/MS policy metrics below are based on the sum of approved MA/MS policies, as both products have similar commission profiles.
Total revenue per MA/MS policy increased 13% for the twelve months ended June 30, 2026, compared to the twelve months ended June 30, 2025, primarily due to the increase in pharmacy revenue. Total operating expenses per MA/MS policy increased 13% for the twelve months ended June 30, 2026, compared to the twelve months ended June 30, 2025, driven by an increase in cost of goods sold-pharmacy revenue for Healthcare Services due to the growth of the business.
Life
Financial Results
The following table provides the financial results for the Life segment for the periods presented:
Operating Metrics
Life premium represents the total premium value for all policies that were approved by the relevant insurance carrier partner and for which the policy document was sent to the policyholder and payment information was received by the relevant insurance carrier partner during the indicated period. Because our commissions are earned based on a percentage of total premium, total premium volume for a given period is the key driver of revenue for our Life segment.
The following table shows term and final expense premiums for the periods presented:
For those interested in dialing into the conference call, please register using this link: https://events.q4inc.com/analyst/890240794?pwd=z46TrijY. After registering, a confirmation will be sent via email, including dial-in details and unique conference call codes for entry. Registration is open through the live call, but to ensure you are connected for the full call we suggest registering at least 10 minutes before the start of the call.
Non-GAAP Financial Measures
This release includes certain non-GAAP financial measures intended to supplement, not substitute for, comparable GAAP measures. To supplement our financial statements presented in accordance with GAAP and to provide investors with additional information regarding our GAAP financial results, we have presented in this release Adjusted EBITDA, which, when presented on a consolidated basis, is a non-GAAP financial measure. This non-GAAP financial measure is not based on any standardized methodology prescribed by GAAP and is not necessarily comparable to any similarly titled measure presented by other companies. We define Adjusted EBITDA as net income plus interest expense, income taxes, depreciation and amortization, changes in fair value of warrant liabilities, loss on extinguishment of debt, and certain add-backs for non-cash or non-recurring expenses, including restructuring and share-based compensation expenses. The most directly comparable GAAP measure is net income. We monitor and have presented in this release Adjusted EBITDA because it is a key measure used by our management and Board of Directors to understand and evaluate our operating performance, establish budgets, and develop operational goals for managing our business. In particular, we believe that excluding the impact of these expenses in calculating Adjusted EBITDA can provide a useful measure for period-to-period comparisons of our core operating performance.
A reconciliation of the differences between Adjusted EBITDA and its most directly comparable GAAP measure, net income, is presented below on page 13. The Company is unable to provide a quantitative reconciliation of forward-looking Adjusted EBITDA to its most directly comparable GAAP measure without unreasonable effort because it is not possible to predict certain information included in the calculation of such GAAP measure, including the fair value of outstanding warrants to purchase shares of the Company’s common stock. The unavailable information could have a significant impact on the Company’s GAAP financial results.
Forward Looking Statements
This release contains forward-looking statements. These forward-looking statements reflect our current views with respect to, among other things, future events and our financial performance. These statements are often, but not always, made through the use of words or phrases such as “may,” “should,” “could,” “predict,” “potential,” “believe,” “will likely result,” “expect,” “continue,” “will,” “anticipate,” “seek,” “estimate,” “intend,” “plan,” “projection,” “would” and “outlook,” or the negative version of those words or other comparable words or phrases of a future or forward-looking nature. These forward-looking statements are not historical facts, and are based on current expectations, estimates and projections about our industry, management’s beliefs and certain assumptions made by management, many of which, by their nature, are inherently uncertain and beyond our control. Accordingly, we caution you that any such forward-looking statements are not guarantees of future performance and are subject to risks, assumptions and uncertainties that are difficult to predict. Although we believe that the expectations reflected in these forward-looking statements are reasonable as of the date made, actual results may prove to be materially different from the results expressed or implied by the forward-looking statements. There are or will be important factors that could cause our actual results to differ materially from those indicated in these forward-looking statements, including, but not limited to, the following: our reliance on a limited number of insurance carrier partners and any potential termination of those relationships or failure to develop new relationships; existing and future laws and regulations affecting the health insurance market; changes in health insurance products offered by our insurance carrier partners and the health insurance market generally; insurance carriers offering products and services directly to consumers; changes to commissions paid by insurance carriers and underwriting practices; competition with brokers, exclusively online brokers and carriers who opt to sell policies directly to consumers; competition from government-run health insurance exchanges; developments in the U.S. health insurance system; our dependence on revenue from carriers in our senior segment and downturns in the senior health as well as life, automotive and home insurance industries; our ability to develop new offerings and penetrate new vertical markets; risks from third-party products; failure to enroll individuals during the Medicare annual enrollment period; our ability to attract, integrate and retain qualified personnel; our dependence on lead providers and ability to compete for leads; failure to obtain and/or convert sales leads to actual sales of insurance policies; access to data from consumers and insurance carriers; accuracy of information provided from and to consumers during the insurance shopping process; cost-effective advertisement through internet search engines; ability to contact consumers and market products by telephone; global economic conditions, including inflation; disruption to operations as a result of future acquisitions; significant estimates and assumptions in the preparation of our financial statements; impairment of goodwill; potential litigation and other legal proceedings or inquiries; our existing and future indebtedness; our ability to maintain compliance with our debt covenants; access to additional capital; our ability to regain and maintain compliance with NYSE listing standards; failure to protect our intellectual property and our brand; fluctuations in our financial results caused by seasonality; accuracy and timeliness of commissions reports from insurance carriers; timing of insurance carriers’ approval and payment practices; factors that impact our estimate of the constrained lifetime value of commissions per policyholder; changes in accounting rules, tax legislation and other legislation; disruptions or failures of our technological infrastructure and platform; failure to maintain relationships with third-party service providers; cybersecurity breaches or other attacks involving our systems or those of our insurance carrier partners or third-party service providers; our ability to protect consumer information and other data; failure to market and sell Medicare plans effectively or in compliance with laws; and other factors related to our pharmacy business, including manufacturing or supply chain disruptions, access to and demand for prescription drugs, changes in reimbursement rates under our contracts with pharmacy benefit managers, and regulatory changes or other industry developments that may affect our pharmacy operations. For a further discussion of these and other risk factors that could impact our future results and performance, see the section entitled “Risk Factors” in the most recent Annual Report on Form 10-K (the “Annual Report”) and subsequent periodic reports filed by us with the Securities and Exchange Commission. Accordingly, you should not place undue reliance on any such forward-looking statements. Any forward-looking statement speaks only as of the date on which it is made, and, except as otherwise required by law, we do not undertake any obligation to publicly update or review any forward-looking statement, whether as a result of new information, future developments or otherwise.
About SelectQuote:
Founded in 1985, SelectQuote (NYSE: SLQT) pioneered the model of providing unbiased comparisons from multiple, highly-rated insurance companies, allowing consumers to choose the policy and terms that best meet their unique needs. Two foundational pillars underpin SelectQuote’s success: a strong force of highly-trained and skilled agents who provide a consultative needs analysis for every consumer, and proprietary technology that sources and routes high-quality leads. Today, the Company operates an ecosystem offering high touchpoints for consumers across insurance, pharmacy, and virtual care.
With an ecosystem offering engagement points for consumers across insurance, Medicare, pharmacy, and value-based care, the company now has three core business lines: SelectQuote Senior, SelectQuote Healthcare Services, and SelectQuote Life. SelectQuote Senior serves the needs of a demographic that sees around 10,000 people turn 65 each day with a range of Medicare Advantage and Medicare Supplement plans. SelectQuote Healthcare Services is comprised of the SelectRx Pharmacy, a Patient-Centered Pharmacy Home™ (PCPH) accredited pharmacy, SelectPatient Management, a provider of chronic care management services, and Healthcare Select which proactively connects consumers with a wide breadth of healthcare services supporting their needs.
Mark Reichman, Managing Director, Equity Research Analyst, Natural Resources, Noble Capital Markets, Inc.
Refer to the full report for the price target, fundamental analysis, and rating.
Golden Gate South Discovery. Resolution Minerals confirmed a significant near-surface gold discovery at Golden Gate South within its 100%-owned Horse Heaven Antimony-Tungsten-Gold-Silver Project in Idaho. All three initial 2026 diamond holes intersected broad gold mineralization, extending the known mineralized system at least 2,000 meters south from Golden Gate North. The results, combined with gold-in-soil anomalies between the two areas, strengthen the potential that Golden Gate North and South are part of a much larger mineralized system along the Golden Gate Fault Zone.
Broad Gold Intercepts. The most significant hole, HH-GG26-003C, returned 305.7 meters grading 0.64 g/t gold from surface to the end of the hole, including several higher-grade zones of up to 17.25 meters at 1.19 g/t gold. The other two holes also encountered broad near-surface mineralization, including 87.87 meters at 0.52 g/t and 49.5 meters at 0.58 g/t gold. Collectively, the results are important because they demonstrate substantial widths of pervasive gold mineralization rather than isolated narrow intercepts, although additional drilling is required to establish true widths, continuity, and ultimately the potential size of the system.
Equity Research is available at no cost to Registered users of Channelchek. Not a Member? Click ‘Join’ to join the Channelchek Community. There is no cost to register, and we never collect credit card information.
This Research is provided by Noble Capital Markets, Inc., a FINRA and S.E.C. registered broker-dealer (B/D).
*Analyst certification and important disclosures included in the full report. NOTE: investment decisions should not be based upon the content of this research summary. Proper due diligence is required before making any investment decision.
Mark Reichman, Managing Director, Equity Research Analyst, Natural Resources, Noble Capital Markets, Inc.
Refer to the full report for the price target, fundamental analysis, and rating.
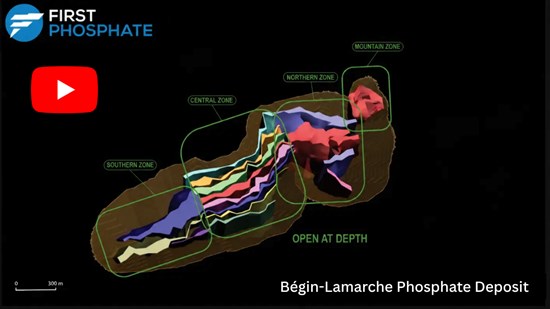
A stronger resource supports the transition to feasibility. First Phosphate’s definitive NI 43-101 report confirms approximately 204.7 million tonnes of measured and indicated resources grading roughly 6.05% phosphorus pentoxide (P2O5), including a 378% increase in indicated resources. Strong geological continuity, favorable metallurgy, and additional expansion potential at depth provide a stronger foundation for the Begin-Lamarche feasibility study.
The focus is shifting toward project development. With resource drilling mostly completed, First Phosphate is targeting completion of the feasibility study around January or February 2027, followed by permitting, financing, and a potential final investment decision. Development risk is further reduced by definitive offtake agreements, Canadian government funding, and potential international financing support.
Equity Research is available at no cost to Registered users of Channelchek. Not a Member? Click ‘Join’ to join the Channelchek Community. There is no cost to register, and we never collect credit card information.
This Research is provided by Noble Capital Markets, Inc., a FINRA and S.E.C. registered broker-dealer (B/D).
*Analyst certification and important disclosures included in the full report. NOTE: investment decisions should not be based upon the content of this research summary. Proper due diligence is required before making any investment decision.
OpenAI announced that its new custom AI chip, called Jalapeno, outperformed Nvidia’s current-generation GB300 processor in internal testing, marking a notable milestone in the ChatGPT maker’s push to build its own AI infrastructure rather than relying entirely on outside chip suppliers. In benchmark testing, Jalapeno led in two specific categories, the amount of AI work it could process per unit of power consumed, and the speed at which it returned responses, according to OpenAI’s chip chief, who discussed the results in an interview and presented them publicly at the Hot Chips conference at Stanford University.
Jalapeno was developed in partnership with Broadcom, which builds custom chips for a range of major technology clients, and the two companies have touted the unusually short development timeline that brought the chip from concept to testing. OpenAI plans to begin using the chips to support its AI models later this year, running the low-voltage, 700-watt processor specifically to reduce power costs across its rapidly expanding data center footprint, power representing one of the largest ongoing expenses in operating AI infrastructure at scale.
Several important caveats temper how much weight investors should place on this result. Jalapeno was not tested against Nvidia’s newest chip generation, Vera Rubin, which only recently began shipping and represents Nvidia’s current cutting edge rather than its prior-generation GB300. Jalapeno is also not designed to train AI models at all, an area where Nvidia’s technology remains dominant. Instead, Jalapeno is built specifically for inference, the process of running an already-trained model to generate responses and complete tasks, a narrower but still commercially significant slice of the overall AI compute market.
OpenAI’s own chip chief was notably candid about the limits of this milestone, describing Nvidia as a genuinely strong partner that OpenAI will continue to rely on heavily going forward, a reminder that this announcement reflects supplier diversification rather than any intention to replace Nvidia outright. That diversification effort is broader than just Jalapeno. OpenAI already uses chips from Cerebras Systems for some of its smaller models, a company whose own record-breaking Nasdaq debut we covered earlier this summer, though OpenAI’s chip chief noted that architecture is best suited to smaller models, while Jalapeno is designed to handle considerably larger ones. Beyond Jalapeno, competing custom chip startups are pursuing similar goals, including Etched, which recently raised funding at a $21 billion valuation, and MatX, founded by former members of Google’s internal silicon design team.
For investors tracking the AI infrastructure ecosystem, this development is best understood as confirmation of a trend already well underway rather than a singular disruption. Every major AI company, from Google’s long-running TPU program to Amazon’s Trainium chips to Microsoft’s own custom silicon efforts, is pursuing some version of reduced dependency on any single chip supplier, and OpenAI’s Jalapeno simply extends that pattern to the company sitting at the center of the current AI boom. That dynamic creates real, sustained demand for the broader ecosystem of smaller specialized companies supporting custom chip development, including semiconductor design and IP licensing firms, advanced packaging providers, and specialized testing and validation companies that benefit regardless of which individual chip architecture ultimately wins the most market share.
Nvidia’s stock showed little reaction to the news, a reasonable response given the caveats involved. But the steady, accelerating march toward diversified AI chip supply chains remains one of the more durable structural themes shaping opportunity across the smaller companies that make up that supply chain.
Tesla will unveil the production version of its Cybercab at a launch event in Austin on September 3, according to invitations that surfaced among Tesla watchers over the weekend and were subsequently confirmed by outlets covering the electric vehicle industry. The vehicle itself is notable for what it lacks: no steering wheel, no pedals, a two-seat design built entirely around autonomy rather than adapted from an existing model. It represents Tesla’s first vehicle engineered purely to run on the company’s Full Self-Driving software as part of the robotaxi fleet the company launched in Austin last year using modified Model Ys.
Tesla shares were little changed on the unofficial confirmation, but the muted stock reaction understates just how much is actually riding on this vehicle’s success. Tesla’s current valuation carries a meaningful premium built on the assumption that the company can convert its robotaxi ambitions into an autonomous ride-hailing network at scale, in addition to selling Full Self-Driving subscriptions to private owners at software-like profit margins rather than traditional auto manufacturing margins. The Cybercab is the physical product meant to prove that thesis works.
A Competitive Landscape Just Got Clearer
The timing is notable for a second reason. Last week, the Nevada Transportation Authority unanimously approved permits clearing Tesla, Alphabet’s Waymo, and Uber to operate commercial robotaxis in Clark County, home to Las Vegas, authorizing up to 8,000 driverless vehicles over the next twelve months. Tesla secured the largest allocation at roughly 5,000 vehicles, though the company’s Cybercab chief engineer told regulators Tesla expects to actually field closer to 2,500 within the year, noting the 5,000 figure has always represented a ceiling rather than a target. Waymo, widely viewed as the current leader in autonomous ride-hailing, was cleared for up to 1,000 vehicles, while Uber secured roughly 1,100 combined through partnerships with Hyundai-backed Motional and Amazon’s Zoox unit.
That approval gives investors a genuinely useful, apples-to-apples comparison point across three major public companies, Tesla, Alphabet, and Uber, all racing toward commercial autonomous ride-hailing in the same market simultaneously. Local taxi and livery operators have already pushed back, warning of oversaturation and congestion risk, and Tesla still faces the harder task of proving to regulators and the public that a Cybercab can operate safely with genuinely no one in the driver’s seat, not just in a permitted market but at the commercial scale its valuation assumes.
For investors tracking the broader market beyond Tesla itself, this launch and the accompanying Nevada approval illustrate something worth watching closely: autonomous vehicle technology is no longer a distant, speculative theme confined to a single company’s investor presentations. It is now a live, permitted, multi-company competitive race playing out in real regulatory jurisdictions, with real vehicle counts attached. That shift creates downstream implications for smaller companies supplying the sensors, lidar systems, mapping software, and specialized components that every one of these robotaxi fleets, regardless of which company ultimately wins market share, will need in growing volume as commercial deployment expands beyond pilot markets like Austin and Las Vegas into additional cities over the coming years.
Gold and silver are having a genuinely remarkable stretch. Gold prices are up roughly 15% this month while silver has surged 19%, and combined, the two metals have added nearly $5 trillion in market value in just a few weeks, according to analysis from Bull Theory. Both remain below the record highs set earlier this year, but the pace of the move is striking, and the drivers behind it will look familiar if you’ve been following ChannelChek’s coverage this month.
A major catalyst for the late-August breakout traces directly back to the US Treasury’s decision to double its long-term bond buyback program to $4 billion per session, the same intervention we detailed when it first sent Treasury yields tumbling and lifted Bitcoin sharply higher. That move has triggered an aggressive wave of short covering and speculative buying across precious metals markets as well. Layered on top of that, the unresolved and escalating war between the US and Iran, which has pushed energy prices higher again in a story we covered just this past week, has reinforced gold’s role as the market’s primary safe-haven asset during periods of genuine geopolitical stress.
Silver Has a Story of Its Own
What makes silver’s outperformance particularly interesting is that it isn’t just riding gold’s coattails. The metal is facing a genuine physical supply deficit, compounded by industrial demand that has nothing to do with safe-haven positioning. Long-term structural consumption from AI data center infrastructure, electrical grid modernization, and advanced electronics, precisely the buildout we detailed in our recent look at the US data center construction boom, continues to absorb physical silver inventory faster than global mine production can keep pace. That is a demand story layered directly on top of a macro story, which helps explain why silver has outpaced gold’s already impressive move.
Truist’s chief investment officer recently upgraded his own outlook on gold from underweight back to neutral, citing several supporting factors: real yields have stopped climbing, partly because of the Treasury’s own buyback decision, gold has reclaimed its 200-day moving average in a positive technical signal, central banks continue adding to their gold reserves despite earlier concerns that demand might slow, and a softer US dollar, driven by cooling inflation data and a more dovish Fed posture, has provided an additional tailwind. He noted that with gold still roughly 15% below its recent highs, the overall weight of evidence now supports a more balanced view than the firm held previously.
For investors tracking the small and microcap space, this rally carries a specific implication worth watching. Smaller precious metals mining companies typically carry significantly more operating leverage to metal prices than large diversified miners, meaning a 15% to 19% move in the underlying commodity can translate into a considerably larger percentage move in smaller producers’ earnings and, potentially, their share prices. The setup here is genuinely three stories converging into one, monetary policy, geopolitical risk, and structural industrial demand from the same AI infrastructure buildout driving so much of this year’s market activity, all pushing in the same direction at once.
Emerging Evidence of Potential Protection From Authorized Ebola Zaire Vaccine Against Bundibugyo Virus Provides Rationale for Evaluating GeoVax’s MVA-Based Ebola Vaccine Candidates
ATLANTA, GA – August 24, 2026 – GeoVax Labs, Inc. (Nasdaq: GOVX), a clinical-stage biotechnology company developing vaccines and immunotherapies against infectious diseases and cancers, today announced that it has expanded outreach to global and regional public health organizations regarding the potential relevance of its Modified Vaccinia Ankara (MVA)-based hemorrhagic fever vaccine portfolio amid the expanding Ebola disease outbreak caused by Bundibugyo virus (BDBV) in various regions of Africa.
The outreach follows GeoVax’s recent announcement highlighting its willingness to contribute vaccine candidates, materials and scientific expertise to the global response. GeoVax is seeking to determine whether its existing hemorrhagic fever vaccine candidates and MVA platform capabilities may warrant evaluation or could support broader Ebola preparedness and response efforts.
Of particular interest is GeoVax’s Zaire Ebola vaccine candidate, GEO-EM01, which previously demonstrated 100% protection following a single intramuscular dose in a non-human primate lethal-challenge study. All vaccinated rhesus macaques survived lethal Zaire Ebola virus challenge, with no live virus detected in tissues from vaccinated animals. The research, conducted in collaboration with scientists at the National Institute of Allergy and Infectious Diseases’ Rocky Mountain Laboratories, was originally published in Scientific Reports.
Recent scientific evidence has increased interest in whether vaccines developed against Zaire ebolavirus may also provide some degree of cross-protection against Bundibugyo virus. WHO’s Technical Advisory Group on Candidate Vaccine Prioritization recently recommended that the licensed Ebola Zaire vaccine Ervebo® be prioritized for inclusion in a Phase 3 study during the current Bundibugyo outbreak, based on an evolving body of animal, laboratory and human immune-response data suggesting potential cross-protection. Importantly, the extent of such protection remains uncertain and must be established through controlled clinical evaluation.
“The evolving science raises an important question that we believe warrants evaluation,” said David A. Dodd, Chairman and Chief Executive Officer of GeoVax. “Our Ebola Zaire vaccine demonstrated compelling protection in a stringent non-human primate challenge model, including 100% survival following a single dose. We do not know whether that protection extends to Bundibugyo virus. However, emerging evidence that a Zaire-directed Ebola vaccine may provide some degree of protection against BDBV provides a scientific rationale for asking that question. We are reaching out to the appropriate global health organizations to determine whether our vaccine candidate, materials and MVA platform expertise warrant further evaluation.”
Seeking Various Paths for Evaluation and Development
GeoVax’s outreach is focused on organizations involved in global health security, epidemic preparedness, vaccine evaluation and outbreak response. The Company is exploring potential opportunities that could include independent evaluation of existing vaccine materials, scientific collaboration, public-private partnerships, licensing arrangements or other externally supported development pathways.
GeoVax believes this approach could provide a mechanism for assessing and potentially advancing its hemorrhagic fever vaccine portfolio while preserving the Company’s operational and capital focus on GEO-MVA, its lead infectious disease program targeting mpox and smallpox.
“We believe these assets represent strategic optionality for GeoVax, but our intention is not to divert resources from GEO-MVA,” Dodd continued. “The appropriate path is to determine whether public health organizations, development partners or other third parties see sufficient scientific and strategic value to support further evaluation. If so, we are prepared to explore collaborative structures capable of advancing these assets responsibly.”
GEO-MVA on Schedule for Pivotal Phase 3 Immunobridging Study Initiation in Q4 2026
GeoVax’s primary infectious disease development priority remains GEO-MVA, its MVA-based vaccine candidate for the prevention of mpox and smallpox. The Company is advancing toward a pivotal Phase 3 immunobridging clinical program designed to compare immune responses generated by GEO-MVA with those generated by an established MVA vaccine.
As part of its GEO-MVA activities, GeoVax is developing relationships with healthcare, research and public health organizations in regions confronting significant infectious disease challenges. The Company believes these relationships, together with its broader MVA expertise, provide a foundation for exploring collaborative opportunities involving other high-consequence infectious diseases.
“Our priority remains execution of the GEO-MVA program,” Dodd concluded. “At the same time, the current Ebola outbreak demonstrates why maintaining a portfolio of technologies addressing high-consequence pathogens can have strategic value. Where an opportunity exists to leverage external expertise and resources to evaluate those assets without distracting from our lead program, we believe it is appropriate – and potentially important – to pursue it.”
About GeoVax’s Hemorrhagic Fever Vaccine Portfolio
GeoVax has developed MVA-based vaccine candidates targeting Zaire ebolavirus, Sudan ebolavirus and Marburg virus. The programs have undergone preclinical evaluation, including lethal-challenge studies in non-human primates, and have demonstrated encouraging protective efficacy.
GeoVax’s Zaire Ebola vaccine candidate, GEO-EM01, utilizes the Company’s MVA-VLP technology and previously demonstrated 100% survival in a small rhesus macaque lethal-challenge study following either a single-dose or two-dose vaccination regimen. The single-dose study represented the first reported demonstration that a replication-deficient MVA vector could provide complete protection against lethal Zaire Ebola virus challenge following a single vaccination in rhesus macaques.
GeoVax is evaluating opportunities for collaboration, licensing, public-private partnerships and other externally supported structures that could enable further evaluation and development of these assets while maintaining the Company’s primary operational and capital focus on GEO-MVA.
About GeoVax
GeoVax Labs, Inc. is a clinical-stage biotechnology company focused on the development of vaccines and immunotherapies addressing high-consequence infectious diseases and solid tumor cancers. GeoVax’s priority program is GEO-MVA, a Modified Vaccinia Ankara (MVA)–based vaccine targeting mpox and smallpox. The program is advancing under an expedited regulatory pathway, with plans to initiate a pivotal Phase 3 clinical trial in the second half of 2026, to address critical global needs for expanded orthopoxvirus vaccine supply and biodefense preparedness. In oncology, GeoVax is developing Gedeptin®, a gene-directed enzyme prodrug therapy (GDEPT) designed to enhance immune checkpoint inhibitor activity. Gedeptin has completed a multicenter Phase 1/2 clinical trial in advanced head and neck cancer and is being advanced into combination strategies, including planned neoadjuvant and first-line settings. GeoVax maintains a global intellectual property portfolio supporting its infectious disease and oncology programs and continues to evaluate strategic partnerships and funding opportunities aligned with its development priorities. For more information, visit www.geovax.com.
Forward-Looking Statements
This release contains forward-looking statements regarding GeoVax’s business plans. The words “believe,” “look forward to,” “may,” “estimate,” “continue,” “anticipate,” “intend,” “should,” “plan,” “could,” “target,” “potential,” “is likely,” “will,” “expect” and similar expressions, as they relate to us, are intended to identify forward-looking statements. We have based these forward-looking statements largely on our current expectations and projections about future events and financial trends that we believe may affect our financial condition, results of operations, business strategy and financial needs. Actual results may differ materially from those included in these statements due to a variety of factors, including whether: GeoVax is able to obtain acceptable results from ongoing or future clinical trials of its investigational products, GeoVax’s immuno-oncology products and preventative vaccines can provoke the desired responses, and those products or vaccines can be used effectively, GeoVax’s viral vector technology adequately amplifies immune responses to cancer antigens, GeoVax can develop and manufacture its immuno-oncology products and preventative vaccines with the desired characteristics in a timely manner, GeoVax’s immuno-oncology products and preventative vaccines will be safe for human use, GeoVax’s vaccines will effectively prevent targeted infections in humans, GeoVax’s immuno-oncology products and preventative vaccines will receive regulatory approvals necessary to be licensed and marketed, GeoVax raises required capital to complete development, there is development of competitive products that may be more effective or easier to use than GeoVax’s products, GeoVax will be able to enter into favorable manufacturing and distribution agreements, and other factors, over which GeoVax has no control.
Further information on our risk factors is contained in our periodic reports on Form 10-Q and Form 10-K that we have filed and will file with the SEC. Any forward-looking statement made by us herein speaks only as of the date on which it is made. Factors or events that could cause our actual results to differ may emerge from time to time, and it is not possible for us to predict all of them. We undertake no obligation to publicly update any forward-looking statement, whether as a result of new information, future developments or otherwise, except as may be required by law.
Saguenay, Quebec–(Newsfile Corp. – August 24, 2026) – First Phosphate Corp (NASDAQ: PHOS) (CSE: PHOS) (OTCQX: FRSPF) (FSE: KD0) (“First Phosphate” or the “Company“) is pleased to announce that the Company has filed its updated Mineral Resource Estimate (“MRE“) Technical Report for the Bégin-Lamarche project located 50 km northwest of the City of Saguenay, Quebec, Canada (the “Deposit”).
The Technical Report titled “Technical Report and Updated Mineral Resource Estimate of The Bégin-Lamarche Phosphate Property, Saguenay – Lac Saint-Jean Region, Northern Quėbec” dated August 24, 2026, with an effective date of May 1, 2026, was prepared by P&E Mining Consultants Inc. in accordance with National Instrument 43-101 – Standards of Disclosure for Mineral Projects and supports the disclosures made by the Company in its news release dated May 26, 2026. A full copy of the Report is available on the First Phosphate website at https://firstphosphate.com/projects/begin-lamarche-3 and can be found at SEDAR+ (www.sedarplus.ca) under the Company’s issuer profile.
MRE Highlights include:
The updated MRE includes a 378% increase in Indicated Mineral Resources over the Company’s Initial MRE dated September 9, 2024.
Measured pit-constrained Mineral Resource: 6.2 Mt @ 7.70% P2O5 (phosphate).
Indicated pit-constrained Mineral Resource: 198.5 Mt @ 6.00% P2O5.
Inferred pit-constrained Mineral Resource: 89.5 Mt @ 6.16% P2O5.
The Deposit remains open at depth.
Metallurgical test work indicates an anticipated apatite concentrate grade of 40.4% P2O5 at an 88% process recovery rate, with very low levels of potentially deleterious elements, and has been qualified for production of battery-grade phosphoric acid for lithium iron phosphate (“LFP”) battery with a conversion ratio of 91.1%.
The Deposit is located next to existing road and hydroelectric infrastructure and at only 70 km driving distance from the deep-sea Port of Saguenay.
The Deposit benefits from definitive, long-term, partially prepaid offtake from an existing, creditworthy partner.
Apatite (phosphorus, phosphate) is listed on the critical minerals lists of Québec, Canada, the United States and the European Union.
The Bégin-Lamarche Deposit Updated Optimized Pit Shell
The Qualified Person, independent of the issuer, responsible for estimating the Mineral Resources of the Begin-Lamarche Property, within the meaning of NI 43-101, is Mr. Antoine Yassa, P.Geo., of the firm P&E Mining Consultants Inc. Mr. Yassa has read this press release and confirms that the scientific and technical information in this press release for accuracy and compliance with NI 43-101.
The scientific and technical disclosure for First Phosphate included in this News Release have been reviewed and approved by Steeve Lavoie, P.Geo. Mr. Lavoie is Chief Geologist of the Company and a Qualified Person under National Instrument 43-101 Standards of Disclosure of Mineral Projects (“NI 43-101”).
About First Phosphate Corp
First Phosphate (NASDAQ: PHOS) (CSE: PHOS) (OTCQX: FRSPF) (FSE: KD0) is a mineral exploration and development and clean technology company dedicated to building and reshoring a vertically integrated mine-to-market supply chain for the production of LFP batteries in North America. Target markets include energy storage, data centers, robotics, mobility, and national security. First Phosphate’s flagship Bégin-Lamarche property, located in Saguenay-Lac-Saint-Jean, Québec, Canada, represents a rare North American igneous phosphate resource producing high-purity phosphate characterized by very low levels of impurities.
Forward-Looking Information and Cautionary Statements
This news release contains certain statements and information that may be considered “forward-looking statements” and “forward looking information” within the meaning of applicable securities laws. In some cases, but not necessarily in all cases, forward-looking statements and forward-looking information can be identified by the use of forward-looking terminology such as “plans”, “targets”, “expects” or “does not expect”, “is expected”, “an opportunity exists”, “is positioned”, “estimates”, “intends”, “assumes”, “anticipates” or “does not anticipate” or “believes”, or variations of such words and phrases or statements that certain actions, events or results “may”, “could”, “would”, “might”, “will” or “will be taken”, “occur” or “be achieved” and other similar expressions. In addition, statements in this news release that are not historical facts are forward looking statements, including, among other things: the Company’s planned exploration and production activities; the properties and composition of any extracted phosphate; and the calculation of mineral resources at the project and the possibility of eventual economic extraction of minerals from the project. Although the Company believes the expectations expressed in such forward-looking statements are based on reasonable assumptions, such statements are not guarantees of future performance and actual results or developments may differ materially from those forward-looking statements. Factors that could cause actual results to differ materially from those in forward-looking statements include development and exploration successes, continued availability of capital and financing, and general economic, market or business conditions. These statements are based on a number of assumptions including, among other things: that engineering and construction timetables and capital costs for the Company’s, exploration, development and expansion projects are correctly estimated and not affected by unforeseen circumstances; the ability to obtain financing for its proposed operations on acceptable terms; no material deterioration in general business and economic conditions; no material delays in obtaining permits and other approvals; no significant disruptions affecting the activities of the Company or its ability to access required project equipment and services, and operating supplies in sufficient quantities and on a timely basis; inflation and prices for Company project inputs being approximately consistent with anticipated levels; the ability to complete the exploration and development programs consistent with the Company’s expectations; commodity price expectations including assumptions for P2O5; the Company’s relationship with local municipalities and First Nations remaining consistent with the Company’s expectations; the Company’s relationship with other third-party partners and suppliers remaining consistent with the Company’s expectations; and government relations and actions being consistent with Company expectations. Investors are cautioned that any such statements are not guarantees of future performance and actual results or developments may differ materially from those projected in the forward-looking statements. Accordingly, readers should not place undue reliance on the forward-looking information contained in this press release. The Company does not assume any obligation to update or revise its forward-looking statements, whether because of new information, future events or otherwise, except as required by applicable law. All forward-looking information contained in this release is qualified by these cautionary statements.
Kratos Recently Ordered Long-lead Components for Spartan Engines
SAN DIEGO, Aug. 24, 2026 (GLOBE NEWSWIRE) — Kratos Defense & Security Solutions, Inc. (Nasdaq: KTOS), a technology company in defense, national security, and global markets, today announced an allocation of its expanded Spartan engine production capacity to support Boeing’s Joint Direct Attack Munition Long Range production program with TDI-J85 (J85) engines.
This month, the U.S. Air Force awarded Boeing a $75 million Undefinitized Contract Action (UCA) to acquire the BSU-111/B Payload Delivery Unit (PDU) Joint Direct Attack Munition Long Range (JDAM LR), a precision-guided munition that can travel over 300 nautical miles with a 500-pound class (226-kilogram) payload. The Kratos J85 engine has been selected as the engine source to power the munition, enhancing the affordable precision-strike capability with our high-volume, low-cost, military-grade propulsion systems for the U.S. military and allied partners.
“National security priorities demand affordable mass and resilient, domestic supply chains,” said Steve Fendley, President of Kratos Unmanned Systems. “Kratos’ internally funded and proactive supply-chain investments ensure we are not just preparing for future demand, and we are actively manufacturing the high-volume propulsion systems our customers require today.”
The J85 engines are produced in Kratos’ advanced 22,500-square-foot Propulsion Manufacturing Facility in Auburn Hills, Michigan, which is fully operational and optimized to sustain full-rate production.
To bolster and stabilize the defense industrial base supply chain, Kratos has initiated procurement of long-lead components for Spartan engines to support a large production run for a number of customers and applications in 2027, Boeing JDAM LR being key as the engine was originally designed to support this application. The large run enables economies of scale for cost and to address the published need by the Department of War to expand the U.S. industrial base and especially key technologies such as jet engines. Kratos is also executing a three-phase manufacturing infrastructure plan designed to expand production capacity, enabling rapid responsiveness to emerging customer requirements.
“The operational readiness of our Auburn Hills facility marks a pivotal transition from engineering development to high-rate tactical manufacturing,” said Joseph Kovasity, Senior Vice President of Kratos TDI. “Integrating the Spartan turbojet family into Boeing’s JDAM LR program provides a reliable, scalable, domestically sourced propulsion solution that meets urgent national defense needs.”
About Kratos Defense & Security Solutions Kratos Defense & Security Solutions, Inc. (Nasdaq: KTOS) is a technology, products, system and software company addressing the defense, national security, and global markets. Kratos makes true internally funded research, development, capital and other investments, to rapidly develop, produce and field solutions that address our customers’ mission critical needs and requirements. At Kratos, affordability is a technology, and we seek to utilize proven, leading-edge approaches and technology, not unproven bleeding-edge approaches, with Kratos’ approach designed to reduce cost, schedule and risk, enabling us to be first to market with cost effective solutions. We believe that Kratos is known as an innovative disruptive change agent in the industry, a company that is an expert in designing products and systems up front for successful rapid, large quantity, low-cost future manufacturing which is a value-add competitive differentiator for our large traditional prime system integrator partners and also to our government and commercial customers. Kratos’ primary business areas include virtualized ground systems for satellites and space vehicles; jet-powered unmanned aerial drone systems; advanced vehicles and rocket systems; propulsion systems for drones, missiles, loitering munitions, supersonic systems, spacecraft, and launch systems; C5ISR and microwave electronic products for missile, radar, missile defense, space, satellite, counter-UAS, directed energy, communication, and other systems; and virtual and augmented reality training systems for the warfighter. For more information, visit www.KratosDefense.com and follow Kratos on LinkedIn and X.
Notice Regarding Forward-Looking Statements Certain statements in this press release may constitute “forward-looking statements” within the meaning of the Private Securities Litigation Reform Act of 1995. These forward-looking statements are made on the basis of the current beliefs, expectations and assumptions of the management of Kratos and are subject to significant risks and uncertainty. Investors are cautioned not to place undue reliance on any such forward-looking statements. All such forward-looking statements speak only as of the date they are made, and Kratos undertakes no obligation to update or revise these statements, whether as a result of new information, future events or otherwise. Although Kratos believes that the expectations reflected in these forward-looking statements are reasonable, these statements involve many risks and uncertainties that may cause actual results to differ materially from what may be expressed or implied in these forward-looking statements. For a further discussion of risks and uncertainties that could cause actual results to differ from those expressed in these forward-looking statements, as well as risks relating to the business of Kratos in general, see the risk disclosures in the Annual Report on Form 10-K of Kratos for the year ended December 29, 2025, and in subsequent reports on Forms 10-Q and 8-K and other filings made with the SEC by Kratos.
Michael Kupinski, Director of Research, Equity Research Analyst, Digital, Media & Technology , Noble Capital Markets, Inc.
George Proost, Research Associate, Noble Capital Markets, Inc.
Refer to the full report for the price target, fundamental analysis, and rating.
Radio’s audience remains considerably more resilient than its advertising performance suggests. Consumer engagement has held up far better than traditional spot revenue, even as podcasts, streaming, and other audio alternatives have proliferated. This disconnect is central to the investment thesis: radio increasingly has a monetization problem rather than an audience problem, creating an opportunity if technology can narrow the gap.
The industry’s transformation is increasingly becoming an ad-tech and digital monetization story. Programmatic buying, improved attribution, first-party data, podcasts, and digital marketing services are expanding radio beyond the traditional station-and-spot model. The opportunity is to use radio’s existing reach, content, and advertiser relationships to participate in a much larger advertising market rather than simply defend its share of traditional radio spending.
Equity Research is available at no cost to Registered users of Channelchek. Not a Member? Click ‘Join’ to join the Channelchek Community. There is no cost to register, and we never collect credit card information.
This Research is provided by Noble Capital Markets, Inc., a FINRA and S.E.C. registered broker-dealer (B/D).
*Analyst certification and important disclosures included in the full report. NOTE: investment decisions should not be based upon the content of this research summary. Proper due diligence is required before making any investment decision.