Trade talks between the United States and Canada collapsed over the weekend, prompting Washington to impose 50% tariffs on a wide range of Canadian goods, including furniture, dairy products, electrical equipment, and plywood. Canada’s Finance Department responded Tuesday with its own retaliatory tariffs. Markets, notably, barely flinched. The Dow, S&P 500, and Nasdaq all posted modest gains Tuesday, and the Russell 2000 advanced as well, suggesting investors are treating this escalation as manageable rather than systemically threatening, at least for now.
What makes this dispute genuinely interesting from a market perspective is not what got tariffed, it is what deliberately did not. Crude oil, one of the largest categories of trade flowing between the two countries, was left entirely out of the new 50% tariffs, and neither government appears eager to bring it into the fight.
Why Oil Is the One Line Neither Side Wants to Cross
The scale of that exemption is significant. The United States buys roughly 90% of all Canadian crude exports, worth approximately CA$126 billion of Canada’s CA$140 billion total in 2025, while Canada supplies roughly 63% of all US crude imports. That dependence reflects decades of physical infrastructure investment rather than a relationship either country could quickly unwind. Alberta’s oil sands produce heavy bitumen, and US refiners, particularly across the Midwest and Gulf Coast, spent billions of dollars building capacity specifically configured to process that heavier crude. Meanwhile, America’s own shale boom has made it the world’s largest oil producer, but that production is overwhelmingly light, sweet crude, creating a structural mismatch where the US exports large volumes of its own light oil while importing millions of barrels of heavier Canadian crude every single day.
Canada, for its part, has limited ability to simply redirect that oil elsewhere. The expanded Trans Mountain pipeline gives Alberta producers new access to Pacific coast export markets, but its roughly 890,000 barrel-per-day capacity is dwarfed by the nearly 3.9 million barrels shipped south to the US daily. President Trump acknowledged this interdependence directly in public comments this week, pointing to Canada’s own reliance on US infrastructure to move electricity, oil, and gas between its own provinces, a reference to cross-border pipeline routes like Enbridge’s Line 5, which carries Canadian oil through Wisconsin and Michigan before crossing back into Ontario. That mutual physical dependence is precisely why energy has remained exempt even as tariffs on nearly everything else have escalated sharply.
If oil were eventually pulled into this dispute, the consequences would ripple in multiple directions. US refiners, as the importers of record, would bear the tariff directly and would likely respond by demanding steeper discounts from Canadian producers, while also passing at least some of the higher input costs through to consumers at the pump, directly reversing the gas price relief seen earlier this summer. Canadian producers would face the opposite squeeze, a shrinking pool of buyers willing to pay full price for barrels with nowhere else to go at comparable volume.
For investors tracking the small and microcap space, this dispute carries two distinct layers of exposure. Companies with direct supply chain exposure to the newly tariffed categories, furniture, dairy, electrical components, and building materials like plywood, are facing real, immediate cost pressure right now. Energy-adjacent companies, meanwhile, are watching a very different, still-hypothetical risk: what happens if this trade fight eventually escalates into the one category both governments have so far treated as off-limits. Markets shrugging off Tuesday’s escalation suggests investors currently believe that line will hold. Whether it actually does may prove to be the more consequential question heading into the fall, particularly with the Fed’s Jackson Hole speech still ahead and the Treasury’s bond market intervention already testing how much stress the system can absorb at once.
ATHENS, Greece, Aug. 25, 2026 (GLOBE NEWSWIRE) — Euroseas Ltd. (NASDAQ: ESEA, the “Company” or “Euroseas”), an owner and operator of container carrier vessels and provider of seaborne transportation for containerized cargoes, announced today a time charter contract extension for its 2006-built 1,740 teu feeder containership, M/V Jonathan P, for a minimum period of 24 to a maximum period of 26 months, at the option of the charterer, at a gross daily rate of $26,000. The new period will commence at the end of October 2026, following the completion of the vessel’s scheduled dry-dock, and will run in direct continuation of the current charter contract.
Aristides Pittas, Chairman and CEO of Euroseas, commented: “We are very pleased to announce the extension of the time charter contract for our feeder containership, M/V Jonathan P, in direct continuation of her present charter, for 24-26 months at a profitable rate of $26,000/day. Despite the typical summer slowdown and ongoing geopolitical uncertainty, the containership charter market has remained active with strong operator demand and limited vessel availability continuing to firm charter terms both in terms of rates and contract periods. The charter is expected to generate approximately $12.7 million of EBITDA over the minimum contracted period and increases our charter coverage for 2026, 2027, and 2028 to about 97%, 86% and 50%, respectively.”
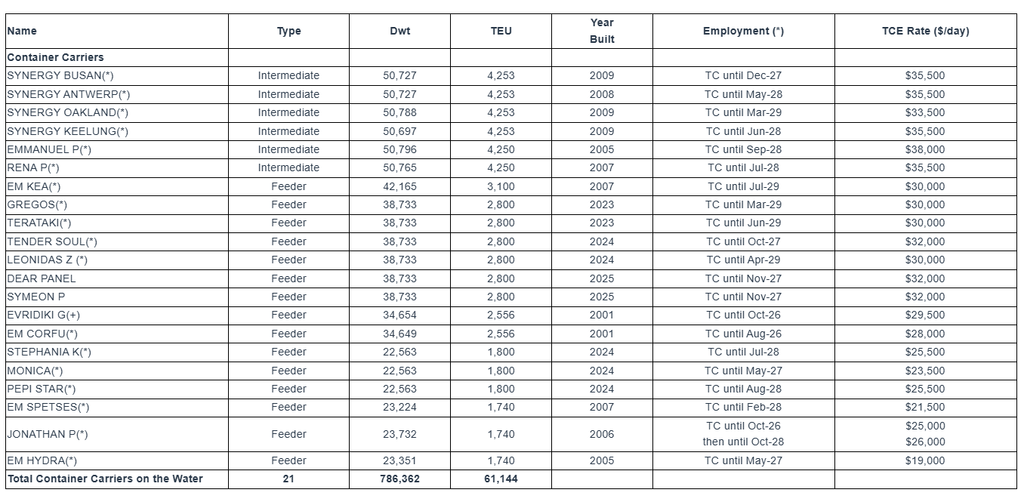
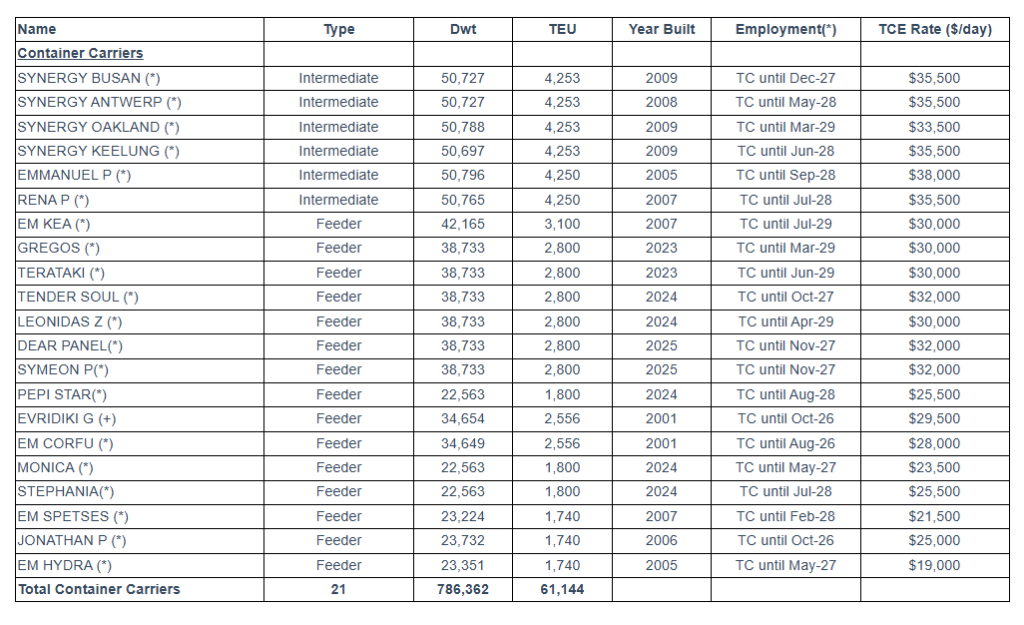
Fleet Profile: The Euroseas Ltd. fleet profile is currently as follows:
Notes: (*) TC denotes time charter. Charter duration indicates the earliest redelivery date; all dates listed are the earliest redelivery dates under each TC unless the contract rate is lower than the current market rate in which cases the latest redelivery date is assumed; vessels with the latest redelivery date shown are marked by (+). (**) Charterer has the option to convert to a five-year charter at $32,500/day for the entire period. (***) The entity owning the vessel is 51% owned by Euroseas Ltd. and 49% by NRP Investors.
About Euroseas Ltd.
Euroseas Ltd. was formed on May 5, 2005 under the laws of the Republic of the Marshall Islands to consolidate the ship owning interests of the Pittas family of Athens, Greece, which has been in the shipping business over the past 150 years. Euroseas trades on the NASDAQ Capital Market under the ticker ESEA.
Euroseas operates in the container shipping market. Euroseas’ operations are managed by Eurobulk Ltd., an ISO 9001:2008 and ISO 14001:2004 certified affiliated ship management company, which is responsible for the day-to-day commercial and technical management and operations of the vessels. Euroseas employs its vessels on spot and period charters and through pool arrangements.
The Company has a fleet of 21 vessels, including 15 Feeder containerships and 6 Intermediate containerships with a cargo capacity of 61,144 teu. After the delivery of four intermediate and eight feeder containership newbuildings between 2027 and 2029, Euroseas’ fleet will consist of 33 vessels with a total carrying capacity of 97,396 teu.
Forward Looking Statement
This press release contains forward-looking statements (as defined in Section 27A of the Securities Act of 1933, as amended, and Section 21E of the Securities Exchange Act of 1934, as amended) concerning future events and the Company’s growth strategy and measures to implement such strategy; including expected vessel acquisitions and entering into further time charters. Words such as “expects,” “intends,” “plans,” “believes,” “anticipates,” “hopes,” “estimates,” and variations of such words and similar expressions are intended to identify forward-looking statements. Although the Company believes that the expectations reflected in such forward-looking statements are reasonable, no assurance can be given that such expectations will prove to have been correct. These statements involve known and unknown risks and are based upon a number of assumptions and estimates that are inherently subject to significant uncertainties and contingencies, many of which are beyond the control of the Company. Actual results may differ materially from those expressed or implied by such forward-looking statements. Factors that could cause actual results to differ materially include, but are not limited to changes in the demand for containerships, competitive factors in the market in which the Company operates; risks associated with operations outside the United States; and other factors listed from time to time in the Company’s filings with the Securities and Exchange Commission. The Company expressly disclaims any obligations or undertaking to release publicly any updates or revisions to any forward-looking statements contained herein to reflect any change in the Company’s expectations with respect thereto or any change in events, conditions or circumstances on which any statement is based.
Tesla will unveil the production version of its Cybercab at a launch event in Austin on September 3, according to invitations that surfaced among Tesla watchers over the weekend and were subsequently confirmed by outlets covering the electric vehicle industry. The vehicle itself is notable for what it lacks: no steering wheel, no pedals, a two-seat design built entirely around autonomy rather than adapted from an existing model. It represents Tesla’s first vehicle engineered purely to run on the company’s Full Self-Driving software as part of the robotaxi fleet the company launched in Austin last year using modified Model Ys.
Tesla shares were little changed on the unofficial confirmation, but the muted stock reaction understates just how much is actually riding on this vehicle’s success. Tesla’s current valuation carries a meaningful premium built on the assumption that the company can convert its robotaxi ambitions into an autonomous ride-hailing network at scale, in addition to selling Full Self-Driving subscriptions to private owners at software-like profit margins rather than traditional auto manufacturing margins. The Cybercab is the physical product meant to prove that thesis works.
A Competitive Landscape Just Got Clearer
The timing is notable for a second reason. Last week, the Nevada Transportation Authority unanimously approved permits clearing Tesla, Alphabet’s Waymo, and Uber to operate commercial robotaxis in Clark County, home to Las Vegas, authorizing up to 8,000 driverless vehicles over the next twelve months. Tesla secured the largest allocation at roughly 5,000 vehicles, though the company’s Cybercab chief engineer told regulators Tesla expects to actually field closer to 2,500 within the year, noting the 5,000 figure has always represented a ceiling rather than a target. Waymo, widely viewed as the current leader in autonomous ride-hailing, was cleared for up to 1,000 vehicles, while Uber secured roughly 1,100 combined through partnerships with Hyundai-backed Motional and Amazon’s Zoox unit.
That approval gives investors a genuinely useful, apples-to-apples comparison point across three major public companies, Tesla, Alphabet, and Uber, all racing toward commercial autonomous ride-hailing in the same market simultaneously. Local taxi and livery operators have already pushed back, warning of oversaturation and congestion risk, and Tesla still faces the harder task of proving to regulators and the public that a Cybercab can operate safely with genuinely no one in the driver’s seat, not just in a permitted market but at the commercial scale its valuation assumes.
For investors tracking the broader market beyond Tesla itself, this launch and the accompanying Nevada approval illustrate something worth watching closely: autonomous vehicle technology is no longer a distant, speculative theme confined to a single company’s investor presentations. It is now a live, permitted, multi-company competitive race playing out in real regulatory jurisdictions, with real vehicle counts attached. That shift creates downstream implications for smaller companies supplying the sensors, lidar systems, mapping software, and specialized components that every one of these robotaxi fleets, regardless of which company ultimately wins market share, will need in growing volume as commercial deployment expands beyond pilot markets like Austin and Las Vegas into additional cities over the coming years.
Joe Gomes, CFA, Managing Director, Equity Research Analyst, Generalist , Noble Capital Markets, Inc.
Refer to the full report for the price target, fundamental analysis, and rating.
Upsized. Sky Harbour executed a third stock purchase agreement under its Registered Direct common stock placement. An additional one million shares were sold to M-Cor Capital at $10 per share, raising an additional $10 million on top of the original $40 million raised. We anticipate the additional capital to be used to support future hangar developments.
Portfolio I. Sky Harbour filed its monthly Construction Report for July 2026. The Company continued to make progress in June on its two remaining projects from the Obligated Group (PABs 2021 Series bond issue) – Opa Locka Phase 2 (OPF2) in Opa Locka, FL and Addison Phase 2 (ADS2) in Addison, TX. At OPF2, Alston Construction is substantially complete with construction. Temporary Certificates of Occupancy (TCO) have been issued for all hangars and the GSE. Tenants have started moving into the hangars, and the campus is in full operation. At ADS2 (Addison Airport), Ascend Aviation continues to work towards completion of the Earthwork and Utility scopes of work, with all site sanitary and water completed. The airside apron stabilization is completed, with 8 of 12 pours complete. All foundation piers have been completed on all hangars.
Equity Research is available at no cost to Registered users of Channelchek. Not a Member? Click ‘Join’ to join the Channelchek Community. There is no cost to register, and we never collect credit card information.
This Company Sponsored Research is provided by Noble Capital Markets, Inc., a FINRA and S.E.C. registered broker-dealer (B/D).
*Analyst certification and important disclosures included in the full report. NOTE: investment decisions should not be based upon the content of this research summary. Proper due diligence is required before making any investment decision.
President Trump announced late Tuesday night he is pausing a scheduled 50% tariff on Canadian goods just hours before it was set to take effect at midnight, following eleventh-hour talks between US officials and Canadian Prime Minister Mark Carney’s team. Trump posted that the three-day pause reflects an agreement in principle between the two countries, subject to finalizing formal documents. Notably, US equity futures were essentially unchanged on the news, a muted reaction that tells its own story about how markets are actually reading this development.
Stocks were already under pressure heading into Wednesday, weathering a losing week driven by rising bond yields and oil prices, compounded by a Tuesday tech selloff that spread overnight into Asian markets, where Japan’s Nikkei fell 3% and South Korea’s KOSPI dropped 5%. Against that backdrop, a last-minute tariff pause registering as a non-event for futures markets is itself informative. Trade policy experts have noted the Canadian tariffs, even if implemented, would likely have had limited direct economic impact given the narrower scope of affected goods compared to broader tariff actions earlier in the year. What markets appear to be reading instead is the signal this sends ahead of the larger prize: negotiations over the US-Mexico-Canada Trade Agreement, the actual trade framework governing the bulk of cross-border commerce among the three countries, which remains the more consequential outcome still to be determined.
This tariff pause arrives during an already data-heavy stretch for markets. The Federal Reserve released minutes from its July FOMC meeting the same day, offering additional detail on the internal debate over inflation and the path for interest rates that we detailed in our recent coverage of the divided committee heading into Jackson Hole. Separately, a wave of retail earnings from Target, Lowe’s, and TJX Companies is set to give investors a clearer read on consumer spending trends through the spring and summer, adding yet another variable competing for market attention this week.
For companies operating below the $2 billion market cap threshold, trade policy volatility of this kind carries outsized relevance. Smaller manufacturers, industrial suppliers, and companies with meaningful cross-border supply chains into Canada are directly exposed to tariff uncertainty in a way large multinational companies, with more diversified sourcing and pricing power, often are not. A three-day pause is not resolution, it is a postponement, and the underlying uncertainty over how USMCA negotiations ultimately land remains an open variable for exactly the kind of domestically focused small cap companies that make up a large share of the Russell 2000. Investors in this space should treat this development as one to watch closely rather than a settled outcome, since the finalized documents Trump referenced, and the broader trade framework they sit within, are what will actually determine whether this becomes a durable resolution or simply a delay before the next deadline.
Mark Reichman, Managing Director, Equity Research Analyst, Natural Resources, Noble Capital Markets, Inc.
Refer to the full report for the price target, fundamental analysis, and rating.
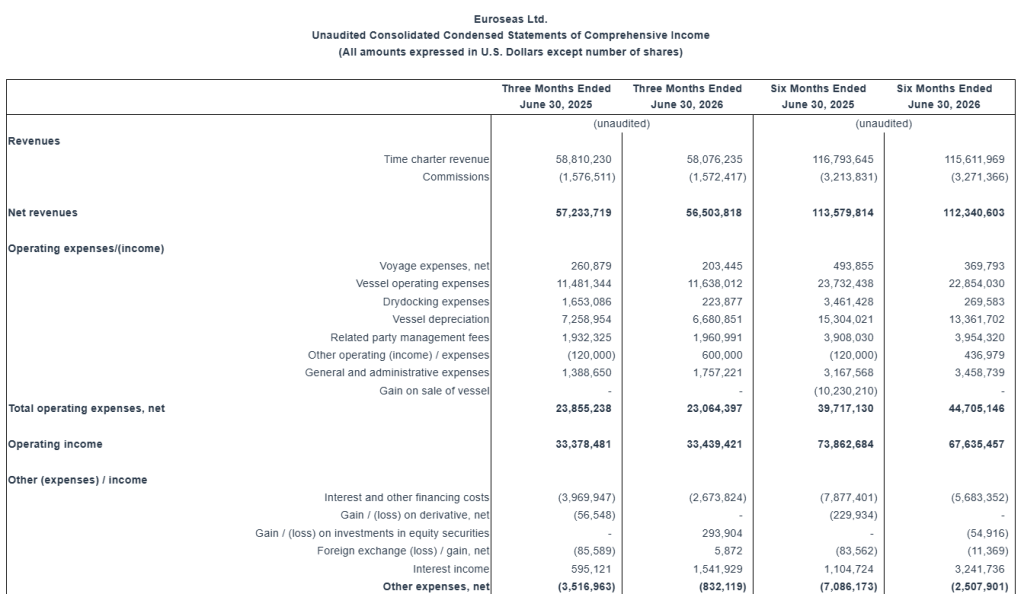
Second Quarter Financial Results. Euroseas Ltd. reported solid second quarter 2026 financial performance supported by elevated charter rates, high fleet utilization, and disciplined cost management. While net revenues declined modestly to $56.5 million compared to $57.2 million in the prior year period due to a smaller average fleet size, adj. EBITDA increased to $40.1 million compared to $39.3 million during the second quarter of 2025, and adj. earnings per share increased to $4.70 from $4.20. We had projected net revenue of $56.5 million and adj. EBITDA of $40.1 million.
Outlook Remains Constructive. In our view, the near-term outlook remains positive, supported by strong charter rates, tight vessel availability in the feeder and intermediate segments of the containership market, and significant charter coverage through 2027. While market conditions could moderate as the supply of vessels increases and Red Sea routes potentially normalize, we think the feeder and intermediate segments are relatively well positioned versus larger vessel classes. Euroseas’ strong charter coverage of 96.0% in 2026, 81.3% in 2027, and 46.8% in 2028 is expected to insulate the company from any volatility in the market.
Equity Research is available at no cost to Registered users of Channelchek. Not a Member? Click ‘Join’ to join the Channelchek Community. There is no cost to register, and we never collect credit card information.
This Research is provided by Noble Capital Markets, Inc., a FINRA and S.E.C. registered broker-dealer (B/D).
*Analyst certification and important disclosures included in the full report. NOTE: investment decisions should not be based upon the content of this research summary. Proper due diligence is required before making any investment decision.
Joe Gomes, CFA, Managing Director, Equity Research Analyst, Generalist , Noble Capital Markets, Inc.
Refer to the full report for the price target, fundamental analysis, and rating.
Overview. During the second quarter, the pace of investment and new construction at Sky Harbour continued to accelerate. Assets under construction and completed construction reached over $393 million, a $65 million increase year-to-date and the highest in six months in corporate history.
2Q26 Results. Sky Harbour 2Q26 revenue of $9.86 million rose nearly 50% y-o-y, driven by new campus openings in the past year and increases in occupancy and rental rates. Adjusted EBITDA improved to approximately negative $0.9 million in the second quarter of 2026 from a loss of $3.0 million in the second quarter of 2025. The Company reported a net loss of $1.2 million, or $0.04/sh, versus net income of $17.5 million, or $0.18/sh, in 2Q25, which was positively impacted by $21.8 million of unrealized gain on warrants.
Equity Research is available at no cost to Registered users of Channelchek. Not a Member? Click ‘Join’ to join the Channelchek Community. There is no cost to register, and we never collect credit card information.
This Company Sponsored Research is provided by Noble Capital Markets, Inc., a FINRA and S.E.C. registered broker-dealer (B/D).
*Analyst certification and important disclosures included in the full report. NOTE: investment decisions should not be based upon the content of this research summary. Proper due diligence is required before making any investment decision.
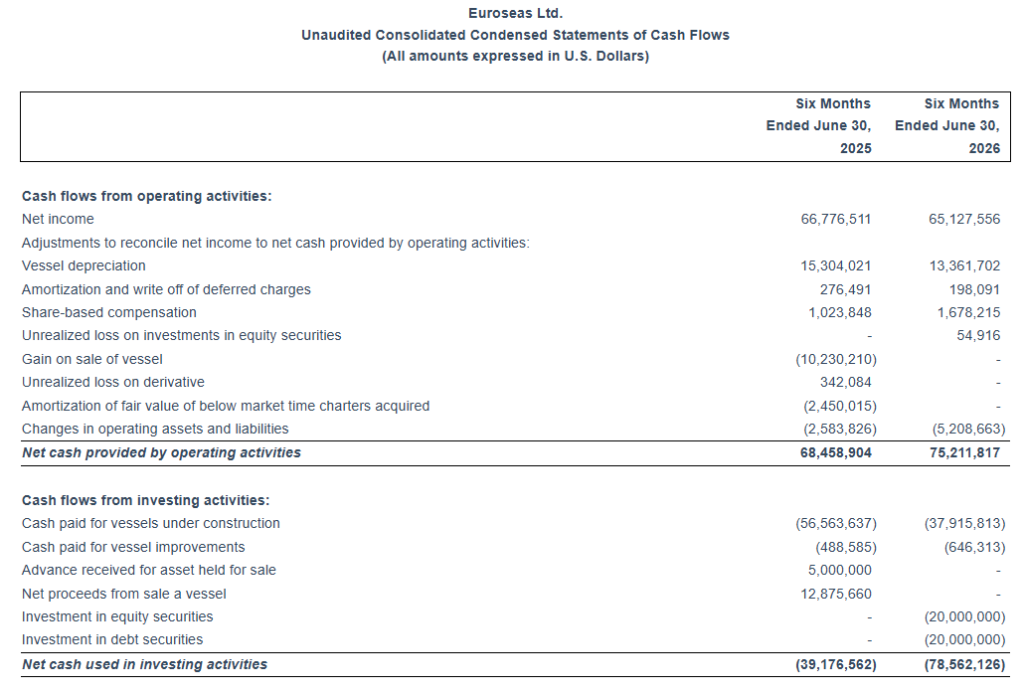
ATHENS, Greece, Aug. 13, 2026 (GLOBE NEWSWIRE) — Euroseas Ltd. (NASDAQ: ESEA, the “Company” or “Euroseas”), an owner and operator of container carrier vessels and provider of seaborne transportation for containerized cargoes, announced today its results for the three- and six-month periods ended June 30, 2026.
Second Quarter 2026 Financial Highlights:
Total net revenues of $56.5 million.
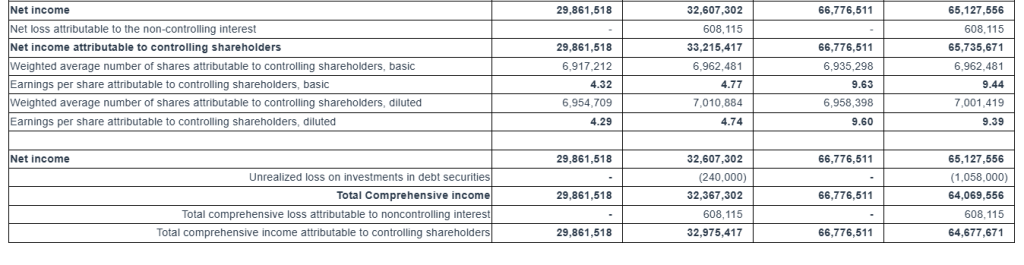
Net income attributable to controlling shareholders of $33.2 million or $4.77 and $4.74 earnings per share attributable to controlling shareholders basic and diluted, respectively.
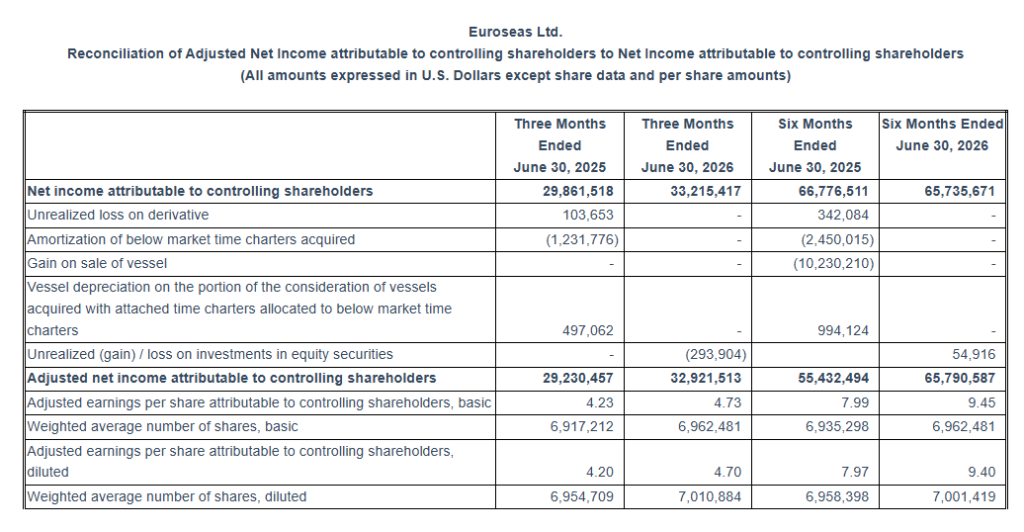
Adjusted net income1 attributable to controlling shareholders for the period of $32.9 million or $4.73 and $4.70 adjusted earnings per share1 basic and diluted, respectively, which represents the net income attributable to controlling shareholders excluding the unrealized gain on investments in equity securities.
Adjusted EBITDA1 was $40.1 million.
An average of 21.0 vessels were owned and operated during the second quarter of 2026 earning an average time charter equivalent rate of $30,306 per day.
Declared a quarterly dividend of $0.80 per share for the second quarter of 2026 payable on or about September 16, 2026, to shareholders of record on September 9, 2026, as part of the Company’s common stock dividend plan.
As of August 13, 2026, we had repurchased 480,460 of our common stock in the open market, representing about 6.8% of the outstanding shares, for a total of about $11.36 million, since the initiation of our share repurchase plan of up to $20 million announced in May 2022.
First Half 2026 Financial Highlights:
Total net revenues of $112.3 million.
Net income attributable to controlling shareholders of $65.7 million or $9.44 and $9.39 earnings per share attributable to controlling shareholders basic and diluted, respectively.
Adjusted net income1 attributable to controlling shareholders for the period was $65.8 million or $9.45 and $9.40 adjusted earnings per share1 attributable to controlling shareholders basic and diluted, respectively.
Adjusted EBITDA1 was $81.0 million.
An average of 21.0 vessels were owned and operated during the first half of 2026 earning an average time charter equivalent rate of $30,330 per day.
___________________________ 1 Adjusted EBITDA, Adjusted net income and Adjusted earnings per share are not recognized measurements under US GAAP (GAAP) and should not be used in isolation or as a substitute for Euroseas financial results presented in accordance with GAAP. Refer to a subsequent section of the Press Release for the definitions and reconciliation of these measurements to the most directly comparable financial measures calculated and presented in accordance with GAAP.
Aristides Pittas, Chairman and CEO of Euroseas, commented: “We are pleased to report financial results for the second quarter of 2026 at par with the first quarter of the year, making these two of our most profitable consecutive quarters of the last fifteen years. Solid contracts at highly profitable rates, combined with low drydocking expenses, as in the previous quarter, were the main factors supporting our strong financial results.
“The containership charter market remained very strong during the second quarter, with daily rates continuing at high levels through July and into the beginning of August 2026, shrugging off geopolitical uncertainty and inflationary pressures. Charterer interest in securing vessels has remained high, including for older tonnage. Our charter coverage is over 95% for the remainder of 2026, 81% for 2027 and 47% for 2028, ensuring that our profitability will remain strong regardless of the levels at which expiring charters are renewed. Secondhand vessel prices across all segments have also remained very firm and have continued to inch upwards.
“The macroeconomic environment during the quarter was largely influenced by continuing uncertainty surrounding the war in Iran and its effects on the use of the Strait of Hormuz. Whether these effects will prove short-lived or will ultimately result in lower economic growth remains to be seen. At the same time, continuing attacks by Houthi rebels on shipping in the Red Sea have prevented major liner companies from resuming regular Suez Canal transits. This has increased the number of teu-miles required and, consequently, the number of vessels needed, supporting demand for tonnage and charter rates.
“The eventual reversal of these inefficiencies, together with the absorption of the increased fleet orderbook, presents challenges for our sector over the medium term. The vessel orderbook, however, although high for the overall containership fleet, is concentrated in the larger sizes. The segments in which we operate—feeder and intermediate containerships—not only have a significantly smaller orderbook as a percentage of the existing fleet but also have an older age profile. This is likely to result in very modest fleet growth, or potentially even fleet shrinkage, in these segments.
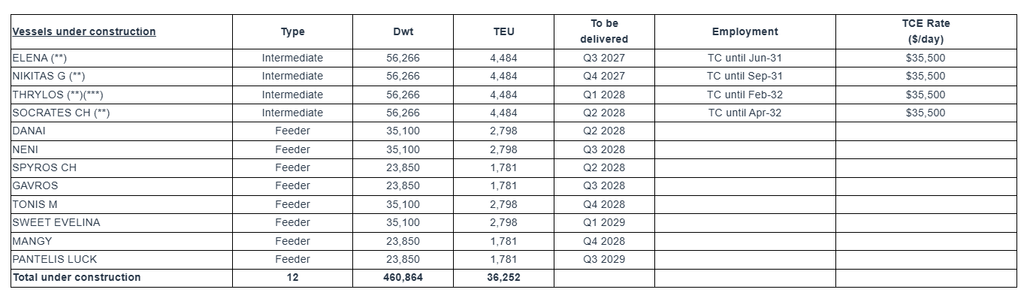
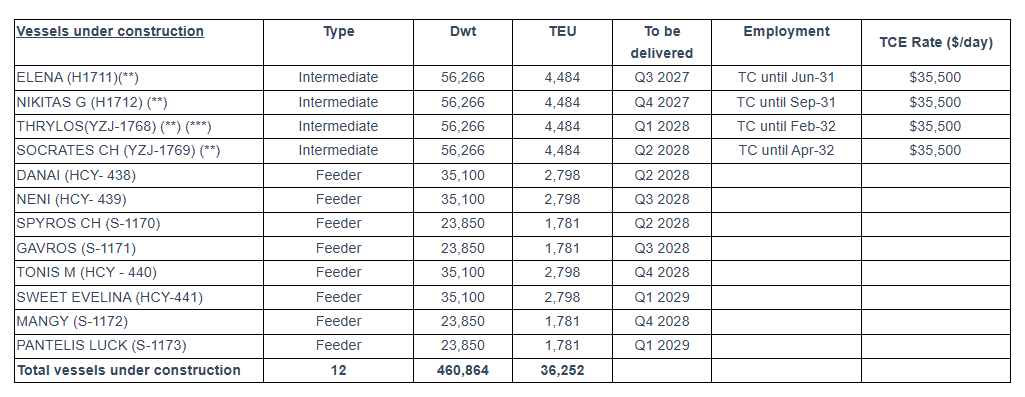
“On the investment front, we have expanded our newbuilding program to 12 vessels, focusing on the most commercial sizes within the feeder and intermediate containership segments. The vessels are scheduled for delivery from the third quarter of 2027 through the first quarter of 2029. Once all twelve vessels are delivered, we expect to have one of the youngest feeder and intermediate containership fleets in the industry. In addition, we continue to look for accretive investment opportunities in our sector, balancing project returns with residual value risks.
“Finally, I am also pleased to announce that our Board has decided to declare a dividend of $0.80 per share, representing an annualized yield of approximately 4.2% to 4.5% based on the recent range in which our share price has traded.”
Tasos Aslidis, Chief Financial Officer of Euroseas commented: “Our revenues for the second quarter of 2026 are slightly lower compared to the same period of 2025. This was the result of the lower average number of vessels owned and operated during the second quarter of 2026 compared to the same period of last year. On a per-vessel-per-day basis, our vessels earned a 3.0% higher average charter rate in the second quarter of 2026 as compared to the same period of 2025. Our net revenues decreased to $56.5 million in the second quarter of 2026 compared to $57.2 million during the same period of last year.
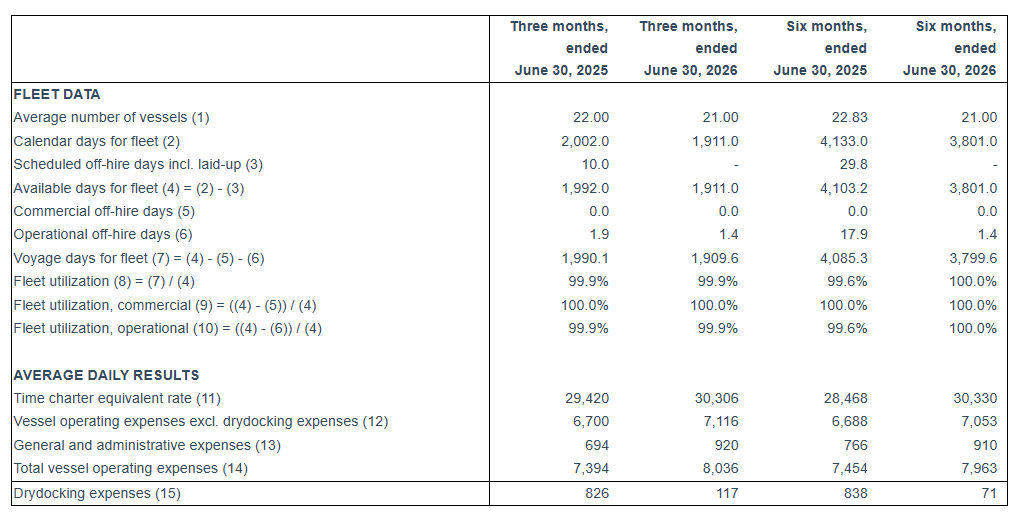
“Daily vessel operating expenses, including management fees but excluding drydocking costs, averaged $7,116 per vessel per day during the second quarter of 2026 as compared to $6,700 per vessel per day for the same quarter of last year. This was mainly the result of the falling value of the USD and the adjustment for inflation in the daily vessel management fee, effective from January 1, 2026, increasing it from 840 Euros to 875 Euros.
General and administrative expenses averaged $920 per vessel per day during the second quarter of 2026 as compared to $694 per vessel per day for the same quarter of last year, and $910 per vessel per day for the first half of 2026 as compared to $766 per vessel per day for the same period of 2025. The increase is due to increased professional fees and increased cost for our stock incentive plan within 2026 as compared to 2025.
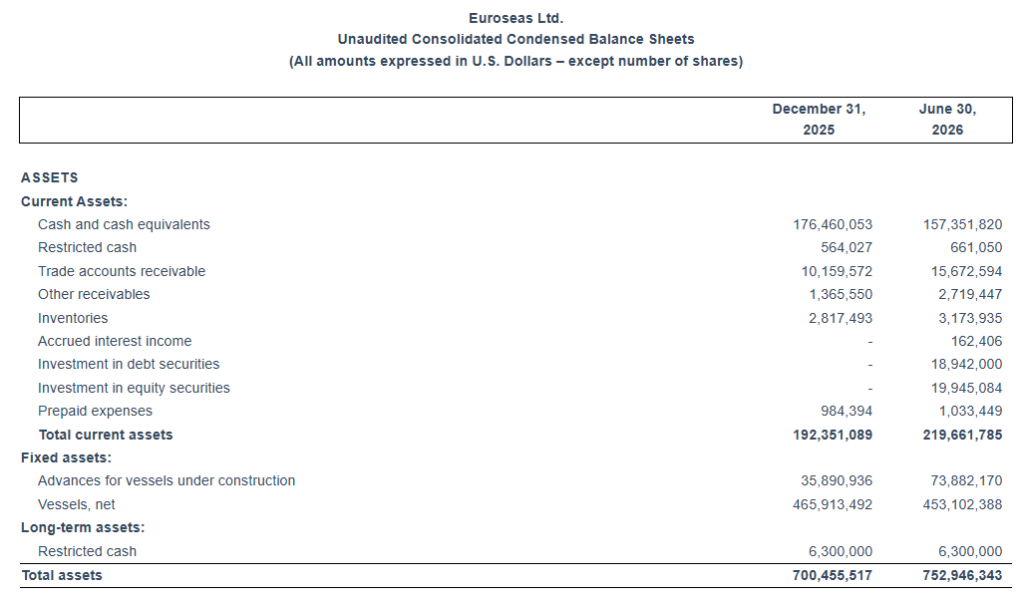
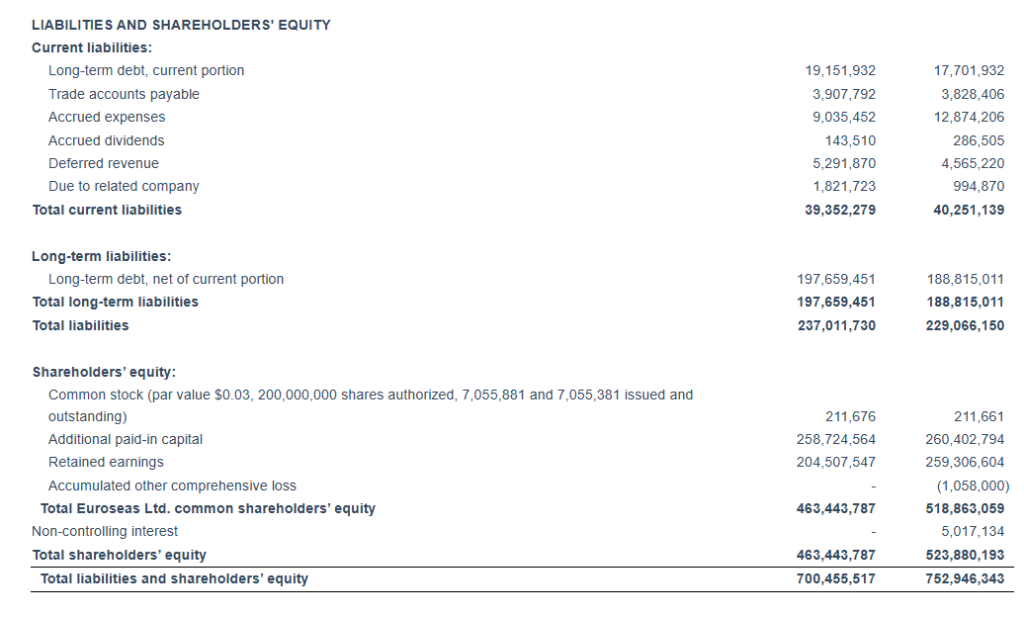
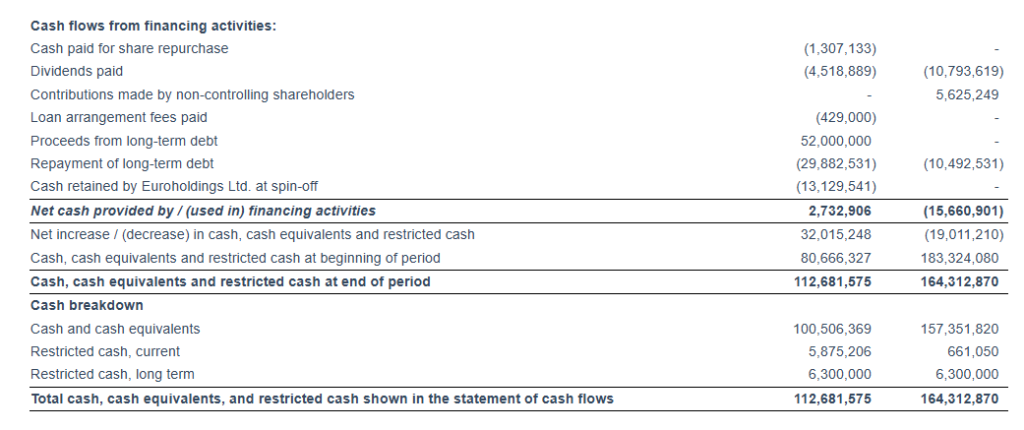
“Adjusted EBITDA during the second quarter of 2026 was $40.1 million versus $39.3 million in the second quarter of last year. As of June 30, 2026, our outstanding debt (before deducting the unamortized loan fees) was $208.1 million versus restricted and unrestricted cash of $164.3 million. As of the same date, our scheduled bank debt repayments over the next 12 months amounted to about $18.1 million (before deducting the unamortized loan fees).”
Second Quarter 2026 Results: For the second quarter of 2026, the Company reported total net revenues of $56.5 million representing a 1.2% decrease over total net revenues of $57.2 million during the second quarter of 2025. This was the result of the lower average number of vessels owned and operated in the second quarter of 2026 compared to the same period of 2025, partly offset by the increase in the time charter rates our vessels earned in the second quarter of 2026 compared to the same period of 2025. On average, 21.0 vessels were owned and operated during the second quarter of 2026 earning an average time charter equivalent rate of $30,306 per day compared to 22.0 vessels in the same period of 2025 earning on average $29,420 per day.
For the second quarter of 2026, voyage expenses, net amounted to $0.2 million, as compared to voyage expenses of $0.3 million for the same period of 2025. Voyage expenses for both periods related mainly to owners’ expenses incurred in various ports.
Vessel operating expenses were $11.6 million in the second quarter of 2026 as compared to $11.5 million for the second quarter of 2025. The increase is due to the increased cost of vessel supplies during the period, because of the war in the Middle East region, partly offset by the lower average number of vessels owned and operated in the second quarter of 2026, compared to the corresponding period of 2025.
In the second quarter of 2026 none of our vessels were drydocked. The total drydock cost for the quarter of $0.2 million relates to supplies performed for upcoming drydocks. In the second quarter of 2025 one of our vessels completed extensive repairs afloat. The total drydock cost for the quarter was $1.7 million and also includes costs in relation to the upcoming drydockings.
Vessel depreciation for the second quarter of 2026 decreased to $6.7 million compared to $7.3 million for the same period of 2025 due to the decreased number of vessels in the Company’s fleet.
Related party management fees for the second quarter of 2026 increased to $1.96 million from $1.93 million for the same period of 2025. Despite the lower number of vessels in our fleet, this increase is due to the adjustment for inflation in the daily vessel management fee, effective from January 1, 2026, increasing it from 840 Euros to 875 Euros, as well as due to the unfavorable movement of the euro/dollar exchange rate.
Other operating expenses of $0.6 million recognized in the second quarter of 2026 refers to expenses incurred for the formation of the Partnership (as defined below) with a group of investors represented by NRP Project Finance AS (“NRP Investors”). For the second quarter of 2025 the Company recognized other operating income of $0.12 million from an insurance claim.
General and administrative expenses increased to $1.8 million for the second quarter of 2026, compared to $1.4 million for the second quarter of 2025, due to increased professional fees and increased cost for our stock incentive plan.
Interest and other financing costs for the second quarter of 2026 amounted to $2.7 million, compared to $4.0 million for the second quarter of 2025. This decrease is due to the decreased amount of average outstanding debt and the decreased benchmark rates of our loans in the current period compared to the same period of 2025.
For the three months ended June 30, 2026, the Company recognized a $0.3 million unrealized gain on its investments in equity securities, resulting from an increase in the fair value of the investments from $19.65 million as of March 31, 2026 to $19.95 million as of June 30, 2026. These investments, which had an initial cost of $20.0 million and were acquired in the first quarter of 2026 as part of the Company’s short-term cash and liquidity management strategy, are classified as investments in equity securities and measured at fair value through profit or loss in accordance with U.S. GAAP. As part of the same strategy, the Company also acquired debt securities with an initial cost of $20.0 million, classified as available-for-sale under U.S. GAAP, for which the fair value decreased from $19.182 million as of March 31, 2026 to $18.942 million as of June 30, 2026, resulting in an additional unrealized loss of approximately $0.24 million during the second quarter of 2026, which was recognized in “Other comprehensive loss. None of these investments existed in the second quarter of 2025.
For the three months ended June 30, 2025, the Company recognized a $0.05 million realized gain and a $0.11 million unrealized loss for a total of $0.06 million net loss on its interest rate swap contract. The specific contract was closed within the year 2025 and no such case existed in the second quarter of 2026.
The Company reported net income for the period of $32.6 million and net income attributable to controlling shareholders of $33.2 million, as compared to net income and net income attributable to controlling shareholders of $29.9 million for the same period of 2025. The net loss attributable to the non-controlling interest of $0.6 million in the second quarter of 2026 represents the income attributable to the 49% ownership of the entity owning the M/V Thrylos represented by the NRP investors (the “Partnership”).
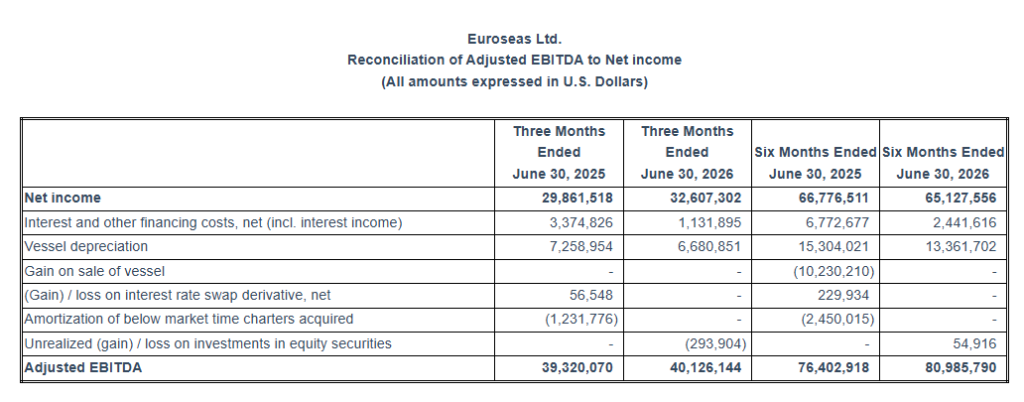
Adjusted EBITDA1 for the second quarter of 2026 was $40.1 million compared to $39.3 million achieved during the second quarter of 2025.
Basic and diluted earnings per share attributable to controlling shareholders for the second quarter of 2026 was $4.77 and $4.74, calculated on 6,962,481 basic and 7,010,884 diluted weighted average number of shares outstanding, compared to basic and diluted earnings attributable to controlling shareholders per share of $4.32 and $4.29, respectively, for the second quarter of 2025, calculated on 6,917,212 basic and 6,954,709 diluted weighted average number of shares outstanding.
The adjusted earnings per share attributable to controlling shareholders for the quarter ended June 30, 2026 would have been $4.73 and $4.70 per share basic and diluted, respectively, compared to adjusted earnings attributable to controlling shareholders of $4.23 and $4.20 per share basic and diluted for the quarter ended June 30, 2025. Usually, security analysts include Adjusted Net Income attributable to controlling shareholders in their determination of published estimates of earnings per share.
First Half 2026 Results: For the first half of 2026, the Company reported total net revenues of $112.3 million representing a 1.1% decrease over total net revenues of $113.6 million during the first half of 2025. On average, the Company owned and operated 21.0 vessels during the first half of 2026, earning an average time charter equivalent rate of $30,330 per day. For the same period of 2025 the Company owned and operated 22.83 vessels that earned on average $28,468 per day.
Voyage expenses, net for the first half of 2026 amounted to $0.4 million as compared to voyage expenses, net of $0.5 million for the same period of 2025. Voyage expenses for both periods related mainly to owners’ expenses incurred in various ports.
Vessel operating expenses for the first half of 2026 amounted to $22.9 million compared to $23.7 million for the same period of 2025. The decrease is due to the lower average number of vessels owned and operated in the first half of 2026 compared to the corresponding period of 2025 partly offset by the higher daily vessel operating expenses, mainly attributable to the increased cost of vessel supplies during the period, because of the war in the Middle East region.
In the first half of 2026 none of our vessels were drydocked. The total drydock cost for the period of $0.3 million relates to supplies performed for upcoming drydocks. In the same period of 2025 three of our vessels completed extensive repairs afloat for a total cost of approximately $3.5 million.
Vessel depreciation expense for the first half of 2026 was $13.4 million compared to $15.3 million during the same period of 2025, due to the decreased number of vessels in the Company’s fleet.
Related party management fees for the first half of 2026 increased to $3.95 million from $3.90 million for the same period of 2025. Despite the lower number of vessels in our fleet, this increase is due to the adjustment for inflation in the daily vessel management fee, effective from January 1, 2026, increasing it from 840 Euros to 875 Euros, as well as due to the unfavorable movement of the euro/dollar exchange rate.
Other operating expenses of $0.44 million recognized in the first half of 2026 refer to expenses incurred for the formation of the Partnership of $0.60 million, partly offset by an operating income from a settlement and closure of a claim with a charterer of $0.16 million. For the same period of 2025, the Company recognized other operating income of $0.12 million from an insurance claim.
General and administrative expenses increased to $3.5 million for the first half of 2026, as compared to $3.2 million for the same period of 2025, due to increased professional fees and increased cost for our stock incentive plan.
The results of the Company for the first half of 2025 include a $10.2 million gain on sale of M/V “Diamantis” that was completed in January 2025. No such case existed in the first half of 2026.
Interest and other financing costs for the first half of 2026 amounted to $5.7 million. Interest and other financing costs for the first half of 2025 amounted to $7.9 million. Capitalized interest charged on the cost of our newbuilding program was $0.1 million for the first six months of 2025. This decrease is due to the decreased amount of average outstanding debt and the decreased benchmark rates of our loans in the current period compared to the same period of 2025.
For the first half of 2026, the Company recognized a $0.1 million unrealized loss on its investments in equity securities. This was the result of an investment in equity securities with an initial cost of $20.0 million acquired in the first quarter of 2026 and fair valued at $19.9 million as of the end of the reporting period. This investment was made as part of the Company’s short-term cash and liquidity management strategy, in the context of which the Company also acquired debt securities of initial cost of $20.0 million and fair valued at $18.9 million as of June 30, 2026, classified as available-for-sale under US GAAP, for which an unrealized loss of $1.1 million was recorded in “Other comprehensive loss” for the period. None of these investments existed in the second quarter of 2025.
For the six months ended June 30, 2025 the Company recognized a $0.1 million realized gain and a $0.3 million unrealized loss for a total of $0.2 million net loss on its interest rate swap contract. The specific contract was closed within the year 2025 and no such case existed in the first half of 2026.
The Company reported net income for the period of $65.1 million and net income attributable to controlling shareholders of $65.7 million, for the first half of 2026, as compared to net income and net income attributable to controlling shareholders of $66.8 million for the same period of 2025. The net loss attributable to the non-controlling interest of $0.6 million in the first half of 2026 represents the loss attributable to the 49% ownership of the Partnership.
Adjusted EBITDA1 for the first half of 2026 was $81.0 million compared to $76.4 million achieved during the first half of 2025.
Basic and diluted earnings per share attributable to controlling shareholders for the first half of 2026 was $9.44 calculated on 6,962,481 basic and $9.39, calculated on 7,001,419 diluted weighted average number of shares outstanding, compared to $9.63 calculated on 6,935,298 basic and $9.60, calculated on 6,958,398 diluted weighted average number of shares outstanding, for the same period of 2025.
The adjusted earnings per share attributable to controlling shareholders for the six-month period ended June 30, 2026 would have been $9.45 and $9.40, basic and diluted, respectively, compared to adjusted earnings per share attributable to controlling shareholders of $7.99 basic and $7.97 diluted for the same period in 2025. As mentioned above, usually, security analysts include Adjusted Net Income attributable to controlling shareholders in their determination of published estimates of earnings per share.
Fleet Profile: The Euroseas Ltd. fleet profile as of August 13, 2026 is as follows:
Note: (*) TC denotes time charter. All dates listed are the earliest redelivery dates under each TC unless the contract rate is lower than the current market rate in which cases the latest redelivery date is assumed; vessels with the latest redelivery date shown are marked by (+).
(**) Charterer has the option to convert to a five-year charter at $32,500/day for the entire period. (***) The entity owning the vessel under construction is 51% owned by Euroseas Ltd. and 49% by NRP Investors.
Summary Fleet Data:
(1) Average number of vessels is the number of vessels that constituted the Company’s fleet for the relevant period, as measured by the sum of the number of calendar days each vessel was a part of the Company’s fleet during the period divided by the number of calendar days in that period.
(2) Calendar days. We define calendar days as the total number of days in a period during which each vessel in our fleet was in our possession including off-hire days associated with major repairs, drydockings or special or intermediate surveys or days of vessels in lay-up. Calendar days are an indicator of the size of our fleet over a period and affect both the amount of revenues and the amount of expenses that we record during that period.
(3) The scheduled off-hire days including vessels laid-up, vessels committed for sale or vessels that suffered unrepaired damages, are days associated with scheduled repairs, drydockings or special or intermediate surveys or days of vessels in lay-up, or vessels that were committed for sale or suffered unrepaired damages.
(4) Available days. We define available days as the Calendar days in a period net of scheduled off-hire days as defined above. We use available days to measure the number of days in a period during which vessels were available to generate revenues.
(5) Commercial off-hire days. We define commercial off-hire days as days a vessel is idle without employment.
(6) Operational off-hire days. We define operational off-hire days as days associated with unscheduled repairs or other off-hire time related to the operation of the vessels.
(7) Voyage days. We define voyage days as the total number of days in a period during which each vessel in our fleet was in our possession net of commercial and operational off-hire days. We use voyage days to measure the number of days in a period during which vessels actually generate revenues or are sailing for repositioning purposes.
(8) Fleet utilization. We calculate fleet utilization by dividing the number of our voyage days during a period by the number of our available days during that period. We use fleet utilization to measure a company’s efficiency in finding suitable employment for its vessels and minimizing the amount of days that its vessels are off-hire for reasons such as unscheduled repairs or days waiting to find employment.
(9) Fleet utilization, commercial. We calculate commercial fleet utilization by dividing our available days net of commercial off-hire days during a period by our available days during that period.
(10) Fleet utilization, operational. We calculate operational fleet utilization by dividing our available days net of operational off-hire days during a period by our available days during that period.
(11) Average time charter equivalent rate, or average TCE, is a metric of the average daily net revenue performance of our vessels. Our method of calculating average TCE is determined by dividing time charter revenue and voyage charter revenue, if any, net of voyage expenses by voyage days for the relevant time period. Voyage expenses primarily consist of port, canal and fuel costs that are unique to a particular voyage, which would otherwise be paid by the charterer under a time charter contract, or are related to repositioning the vessel for the next charter. Average TCE, which is a non-GAAP metric, provides additional meaningful information in conjunction with time charter revenue and voyage charter revenue, if any, the most directly comparable GAAP measure, because it assists our management in making decisions regarding the deployment and use of our vessels and because we believe that it provides useful information to investors regarding our financial performance. Average TCE is a standard shipping industry performance metric used primarily to compare period-to-period changes in a shipping company’s performance despite changes in the mix of charter types (i.e., spot voyage charters, time charters and bareboat charters) under which the vessels may be employed between the periods. Our definition of average TCE may not be comparable to that used by other companies in the shipping industry.
(12) We calculate daily vessel operating expenses, which includes crew costs, provisions, deck and engine stores, lubricating oil, insurance, maintenance and repairs and related party management fees by dividing vessel operating expenses and related party management fees by fleet calendar days for the relevant time period. Drydocking expenses are reported separately.
(13) Daily general and administrative expenses are calculated by us by dividing general and administrative expenses by fleet calendar days for the relevant time period.
(14) Total vessel operating expenses, or TVOE, is a measure of our total expenses associated with operating our vessels. TVOE is the sum of vessel operating expenses, related party management fees and general and administrative expenses; drydocking expenses are not included. Daily TVOE is calculated by dividing TVOE by fleet calendar days for the relevant time period.
(15) Daily drydocking expenses are calculated by us by dividing drydocking expenses by the fleet calendar days for the relevant period, Drydocking expenses include expenses during drydockings that would have been capitalized and amortized under the deferral method. Drydocking expenses could vary substantially from period to period depending on how many vessels underwent drydocking during the period. The Company expenses drydocking expenses as incurred.
Conference Call and Webcast: Today, Thursday, August 13, 2026 at 09:00 a.m. Eastern Time, the Company’s management will host a conference call and webcast to discuss the results.
Conference Call details: Participants should dial into the call 10 minutes before the scheduled time using the following numbers: 877 405 1226 (US Toll-Free Dial In) or +1 201 689 7823 (US and Standard International Dial In). Please quote “Euroseas” to the operator and/or conference ID13762072. Click here for additional participant International Toll -Free access numbers.
Alternatively, participants can register for the call using the call me option for a faster connection to join the conference call. You can enter your phone number and let the system call you right away. Click here for the call me option.
Audio Webcast – Slides Presentation: There will be a live and then archived webcast of the conference call and accompanying slides, available on the Company’s website. To listen to the archived audio file, visit our website http://www.euroseas.gr and click on Company Presentations under our Investor Relations page. Participants to the live webcast should register on the website approximately 10 minutes prior to the start of the webcast.
The slide presentation for the second quarter ended June 30, 2026, will also be available in PDF format minutes prior to the conference call and webcast, accessible on the company’s website (www.euroseas.gr) on the webcast page. Participants to the webcast can download the PDF presentation.
Adjusted EBITDA Reconciliation: Euroseas Ltd. considers Adjusted EBITDA to represent net income before interest and other financing costs, net, depreciation, loss on interest rate swap derivative, net, gain on sale of vessel, amortization of fair value of below market time charters acquired and unrealized (gain) / loss on investments in equity securities. Adjusted EBITDA does not represent and should not be considered as an alternative to net income, as determined by United States generally accepted accounting principles, or GAAP. Adjusted EBITDA is included herein because it is a basis upon which the Company assesses its financial performance and liquidity position and because the Company believes that this non-GAAP financial measure assists our management and investors by increasing the comparability of our performance from period to period by excluding the potentially disparate effects between periods of financial costs, loss on interest rate swaps, gain on sale of vessel, depreciation, amortization of below market time charters acquired and unrealized (gain) / loss on investments in equity securities. The Company’s definition of Adjusted EBITDA may not be the same as that used by other companies in the shipping or other industries.
Adjusted net income attributable to controlling shareholders and Adjusted earnings per share attributable to controlling shareholders Reconciliation:
Euroseas Ltd. considers Adjusted net income attributable to controlling shareholders to represent net income attributable to controlling shareholders before unrealized loss on derivative, gain on sale of vessel, amortization of below market time charters acquired, vessel depreciation on the portion of the consideration of vessels acquired with attached time charters allocated to below market time charters and unrealized (gain) / loss on investments in equity securities. Adjusted net income attributable to controlling shareholders and Adjusted earnings attributable to controlling shareholders per share are included herein because we believe they assist our management and investors by increasing the comparability of the Company’s fundamental performance from period to period by excluding the potentially disparate effects between periods of the aforementioned items, which may significantly affect results of operations between periods.
Adjusted net income attributable to controlling shareholders and Adjusted earnings attributable to controlling shareholders per share do not represent and should not be considered as an alternative to net income or earnings per share, as determined by GAAP. The Company’s definition of Adjusted net income attributable to controlling shareholders and Adjusted earnings attributable to controlling shareholders per share may not be the same as that used by other companies in shipping or other industries. Adjusted net income attributable to controlling shareholders and Adjusted earnings per share attributable to controlling shareholders are not adjusted for all non-cash income and expense items that are reflected in our statement of cash flows.
About Euroseas Ltd. Euroseas Ltd. was formed on May 5, 2005 under the laws of the Republic of the Marshall Islands to consolidate the ship owning interests of the Pittas family of Athens, Greece, which has been in the shipping business over the past 140 years. Euroseas trades on the NASDAQ Capital Market under the ticker ESEA.
Euroseas operates in the container shipping market. Euroseas’ operations are managed by Eurobulk Ltd., an ISO 9001:2008 and ISO 14001:2004 certified affiliated ship management company, which is responsible for the day-to-day commercial and technical management and operations of the vessels. Euroseas employs its vessels on spot and period charters and through pool arrangements.
The Company has a fleet of 21 vessels, including 15 Feeder containerships and 6 Intermediate containerships. Euroseas 21 containerships have a cargo capacity of 61,144 teu. After the delivery of twelve containership newbuilding containerships gradually from the third quarter of 2027 until the first quarter of 2029, Euroseas’ fleet will consist of 33 vessels with a total carrying capacity of 97,396 teu.
Forward Looking Statement This press release contains forward-looking statements (as defined in Section 27A of the Securities Act of 1933, as amended, and Section 21E of the Securities Exchange Act of 1934, as amended) concerning future events and the Company’s growth strategy and measures to implement such strategy; including expected vessel acquisitions and entering into further time charters. Words such as “expects,” “intends,” “plans,” “believes,” “anticipates,” “hopes,” “estimates,” and variations of such words and similar expressions are intended to identify forward-looking statements. Although the Company believes that the expectations reflected in such forward-looking statements are reasonable, no assurance can be given that such expectations will prove to have been correct. These statements involve known and unknown risks and are based upon a number of assumptions and estimates that are inherently subject to significant uncertainties and contingencies, many of which are beyond the control of the Company. Actual results may differ materially from those expressed or implied by such forward-looking statements. Factors that could cause actual results to differ materially include but are not limited to changes in the demand for containerships, competitive factors in the market in which the Company operates; risks associated with operations outside the United States; and other factors listed from time to time in the Company’s filings with the Securities and Exchange Commission. The Company expressly disclaims any obligations or undertaking to release publicly any updates or revisions to any forward-looking statements contained herein to reflect any change in the Company’s expectations with respect thereto or any change in events, conditions or circumstances on which any statement is based.
Mark Reichman, Managing Director, Equity Research Analyst, Natural Resources, Noble Capital Markets, Inc.
Refer to the full report for the price target, fundamental analysis, and rating.
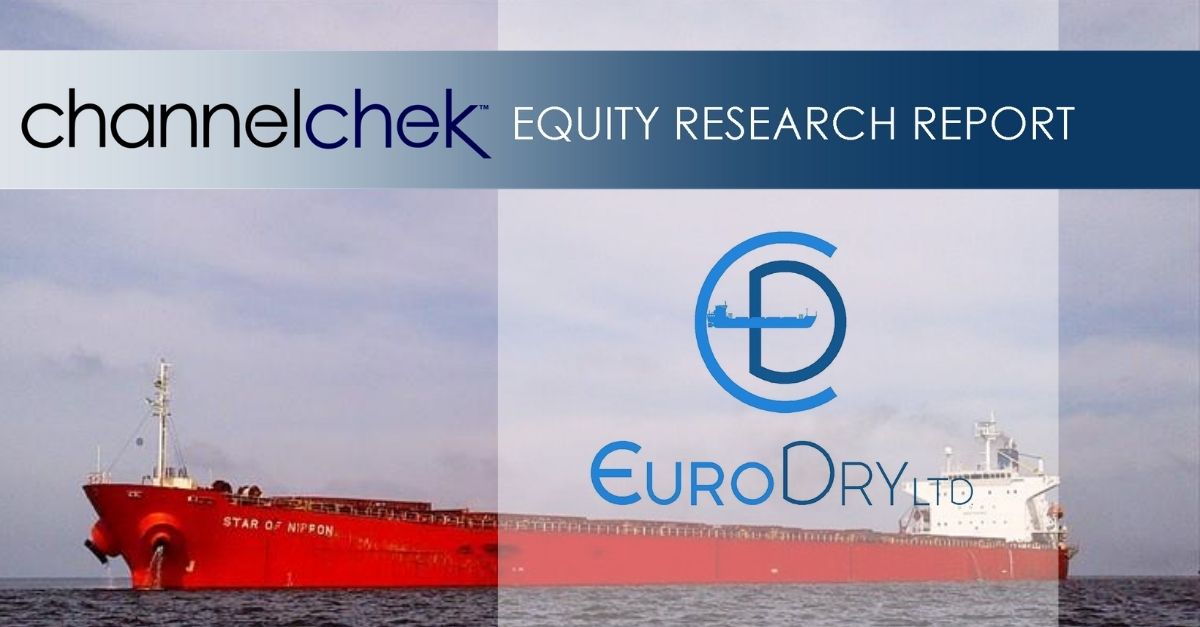
2Q 2026 Financial Results. EuroDry Ltd. reported strong 2Q 2026 financial performance compared to the prior year period, driven primarily by a favorable dry bulk market and higher time charter equivalent (TCE) rates. Total net revenues increased 57% year-over-year to $17.7 million, while average time charter equivalent rates more than doubled to $20,398 per day compared with $10,428 per day during the prior year period. Adjusted net income attributable to controlling shareholders amounted to $6.9 million, or $2.44 per diluted share, compared to a net loss of $3.0 million, or $(1.10) per diluted share, in the prior year period. Adjusted EBITDA increased to $11.7 million compared to $1.9 million during the prior year period, reflecting strong operating leverage as TCE rates increased. We had projected 2Q revenue and adj. EBITDA of $17.4 million and $9.3 million, respectively.
Strong Operational Quarter. Fleet utilization improved to 100.0% compared to 99.3% during the prior year period, with commercial utilization at 100%, reflecting minimal downtime and effective charter execution. Vessel operating expenses declined modestly to $6,608 per day compared to $6,785 per day during the prior year period, while total operating expenses decreased to $7,444 per day compared to $7,539 during the second quarter of 2025.
Equity Research is available at no cost to Registered users of Channelchek. Not a Member? Click ‘Join’ to join the Channelchek Community. There is no cost to register, and we never collect credit card information.
This Research is provided by Noble Capital Markets, Inc., a FINRA and S.E.C. registered broker-dealer (B/D).
*Analyst certification and important disclosures included in the full report. NOTE: investment decisions should not be based upon the content of this research summary. Proper due diligence is required before making any investment decision.
Mark Reichman, Managing Director, Equity Research Analyst, Natural Resources, Noble Capital Markets, Inc.
Refer to the full report for the price target, fundamental analysis, and rating.
Second Quarter FY 2026 Financial Results. RAIL generated a 2Q FY26 adjusted net loss to common stockholders of $821.0 thousand, or $(0.02) per share, compared to adjusted net income of $3.8 million, or $0.11 per share, during the prior year period. Gross margin as a percentage of revenue amounted to 5.5% compared to 15.0% in 2Q FY 2025. Revenue and rail car deliveries declined to $113.1 million and 927, compared to $118.6 million and 939 during the prior year period. Adj. EBITDA amounted to $1.2 million compared to $9.3 million in 2Q FY 2025.
Updated FY 2026 Guidance. Management updated its FY 2026 guidance. Railcar deliveries are expected to be in the range of 3,500 to 3,900, revenue in the range of $410 to $460 million, and adj. EBITDA in the range of $36 to $44 million. Prior guidance projected railcar deliveries in the range of 4,000 to 4,500, revenue in the range of $500 to $550 million, and adj. EBITDA in the range of $41 to $50 million.
Equity Research is available at no cost to Registered users of Channelchek. Not a Member? Click ‘Join’ to join the Channelchek Community. There is no cost to register, and we never collect credit card information.
This Company Sponsored Research is provided by Noble Capital Markets, Inc., a FINRA and S.E.C. registered broker-dealer (B/D).
*Analyst certification and important disclosures included in the full report. NOTE: investment decisions should not be based upon the content of this research summary. Proper due diligence is required before making any investment decision.
Joe Gomes, CFA, Managing Director, Equity Research Analyst, Generalist , Noble Capital Markets, Inc.
Refer to the full report for the price target, fundamental analysis, and rating.
Overview. CVG delivered year-over-year revenue growth across all three segments, reflecting ongoing efforts to reduce end-market concentration in cyclical North American Class 8 truck exposure through geographic and end-market diversification. While there are still macroeconomic uncertainties to monitor, CVG is hitting its stride as new business wins are ramping coincidentally with a recovery in key end markets.
2Q26 Results. CVG reported 2Q26 revenue of $195.2 million, up from $172 million in the year-ago period, a 13.5% increase, driven by increased customer demand in international markets and the ramp of previously awarded new business wins across all three operating segments. We were at $173 million. Gross margin improved both y-o-y and sequentially to 12.9%. One-time items impacted the reported bottom line. On an adjusted basis, CVG reported a net loss of $0.13/sh, up from a loss of $0.09/sh last year, reflecting increased incentive comp expense in 2Q26 over 2Q25.
Equity Research is available at no cost to Registered users of Channelchek. Not a Member? Click ‘Join’ to join the Channelchek Community. There is no cost to register, and we never collect credit card information.
This Company Sponsored Research is provided by Noble Capital Markets, Inc., a FINRA and S.E.C. registered broker-dealer (B/D).
*Analyst certification and important disclosures included in the full report. NOTE: investment decisions should not be based upon the content of this research summary. Proper due diligence is required before making any investment decision.
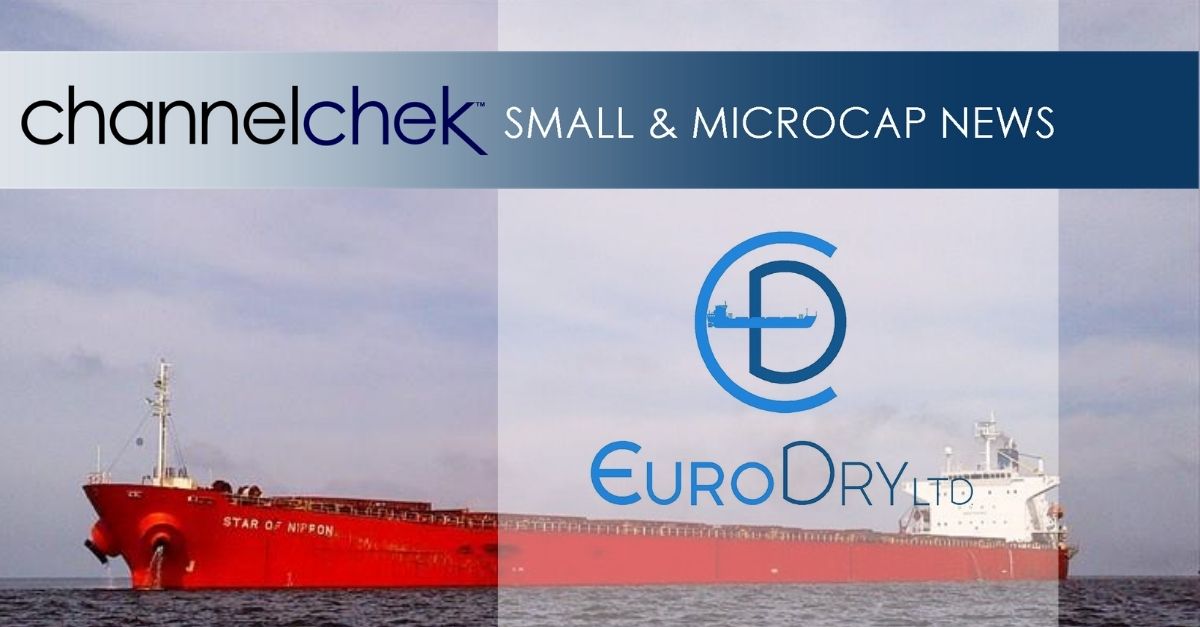
ATHENS, Greece, July 31, 2026 (GLOBE NEWSWIRE) — EuroDry Ltd. (NASDAQ: EDRY, the “Company” or “EuroDry”), an owner and operator of drybulk vessels and provider of seaborne transportation for drybulk cargoes, announced today that it will release its financial results for the second quarter ended June 30, 2026, on August 6, 2026, before market opens in New York.
On the same day, Thursday, August 6, 2026, at 9:30 a.m. Eastern Time, the Company’s management will host a conference call and webcast to discuss the results.
ConferenceCalldetails: Participants should dial into the call 10 minutes before the scheduled time using the following numbers: 800-717-1738 (US Toll-Free Dial In) or +1 646-307-1865 (US and Standard International Dial In). Please quote “EuroDry” to the operator and/or conference ID 13762074.
Alternatively, participants can register for the call using the call me option for a faster connection to join the conference call. You can enter your phone number and let the system call you right away. Click here for the call me option.
AudioWebcast-SlidesPresentation: There will be a live and then archived webcast of the conference call and accompanying slides, available on the Company’s website. To listen to the archived audio file, visit our website http://www.eurodry.gr and click on Company Presentations under our Investor Relations page. Participants to the live webcast should register on the website approximately 10 minutes prior to the start of the webcast.
The slide presentation for the second quarter ended June 30, 2026, will also be available in PDF format 10 minutes prior to the conference call and webcast, accessible on the company’s website (www.eurodry.gr) on the webcast page. Participants to the webcast can download the PDF presentation.
AboutEuroDryLtd. EuroDry Ltd. was formed on January 8, 2018, under the laws of the Republic of the Marshall Islands to consolidate the drybulk fleet of Euroseas Ltd into a separate listed public company. EuroDry was spun off from Euroseas Ltd on May 30, 2018; it trades on the NASDAQ Capital Market under the ticker EDRY.
EuroDry operates in the dry cargo, drybulk shipping market. EuroDry’s operations are managed by Eurobulk Ltd., an ISO 9001:2008 and ISO 14001:2004 certified affiliated ship management company and Eurobulk (Far East) Ltd. Inc., which are responsible for the day-to-day commercial and technical management and operations of the vessels. EuroDry employs its vessels on spot and period charters.
The Company has a fleet of 11 vessels, including 3 Panamax drybulk carriers, 5 Ultramax drybulk carriers, 2 Kamsarmax drybulk carriers and 1 Supramax drybulk carrier. EuroDry’s 12 drybulk carriers have a total cargo capacity of 766,420 dwt. After the delivery of two Ultramax vessels in 2027 and the delivery of the two Kamsarmax vessels in 2028, the Company’s fleet will consist of 15 vessels with a total carrying capacity of 1,050,420 dwt.
Mark Reichman, Managing Director, Equity Research Analyst, Natural Resources, Noble Capital Markets, Inc.
Refer to the full report for the price target, fundamental analysis, and rating.
Record Second Quarter 2026 Financial Results. Seanergy reported revenue, adj. EBITDA, and adj. EPS of $55.7 million, $41.5 million, and $1.32, respectively, compared to $37.5 million, $18.3 million, and $0.18 during the prior year period. We had projected revenue, adj. EBITDA, and adj. EPS of $54.9 million, $38.4 million, and $1.15, respectively. Second quarter financial results reflected both materially higher time charter equivalent (TCE) rates compared to the prior year quarter and lower-than-expected interest and finance costs relative to our estimates.
Updating Estimates. We have increased our FY 2026 revenue, adj. EBITDA, and adj. EPS estimates to $205.9 million, $134.2 million, and $3.70, respectively, compared to our prior estimates of $203.2 million, $131.3 million, and $3.50. Our revised estimates reflect higher time charter equivalent (TCE) rates and fewer off-hire days.
Equity Research is available at no cost to Registered users of Channelchek. Not a Member? Click ‘Join’ to join the Channelchek Community. There is no cost to register, and we never collect credit card information.
This Company Sponsored Research is provided by Noble Capital Markets, Inc., a FINRA and S.E.C. registered broker-dealer (B/D).
*Analyst certification and important disclosures included in the full report. NOTE: investment decisions should not be based upon the content of this research summary. Proper due diligence is required before making any investment decision.