Mark Reichman, Managing Director, Equity Research Analyst, Natural Resources, Noble Capital Markets, Inc.
Refer to the full report for the price target, fundamental analysis, and rating.
1Q 2026 Financial Results. EuroDry Ltd. reported an improvement in 1Q 2026 financial performance compared to the prior year period, driven primarily by stronger dry bulk charter markets and improved fleet utilization. Total net revenues increased 38.9% year-over-year to $12.8 million, while average time charter equivalent rates more than doubled to $14,416 per day from $7,167 per day during the prior year period. Adjusted net income attributable to controlling shareholders amounted to $330.8 thousand, or $0.12 per share, compared to a net loss of $5.7 million, or $(2.07) per share, in the prior year period. Adjusted EBITDA increased to $4.9 million compared to a loss of $1.0 million during the prior year period, reflecting strong operating leverage as freight rates recovered.
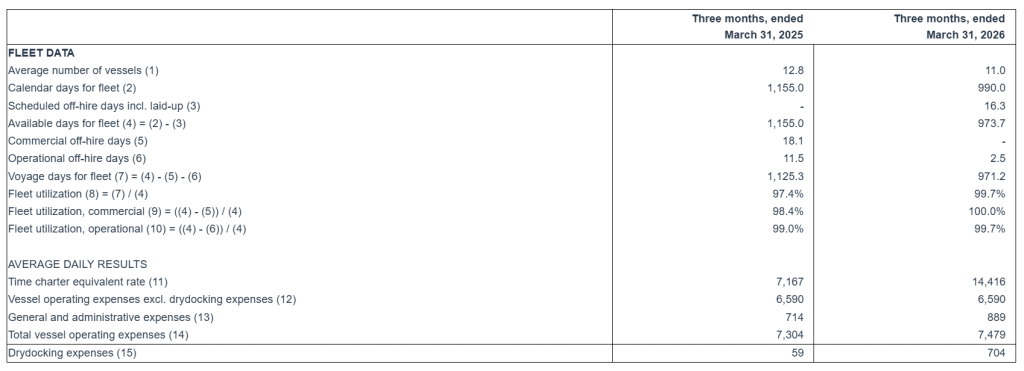
Strong Operational Quarter. Fleet utilization improved to 99.7%, with commercial utilization at 100%, reflecting minimal downtime and effective charter execution. Vessel operating expenses declined year-over-year due to a smaller average fleet size, while daily operating costs remained stable despite inflation. Meanwhile, dry bulk market conditions strengthened in April and May 2026, with one-year Ultramax and Kamsarmax charter rates nearing or surpassing $20,000 per day, supporting improved earnings prospects for the coming quarters.
Equity Research is available at no cost to Registered users of Channelchek. Not a Member? Click ‘Join’ to join the Channelchek Community. There is no cost to register, and we never collect credit card information.
This Research is provided by Noble Capital Markets, Inc., a FINRA and S.E.C. registered broker-dealer (B/D).
*Analyst certification and important disclosures included in the full report. NOTE: investment decisions should not be based upon the content of this research summary. Proper due diligence is required before making any investment decision.
ATHENS, Greece, May 20, 2026 (GLOBE NEWSWIRE) — EuroDry Ltd. (NASDAQ: EDRY, the “Company” or “EuroDry”), an owner and operator of drybulk vessels and provider of seaborne transportation for drybulk cargoes, announced today its results for the three-month period ended March 31, 2026.
First Quarter 2026 Highlights:
Total net revenues of $12.8 million.
Net income attributable to controlling shareholders, of $0.26 million or $0.09 earnings per share attributable to controlling shareholders basic and diluted.
Adjusted net income1 attributable to controlling shareholders for the quarter of $0.33 million or $0.12 earnings per share attributable to controlling shareholders basic and diluted, which represents the net income attributable to controlling shareholders excluding the unrealized loss on derivatives.
Adjusted EBITDA1 was $4.9 million.
An average of 11.0 vessels were owned and operated during the first quarter of 2026 earning an average time charter equivalent rate of $14,416 per day. Refer to a subsequent section of the Press Release for the definition and method of calculation of the time charter equivalent rate.
To date, about $5.6 million has been used to repurchase 349,330 shares of the Company, under our share repurchase plan of up to $10 million, announced in August 2022. The Board approved the continuation of the share repurchase plan for a further year in August 2025 and will review it again after a period of twelve months.
____________________________ 1Adjusted EBITDA, Adjusted net (loss) / income attributable to controlling shareholders and Adjusted (loss) / earnings per share attributable to controlling shareholders are not recognized measurements under US GAAP (GAAP) and should not be used in isolation or as a substitute for EuroDry’s financial results presented in accordance with GAAP. Refer to a subsequent section of the Press Release for the definitions and reconciliation of these measurements to the most directly comparable financial measures calculated and presented in accordance with GAAP.
Recent developments
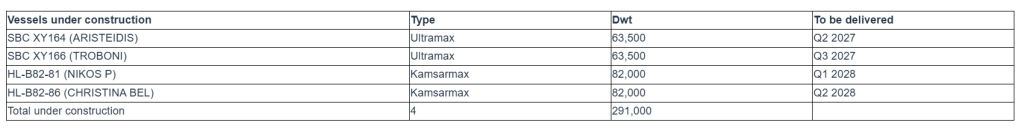
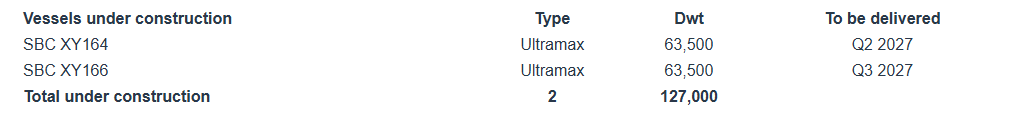
The Company has signed two contracts with Hengli Shipbuilding (Dalian) for the construction of two 82,000 DWT Kamsarmax bulk carriers. Both vessels are eco and are built to EEDI phase 3 design standard; they are scheduled to be delivered during the first and second quarters of 2028. The total consideration for the two newbuilding contracts is approximately $74.0 million and will be financed with a combination of debt and equity. The contracts are conditional upon receiving a refund guarantee from a bank acceptable to the Company.
Aristides Pittas, Chairman and CEO of EuroDry commented: “During the first quarter of 2026, a seasonally slow quarter, the drybulk market gave up very little ground as compared to the last quarter of last year. Additionally in April and May 2026, the market has firmed across the board with one-year time charter rates and trip earnings flirting and reaching $20,000 per day for both Ultramaxes and Kamsarmaxes.
“Our profitability during the first quarter fully reflected the market conditions with our earnings dropping compared to the fourth quarter in consequence of the easing of market rates during the quarter. But as the market has increased during the last month and a half, so has our profitability, a development that we expect to be reflected in next quarter’s results.
“Whilst the global fleet is aging and the need to provide the market with newer and more efficient vessels is becoming apparent, we see that prices of modern secondhand vessels have significantly increased. Under the circumstances we believe that newbuilding orders which can be placed at prices below modern secondhand ship prices present a better opportunity. We have therefore decided to expand our newbuilding program to include two Kamsarmax vessels to complement the two Ultramaxes we had ordered earlier. After the delivery of all four vessels between Q2 2027 and Q2 2028, our fleet will consist almost entirely of modern eco vessels. As, I believe, we have demonstrated over the past eight years as an independent public company, we invest in a disciplined manner with the sole focus on identifying accretive opportunities for our shareholders and we intend to continue with the same philosophy.”
Tasos Aslidis, Chief Financial Officer of EuroDry commented: “Our net revenues for the first quarter of 2026 were higher by 38.9% as compared to the first quarter of 2025. This is primarily driven by the increase of 101.1% in average time charter equivalent rates our vessels earned during the current quarter as compared to the first quarter of 2025, partly offset by the decreased average number of vessels owned and operated in the current period compared to the same period of 2025.”
“Vessel operating expenses were $5.5 million for the first quarter of 2026 as compared to $6.6 million for the same period of 2025. The decrease is mainly attributable to the decreased average number of vessels owned and operated in the first quarter of 2026 compared to the corresponding period in 2025.“
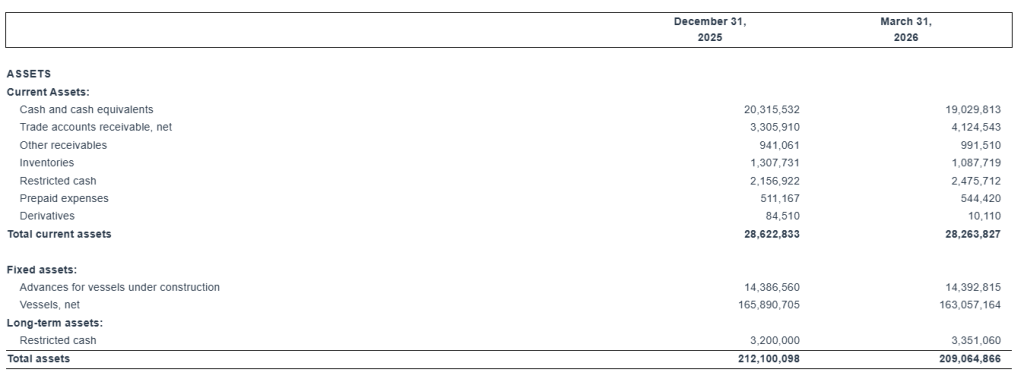
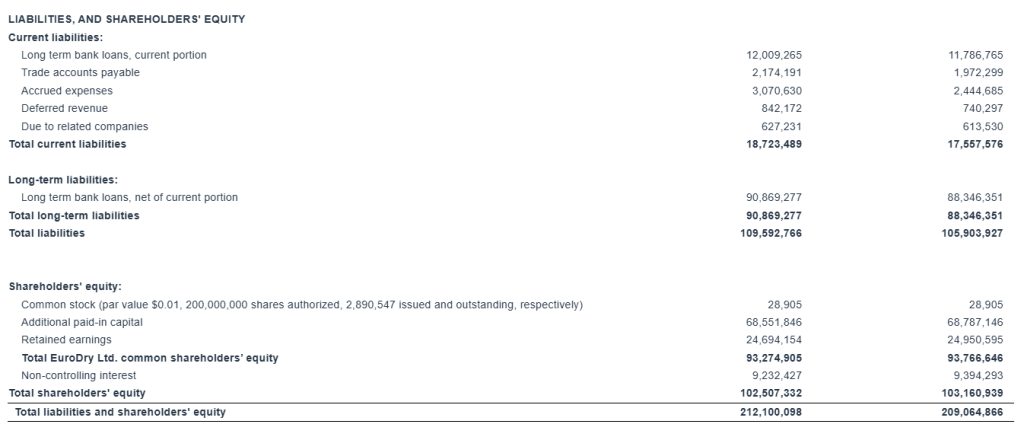
“Adjusted EBITDA during the first quarter of 2026 was $4.9 million compared to $(1.0) million achieved for the first quarter of last year. As of March 31, 2026, our outstanding debt (excluding the unamortized loan fees) was $100.9 million versus restricted and unrestricted cash of approximately $24.9 million.”
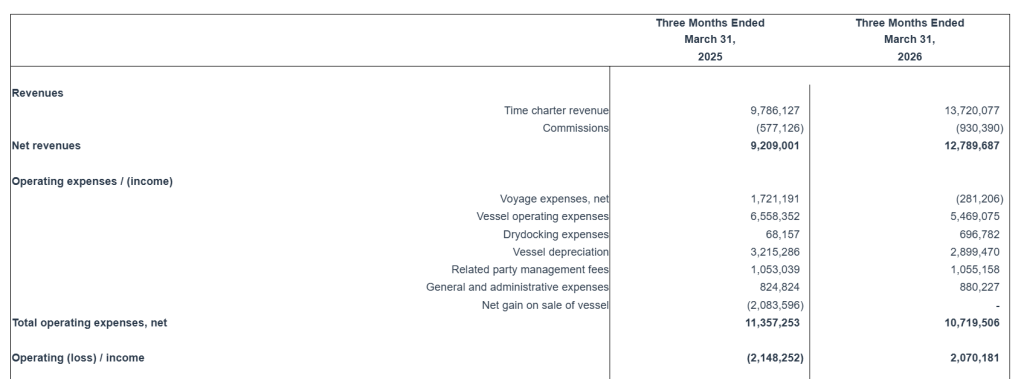
First Quarter 2026 Results: For the first quarter of 2026, the Company reported total net revenues of $12.8 million representing a 38.9% increase over total net revenues of $9.2 million during the first quarter of 2025, which was the result of the increased time charter rates our vessels earned during the first quarter of 2026, partly offset by the decreased average number of vessels owned and operated during the first quarter of 2026, compared to the same period of 2025. On average, 11.0 vessels were owned and operated during the first quarter of 2026 earning an average time charter equivalent rate of $14,416 per day compared to 12.8 vessels in the same period of 2025 earning on average $7,167 per day.
For the first quarter of 2026, a gain on bunkers resulted in positive voyage expenses of $0.3 million compared to voyage expenses of $1.7 million in the first quarter of 2025 that mainly related to vessels repositioning between charters and expenses during operational off-hire time.
Vessel operating expenses decreased to $5.5 million for the first quarter of 2026 from $6.6 million in the same period of 2025. The decrease is mainly attributable to the decreased average number of vessels owned and operated in the first quarter of 2026 compared to the corresponding period in 2025.
In the first quarter of 2026, one of our vessels completed its special survey with drydock for a total cost of $0.7 million. In the first quarter of 2025 one of our vessels completed its intermediate survey in water, for a total cost of $0.1 million.
Depreciation expense for the first quarter of 2026 was $2.9 million compared to $3.2 million for the same period of 2025 as a result of the lower number of vessels owned and operated in the first quarter of 2026.
Related party management fees for the period were $1.1 million remaining at the same level compared to the same period of 2025. This was the result of the decreased number of vessels owned and operated in the first quarter of 2026, offset by the adjustment for inflation in the daily vessel management fee, effective from January 1, 2026, increasing it from 850 Euros to 875 Euros, as well as by the unfavorable movement of the euro/dollar exchange rate during the period.
General and administrative expenses were $0.9 million for the first quarter of 2026, slightly increased compared to the same period of last year.
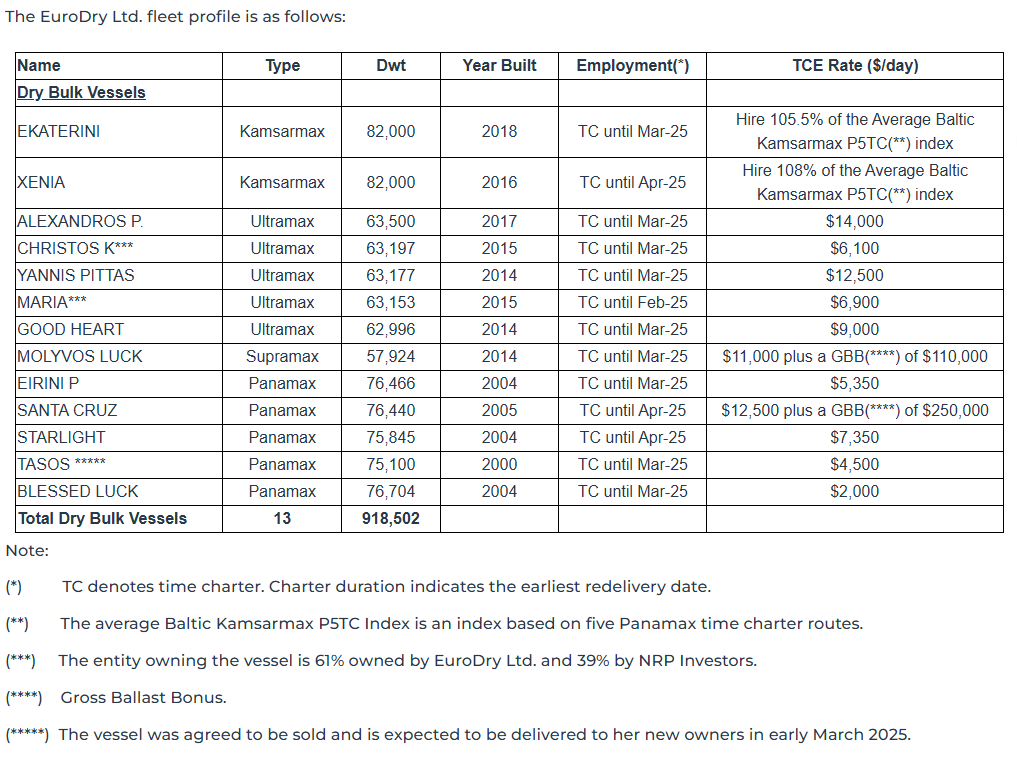
On January 29, 2025, the Company signed an agreement to sell M/V Tasos, a 75,100 dwt drybulk vessel, built in 2000, for demolition, for approximately $5 million. The vessel was delivered to its buyers, an unaffiliated third party, on March 17, 2025, resulting in a gain on sale of $2.1 million. No case of vessel sale exists within the first quarter of 2026.
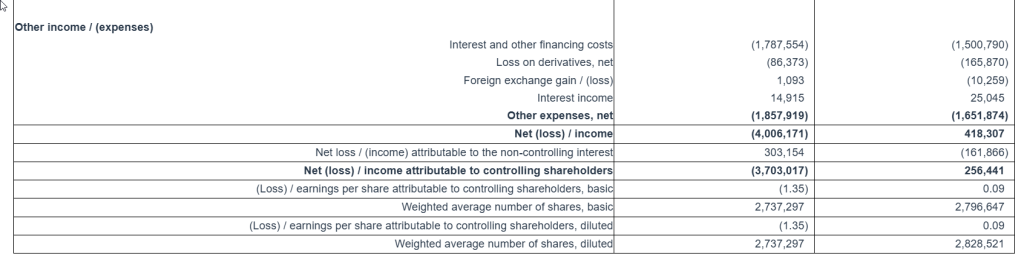
Interest and other financing costs for the first quarter of 2026 decreased to $1.5 million as compared to $1.8 million for the same period of 2025. Interest expense during the first quarter of 2026 was lower mainly due to the decreased benchmark rates of our loans and the decreased average debt during the first quarter of 2026, as compared to the same period of last year.
For the three months ended March 31, 2026, the Company recognized a $0.07 million unrealized loss and a $0.09 million realized loss on forward freight agreement contracts. For the three months ended March 31, 2025, the Company recognized a $0.13 million unrealized loss and a $0.04 million realized gain on one interest rate swap.
The Company reported a net income for the period of $0.4 million and a net income attributable to controlling shareholders of $0.3 million, as compared to a net loss of $4.0 million and a net loss attributable to controlling shareholders of $3.7 million for the same period of 2025. The net income attributable to the non-controlling interest of $0.2 million in the first quarter of 2026 represents the income attributable to the 39% ownership of the entities owning the M/V Christos K and M/V Maria represented by NRP Project Finance AS (“NRP investors”) (the “Partnership”).
Adjusted EBITDA for the first quarter of 2026 was $4.9 million compared to $(1.0) million achieved during the first quarter of 2025.
Basic and diluted earnings per share attributable to controlling shareholders for the first quarter of 2026 were $0.09, calculated on 2,796,647 and 2,828,521 basic and diluted weighted average number of shares outstanding, respectively, compared to a basic and diluted loss per share attributable to controlling shareholders of $1.35 for the first quarter of 2025, calculated on 2,737,297 basic and diluted weighted average number of shares outstanding.
Excluding the effect on the net (loss) / income attributable to controlling shareholders for the quarter of the unrealized loss on derivatives and the net gain on sale of vessel (if any), the adjusted earnings attributable to controlling shareholders for the quarter ended March 31, 2026 would have been $0.12 per share basic and diluted, compared to an adjusted loss of $2.07 per share, basic and diluted, attributable to controlling shareholders for the quarter ended March 31, 2025. Usually, security analysts do not include the above item in their published estimates of earnings per share.
Fleet Profile:
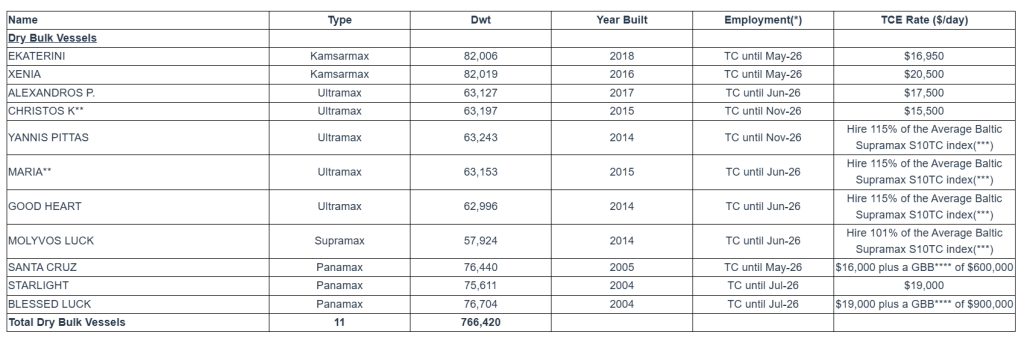
The EuroDry Ltd. fleet profile is as follows:
Note: (*) TC denotes time charter. Charter duration indicates the earliest redelivery date. (**) The entity owning the vessel is 61% owned by EuroDry and 39% by NRP Investors. (***) The average Baltic Supramax S10TC Index is an index based on ten Supramax time charter routes. (****) Gross Ballast Bonus (GBB), refers to the payments made by the charterer which serve as compensation for the ballast trip of the vessel from the last port of discharge to the delivery port.
Summary Fleet Data:
(1) Average number of vessels is the number of vessels that constituted the Company’s fleet for the relevant period, as measured by the sum of the number of calendar days each vessel was a part of the Company’s fleet during the period divided by the number of calendar days in that period.
(2) Calendar days. We define calendar days as the total number of days in a period during which each vessel in our fleet was owned by us including off-hire days associated with major repairs, drydockings or special or intermediate surveys or days of vessels in lay-up. Calendar days are an indicator of the size of our fleet over a period and affect both the amount of revenues and the amount of expenses that we record during that period.
(3) The scheduled off-hire days including vessels laid-up are days associated with scheduled repairs, drydockings or special or intermediate surveys or days of vessels in lay-up.
(4) Available days. We define available days as the total number of Calendar days in a period net of scheduled off-hire days incl. laid up. We use available days to measure the number of days in a period during which vessels were available to generate revenues.
(5) Commercial off-hire days. We define commercial off-hire days as days a vessel is idle without employment.
(6) Operational off-hire days. We define operational off-hire days as days associated with unscheduled repairs or other off-hire time related to the operation of the vessels.
(7) Voyage days. We define voyage days as the total number of days in a period during which each vessel in our fleet was in our possession net of commercial and operational off-hire days but including days our vessels were sailing for repositioning. We use voyage days to measure the number of days in a period during which vessels actually generate revenues or are sailing for repositioning purposes.
(8) Fleet utilization. We calculate fleet utilization by dividing the number of our voyage days during a period by the number of our available days during that period. We use fleet utilization to measure a company’s efficiency in finding suitable employment for its vessels and minimizing the amount of days that its vessels are off-hire for reasons such as unscheduled repairs or days waiting to find employment.
(9) Fleet utilization, commercial. We calculate commercial fleet utilization by dividing our available days net of commercial off-hire days during a period by our available days during that period.
(10) Fleet utilization, operational. We calculate operational fleet utilization by dividing our available days net of operational off-hire days during a period by our available days during that period.
(11) Average time charter equivalent rate, or average TCE, is a measure of the average daily net revenue performance of our vessels. Our method of calculating average TCE is determined by dividing time charter revenue and voyage charter revenue, if any, net of voyage expenses by voyage days for the relevant time period. Voyage expenses primarily consist of port, canal and fuel costs that are unique to a particular voyage, which would otherwise be paid by the charterer under a time charter contract or are related to repositioning the vessel for the next charter. Average TCE provides additional meaningful information in conjunction with time charter revenue and voyage charter revenue, if any, the most directly comparable GAAP measure, because it assists our management in making decisions regarding the deployment and use of our vessels and because we believe that it provides useful information to investors regarding our financial performance. Average TCE is a standard shipping industry performance measure used primarily to compare period-to-period changes in a shipping company’s performance despite changes in the mix of charter types (i.e., spot voyage charters, time charters, pool agreements and bareboat charters) under which the vessels may be employed between the periods. Our definition of average TCE may not be comparable to that used by other companies in the shipping industry.
(12) We calculate daily vessel operating expenses, which include crew costs, provisions, deck and engine stores, lubricating oil, insurance, maintenance and repairs and related party management fees by dividing vessel operating expenses and related party management fees by fleet calendar days for the relevant time period. Drydocking expenses are reported separately.
(13) Daily general and administrative expense is calculated by us by dividing general and administrative expenses by fleet calendar days for the relevant time period.
(14) Total vessel operating expenses, or TVOE, is a measure of our total expenses associated with operating our vessels. We compute TVOE as the sum of vessel operating expenses, related party management fees and general and administrative expenses; drydocking expenses are not included. Daily TVOE is calculated by dividing TVOE by fleet calendar days for the relevant time period.
(15) Daily drydocking expenses is calculated by us by dividing drydocking expenses by the fleet calendar days for the relevant period. Drydocking expenses include expenses during drydockings that would have been capitalized and amortized under the deferral method. Drydocking expenses could vary substantially from period to period depending on how many vessels underwent drydocking during the period. The Company expenses drydocking expenses as incurred.
Conference Call and Webcast: Today, May 20, 2026 at 9:00 a.m. Eastern Time, the Company’s management will host a conference call and webcast to discuss the results.
ConferenceCalldetails: Participants should dial into the call 10 minutes before the scheduled time using the following numbers: 877 405 1226 (US Toll-Free Dial In) or +1 201 689 7823 (US and Standard International Dial In). Please quote “EuroDry” to the operator and/or conference ID 13760747. Click here for additional participant International Toll -Free access numbers.
Alternatively, participants can register for the call using the call me option for a faster connection to join the conference call. You can enter your phone number and let the system call you right away. Click here for the call me option.
AudioWebcast-SlidesPresentation: There will be a live and then archived webcast of the conference call and accompanying slides, available on the Company’s website. To listen to the archived audio file, visit our website http://www.eurodry.gr and click on Company Presentations under our Investor Relations page. Participants to the live webcast should register on the website approximately 10 minutes prior to the start of the webcast.
The slide presentation for the first quarter ended March 31, 2026, will also be available in PDF format 10 minutes prior to the conference call and webcast, accessible on the company’s website (www.eurodry.gr) on the webcast page. Participants to the webcast can download the PDF presentation.
EuroDry Ltd. Unaudited Consolidated Condensed Statements of Operations (All amounts expressed in U.S. Dollars – except number of shares)
EuroDry Ltd. Unaudited Consolidated Condensed Statements of Operations (All amounts expressed in U.S. Dollars – except number of shares)
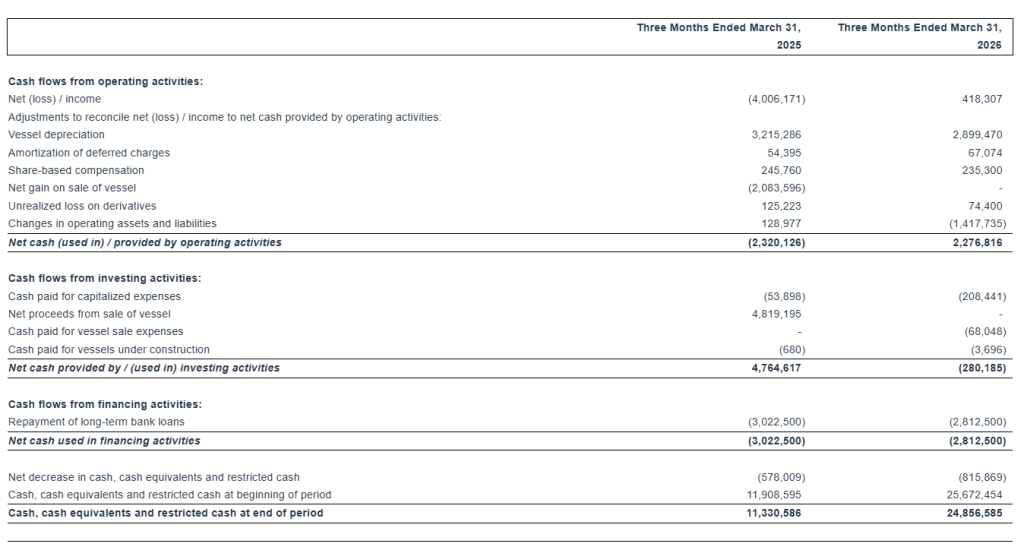
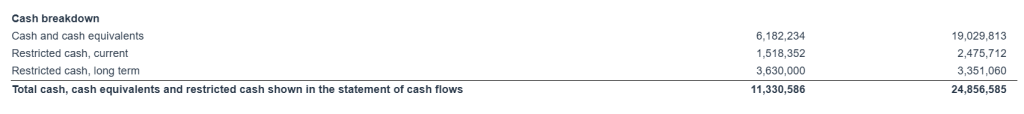
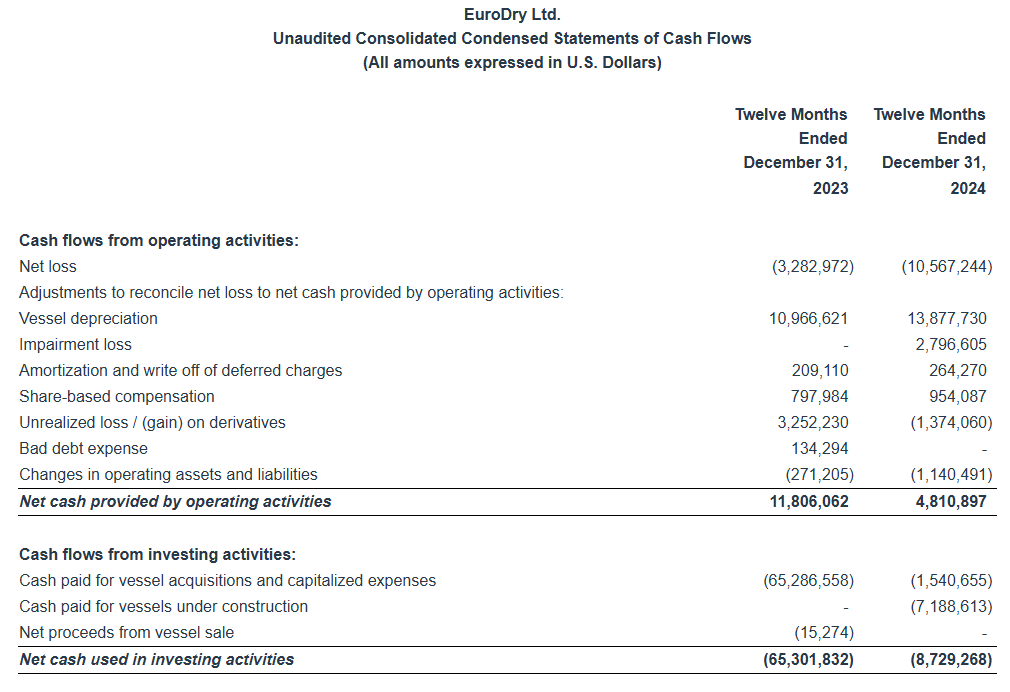
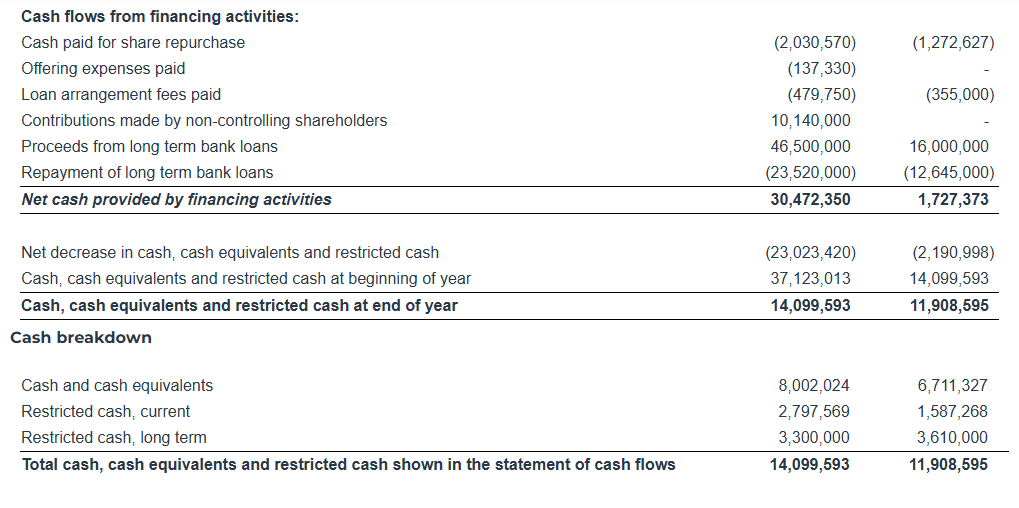
EuroDry Ltd. Unaudited Consolidated Condensed Statements of Cash Flows (All amounts expressed in U.S. Dollars)
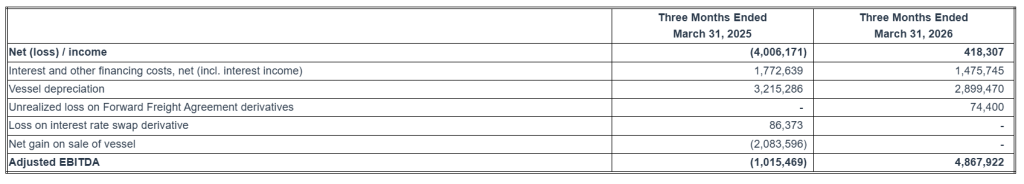
EuroDry Ltd. Reconciliation of Net (loss) / income to Adjusted EBITDA (All amounts expressed in U.S. Dollars)
Adjusted EBITDA Reconciliation: EuroDry Ltd. considers Adjusted EBITDA to represent net (loss) / income before interest and other financing costs, income taxes, vessel depreciation, unrealized loss on Forward Freight Agreements (“FFAs”), loss on interest rate swap derivative and net gain on sale of vessel. Adjusted EBITDA does not represent and should not be considered as an alternative to net loss, as determined by United States generally accepted accounting principles, or GAAP. Adjusted EBITDA is included herein because it is a basis upon which the Company assesses its financial performance because the Company believes that this non-GAAP financial measure assists our management and investors by increasing the comparability of our performance from period to period by excluding the potentially disparate effects between periods of, financial costs, unrealized loss on FFAs, loss on interest rate swap derivative, vessel depreciation and net gain on sale of vessel. The Company’s definition of Adjusted EBITDA may not be the same as that used by other companies in the shipping or other industries.
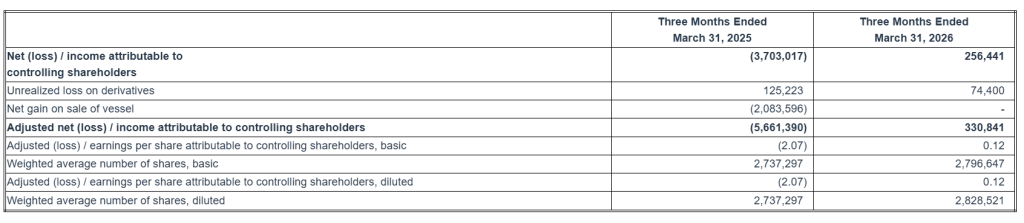
EuroDry Ltd. Reconciliation of Net (loss) / income attributable to controlling shareholders to Adjusted net (loss) / income attributable to controlling shareholders (All amounts expressed in U.S. Dollars – except share data and number of shares)
Adjusted net (loss) / income attributable to controlling shareholders and Adjusted (loss) / earnings per share attributable to controlling shareholders Reconciliation:
EuroDry Ltd. considers Adjusted net (loss) / income attributable to controlling shareholders, to represent net (loss) / income before unrealized loss on derivatives, which includes FFAs and interest rate swaps, and net gain on sale of vessel. Adjusted net (loss) / income attributable to controlling shareholders and Adjusted (loss) / earnings per share attributable to controlling shareholders is included herein because we believe they assist our management and investors by increasing the comparability of the Company’s fundamental performance from period to period by excluding the potentially disparate effects between periods of the abovementioned items, which may significantly affect results of operations between periods.
Adjusted net (loss) / income attributable to controlling shareholders and Adjusted (loss) / earnings per share attributable to controlling shareholders do not represent and should not be considered as an alternative to net (loss) / income attributable to controlling shareholders or (loss) / earnings per share attributable to controlling shareholders, as determined by GAAP. The Company’s definition of Adjusted net (loss) / income attributable to controlling shareholders and Adjusted (loss) / earnings per share attributable to controlling shareholders may not be the same as that used by other companies in the shipping or other industries. Adjusted net (loss) / income attributable to controlling shareholders and Adjusted (loss) / earnings per share attributable to controlling shareholders are not adjusted for all non-cash income and expense items that are reflected in our statement of cash flows.
About EuroDry Ltd. EuroDry Ltd. was formed on January 8, 2018 under the laws of the Republic of the Marshall Islands to consolidate the drybulk fleet of Euroseas Ltd into a separate listed public company. EuroDry was spun-off from Euroseas Ltd on May 30, 2018; it trades on the NASDAQ Capital Market under the ticker EDRY.
EuroDry operates in the dry cargo, drybulk shipping market. EuroDry’s operations are managed by Eurobulk Ltd., an ISO 9001:2008 and ISO 14001:2004 certified affiliated ship management company and Eurobulk (Far East) Ltd. Inc., which are responsible for the day-to-day commercial and technical management and operations of the vessels. EuroDry employs its vessels on spot and period charters.
The Company has a fleet of 11 vessels, including 3 Panamax drybulk carriers, 5 Ultramax drybulk carriers, 2 Kamsarmax drybulk carriers and 1 Supramax drybulk carrier. EuroDry’s 12 drybulk carriers have a total cargo capacity of 766,420 dwt. After the delivery of two Ultramax vessels in 2027 and the delivery of the two Kamsarmax vessels in 2028, the Company’s fleet will consist of 15 vessels with a total carrying capacity of 1,050,420 dwt.
Forward Looking Statement This press release contains forward-looking statements (as defined in Section 27A of the Securities Act of 1933, as amended, and Section 21E of the Securities Exchange Act of 1934, as amended) concerning future events and the Company’s growth strategy and measures to implement such strategy; including expected vessel acquisitions and entering into further time charters. Words such as “expects,” “intends,” “plans,” “believes,” “anticipates,” “hopes,” “estimates,” and variations of such words and similar expressions are intended to identify forward-looking statements. Although the Company believes that the expectations reflected in such forward-looking statements are reasonable, no assurance can be given that such expectations will prove to have been correct. These statements involve known and unknown risks and are based upon a number of assumptions and estimates that are inherently subject to significant uncertainties and contingencies, many of which are beyond the control of the Company. Actual results may differ materially from those expressed or implied by such forward-looking statements. Factors that could cause actual results to differ materially include, but are not limited to changes in the demand for dry bulk vessels, competitive factors in the market in which the Company operates; risks associated with operations outside the United States; and other factors listed from time to time in the Company’s filings with the Securities and Exchange Commission. The Company expressly disclaims any obligations or undertaking to release publicly any updates or revisions to any forward-looking statements contained herein to reflect any change in the Company’s expectations with respect thereto or any change in events, conditions or circumstances on which any statement is based.
ATHENS, Greece, May 18, 2026 (GLOBE NEWSWIRE) — EuroDry Ltd. (NASDAQ: EDRY, the “Company” or “EuroDry”), an owner and operator of drybulk vessels and provider of seaborne transportation for drybulk cargoes, announced today that it will release its financial results for the first quarter ended March 31, 2026, on May 20, 2026 before market opens in New York.
On the same day, Wednesday, May 20, 2026, at 9:00 a.m. Eastern Time, the Company’s management will host a conference call and webcast to discuss the results.
ConferenceCalldetails: Participants should dial into the call 10 minutes before the scheduled time using the following numbers: 877 405 1226 (US Toll-Free Dial In) or +1 201 689 7823 (US and Standard International Dial In). Please quote “EuroDry” to the operator and/or conference ID 13760747. Click here for additional participant International Toll-Free access numbers.
Alternatively, participants can register for the call using the call me option for a faster connection to join the conference call. You can enter your phone number and let the system call you right away. Click here for the call me option.
Audio Webcast-SlidesPresentation: There will be a live and then archived webcast of the conference call and accompanying slides, available on the Company’s website. To listen to the archived audio file, visit our website http://www.eurodry.gr and click on Company Presentations under our Investor Relations page. Participants to the live webcast should register on the website approximately 10 minutes prior to the start of the webcast.
The slide presentation for the first quarter ended March 31, 2026, will also be available in PDF format 10 minutes prior to the conference call and webcast, accessible on the company’s website (www.eurodry.gr) on the webcast page. Participants to the webcast can download the PDF presentation.
AboutEuroDryLtd. EuroDry Ltd. was formed on January 8, 2018 under the laws of the Republic of the Marshall Islands to consolidate the drybulk fleet of Euroseas Ltd into a separate listed public company. EuroDry was spun-off from Euroseas Ltd on May 30, 2018; it trades on the NASDAQ Capital Market under the ticker EDRY.
EuroDry operates in the dry cargo, drybulk shipping market. EuroDry’s operations are managed by Eurobulk Ltd., an ISO 9001:2008 and ISO 14001:2004 certified affiliated ship management company and Eurobulk (Far East) Ltd. Inc., which are responsible for the day-to-day commercial and technical management and operations of the vessels. EuroDry employs its vessels on spot and period charters.
The Company has a fleet of 11 vessels, including 3 Panamax drybulk carriers, 5 Ultramax drybulk carriers, 2 Kamsarmax drybulk carriers and 1 Supramax drybulk carrier. EuroDry’s 12 drybulk carriers have a total cargo capacity of 766,420 dwt. After the delivery of two Ultramax vessels in 2027, the Company’s fleet will consist of 13 vessels with a total carrying capacity of 893,420 dwt.
Investor Relations /Financial Media Nicolas Bornozis Markella Kara Capital Link, Inc. 230 Park Avenue, Suite 1540 New York, NY 10169 Tel. (212) 661-7566 E-mail: [email protected]
EuroDry Ltd. was formed on January 8, 2018 under the laws of the Republic of the Marshall Islands to consolidate the drybulk fleet of Euroseas Ltd. into a separate listed public company. EuroDry was spun-off from Euroseas Ltd. on May 30, 2018; it trades on the NASDAQ Capital Market under the ticker EDRY. EuroDry operates in the dry cargo, drybulk shipping market. EuroDry’s operations are managed by Eurobulk Ltd., an ISO 9001:2008 and ISO 14001:2004 certified affiliated ship management company and Eurobulk (Far East) Ltd. Inc., which are responsible for the day- to-day commercial and technical management and operations of the vessels. EuroDry employs its vessels on spot and period charters and under pool agreements.
Mark Reichman, Managing Director, Equity Research Analyst, Natural Resources, Noble Capital Markets, Inc.
Hans Baldau, Associate Analyst, Noble Capital Markets, Inc.
Refer to the full report for the price target, fundamental analysis, and rating.
Fourth quarter and full year results. EuroDry reported fourth-quarter net revenues of $17.4 million, exceeding our estimate of $16.5 million, driven by a stronger average TCE rate of $16,262 per day versus our $15,900 estimate and lighter drydocking of 13.7 days against our 22-day assumption. Adjusted EBITDA of $7.5 million and adjusted EPS of $0.88 came in ahead of our estimates of $6.7 million and $0.78, respectively. For the full year, net revenues of $52.3 million, adjusted EBITDA of $12.5 million, and an adjusted net loss of $2.50 per share all modestly surpassed our estimates of $51.4 million, $11.7 million, and a loss of $2.57.
Market update. Dry-bulk fundamentals strengthened in the fourth quarter, with average TCE rates rising to the highest levels in approximately two years. The global order book remains near historically low levels, at approximately 13.4% of the existing fleet, providing structural support. Near-term demand tailwinds include growing bauxite trade from West Africa, continued grain flows following the U.S.–China trade truce, and longer voyage distances due to Red Sea disruptions, though geopolitical uncertainty and tariff-related volatility remain risks.
Equity Research is available at no cost to Registered users of Channelchek. Not a Member? Click ‘Join’ to join the Channelchek Community. There is no cost to register, and we never collect credit card information.
This Research is provided by Noble Capital Markets, Inc., a FINRA and S.E.C. registered broker-dealer (B/D).
*Analyst certification and important disclosures included in the full report. NOTE: investment decisions should not be based upon the content of this research summary. Proper due diligence is required before making any investment decision.
ATHENS, Greece, Feb. 18, 2026 (GLOBE NEWSWIRE) — EuroDry Ltd. (NASDAQ: EDRY, the “Company” or “EuroDry”), an owner and operator of drybulk vessels and provider of seaborne transportation for drybulk cargoes, announced today that it will release its financial results for the fourth quarter ended December 31, 2025, on Thursday, February 19, 2026 after market closes in New York.
On the next day, Friday, February 20, 2026, at 8:00 a.m. Eastern Time, the Company’s management will host a conference call and webcast to discuss the results.
ConferenceCalldetails: Participants should dial into the call 10 minutes before the scheduled time using the following numbers: 877 405 1226 (US Toll-Free Dial In) or +1 201 689 7823 (US and Standard International Dial In). Please quote “EuroDry” to the operator and/or conference ID 13758897. Click here for additional participant International Toll-Free access numbers.
Alternatively, participants can register for the call using the call me option for a faster connection to join the conference call. You can enter your phone number and let the system call you right away. Click here for the call me option.
AudioWebcast-SlidesPresentation: There will be a live and then archived webcast of the conference call and accompanying slides, available on the Company’s website. To listen to the archived audio file, visit our website http://www.eurodry.gr and click on Company Presentations under our Investor Relations page. Participants to the live webcast should register on the website approximately 10 minutes prior to the start of the webcast.
The slide presentation for the fourth quarter ended December 31, 2025, will also be available in PDF format 10 minutes prior to the conference call and webcast, accessible on the company’s website (www.eurodry.gr) on the webcast page. Participants to the webcast can download the PDF presentation.
About EuroDryLtd. EuroDry Ltd. was formed on January 8, 2018, under the laws of the Republic of the Marshall Islands to consolidate the drybulk fleet of Euroseas Ltd. into a separate listed public company. EuroDry was spunoff from Euroseas Ltd on May 30, 2018; it trades on the NASDAQ Capital Market under the ticker EDRY.
EuroDry operates in the dry cargo, drybulk shipping market. EuroDry’s operations are managed by Eurobulk Ltd., an ISO 9001:2008 and ISO 14001:2004 certified affiliated ship management company and Eurobulk (Far East) Ltd. Inc., which are responsible for the day-to-day commercial and technical management and operations of the vessels. EuroDry employs its vessels on spot and period charters and under pool agreements.
The Company has a fleet of 11 vessels, including 3 Panamax drybulk carriers, 5 Ultramax drybulk carriers, 2 Kamsarmax drybulk carriers and 1 Supramax drybulk carrier. EuroDry’s 11 drybulk carriers have a total cargo capacity of 766,420 dwt. After the delivery of two Ultramax vessels in 2027, the Company’s fleet will consist of 13 vessels with a total carrying capacity of 893,420 dwt.
InvestorRelations/FinancialMedia Nicolas Bornozis Markella Kara Capital Link, Inc. 230 Park Avenue, Suite 1540 New York, NY 10169 Tel. (212) 661-7566 E-mail: [email protected]
EuroDry Ltd. was formed on January 8, 2018 under the laws of the Republic of the Marshall Islands to consolidate the drybulk fleet of Euroseas Ltd. into a separate listed public company. EuroDry was spun-off from Euroseas Ltd. on May 30, 2018; it trades on the NASDAQ Capital Market under the ticker EDRY. EuroDry operates in the dry cargo, drybulk shipping market. EuroDry’s operations are managed by Eurobulk Ltd., an ISO 9001:2008 and ISO 14001:2004 certified affiliated ship management company and Eurobulk (Far East) Ltd. Inc., which are responsible for the day- to-day commercial and technical management and operations of the vessels. EuroDry employs its vessels on spot and period charters and under pool agreements.
Mark Reichman, Managing Director, Equity Research Analyst, Natural Resources, Noble Capital Markets, Inc.
Hans Baldau, Associate Analyst, Noble Capital Markets, Inc.
Refer to the full report for the price target, fundamental analysis, and rating.
Increasing FY 2026 estimates. We have increased our FY 2026 revenue, adjusted EBITDA, and adjusted EPS estimates to $60.8 million, $25.5 million, and $2.82, respectively, from $57.3 million, $22.4 million, and $1.46. The upward revisions are driven by higher expected vessel earnings, with our forecast average TCE rate rising to $14,743 from $13,873 previously.
Eurodry’s sweet spot. Eurodry owns and operates vessels in the middle of the size range of dry bulk carriers, or 50,000 to 85,000 dead weight tons (dwt), which present the most flexible employment opportunities. EDRY’s fleet consists of 11 vessels with a total carrying capacity of 766,420 dwt. With two Ultramax vessels of 63,500 dwt each under construction and scheduled for delivery in the second and third quarters of 2027, the total carrying capacity will increase to 893,000 dwt. Growth will be driven by the charter rate environment, coupled with fleet growth. While EDRY continues to renew and modernize its fleet, it expects to acquire and consolidate smaller owners.
Equity Research is available at no cost to Registered users of Channelchek. Not a Member? Click ‘Join’ to join the Channelchek Community. There is no cost to register, and we never collect credit card information.
This Research is provided by Noble Capital Markets, Inc., a FINRA and S.E.C. registered broker-dealer (B/D).
*Analyst certification and important disclosures included in the full report. NOTE: investment decisions should not be based upon the content of this research summary. Proper due diligence is required before making any investment decision.
EuroDry Ltd. was formed on January 8, 2018 under the laws of the Republic of the Marshall Islands to consolidate the drybulk fleet of Euroseas Ltd. into a separate listed public company. EuroDry was spun-off from Euroseas Ltd. on May 30, 2018; it trades on the NASDAQ Capital Market under the ticker EDRY. EuroDry operates in the dry cargo, drybulk shipping market. EuroDry’s operations are managed by Eurobulk Ltd., an ISO 9001:2008 and ISO 14001:2004 certified affiliated ship management company and Eurobulk (Far East) Ltd. Inc., which are responsible for the day- to-day commercial and technical management and operations of the vessels. EuroDry employs its vessels on spot and period charters and under pool agreements.
Mark Reichman, Managing Director, Equity Research Analyst, Natural Resources, Noble Capital Markets, Inc.
Hans Baldau, Associate Analyst, Noble Capital Markets, Inc.
Refer to the full report for the price target, fundamental analysis, and rating.
Third quarter financial results. EuroDry reported third quarter 2025 revenues of $15.3 million, in line with expectations of $15.1 million and down slightly from $15.8 million last year due to a smaller fleet. Adjusted EBITDA improved sharply to $4.1 million, up from $0.5 million in Q3 2024, due to lower expenses and stronger utilization. The company operated an average of 12 vessels at a TCE of $13,232/day, modestly above $13,105/day in the prior-year period. Adjusted net loss narrowed to $0.6 million, or $(0.23)/share, compared to a loss of $3.9 million, or $(1.42)/share, last year.
Market outlook. Management indicated that dry-bulk fundamentals continued to strengthen through Q3, supported by improving Chinese import activity, firmer demand across key cargo segments, and increased ton-mile requirements. Limited fleet growth and a historically low orderbook continue to support a tightening supply backdrop as the market moves into 2026. We expect Q4 results to capture more of the recent improvement as earlier charters roll off, though geopolitical uncertainty remains a risk to global trade flows.
Equity Research is available at no cost to Registered users of Channelchek. Not a Member? Click ‘Join’ to join the Channelchek Community. There is no cost to register, and we never collect credit card information.
This Research is provided by Noble Capital Markets, Inc., a FINRA and S.E.C. registered broker-dealer (B/D).
*Analyst certification and important disclosures included in the full report. NOTE: investment decisions should not be based upon the content of this research summary. Proper due diligence is required before making any investment decision.
EuroDry Ltd. was formed on January 8, 2018 under the laws of the Republic of the Marshall Islands to consolidate the drybulk fleet of Euroseas Ltd. into a separate listed public company. EuroDry was spun-off from Euroseas Ltd. on May 30, 2018; it trades on the NASDAQ Capital Market under the ticker EDRY. EuroDry operates in the dry cargo, drybulk shipping market. EuroDry’s operations are managed by Eurobulk Ltd., an ISO 9001:2008 and ISO 14001:2004 certified affiliated ship management company and Eurobulk (Far East) Ltd. Inc., which are responsible for the day- to-day commercial and technical management and operations of the vessels. EuroDry employs its vessels on spot and period charters and under pool agreements.
Mark Reichman, Managing Director, Equity Research Analyst, Natural Resources, Noble Capital Markets, Inc.
Hans Baldau, Associate Analyst, Noble Capital Markets, Inc.
Refer to the full report for the price target, fundamental analysis, and rating.
Second quarter financial results. EuroDry generated Q2 net revenues of $11.3 million, in line with our $11.4 million estimate but down about $6 million year-over-year due to a decline in average time charter equivalent (TCE) rates. Adjusted EBITDA of $1.9 million and a loss per share of $1.10 per share were better than our forecasts of $1.6 million and a loss of $1.23 per share, aided by lower voyage expenses, but trailed last year’s $5.0 million and $0.17 loss.
Market Outlook. The dry-bulk market saw a brief improvement in the second quarter as rates recovered from early-year lows, though momentum slowed later in the period amid trade policy developments and softer Chinese import activity. However, since the start of the third quarter, rates have improved, and the IMF slightly raised its 2025 global GDP guidance. Red Sea disruptions have continued to extend voyage distances, and demand has picked up slightly based on improved sentiment toward growth in China. The orderbook remains near historical lows, so while rates hover below 2024 levels, we expect the recent improvement to hold for the remainder of the year.
Equity Research is available at no cost to Registered users of Channelchek. Not a Member? Click ‘Join’ to join the Channelchek Community. There is no cost to register, and we never collect credit card information.
This Research is provided by Noble Capital Markets, Inc., a FINRA and S.E.C. registered broker-dealer (B/D).
*Analyst certification and important disclosures included in the full report. NOTE: investment decisions should not be based upon the content of this research summary. Proper due diligence is required before making any investment decision.
EuroDry Ltd. was formed on January 8, 2018 under the laws of the Republic of the Marshall Islands to consolidate the drybulk fleet of Euroseas Ltd. into a separate listed public company. EuroDry was spun-off from Euroseas Ltd. on May 30, 2018; it trades on the NASDAQ Capital Market under the ticker EDRY. EuroDry operates in the dry cargo, drybulk shipping market. EuroDry’s operations are managed by Eurobulk Ltd., an ISO 9001:2008 and ISO 14001:2004 certified affiliated ship management company and Eurobulk (Far East) Ltd. Inc., which are responsible for the day- to-day commercial and technical management and operations of the vessels. EuroDry employs its vessels on spot and period charters and under pool agreements.
Mark Reichman, Managing Director, Equity Research Analyst, Natural Resources, Noble Capital Markets, Inc.
Hans Baldau, Associate Analyst, Noble Capital Markets, Inc.
Refer to the full report for the price target, fundamental analysis, and rating.
Second quarter estimates. We are lowering our Q2 2025 revenue and adjusted earnings per share estimates to $11.4 million and a loss of $1.23, respectively, from $14.1 million and a loss of $0.76. Additionally, we are reducing our operating expenses to $13.0 million from $14.4 million, as dry docking expenses have been pushed into the third quarter. Despite lower operating expenses, we are decreasing our adjusted EBITDA estimate to $1.6 million from $2.9 million. The decrease in our earnings estimates is mainly due to lower-than-expected time charter equivalent (TCE) rates.
Full-Year 2025 estimates. We are lowering our 2025 revenue and adjusted earnings per share estimates to $46.0 million and a loss of $4.41, respectively, from $50.3 million and a loss of $3.79. We are trimming our operating expenses to $51.4 million from $51.8 million, due to lower expected voyage expenses. Our adjusted EBITDA estimates were lowered to $5.6 million from $9.3 million. The lower estimates are driven by soft market rates.
Equity Research is available at no cost to Registered users of Channelchek. Not a Member? Click ‘Join’ to join the Channelchek Community. There is no cost to register, and we never collect credit card information.
This Research is provided by Noble Capital Markets, Inc., a FINRA and S.E.C. registered broker-dealer (B/D).
*Analyst certification and important disclosures included in the full report. NOTE: investment decisions should not be based upon the content of this research summary. Proper due diligence is required before making any investment decision.
EuroDry Ltd. was formed on January 8, 2018 under the laws of the Republic of the Marshall Islands to consolidate the drybulk fleet of Euroseas Ltd. into a separate listed public company. EuroDry was spun-off from Euroseas Ltd. on May 30, 2018; it trades on the NASDAQ Capital Market under the ticker EDRY. EuroDry operates in the dry cargo, drybulk shipping market. EuroDry’s operations are managed by Eurobulk Ltd., an ISO 9001:2008 and ISO 14001:2004 certified affiliated ship management company and Eurobulk (Far East) Ltd. Inc., which are responsible for the day- to-day commercial and technical management and operations of the vessels. EuroDry employs its vessels on spot and period charters and under pool agreements.
Mark Reichman, Managing Director, Equity Research Analyst, Natural Resources, Noble Capital Markets, Inc.
Hans Baldau, Associate Analyst, Noble Capital Markets, Inc.
Refer to the full report for the price target, fundamental analysis, and rating.
First quarter financial results. Eurodry Ltd. reported an adjusted first quarter net loss of $5.7 million, or ($2.07) per share, compared to a loss of $3.2 million, or ($1.18) per share, during the same period last year. Adjusted EBITDA came in at a loss of $1.0 million, down from a gain of $2.1 million during the first quarter of last year. While revenue was slightly above our expectations, operating expenses were approximately $2.0 million higher than estimated due to increased repair costs. Overall, the quarterly results reflected the ongoing market challenges as charter rates remain near five-year lows due to challenging supply and demand trends.
Updating 2025 estimates. Based on the lower-than-expected first quarter results and management’s outlook, we are lowering our full year 2025 adjusted EBITDA and earnings per share (EPS) estimates to $9.3 million and ($3.79), respectively, down from $19.6 million and ($0.43). While we expect the second quarter to show a slight rebound, the weak market conditions are expected to persist and could constrain rates through the balance of the year.
Equity Research is available at no cost to Registered users of Channelchek. Not a Member? Click ‘Join’ to join the Channelchek Community. There is no cost to register, and we never collect credit card information.
This Research is provided by Noble Capital Markets, Inc., a FINRA and S.E.C. registered broker-dealer (B/D).
*Analyst certification and important disclosures included in the full report. NOTE: investment decisions should not be based upon the content of this research summary. Proper due diligence is required before making any investment decision.
EuroDry Ltd. was formed on January 8, 2018 under the laws of the Republic of the Marshall Islands to consolidate the drybulk fleet of Euroseas Ltd. into a separate listed public company. EuroDry was spun-off from Euroseas Ltd. on May 30, 2018; it trades on the NASDAQ Capital Market under the ticker EDRY. EuroDry operates in the dry cargo, drybulk shipping market. EuroDry’s operations are managed by Eurobulk Ltd., an ISO 9001:2008 and ISO 14001:2004 certified affiliated ship management company and Eurobulk (Far East) Ltd. Inc., which are responsible for the day- to-day commercial and technical management and operations of the vessels. EuroDry employs its vessels on spot and period charters and under pool agreements.
Mark Reichman, Managing Director, Equity Research Analyst, Natural Resources, Noble Capital Markets, Inc.
Hans Baldau, Research Associate, Noble Capital Markets, Inc.
Refer to the full report for the price target, fundamental analysis, and rating.
Fourth quarter financial results. EuroDry Ltd. reported an adjusted fourth-quarter net loss to controlling shareholders of $0.7 million, or ($0.25) per share, compared to adjusted net income of $1.9 million, or $0.70 per share, during the prior year period. Adjusted EBITDA declined to $4.8 million compared to $6.6 million during the prior year period. The year-over-year decline is due to low market rates as trade volume has fallen amid a slowdown in the Chinese economy.
Full year 2024 earnings and updated 2025 estimates. For the full year 2024, adjusted EBITDA and earnings per share declined to $12.4 million and ($3.02), respectively, from $14.6 million and $0.12 in 2023. We have lowered our 2025 adjusted EBITDA and EPS estimates to $19.6 million and ($0.43), respectively, from $22.0 million and ($0.34). While we expect spot and one-year time charter equivalent rates to improve throughout the year, our estimates have been lowered compared to our previous expectations due to weak market conditions.
Equity Research is available at no cost to Registered users of Channelchek. Not a Member? Click ‘Join’ to join the Channelchek Community. There is no cost to register, and we never collect credit card information.
This Research is provided by Noble Capital Markets, Inc., a FINRA and S.E.C. registered broker-dealer (B/D).
*Analyst certification and important disclosures included in the full report. NOTE: investment decisions should not be based upon the content of this research summary. Proper due diligence is required before making any investment decision.
ATHENS, Greece, Feb. 24, 2025 (GLOBE NEWSWIRE) — EuroDry Ltd. (NASDAQ: EDRY, the “Company” or “EuroDry”), an owner and operator of drybulk vessels and provider of seaborne transportation for drybulk cargoes, announced today its results for the three and twelve-month periods ended December 31, 2024.
Fourth Quarter 2024 Highlights:
Total net revenues of $14.5 million.
Net loss attributable to controlling shareholders, of $3.3 million or $1.20 loss per share basic and diluted.
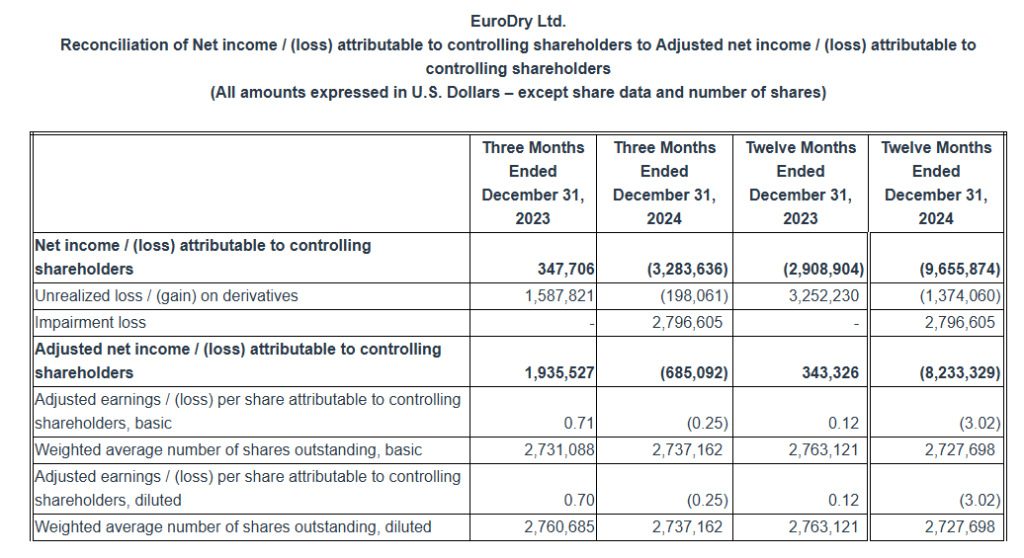
Adjusted net loss1 attributable to controlling shareholders, for the quarter of $0.7 million, or, $0.25 per share basic and diluted which excludes among other items an impairment charge of $2.8 million on one of our vessels.
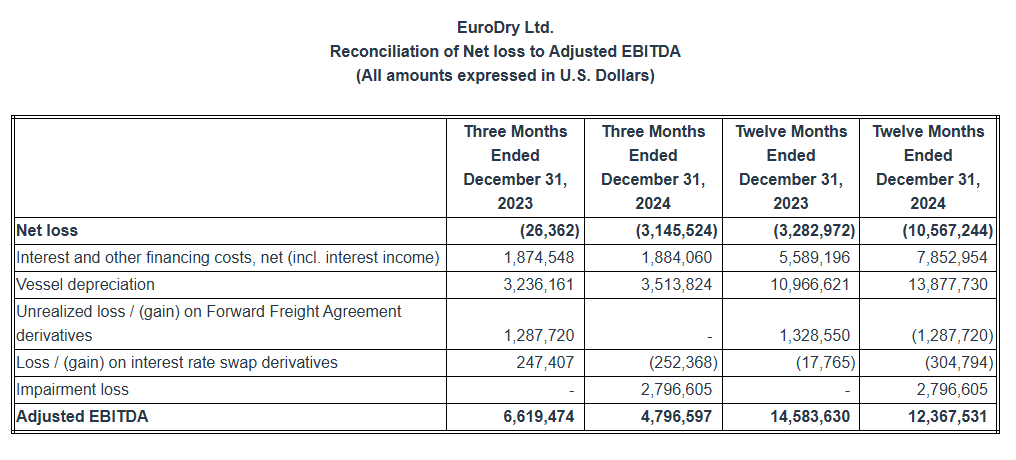
Adjusted EBITDA1 was $4.8 million.
An average of 13.0 vessels were owned and operated during the fourth quarter of 2024 earning an average time charter equivalent rate of $12,201 per day.
To date, about $5.3 million has been used to repurchase 334,674 shares of the Company, under our share repurchase plan of up to $10 million, announced in August 2022.
Recent developments:
In November 2024, the Company signed two contracts with Nantong Xiangyu Shipbuilding for the construction of two 63,500 DWT ultramax bulk carriers. Both vessels are geared, eco, and are built to EEDI phase 3 design standard. The two newbuildings are scheduled to be delivered during the second and third quarters of 2027. The total consideration for the two newbuilding contracts is approximately $71.8 million and will be financed with a combination of debt and equity.
The Company on January 29, 2025, signed an agreement to sell M/V Tasos, a 75,100 dwt drybulk vessel, built in 2000, for demolition, for approximately $5 million. The vessel is expected to be delivered to its buyers, an unaffiliated third party, until early-March 2025, upon completion of her present charter. As a result of the vessel sale, we expect to record a gain of approximately $2.1million.
Full Year 2024 Highlights:
Total net revenues of $61.1 million.
Net loss attributable to controlling shareholders, of $9.7 million, or $3.54 loss per share basic and diluted.
Adjusted net loss1 attributable to controlling shareholders, for the period was $8.2 million or $3.02 adjusted loss per share basic and diluted.
Adjusted EBITDA1 was $12.4 million.
An average of 13.0 vessels were owned and operated during the twelve months of 2024 earning an average time charter equivalent rate of $13,039 per day.
Aristides Pittas, Chairman and CEO of EuroDry commented: “During the last couple of months of 2024 and during January and February of 2025, the drybulk market dropped to rates not seen since the early days of the COVID pandemic and touched decade-long lows last seen in 2016. It appears that a combination of low trade volumes due to low demand from China combined with a record low percentage of the fleet tied up in ports more than counterbalanced the low fleet growth during the period. There is some expectation, though, that the various stimuli packages released by the Chinese government during the fourth quarter of 2024 would start showing results in the near future; such stimuli combined with the typical seasonal recovery of the drybulk markets during the second quarter could lead to a noticeable recovery of the charter rates as already indicated by the forward (“FFA”) market.
“The low market of the fourth quarter was reflected in our results for the period although our vessels achieved better charters than market averages indicate. And while the low market of January and February 2025 will affect our first quarter results, we expect a recovery of the market in March and during the second quarter of 2025 to return us to profitability as our fleet is positioned to take full advantage of it having passed most drydockings in 2024. At the same time, as prices for vessels have also weakened, we are diligent in searching for potential investment opportunities; and to help finance such opportunities should they arise, we have committed to sell our eldest vessel M/V Tasos, as we recently announced.”
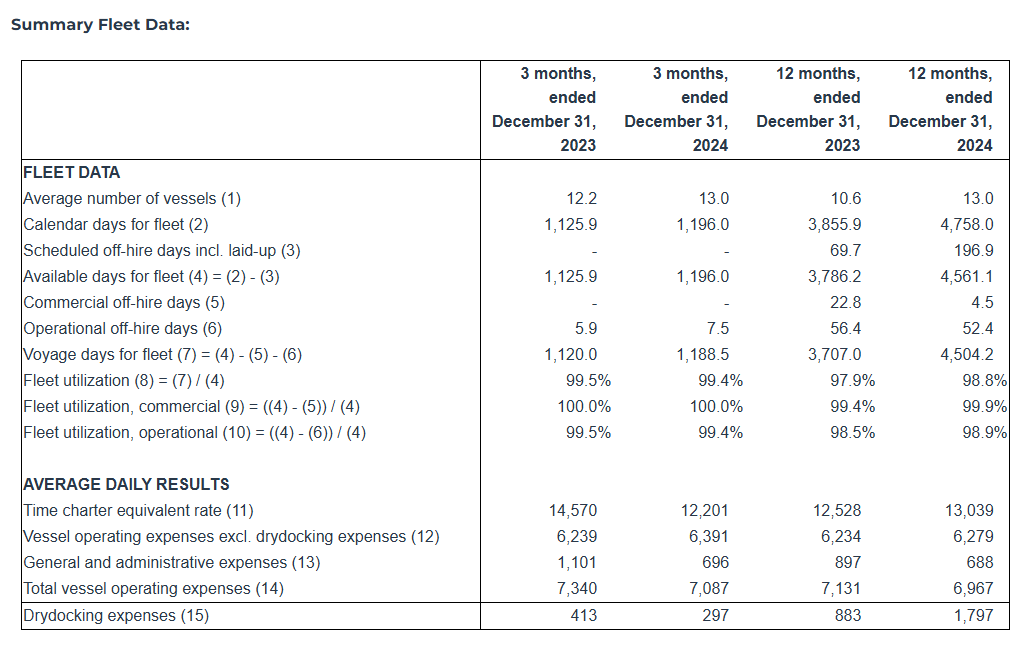
Tasos Aslidis, Chief Financial Officer of EuroDry commented: “In the fourth quarter of 2024 the Company operated an average of 13.0 vessels, versus 12.2 vessels during the same period last year. Our net revenues decreased to $14.5 million in the fourth quarter of 2024 compared to $15.9 million during the same period of last year. Our vessels earned in the fourth quarter of 2024 approximately 16.3% lower time charter equivalent rates compared to the corresponding period of 2023. At the same time, total daily vessel operating expenses, including management fees, general and administrative expenses but excluding drydocking costs, during the fourth quarter of 2024, averaged $7,087 per vessel per day, as compared to $7,340 for the same period of last year and $6,967 per vessel per day for the year 2024 as compared to $7,131 per vessel per day for the same period of 2023. The decreased total vessel operating expenses in the recent periods are attributable to the significantly lower daily general and administrative expenses. General and administrative expenses for the same period of 2023 included additional costs incurred in relation to the formation of a partnership with a number of investors represented by NRP Project Finance AS (“NRP Investors”) regarding the ownership of the entities owning M/V Christos K and M/V Maria (the “Partnership”).
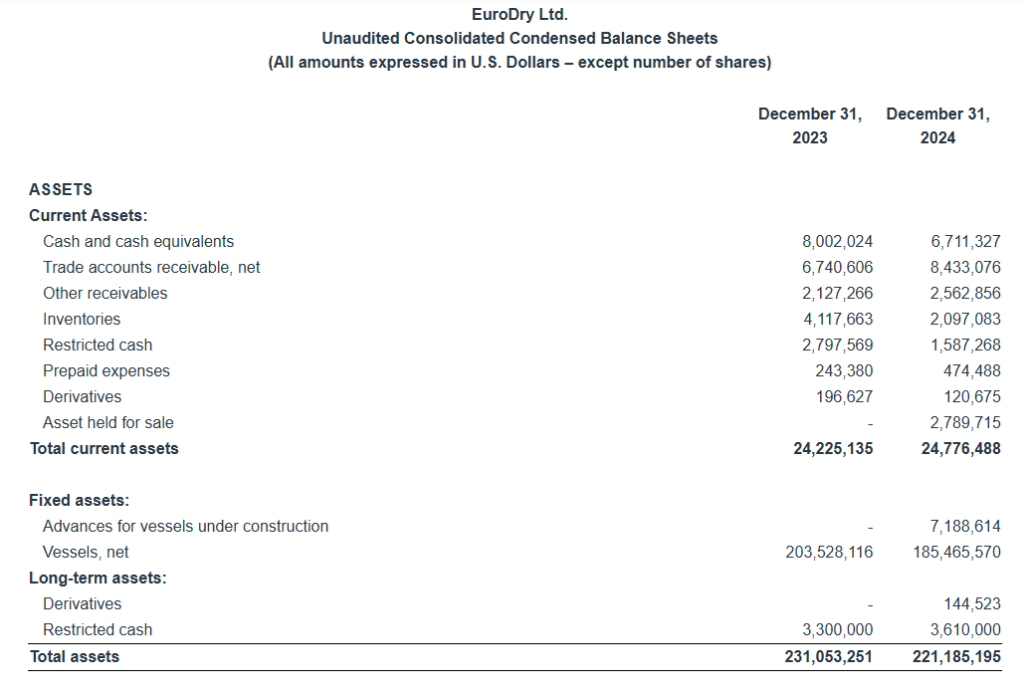
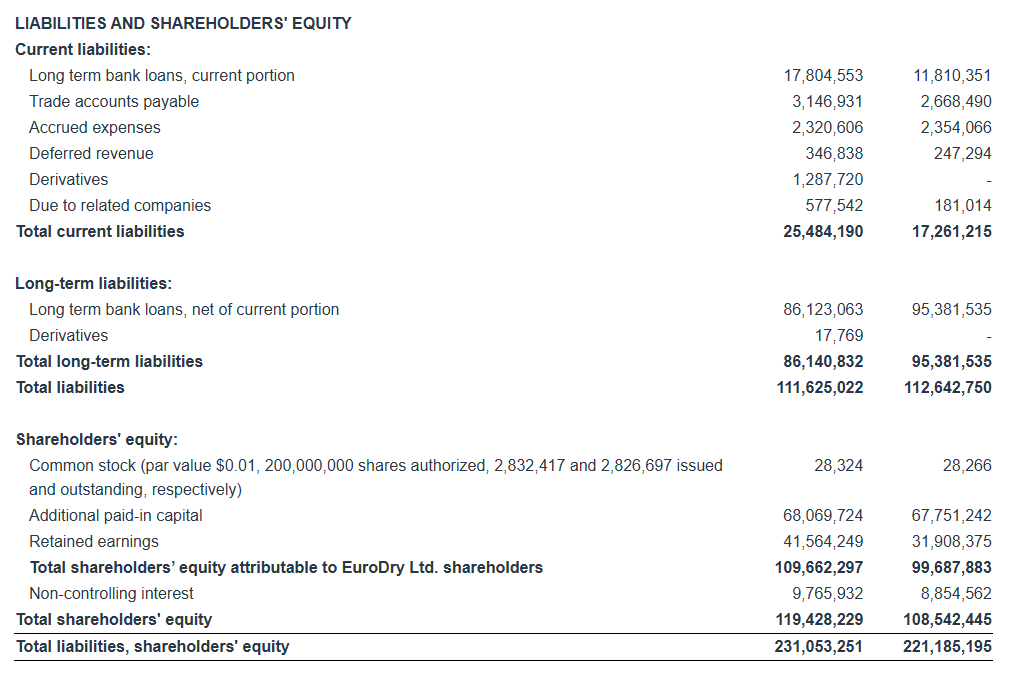
“Adjusted EBITDA during the fourth quarter of 2024 was $4.8 million versus $6.6 million in the fourth quarter of last year, and $12.4 million versus $14.6 million for the respective twelve-month periods of 2024 and 2023, respectively. As of December 31, 2024, our outstanding debt (excluding the unamortized loan fees) was $108.2 million versus unrestricted and restricted cash of $11.9 million. As of the same date, our scheduled debt repayments over the next 12 months amounted to about $12.1 million (excluding the unamortized loan fees).”
Fourth Quarter 2024 Results: For the fourth quarter of 2024, the Company reported total net revenues of $14.5 million representing a 8.8% decrease over total net revenues of $15.9 million during the fourth quarter of 2023. This was the result of the lower time charter rates our vessels earned in the fourth quarter of 2024, partly offset by the higher average number of vessels operated compared to the same period of 2023. On average, 13.0 vessels were owned and operated during the fourth quarter of 2024 earning an average time charter equivalent rate of $12,201 per day compared to 12.2 vessels in the same period of 2023 earning on average $14,570 per day.
For the fourth quarter of 2024, voyage expenses, net amounted to $0.9 million and mainly relate to vessels repositioning between charters and expenses during operational off-hire time. For the same period of 2023 voyage expenses net amounted to $0.6 million.
Vessel operating expenses were $6.6 million for the fourth quarter of 2024 as compared to $6.1 million for the same period of 2023. The increase is mainly attributable to the increased number of vessels operating in the fourth quarter of 2024 compared to the corresponding period in 2023.
Depreciation expense for the fourth quarter of 2024 amounted to $3.5 million, as compared to $3.2 million for the same period of 2023. This increase is again due to the higher number of vessels operating in the fourth quarter of 2024 as compared to the same period of 2023.
General and administrative expenses for the fourth quarter of 2024 were $0.8 million compared to $1.2 million of the fourth quarter of 2023. The decrease is mainly attributable to an additional cost of $0.44 million that was incurred during the last quarter of 2023 in relation to the formation of the Partnership.
Related party management fees for the fourth quarter of 2024 increased to $1.1 million from $1.0 million for the same period of 2023 as a result of an adjustment for inflation in the daily vessel management fee, effective from January 1, 2024, increasing the daily vessel management fee from 775 Euros to 810 Euros, as well as the increased number of vessels operating in the fourth quarter of 2024 compared to the corresponding period in 2023, partly offset by the favorable movement of the euro/dollar exchange rate.
During the fourth quarter of 2024 and 2023, none of our vessels underwent drydocking. The total cost for the fourth quarter of 2024 and 2023 of $0.4 million and $0.5 million, respectively, relates to drydocking expenses incurred in relation to upcoming drydockings.
In the fourth quarter of 2024 the Company recorded an impairment charge of $2.8 million. The impairment was booked to reduce the carrying amount of a drybulk vessel (M/V “Santa Cruz”) to its estimated market value, since based on the Company’s impairment test results it was determined that its carrying amount was not recoverable. No such cost existed in the fourth quarter of 2023.
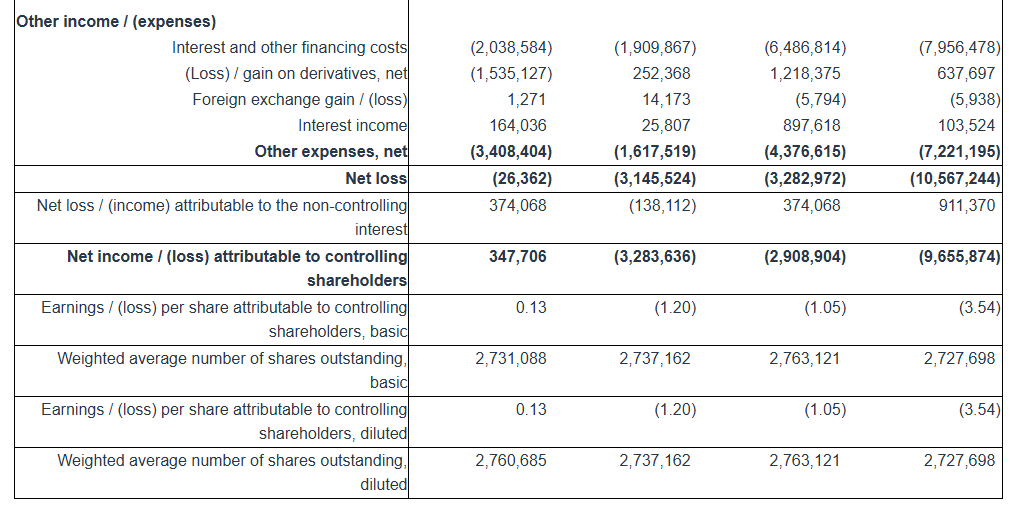
Interest and other financing costs for the fourth quarter of 2024 decreased to $1.9 million as compared to $2.0 million for the same period of 2023. Interest expense during the fourth quarter of 2024 was slightly lower mainly due to the slightly decreased benchmark rates of our loans, partly offset by the increased average debt during the period as compared to the same period of last year.
For the three months ended December 31, 2024, the Company recognized a gain on an interest rate swap of $0.25 million, as compared to a loss on an interest rate swap of $0.25 million and a loss on forward freight agreement (“FFA”) contracts of $1.3 million for the same period of 2023.
Interest income for the fourth quarter of 2024 amounted to $0.03 million compared to $0.16 million for the same period of 2023. The decrease in interest income is attributable to lower cash balances maintained during the fourth quarter of 2024 compared to the corresponding period in 2023.
The Company reported a net loss for the period of $3.1 million and a net loss attributable to controlling shareholders for the period of $3.3 million, as compared to a net loss of $0.03 million and a net income attributable to controlling shareholders of $0.3 million for the same period of 2023. The net income attributable to the non-controlling interest of $0.1 million in the fourth quarter of 2024 represents the income attributable to the 39% ownership of the Partnership.
Adjusted EBITDA for the fourth quarter of 2024 was $4.8 million compared to $6.6 million achieved during the fourth quarter of 2023.
Basic and diluted loss per share attributable to controlling shareholders for the fourth quarter of 2024 was $1.20 calculated on 2,737,162 basic and diluted weighted average number of shares outstanding, compared to earnings per share of $0.13, calculated on 2,731,088 basic and 2,760,685 diluted weighted average number of shares outstanding for the fourth quarter of 2023.
Excluding the effect on the net loss attributable to controlling shareholders for the quarter of the unrealized loss / (gain) on derivatives and the impairment loss on a vessel, the adjusted loss per share attributable to controlling shareholders for the quarter ended December 31, 2024 would have been $0.25 basic and diluted, compared to adjusted earnings of $0.71 and $0.70 per share basic and diluted, respectively, for the quarter ended December 31, 2023. Usually, security analysts do not include the above items in their published estimates of earnings per share.
Full Year 2024 Results: For the full year of 2024, the Company reported total net revenues of $61.1 million representing a 28.3% increase over total net revenues of $47.6 million during the twelve months of 2023, as a result of the increased number of vessels operated during the year and the slightly higher time charter equivalent rates earned by our vessels in the twelve months of 2024 compared to the same period of 2023. On average, 13.0 vessels were owned and operated during the twelve months of 2024 earning an average time charter equivalent rate of $13,039 per day compared to 10.6 vessels in the same period of 2023 earning on average $12,528 per day.
For the twelve months of 2024, voyage expenses, net, were $6.1 million and mainly relate to vessels repositioning between charters and expenses during operational off-hire time. For the same period of 2023, voyage expenses, net, were $4.0 million and mainly relate to expenses incurred by one of our vessels while employed under a voyage charter, vessels repositioning between charters and expenses during the detention of one of our vessels in Corpus Christi.
Vessel operating expenses were $25.7 million for the twelve months of 2024 as compared to $20.8 million for the same period of 2023. The increase is mainly attributable to the increased number of vessels operating in 2024 compared to the corresponding period in 2023.
Depreciation expense for the year 2024 was $13.9 million compared to $11.0 million during the same period of 2023, again, mainly due to the higher number of vessels operating in the same period.
Related party management fees for the year of 2024 were increased to $4.2 million from $3.3 million for the same period of 2023 as a result of an adjustment for inflation in the daily vessel management fee, effective from January 1, 2024, increasing the daily vessel management fee from 775 Euros to 810 Euros and the increased number of vessels operated.
General and administrative expenses during the twelve months of 2024 were $3.3 million compared to $3.5 million during the same period in 2023. The decrease is attributable to an additional cost of $0.44 million that was incurred during the last quarter of 2023 in relation to the formation of the Partnership, partly offset by the increased cost of our stock incentive plan in 2024.
During the twelve months of 2023, we recorded a provision of $0.5 million for anticipated costs related to the detention of one of our vessels in Corpus Christi presented as other operating loss.
In 2023, we wrote-off certain trade receivables by recording a bad debt expense of $0.1 million. In 2024, we had no bad debt expense.
In the twelve months of 2024, seven of our vessels completed their special survey with drydocking for a total cost of $8.5 million. In the twelve months of 2023, three of our vessels completed their special or intermediate survey with drydocking and one vessel passed her intermediate survey in water (in lieu of drydock), for a total cost of $3.4 million.
Interest and other financing costs for the twelve months of 2024 amounted to $8.0 million compared to $6.5 million for the same period of 2023. Interest expense for the twelve months of 2024 was higher due to the increased average debt as compared to the same period of last year.
For the twelve months ended December 31, 2024, the Company recognized a $0.1 million unrealized gain and a $0.2 million realized gain on one interest rate swap, as well as a 1.3 million unrealized gain and a $1.0 million realized loss on FFA contracts as compared to a $1.9 million unrealized loss and a $1.9 million realized gain on interest rate swaps, as well as a 1.3 million unrealized loss and a $2.5 million realized gain on FFA contracts for the same period of 2023.
Interest income for 2024 amounted to $0.1 million compared to $0.9 million interest income for the same period of 2023. The decrease of interest income is attributable to lower cash balances maintained during the twelve months of 2024 compared to the corresponding period in 2023.
The Company reported a net loss for the period of $10.6 million and a net loss attributable to controlling shareholders of $9.7 million, as compared to a net loss of $3.3 million and a net loss attributable to controlling shareholders of $2.9 million, for the same period of 2023. The net loss attributable to the non-controlling interest of $0.9 million in 2024 represents the loss attributable to the 39% ownership of the Partnership.
Adjusted EBITDA for the twelve months of 2024 was $12.4 million compared to $14.6 million achieved during the twelve months of 2023.
Basic and diluted loss per share attributable to controlling shareholders for the twelve months of 2024 was $3.54, calculated on 2,727,698 basic and diluted weighted average number of shares outstanding, compared to basic and diluted loss per share attributable to controlling shareholders for the twelve months of 2023 of $1.05, calculated on 2,763,121 basic and diluted weighted average number of shares outstanding.
Excluding the effect on the net loss attributable to controlling shareholders for the year of the unrealized loss / (gain) on derivatives and the impairment loss on a vessel, the adjusted loss per share attributable to controlling shareholders for the year ended December 31, 2024 would have been $3.02 basic and diluted, compared to adjusted earnings per share of $0.12 basic and diluted for the same period of 2023. As previously mentioned, usually, security analysts do not include the above items in their published estimates of earnings per share.
(1) Average number of vessels is the number of vessels that constituted the Company’s fleet for the relevant period, as measured by the sum of the number of calendar days each vessel was a part of the Company’s fleet during the period divided by the number of calendar days in that period.
(2) Calendar days. We define calendar days as the total number of days in a period during which each vessel in our fleet was owned by us including off-hire days associated with major repairs, drydockings or special or intermediate surveys or days of vessels in lay-up. Calendar days are an indicator of the size of our fleet over a period and affect both the amount of revenues and the amount of expenses that we record during that period.
(3) The scheduled off-hire days including vessels laid-up are days associated with scheduled repairs, drydockings or special or intermediate surveys or days of vessels in lay-up.
(4) Available days. We define available days as the total number of Calendar days in a period net of scheduled off-hire days incl. laid up. We use available days to measure the number of days in a period during which vessels were available to generate revenues.
(5) Commercial off-hire days. We define commercial off-hire days as days a vessel is idle without employment.
(6) Operational off-hire days. We define operational off-hire days as days associated with unscheduled repairs or other off-hire time related to the operation of the vessels.
(7) Voyage days. We define voyage days as the total number of days in a period during which each vessel in our fleet was in our possession net of commercial and operational off-hire days. We use voyage days to measure the number of days in a period during which vessels actually generate revenues or are sailing for repositioning purposes.
(8) Fleet utilization. We calculate fleet utilization by dividing the number of our voyage days during a period by the number of our available days during that period. We use fleet utilization to measure a company’s efficiency in finding suitable employment for its vessels and minimizing the amount of days that its vessels are off-hire for reasons such as unscheduled repairs or days waiting to find employment.
(9) Fleet utilization, commercial. We calculate commercial fleet utilization by dividing our available days net of commercial off-hire days during a period by our available days during that period.
(10) Fleet utilization, operational. We calculate operational fleet utilization by dividing our available days net of operational off-hire days during a period by our available days during that period.
(11) Time charter equivalent rate, or TCE, is a measure of the average daily net revenue performance of our vessels. Our method of calculating TCE is determined by dividing time charter revenue and voyage charter revenue net of voyage expenses by voyage days for the relevant time period. Voyage expenses primarily consist of port, canal and fuel costs that are unique to a particular voyage, which would otherwise be paid by the charterer under a time charter contract, or are related to repositioning the vessel for the next charter. TCE provides additional meaningful information in conjunction with time charter revenue and voyage charter revenue, the most directly comparable GAAP measure, because it assists our management in making decisions regarding the deployment and use of our vessels and because we believe that it provides useful information to investors regarding our financial performance. TCE is a standard shipping industry performance measure used primarily to compare period-to-period changes in a shipping company’s performance despite changes in the mix of charter types (i.e., spot voyage charters, time charters, pool agreements and bareboat charters) under which the vessels may be employed between the periods. Our definition of TCE may not be comparable to that used by other companies in the shipping industry.
(12) We calculate daily vessel operating expenses, which include crew costs, provisions, deck and engine stores, lubricating oil, insurance, maintenance and repairs and related party management fees by dividing vessel operating expenses and related party management fees by fleet calendar days for the relevant time period. Drydocking expenses are reported separately.
(13) Daily general and administrative expenses are calculated by us by dividing general and administrative expenses by fleet calendar days for the relevant time period.
(14) Total vessel operating expenses, or TVOE, is a measure of our total expenses associated with operating our vessels. We compute TVOE as the sum of vessel operating expenses, related party management fees and general and administrative expenses; drydocking expenses are not included. Daily TVOE is calculated by dividing TVOE by fleet calendar days for the relevant time period.
(15) Daily drydocking expenses are calculated by us by dividing drydocking expenses by the fleet calendar days for the relevant period. Drydocking expenses include expenses during drydockings that would have been capitalized and amortized under the deferral method. Drydocking expenses could vary substantially from period to period depending on how many vessels underwent drydocking during the period. The Company expenses drydocking expenses as incurred.
Conference Call and Webcast: Today, February 24, 2025 at 9:00 a.m. Eastern Time, the Company’s management will host a conference call and webcast to discuss the results.
Conference Call details: Participants should dial into the call 10 minutes before the scheduled time using the following numbers: 877 405 1226 (US Toll-Free Dial In) or +1 201 689 7823 (US and Standard International Dial In). Please quote “EuroDry” to the operator and/or conference ID 13751962. Click here for additional participant International Toll -Free access numbers.
Alternatively, participants can register for the call using the call me option for a faster connection to join the conference call. You can enter your phone number and let the system call you right away. Click here for the call me option.
Audio webcast – Slides Presentation: There will be a live and then archived webcast of the conference call and accompanying slides, available on the Company’s website. To listen to the archived audio file, visit our website http://www.eurodry.gr and click on Company Presentations under our Investor Relations page. Participants to the live webcast should register on the website approximately 10 minutes prior to the start of the webcast.
The slide presentation for the fourth quarter ended December 31, 2024, will also be available in PDF format 10 minutes prior to the conference call and webcast, accessible on the company’s website (www.eurodry.gr) on the webcast page. Participants to the webcast can download the PDF presentation.
Adjusted EBITDA Reconciliation: EuroDry Ltd. considers Adjusted EBITDA to represent net loss before interest and other financing costs, income taxes, depreciation, unrealized loss / (gain) on Forward Freight Agreement derivatives (“FFAs”), loss / (gain) on interest rate swap derivatives and impairment loss. Adjusted EBITDA does not represent and should not be considered as an alternative to net loss, as determined by United States generally accepted accounting principles, or GAAP. Adjusted EBITDA is included herein because it is a basis upon which the Company assesses its financial performance because the Company believes that this non-GAAP financial measure assists our management and investors by increasing the comparability of our performance from period to period by excluding the potentially disparate effects between periods of, financial costs, unrealized loss / (gain) on FFAs, loss / (gain) on interest rate swap derivatives, depreciation and impairment loss. The Company’s definition of Adjusted EBITDA may not be the same as that used by other companies in the shipping or other industries.
Adjusted net income / (loss) attributable to controlling shareholders and Adjusted earnings / (loss) per share attributable to controlling shareholders Reconciliation:
EuroDry Ltd. considers Adjusted net income / (loss) attributable to controlling shareholders, to represent net income / (loss) before unrealized loss / (gain) on derivatives, which includes FFAs and interest rate swaps, and impairment loss. Adjusted net income / (loss) attributable to controlling shareholders and Adjusted earnings / (loss) per share attributable to common shareholders are included herein because we believe they assist our management and investors by increasing the comparability of the Company’s fundamental performance from period to period by excluding the potentially disparate effects between periods of the aforementioned items , which may significantly affect results of operations between periods. Adjusted net income / (loss) attributable to controlling shareholders and Adjusted earnings / (loss) per share attributable to common shareholders do not represent and should not be considered as an alternative to net income / (loss) attributable to controlling shareholders or earnings / (loss) per share attributable to common shareholders, as determined by GAAP. The Company’s definition of Adjusted net income / (loss) attributable to controlling shareholders and Adjusted earnings / (loss) per share attributable to common shareholders may not be the same as that used by other companies in the shipping or other industries. Adjusted net income / (loss) attributable to controlling shareholders and Adjusted earnings / (loss) per share attributable to common shareholders are not adjusted for all non-cash income and expense items that are reflected in our statement of cash flows.
About EuroDry Ltd. EuroDry Ltd. was formed on January 8, 2018 under the laws of the Republic of the Marshall Islands to consolidate the drybulk fleet of Euroseas Ltd into a separate listed public company. EuroDry was spun-off from Euroseas Ltd on May 30, 2018; it trades on the NASDAQ Capital Market under the ticker EDRY.
EuroDry operates in the dry cargo, drybulk shipping market. EuroDry’s operations are managed by Eurobulk Ltd., an ISO 9001:2008 and ISO 14001:2004 certified affiliated ship management company and Eurobulk (Far East) Ltd. Inc., which are responsible for the day-to-day commercial and technical management and operations of the vessels. EuroDry employs its vessels on spot and period charters and under pool agreements.
The Company has a fleet of 13 vessels, including 5 Panamax drybulk carriers, 5 Ultramax drybulk carriers, 2 Kamsarmax drybulk carriers and 1 Supramax drybulk carrier. EuroDry’s 13 drybulk carriers have a total cargo capacity of 918,502 dwt. After the delivery of two Ultramax vessels in 2027 and the completion of the sale of one Panamax vessel, the Company’s fleet will consist of 14 vessels with a total carrying capacity of 970,402 dwt.
Forward Looking Statement This press release contains forward-looking statements (as defined in Section 27A of the Securities Act of 1933, as amended, and Section 21E of the Securities Exchange Act of 1934, as amended) concerning future events and the Company’s growth strategy and measures to implement such strategy; including expected vessel acquisitions and entering into further time charters. Words such as “expects,” “intends,” “plans,” “believes,” “anticipates,” “hopes,” “estimates,” and variations of such words and similar expressions are intended to identify forward-looking statements. Although the Company believes that the expectations reflected in such forward-looking statements are reasonable, no assurance can be given that such expectations will prove to have been correct. These statements involve known and unknown risks and are based upon a number of assumptions and estimates that are inherently subject to significant uncertainties and contingencies, many of which are beyond the control of the Company. Actual results may differ materially from those expressed or implied by such forward-looking statements. Factors that could cause actual results to differ materially include, but are not limited to changes in the demand for dry bulk vessels, competitive factors in the market in which the Company operates; risks associated with operations outside the United States; and other factors listed from time to time in the Company’s filings with the Securities and Exchange Commission. The Company expressly disclaims any obligations or undertaking to release publicly any updates or revisions to any forward-looking statements contained herein to reflect any change in the Company’s expectations with respect thereto or any change in events, conditions or circumstances on which any statement is based.
Nicolas Bornozis Markella Kara Capital Link, Inc. 230 Park Avenue, Suite 1540 New York, NY10169 Tel. (212) 661-7566 E-mail: [email protected]
__________________ 1Adjusted EBITDA, Adjusted net income / (loss) attributable to controlling shareholders and Adjusted earnings / (loss) per share are not recognized measurements under US GAAP (GAAP) and should not be used in isolation or as a substitute for EuroDry’s financial results presented in accordance with GAAP. Refer to a subsequent section of the Press Release for the definitions and reconciliation of these measurements to the most directly comparable financial measures calculated and presented in accordance with GAAP.
EuroDry Ltd. was formed on January 8, 2018 under the laws of the Republic of the Marshall Islands to consolidate the drybulk fleet of Euroseas Ltd. into a separate listed public company. EuroDry was spun-off from Euroseas Ltd. on May 30, 2018; it trades on the NASDAQ Capital Market under the ticker EDRY. EuroDry operates in the dry cargo, drybulk shipping market. EuroDry’s operations are managed by Eurobulk Ltd., an ISO 9001:2008 and ISO 14001:2004 certified affiliated ship management company and Eurobulk (Far East) Ltd. Inc., which are responsible for the day- to-day commercial and technical management and operations of the vessels. EuroDry employs its vessels on spot and period charters and under pool agreements.
Mark Reichman, Managing Director, Equity Research Analyst, Natural Resources, Noble Capital Markets, Inc.
Hans Baldau, Research Associate, Noble Capital Markets, Inc.
Refer to the full report for the price target, fundamental analysis, and rating.
Sale of M/V Tasos. EuroDry Ltd. recently agreed to sell the M/V Tasos, a vessel built in 2000, for ~$5 million. The vessel is expected to be scrapped and recycled and will be delivered to its buyer between mid-February and mid-March 2025. Eurodry expects to book a gain of approximately $2.1 million. Following the sale of the M/V Tasos, Eurodry will have a fleet of 12 vessels with total cargo capacity of 843,402 dwt. Upon delivery of two Ultramax vessels in 2027, the fleet will consist of 14 vessels with total cargo capacity of 970,402 dwt.
Market environment. Charter rates have continued to decline due, in part, to a weak outlook for the economy in China, which accounts for a large portion of dry bulk trade, and previous route disruptions that have largely abated. The Panama Canal has returned to full capacity, further undermining dry bulk rates. Recent U.S. tariffs imposed on imports from China could also weigh on its economy. While higher scrapping rates and more stringent environmental regulations could constrain the available bulker fleet, we are not optimistic that rates will make a significant recovery in 2025 despite a historically low industry order book.
Equity Research is available at no cost to Registered users of Channelchek. Not a Member? Click ‘Join’ to join the Channelchek Community. There is no cost to register, and we never collect credit card information.
This Research is provided by Noble Capital Markets, Inc., a FINRA and S.E.C. registered broker-dealer (B/D).
*Analyst certification and important disclosures included in the full report. NOTE: investment decisions should not be based upon the content of this research summary. Proper due diligence is required before making any investment decision.