ATHENS, Greece, July 31, 2026 (GLOBE NEWSWIRE) — EuroDry Ltd. (NASDAQ: EDRY, the “Company” or “EuroDry”), an owner and operator of drybulk vessels and provider of seaborne transportation for drybulk cargoes, announced today that it will release its financial results for the second quarter ended June 30, 2026, on August 6, 2026, before market opens in New York.
On the same day, Thursday, August 6, 2026, at 9:30 a.m. Eastern Time, the Company’s management will host a conference call and webcast to discuss the results.
ConferenceCalldetails: Participants should dial into the call 10 minutes before the scheduled time using the following numbers: 800-717-1738 (US Toll-Free Dial In) or +1 646-307-1865 (US and Standard International Dial In). Please quote “EuroDry” to the operator and/or conference ID 13762074.
Alternatively, participants can register for the call using the call me option for a faster connection to join the conference call. You can enter your phone number and let the system call you right away. Click here for the call me option.
AudioWebcast-SlidesPresentation: There will be a live and then archived webcast of the conference call and accompanying slides, available on the Company’s website. To listen to the archived audio file, visit our website http://www.eurodry.gr and click on Company Presentations under our Investor Relations page. Participants to the live webcast should register on the website approximately 10 minutes prior to the start of the webcast.
The slide presentation for the second quarter ended June 30, 2026, will also be available in PDF format 10 minutes prior to the conference call and webcast, accessible on the company’s website (www.eurodry.gr) on the webcast page. Participants to the webcast can download the PDF presentation.
AboutEuroDryLtd. EuroDry Ltd. was formed on January 8, 2018, under the laws of the Republic of the Marshall Islands to consolidate the drybulk fleet of Euroseas Ltd into a separate listed public company. EuroDry was spun off from Euroseas Ltd on May 30, 2018; it trades on the NASDAQ Capital Market under the ticker EDRY.
EuroDry operates in the dry cargo, drybulk shipping market. EuroDry’s operations are managed by Eurobulk Ltd., an ISO 9001:2008 and ISO 14001:2004 certified affiliated ship management company and Eurobulk (Far East) Ltd. Inc., which are responsible for the day-to-day commercial and technical management and operations of the vessels. EuroDry employs its vessels on spot and period charters.
The Company has a fleet of 11 vessels, including 3 Panamax drybulk carriers, 5 Ultramax drybulk carriers, 2 Kamsarmax drybulk carriers and 1 Supramax drybulk carrier. EuroDry’s 12 drybulk carriers have a total cargo capacity of 766,420 dwt. After the delivery of two Ultramax vessels in 2027 and the delivery of the two Kamsarmax vessels in 2028, the Company’s fleet will consist of 15 vessels with a total carrying capacity of 1,050,420 dwt.
American consumers grew more optimistic in July, even as the war with Iran appeared to widen and gasoline prices climbed back above $4 a gallon. The University of Michigan’s final assessment of consumer sentiment for the month showed the headline index climbed nearly 12% from June’s level to 55.2, slightly above the already elevated preliminary reading of 54.4 released earlier in the month.
That improvement comes with an important caveat. Sentiment remains 11% below where it stood a year ago, reflecting what the survey’s director described as a generally somber view of the economy shaped by five years of elevated inflation and persistently high prices. Consumers appear to be focused primarily on pocketbook concerns like purchasing power, with political and military developments registering as more of a background concern than a driver of sentiment itself.
Two Surveys, Two Different Signals
The improvement in the University of Michigan reading stands in contrast to a separate measure of consumer attitudes. The Conference Board’s Consumer Confidence Index actually slid in July, with respondents citing higher gas and grocery prices as a concern even as mentions of geopolitical tension declined. The divergence between the two surveys underscores how sensitive consumer sentiment has become to specific, tangible cost pressures rather than broader macro or political narratives.
The Inflation Backdrop
The sentiment data arrives alongside a genuinely mixed set of economic signals. June consumer prices grew 3.5% year over year, with average hourly earnings gains just barely keeping pace even as inflation cooled modestly from its apparent peak in May. The Federal Reserve’s preferred inflation gauge, the Personal Consumption Expenditures index, showed a similar pattern, slower price growth in June compared to the prior month, but still elevated relative to the Fed’s target.
Separately, data released this week showed second quarter economic growth came in slower than expected. Notably, consumer spending itself remained strong even as overall GDP growth decelerated, a combination that suggests households are continuing to spend despite feeling squeezed by prices, rather than pulling back broadly.
Why This Matters for Small Cap Investors
For companies operating below the $2 billion market cap threshold, this data presents a genuinely nuanced picture rather than a clean bullish or bearish signal. Rising sentiment alongside continued strong consumer spending is a constructive combination for consumer-facing small caps in retail, restaurants, and discretionary goods, even if that sentiment remains historically depressed and gas prices continue pressuring household budgets.
The divergence between the University of Michigan and Conference Board surveys is also worth watching closely in the months ahead. If the softer Conference Board reading proves to be the more accurate leading indicator, consumer-facing small caps could see demand soften even as broader sentiment metrics suggest improvement. If the University of Michigan’s more optimistic reading holds, it would support the case that consumers are adapting to a higher cost environment rather than retreating from it entirely, a distinction that matters considerably for companies planning inventory, staffing, and pricing strategy heading into the back half of the year.
Noble Capital Markets connects emerging growth companies with investors through virtual and in-person equity conferences, scheduled one-on-one meetings, non-deal roadshows and investor networking events.
These events give investors direct access to public company executives while helping participating companies build awareness, communicate their investment stories and develop relationships across Noble’s investor network.
Upcoming Noble Capital Markets Conferences
Presenting-company registration is now open for Noble’s October and December 2026 virtual equity conferences and NobleCon22, Noble’s flagship in-person conference in February 2027.
December 2026 Emerging Growth Virtual Equity Conference
December 15–16, 2026 | Virtual
Noble’s December Emerging Growth Virtual Equity Conference will provide another opportunity for investors to hear directly from public company management teams before the end of the year.
The conference will feature:
Half-hour corporate presentation sessions with moderated fireside-style Q&A
Scheduled one-on-one meetings with qualified investors
Companies from multiple emerging growth sectors
On-demand presentation replays hosted on Channelchek after the event
Presenting-company registration is now open. Investor registration will open soon.
THE Noble Mining Investment Conference is a collaboration between THE Mining Investment Event, which takes place annually in June in Quebec City, and Noble Capital Markets, a comprehensive SEC/FINRA-registered broker-dealer headquartered in Boca Raton, focused solely on serving public and private companies.
The two-day, in-person conference will feature:
Exclusive networking events
Company presentations and keynotes
1×1 investor meetings
Direct access to Noble analysts, investment bankers and executives
A large-scale evening networking event at The Addison in Boca Raton
THE Noble Mining Investment Conference is designed to connect resource companies with institutional investors, analysts and high-net-worth individuals.
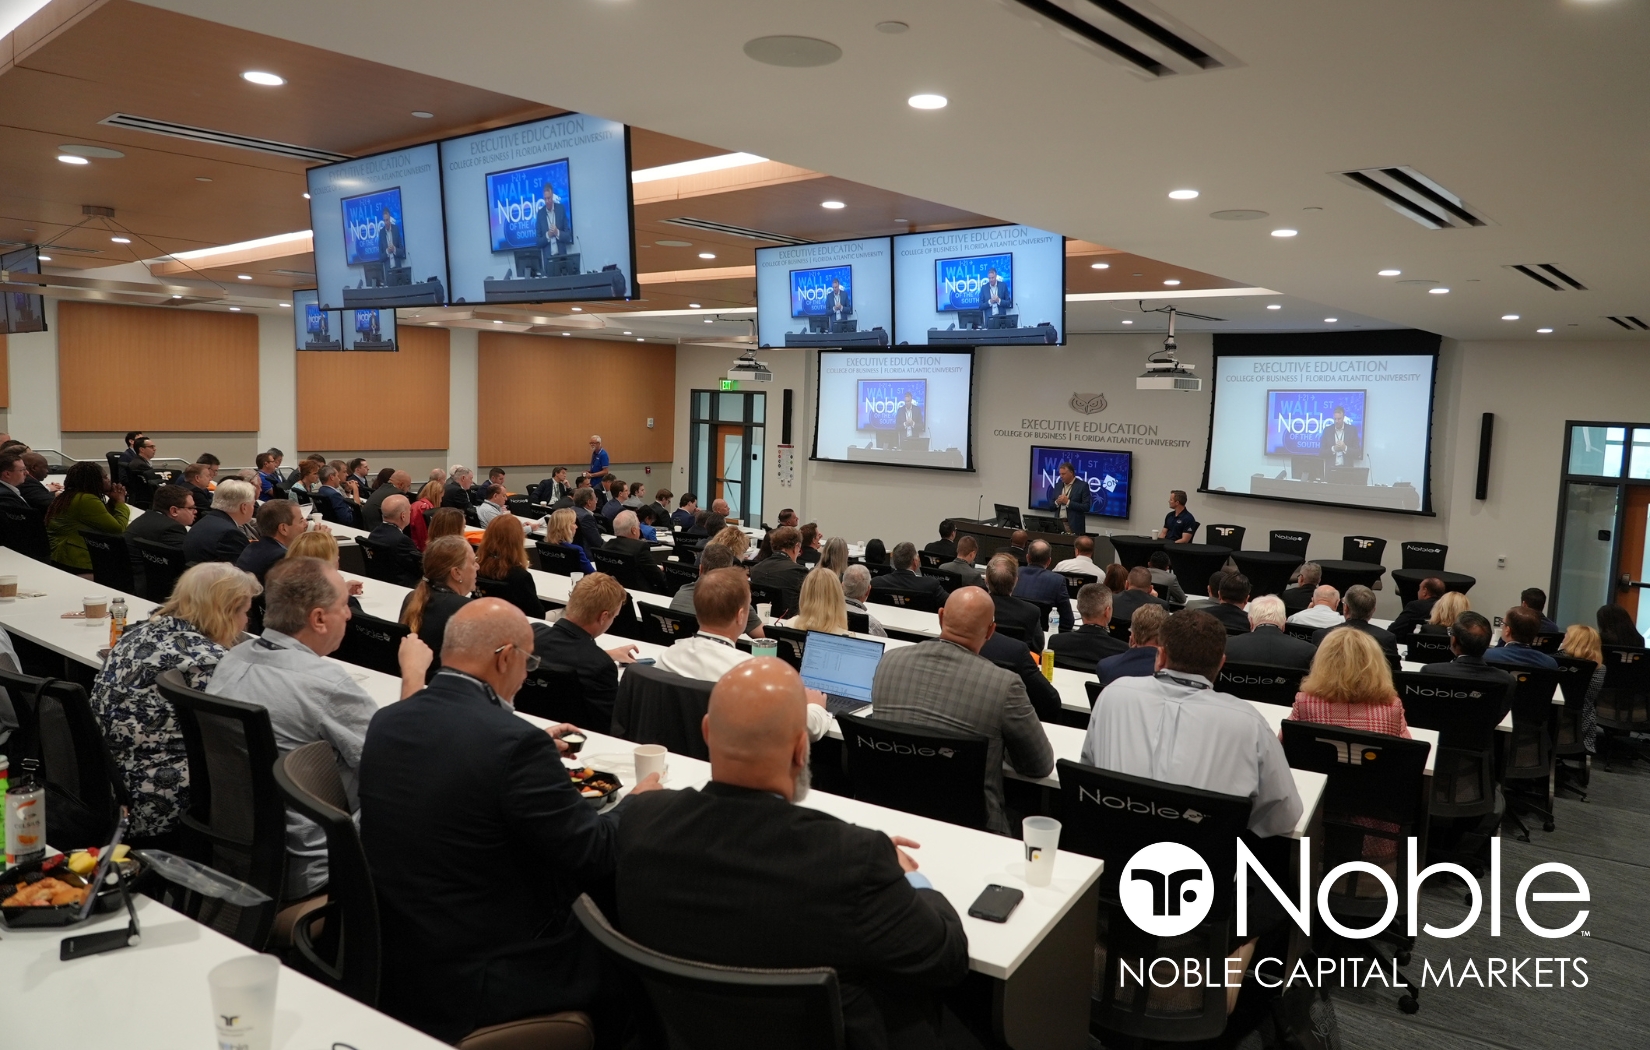
NobleCon22, Noble Capital Markets’ 22nd Annual Emerging Growth Equity Conference, will bring public company executives, institutional investors, family offices, wealth managers, financial advisors and qualified individual investors together at the Florida Atlantic University College of Business Executive Education complex.
The two-day, in-person conference will feature:
Four simultaneous corporate presentation tracks
Brief company overviews followed by moderated fireside-style Q&A sessions
Scheduled one-on-one meetings between qualified investors and C-suite executives
Expanded private meeting facilities, including 13 private meeting rooms and 40 meeting tables
Direct access to Noble analysts, investment bankers and executives
A large-scale evening networking event at The Addison in Boca Raton
NobleCon22 is designed to create meaningful interaction between emerging growth company leadership and investors seeking differentiated investment ideas.
Couldn’t attend one of Noble’s earlier 2026 virtual equity conferences live? Replays of participating company presentations and moderated Q&A sessions are available through Channelchek.
Registered Channelchek members can watch management teams discuss their companies, strategies, markets and growth opportunities at no cost.
October 2026 Virtual Equity Conference
Watch presentations and moderated Q&A sessions from companies that participated in Noble’s February 2026 Emerging Growth Virtual Equity Conference.
Noble Capital Markets hosts in-person and virtual meetings with executives from companies listed on Channelchek.
Events are held throughout the United States and virtually, giving qualified investors opportunities to speak directly with company management teams in more focused settings.
Roadshow formats may include:
Breakfast meetings
Luncheons
Cocktail receptions
Virtual management meetings
Scheduled one-on-one meeting days
Investor participation is free, with no obligation to invest. Attendance is subject to qualification and availability, and seating at in-person events may be limited.
Joe Gomes, CFA, Managing Director, Equity Research Analyst, Generalist , Noble Capital Markets, Inc.
Refer to the full report for the price target, fundamental analysis, and rating.
Overview. Titan’s second quarter results reflect solid improvement from the prior year. The Company continues to benefit from its diverse business model, even in the face of ongoing challenging Agriculture end markets. This quarter, it was the Consumer segment that drove performance. Titan’s one-stop-shop product and distribution strategy is a key element of the diverse business model, in our view.
2Q26 Results. Driven by a 27.2% increase in Consumer segment revenue, Titan’s consolidated revenue grew 5.2% to $484 million in the second quarter. This was towards the high end of management’s guidance. We were at $480 million. Adjusted EBITDA of $34 million was up 13.3% y-o-y and exceeded the high end of management’s guidance. We were at $29 million. Titan reported quarterly net income of $6.3 million, or $0.09/sh, partly driven by tariff refund recoveries.
Equity Research is available at no cost to Registered users of Channelchek. Not a Member? Click ‘Join’ to join the Channelchek Community. There is no cost to register, and we never collect credit card information.
This Company Sponsored Research is provided by Noble Capital Markets, Inc., a FINRA and S.E.C. registered broker-dealer (B/D).
*Analyst certification and important disclosures included in the full report. NOTE: investment decisions should not be based upon the content of this research summary. Proper due diligence is required before making any investment decision.
Mark Reichman, Managing Director, Equity Research Analyst, Natural Resources, Noble Capital Markets, Inc.
Refer to the full report for the price target, fundamental analysis, and rating.
Tier 1 Gold Deposit Potential. Tectonic Metals Inc. is a Canadian mineral exploration company focused on the acquisition, exploration, and advancement of gold projects in Alaska, one of the world’s premier mining jurisdictions. The company’s flagship asset is the district-scale Flat Gold Project in southwestern Alaska, which hosts a rapidly growing intrusion-related gold system with multi-million-ounce potential and remains the primary focus of exploration and resource expansion. Tectonic also owns the Tibbs Gold Project in Alaska’s Goodpaster Mining District.
Expanding the Leadership Team. Tectonic Metals recently appointed Ms. Keren Yun as Vice President, Investor Relations to lead investor relations, stakeholder engagement, and capital markets communications. Her appointment will strengthen the company’s engagement with the investment community as the company advances the Flat Gold Project and executes its district-scale exploration strategy. Ms. Yun is a strategic communications and investor relations professional with over two decades of experience working with exploration, development, and producing companies across the global mining sector. Prior to joining Tectonic, Ms. Yun led communications initiatives supporting Wyloo’s Eagle Nest Project in Ontario.
Equity Research is available at no cost to Registered users of Channelchek. Not a Member? Click ‘Join’ to join the Channelchek Community. There is no cost to register, and we never collect credit card information.
This Research is provided by Noble Capital Markets, Inc., a FINRA and S.E.C. registered broker-dealer (B/D).
*Analyst certification and important disclosures included in the full report. NOTE: investment decisions should not be based upon the content of this research summary. Proper due diligence is required before making any investment decision.
Mark Reichman, Managing Director, Equity Research Analyst, Natural Resources, Noble Capital Markets, Inc.
Refer to the full report for the price target, fundamental analysis, and rating.
Record Second Quarter 2026 Financial Results. Seanergy reported revenue, adj. EBITDA, and adj. EPS of $55.7 million, $41.5 million, and $1.32, respectively, compared to $37.5 million, $18.3 million, and $0.18 during the prior year period. We had projected revenue, adj. EBITDA, and adj. EPS of $54.9 million, $38.4 million, and $1.15, respectively. Second quarter financial results reflected both materially higher time charter equivalent (TCE) rates compared to the prior year quarter and lower-than-expected interest and finance costs relative to our estimates.
Updating Estimates. We have increased our FY 2026 revenue, adj. EBITDA, and adj. EPS estimates to $205.9 million, $134.2 million, and $3.70, respectively, compared to our prior estimates of $203.2 million, $131.3 million, and $3.50. Our revised estimates reflect higher time charter equivalent (TCE) rates and fewer off-hire days.
Equity Research is available at no cost to Registered users of Channelchek. Not a Member? Click ‘Join’ to join the Channelchek Community. There is no cost to register, and we never collect credit card information.
This Company Sponsored Research is provided by Noble Capital Markets, Inc., a FINRA and S.E.C. registered broker-dealer (B/D).
*Analyst certification and important disclosures included in the full report. NOTE: investment decisions should not be based upon the content of this research summary. Proper due diligence is required before making any investment decision.
Joe Gomes, CFA, Managing Director, Equity Research Analyst, Generalist , Noble Capital Markets, Inc.
Refer to the full report for the price target, fundamental analysis, and rating.
3QFY26 Results. Revenue for the fiscal third quarter of 2026 totaled $44.2 million, down from $83.3 million in 3Q25 and below our $50 million estimate. Gross margin of 16.7% fell from 19.1% last year and was below our 20% projection. Partly reflecting one-time charges, DLH reported a net loss of $16.8 million, or $1.16/sh, versus net income of $289,000, or $0.02/sh last year. Third quarter adjusted EBITDA came in at $3.4 million, or 7.6% of revenue, down from $8.1 million and 9.7% last year. Notably, the final CMOP contracts transitioned during the quarter.
Operating Environment. Organic growth continues to be the number one corporate priority. Organic growth will come from two sources: on-contract growth and new awards. We believe on-contract growth will drive near-term growth. Management has a number of contracts with clients that can be expanded. In terms of new business, the government procurement markets have demonstrated improved clarity and stability in recent months, marking a significant improvement in the contracting environment when compared to fiscal 2025 and earlier in 2026.
Equity Research is available at no cost to Registered users of Channelchek. Not a Member? Click ‘Join’ to join the Channelchek Community. There is no cost to register, and we never collect credit card information.
This Company Sponsored Research is provided by Noble Capital Markets, Inc., a FINRA and S.E.C. registered broker-dealer (B/D).
*Analyst certification and important disclosures included in the full report. NOTE: investment decisions should not be based upon the content of this research summary. Proper due diligence is required before making any investment decision.
Michael Kupinski, Director of Research, Equity Research Analyst, Digital, Media & Technology , Noble Capital Markets, Inc.
George Proost, Research Associate, Noble Capital Markets, Inc.
Refer to the full report for the price target, fundamental analysis, and rating.
Q2 Results. The company achieved its highest quarterly revenue to date of €69.4 million, up 27% year over year and nearly 16% above our estimate of €60 million, as illustrated in Figure #1 Q2 Results. Reported adj. EBITDA of €5.8 million also beat our estimate of €2.5 million, driven primarily by exceptional World Cup engagement and robust performance in its core markets of Spain and Mexico.
World Cup Success. The company delivered strong performance around the World Cup. Total stakes during the event reached approximately €63 million, a 180% increase over the 2022 tournament’s levels. Additionally, the company acquired around 40,000 new customers during the event, with a 56% increase in unique users.
Equity Research is available at no cost to Registered users of Channelchek. Not a Member? Click ‘Join’ to join the Channelchek Community. There is no cost to register, and we never collect credit card information.
This Company Sponsored Research is provided by Noble Capital Markets, Inc., a FINRA and S.E.C. registered broker-dealer (B/D).
*Analyst certification and important disclosures included in the full report. NOTE: investment decisions should not be based upon the content of this research summary. Proper due diligence is required before making any investment decision.
Mark Reichman, Managing Director, Equity Research Analyst, Natural Resources, Noble Capital Markets, Inc.
Refer to the full report for the price target, fundamental analysis, and rating.
Acquisition of Seattle Galvanizing Company. AZZ Inc. announced the acquisition of Seattle Galvanizing Company, Inc., a privately held provider of both hot-dip and spin galvanizing solutions that is headquartered in Arlington, Washington. The acquisition expands AZZ Metal Coatings’ geographic footprint into the Pacific Northwest by establishing a platform to serve both hot-dip and spin galvanizing customers across Washington, Oregon, Idaho, Western Montana, and Alaska from two Seattle-area locations. Seattle Galvanizing Company will be integrated into AZZ Metal Coatings’ existing network of hot-dip galvanizing and spin plants, increasing its total network to 43 sites in North America.
The Pacific Northwest’s Largest Galvanizer. Founded in 1962, Seattle Galvanizing has built a strong reputation for quality, service, and technical capability and has the capacity to process over 50,000 tons of steel. The first state-of-the-art hot-dip galvanizing facility features a 45-foot kettle, the largest in the Pacific Northwest, that will enable AZZ to process larger and more complex steel structures. A second and recently completed 38,000-square-foot spin galvanizing location was purpose-built to coat small to medium-sized metal components.
Equity Research is available at no cost to Registered users of Channelchek. Not a Member? Click ‘Join’ to join the Channelchek Community. There is no cost to register, and we never collect credit card information.
This Company Sponsored Research is provided by Noble Capital Markets, Inc., a FINRA and S.E.C. registered broker-dealer (B/D).
*Analyst certification and important disclosures included in the full report. NOTE: investment decisions should not be based upon the content of this research summary. Proper due diligence is required before making any investment decision.
Joe Gomes, CFA, Managing Director, Equity Research Analyst, Generalist , Noble Capital Markets, Inc.
Refer to the full report for the price target, fundamental analysis, and rating.
Overview. ACCO delivered a strong second quarter, with sales and adjusted EPS exceeding both prior-year results and our estimates. In the Americas segment, sales benefited from strong back-to-school sell-in and better-than-expected performance in Mexico. The International segment faced market softness and shipment disruptions from a planned systems upgrade at ACCO’s largest distribution center in EMEA, which is now complete.
2Q26 Results. Second quarter net sales increased 5.1% to $415.1 million from $394.8 million in 2025. The increase reflected 5.7% from the EPOS acquisition and 1.7% from favorable foreign exchange. Comparable sales declined 2.3% as growth in the Americas segment’s learning and creative category was more than offset by softness in the International segment and technology peripherals globally. Net income was $14.1 million, or $0.15/sh, compared with $29.2 million, or $0.31/sh, in 2025. Adjusted net income increased to $27.4 million from $25.8 million in 2025, and adjusted EPS rose to $0.29 from $0.28 in 2025.
Equity Research is available at no cost to Registered users of Channelchek. Not a Member? Click ‘Join’ to join the Channelchek Community. There is no cost to register, and we never collect credit card information.
This Company Sponsored Research is provided by Noble Capital Markets, Inc., a FINRA and S.E.C. registered broker-dealer (B/D).
*Analyst certification and important disclosures included in the full report. NOTE: investment decisions should not be based upon the content of this research summary. Proper due diligence is required before making any investment decision.
MiMedx Group (Nasdaq: MDXG) and Sanara MedTech (Nasdaq: SMTI) announced Wednesday they have entered into a definitive merger agreement under which MiMedx will acquire all outstanding shares of Sanara in a cash and stock transaction valued at $35 per share, implying a total enterprise value of approximately $350 million. Sanara shareholders will receive $33.00 in cash plus 0.4735 shares of MiMedx common stock for each share owned, a combination representing a 46% premium to Sanara’s 30-day volume-weighted average price. The boards of both companies have unanimously approved the transaction, with closing expected by the end of 2026.
MiMedx plans to fund the cash portion of the deal through existing cash on hand alongside a new $300 million term loan secured with Hayfin Capital Management. The company’s existing credit agreement will be terminated and repaid in full at closing.
What Sanara Brings to the Table
Sanara MedTech is focused entirely on developing and commercializing regenerative products for surgical markets, an area MiMedx has identified as its primary strategic growth priority. Sanara contributes more than $100 million in surgical revenue along with a high-margin, 510(k)-cleared product portfolio, meaningfully expanding MiMedx’s presence in a segment where the company was already seeing meaningful traction on its own. MiMedx’s Surgical product sales grew 15% year over year in the second quarter to $39.3 million, driven by strength in its AmnioFix and AmnioEffect product lines along with early contributions from newer offerings.
Once combined, management expects the transaction to nearly double MiMedx’s surgical revenue and push combined company revenue above $400 million, with an adjusted EBITDA margin target above 20%. The deal is expected to be immediately accretive to revenue growth, gross margin, and adjusted EBITDA margin, and management anticipates more than $20 million in run-rate cost synergies.
The Balance Sheet Behind the Deal
The acquisition arrives alongside MiMedx’s second quarter results, which showed net sales of $64 million and a net loss of $14.8 million for the period. Despite that quarterly loss, the company ended the quarter with $135.8 million in cash and $119 million in net cash, and it reiterated full-year 2026 net sales guidance of $260 million to $290 million on a standalone basis. MiMedx also completed a cost reduction program targeting approximately $40 million in annualized savings and repurchased 3.5 million shares for roughly $13 million during the quarter, signaling a company managing its existing operations tightly even while pursuing a transformational acquisition.
Why This Matters for Small Cap Medtech Investors
For investors tracking regenerative medicine and surgical device companies in the small cap space, this deal reflects a broader consolidation pattern taking hold across specialized medtech niches. Companies with focused, high-margin surgical product portfolios but limited standalone scale are increasingly attractive targets for larger platforms looking to build a genuinely differentiated position across surgical subspecialties rather than compete purely on breadth. MiMedx is explicitly betting that combining two complementary regenerative medicine portfolios creates more value together than either company could generate independently, and the debt-financed structure of the deal signals real conviction in that combined growth trajectory.
HOUSTON, July 30, 2026 /PRNewswire/ — Summit Midstream Corporation (NYSE: SMC) (“Summit”, “SMC” or the “Company”) announced today that it will report operating and financial results for the second quarter of 2026 on Monday, August 10, 2026, after the close of trading on the New York Stock Exchange.
Second Quarter 2026 Earnings Call
SMC will host a conference call at 10:00 a.m. Eastern on August 11, 2026, to discuss its quarterly operating and financial results. The call can be accessed via teleconference at: Q2 2026 Summit Midstream Corporation Earnings Conference Call (https://register-conf.media-server.com/register/BI8cebf785fce846a9bb80ae80660d3cbc). Once registration is completed, participants will receive a dial-in number along with a personalized PIN to access the call. While not required, it is recommended that participants join 10 minutes prior to the event start. The conference call, live webcast and archive of the call can be accessed through the Investors section of SMC’s website at www.summitmidstream.com.
About Summit Midstream Corporation
SMC is a value-driven corporation focused on developing, owning and operating midstream energy infrastructure assets that are strategically located in the core producing areas of unconventional resource basins, primarily shale formations, in the continental United States. SMC provides natural gas, crude oil and produced water gathering, processing and transportation services pursuant to primarily long-term, fee-based agreements with customers and counterparties in five unconventional resource basins: (i) the Williston Basin, which includes the Bakken and Three Forks shale formations in North Dakota; (ii) the Denver-Julesburg Basin, which includes the Niobrara and Codell shale formations in Colorado and Wyoming; (iii) the Fort Worth Basin, which includes the Barnett Shale formation in Texas; (iv) the Arkoma Basin, which includes the Woodford and Caney shale formations in Oklahoma; and (v) the Piceance Basin, which includes the Mesaverde formation as well as the Mancos and Niobrara shale formations in Colorado. SMC has an equity method investment in Double E Pipeline, LLC, which provides interstate natural gas transportation service from multiple receipt points in the Delaware Basin to various delivery points in and around the Waha Hub in Texas. SMC is headquartered in Houston, Texas.
Forward-Looking Statements
This press release includes certain statements concerning expectations for the future that are forward-looking within the meaning of the federal securities laws. Forward-looking statements include, without limitation, any statement that may project, indicate or imply future results, events, performance or achievements and may contain the words “expect,” “intend,” “plan,” “anticipate,” “estimate,” “believe,” “will be,” “will continue,” “will likely result,” and similar expressions, or future conditional verbs such as “may,” “will,” “should,” “would” and “could.” In addition, any statement concerning future financial performance (including future revenues, earnings or growth rates), payment of dividends on any series of stock, ongoing business strategies and possible actions taken by SMC or its subsidiaries are also forward-looking statements. Forward-looking statements also contain known and unknown risks and uncertainties (many of which are difficult to predict and beyond management’s control) that may cause SMC’s actual results in future periods to differ materially from anticipated or projected results. An extensive list of specific material risks and uncertainties affecting SMC is contained in its 2025 Annual Report on Form 10-K filed with the Securities and Exchange Commission (the “SEC”) on March 16, 2026, as amended and updated from time to time. Any forward-looking statements in this press release are made as of the date of this press release and SMC undertakes no obligation to update or revise any forward-looking statements to reflect new information or events.
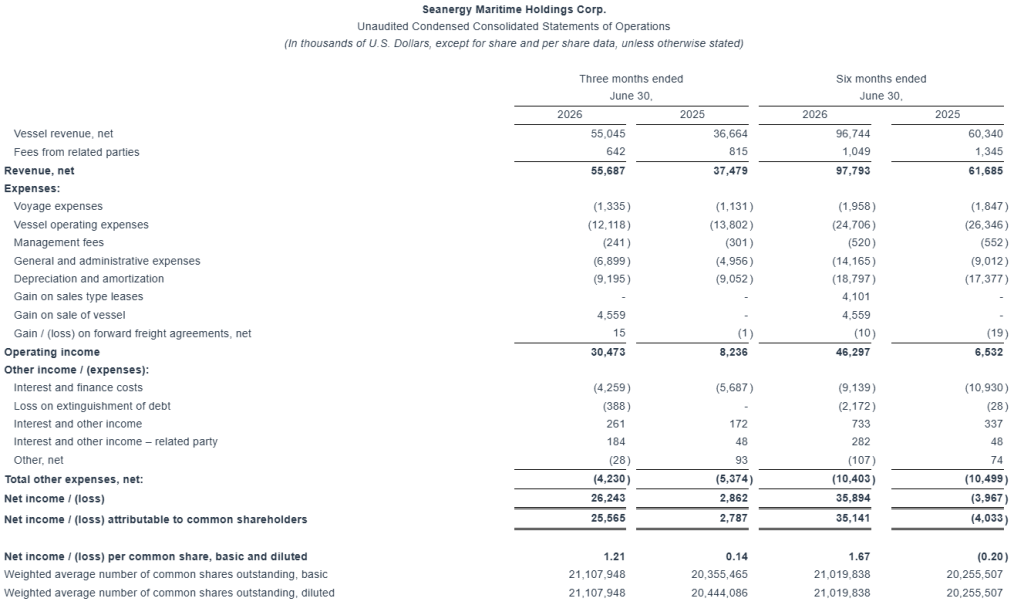
Delivers Record Q2 Net Income of $26.2 Million and EPS/ Adjusted EPS of $1.21/ $1.32; Declares Quarterly Dividend of $0.35 Per Share, Representing the Company’s 19th Consecutive Distribution
Expands Fleet Renewal Program to $591 Million Across Eight Modern Capesize & Newcastlemax Vessels; Completes €100 Million Unsecured Bond Offering
______________________________ 1 Adjusted earnings / (loss) per share, Adjusted Net Income / (loss), EBITDA and Adjusted EBITDA are non-GAAP measures. Please see the reconciliation below of Adjusted earnings / (loss) per share, Adjusted Net Income / (loss), EBITDA and Adjusted EBITDA to net income, the most directly comparable U.S. GAAP measure. 2 Time Charter Equivalent (“TCE”) rate is a non-GAAP measure. Please see the reconciliation below of TCE rate to net revenues from vessels, the most directly comparable U.S. GAAP measure.
Highlights and Developments:
Exceptional Financial Performance & Consistent Shareholder Returns — $108.4 Million Returned Since Program Inception
Record Q2 and H1 profit of $26.2 million and $35.9 million, respectively, up from $2.9 million net income and $4.0 million loss in the prior-year periods
Quarterly cash dividend of $0.35 per share, the Company’s 19th consecutive cash dividend; payout of approx. 27% of Q2 Adjusted EPS
$108.4 million of total capital returned to shareholders, comprising $63.2 million of cash dividends ($3.19 per share) and $45.2 million of share, warrant and convertible note repurchases
Disciplined Fleet Growth and Renewal – $591 million Aggregate Investment Plan
Entered into an agreement to acquire two Japanese-built Capesize vessels – a newbuilding and a modern 2022-built vessel – for aggregate consideration of approximately $130 million, both scheduled to join the fleet in early 2029
Expanded fleet renewal and growth program from six to eight modern vessels comprising seven newbuildings and one 2022-built Capesize, for an aggregate investment of approximately $591 million; four vessels to be delivered in 2027
Completed the profitable sale of the 2010-built M/V Squireship, generating approximately $13.8 million of net liquidity and a gain on sale of approximately $4.6 million, while continuing to provide technical and management services to the vessel
Secured long-term time charters with leading counterparties for the three China-built 2027 newbuildings with floor rates covering expected cash breakeven, as well as potentially significant index-linked market upside
Diversified Capital Resources — €100 Million Bond and $296.5 Million of Facilities Secured
Successfully completed a €100 million 5-year unsecured corporate bond offering in Greece, further diversifying the Company’s capital resources and supporting its fleet growth and renewal program
Fleet renewal program substantially funded: $72.6 million advanced from own funds and approximately $296.5 million of pre- and post-delivery facilities secured, alongside the €100 million bond
Strong Commercial Performance
Q2 2026 fleet TCE of $32,355 per day, an increase of 63% year over year
Estimated Q3 2026 TCE of approximately $31,0003 per day – increased H2 earnings visibility
ATHENS, Greece, July 30, 2026 (GLOBE NEWSWIRE) — Seanergy Maritime Holdings Corp. (“Seanergy” or the “Company”) (NASDAQ: SHIP), a leading pure-play Capesize owner and operator, today reported its financial results for the second quarter and six months ended June 30, 2026, and declared a quarterly cash dividend of $0.35 per common share. This marks Seanergy’s 19th consecutive quarterly dividend under its capital return policy and reflects the Company’s strong earnings generation and disciplined approach to capital allocation.
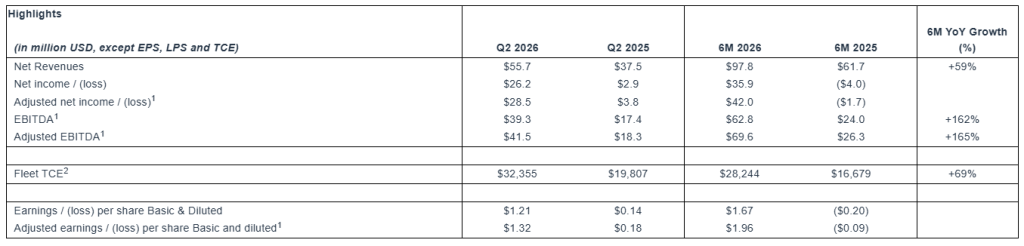
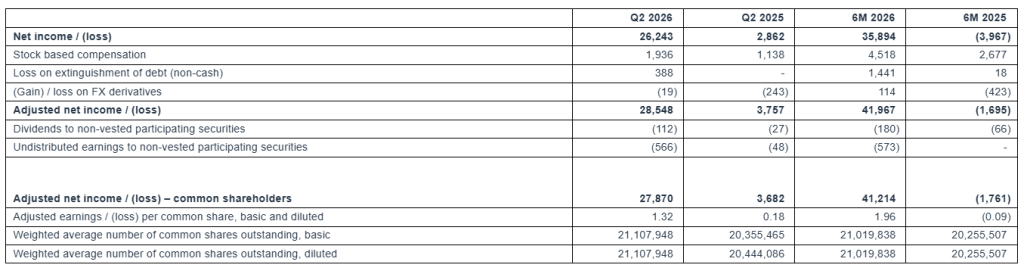
For the quarter ended June 30, 2026, the Company generated Net Revenues of $55.7 million, compared to $37.5 million in the second quarter of 2025. Net Income and Adjusted Net Income for the quarter increased to $26.2 million and $28.5 million, respectively, compared to $2.9 million and $3.8 million, respectively, in the prior-year period. EBITDA and Adjusted EBITDA for the quarter reached $39.3 million and $41.5 million, respectively, compared to $17.4 million and $18.3 million, respectively, for the same period of 2025. The fleet achieved a daily TCE of $32,355 for the second quarter of 2026, representing a 63% year-over-year increase.
For the six months ended June 30, 2026, Seanergy generated Net Revenues of $97.8 million, Net Income of $35.9 million and Adjusted Net Income of $42.0 million, compared to Net Revenues of $61.7 million, a Net Loss of $4.0 million and Adjusted Net Loss of $1.7 million in the first half of 2025. Adjusted EBITDA increased by 165% to $69.6 million, while Adjusted EPS reached $1.96, compared to an adjusted loss per share of $0.09 in the prior-year period. Fleet TCE increased by 69% to $28,244 per day.
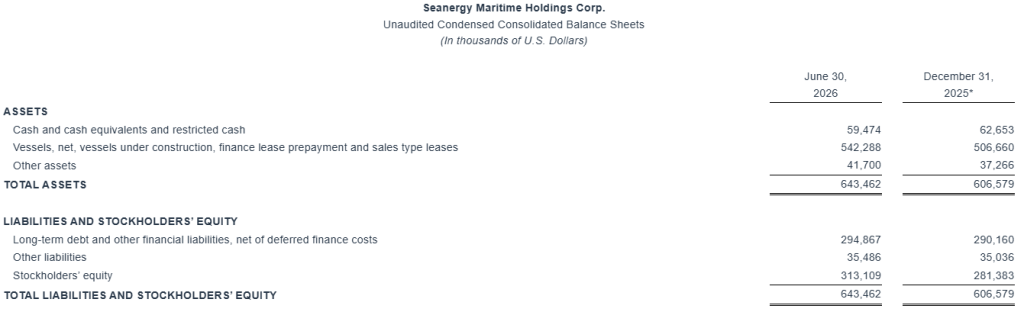
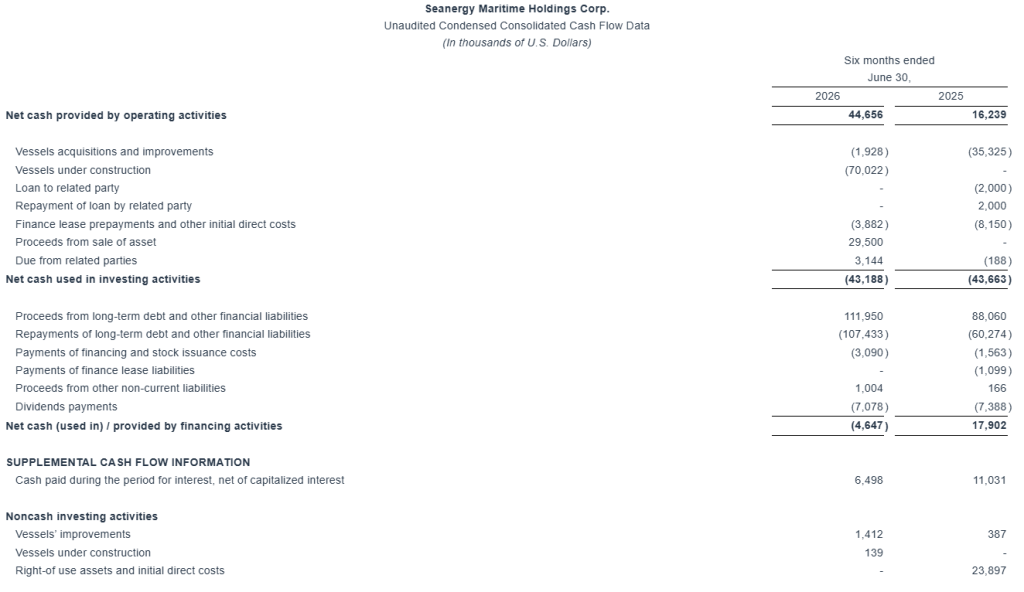
Cash and cash-equivalents and restricted cash, as of June 30, 2026, stood at $59.5 million. Long-term debt (senior loans and other financial liabilities) net of deferred charges amounted to $294.9 million, compared with a fleet book value of $542.3 million, including advances paid for vessels under construction and a vessel under sales-type lease, resulting in a fleet loan-to-book value ratio of approximately 55%. Stockholders’ equity increased by $31.7 million, or 11% to $313.1 million, over the six-month period.
______________________________ 3 Blended Q3 TCE estimated on approx. 71% of Q3 available days already fixed and FFA rates as of July 28, 2026.
Stamatis Tsantanis, the Company’s Chairman & Chief Executive Officer, stated:
“Seanergy delivered record results in the second quarter with Net Income of $26.2 million and Adjusted EPS of $1.32, bringing first-half Adjusted EPS to $1.96, and underscoring the strong earnings power and operating leverage of our pure-play Capesize platform.”
“Building on our solid performance, we continued to execute on our disciplined capital return policy. Our board of directors declared a quarterly cash dividend of $0.35 per share, our 19th consecutive distribution, bringing cumulative dividends to $3.19 per share, or approximately $63.2 million in aggregate. In total, we have returned $108.4 million to shareholders since program inception, through dividends and the repurchases of shares, warrants and convertible notes.”
“We further advanced our fleet renewal strategy by agreeing to acquire two additional high-quality Japanese Capesize vessels for an aggregate consideration of approximately $130 million. These transactions consist of a scrubber-fitted newbuilding and a modern 2022-built vessel, both expected to join our fleet in 2029. These acquisitions lock in modern, fuel-efficient tonnage and scarce 2029 delivery slots ahead of an anticipated tightening in Capesize supply.”
“Our fleet renewal and growth program now comprises eight modern vessels, including seven newbuildings and one 2022-built Capesize, and represents an aggregate investment of approximately $591 million. Four of the eight vessels are scheduled to deliver in 2027, accelerating fleet renewal and earnings contribution from 2027 onward. We continue to execute selectively, pairing scarce delivery slots with disposals of older tonnage at firm valuations, while maintaining a disciplined balance sheet.”
“We have also secured multi-year employment for our three Chinese-built 2027 newbuildings with leading global counterparties, at floor rates covering expected cash breakeven plus a premium index-linked formula and profit sharing above an upper threshold. This approach materially de-risks the first phase of the program from day one of delivery while maintaining the upside potential central to our investment thesis.”
“Our successful issuance of a €100 million unsecured corporate bond in Greece diversifies our capital base and complements our existing secured financings. Its five-year non-amortizing structure provides non-dilutive, long-term capital precisely matched to the construction phase of our program, before the new vessels begin generating revenues.”
“The Capesize market continued to perform strongly during the second quarter, supported by record quarterly China iron ore imports and continued growth in bauxite trade against low fleet supply growth. Looking ahead, the market outlook remains constructive: a low orderbook against a rapidly ageing fleet, strong iron ore export growth, and resilient coal and bauxite volumes. In this context, we have fixed about 55% of our ownership days for the second half of the year at a daily rate of $30,800, providing significant earnings visibility while preserving meaningful index-linked exposure in a strong Capesize market. Additionally, based on the current FFA curve, our estimated 3Q 2026 daily TCE of approximately $31,000 further reinforces our positive earnings outlook and our ability to continue generating attractive returns in the quarters ahead.”
“Our strategic direction remains clear: deliver consistent shareholder distributions, invest strategically in modern tonnage, and preserve financial flexibility. We believe this balanced approach positions Seanergy to create meaningful long-term shareholder value.”
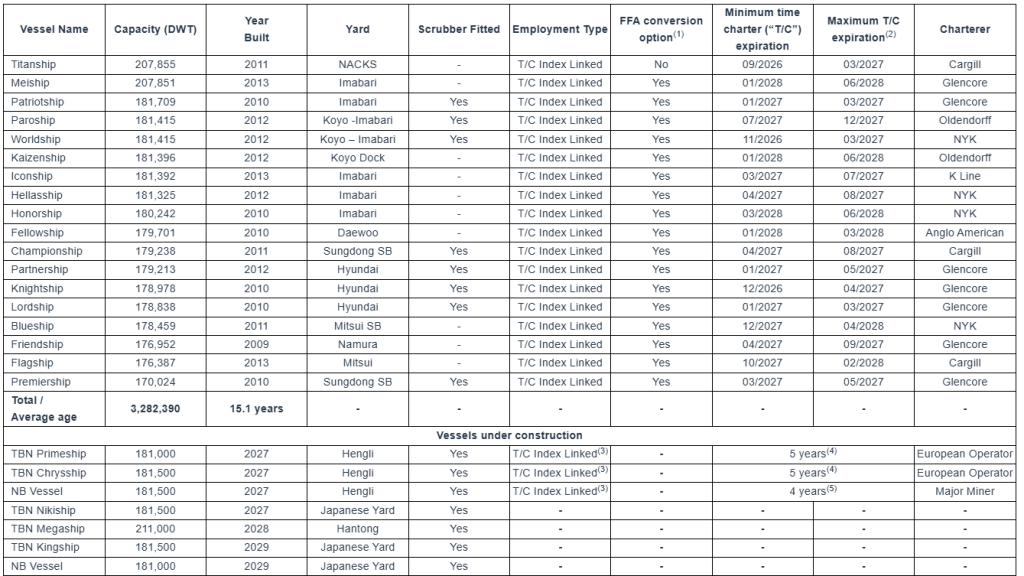
Company Fleet:
Fleet Data:
(U.S. Dollars in thousands)
(In thousands of U.S. Dollars, except operating days and TCE rate)
(In thousands of U.S. Dollars, except ownership days and Daily Vessel Operating Expenses)
Net income / (loss) to EBITDA and Adjusted EBITDA Reconciliation:
(In thousands of U.S. Dollars)
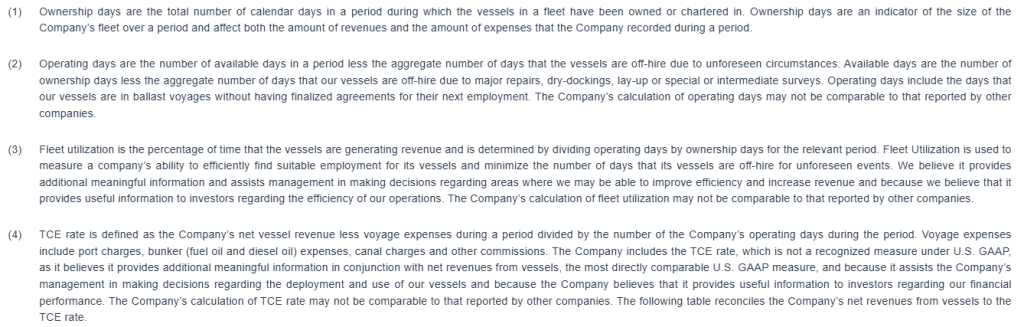
Earnings Before Interest, Taxes, Depreciation and Amortization (“EBITDA”) represents the sum of net income / (loss), net interest and finance costs, depreciation and amortization and, if any, income taxes during a period. EBITDA and Adjusted EBITDA are not recognized measurements under U.S. GAAP. Adjusted EBITDA represents EBITDA adjusted to exclude stock-based compensation, (gain) / loss on forward freight agreements, net, loss on extinguishment of debt, and (gain) / loss on FX derivatives. which the Company believes are not indicative of the ongoing performance of its core operations.
EBITDA and adjusted EBITDA are presented as we believe that these measures are useful to investors as a widely used means of evaluating operating profitability from period to period. Management also uses these non-GAAP financial measures in making financial, operating and planning decisions and in evaluating the Company’s performance. EBITDA and adjusted EBITDA as presented here may not be comparable to similarly titled measures presented by other companies. These non-GAAP measures should not be considered in isolation from, as a substitute for, or superior to, financial measures prepared in accordance with U.S. GAAP.
Adjusted Net Income / (Loss) Reconciliation and calculation of Adjusted Earnings / (Loss) Per Share
(In thousands of U.S. Dollars, except for share and per share data)
To derive Adjusted Net Income and Adjusted Earnings / (loss) Per Share, a non-GAAP financial measure, from Net Income / (loss), we adjust for dividends and undistributed earnings to non-vested participating securities and exclude non-cash items, as provided in the table above. We believe that Adjusted Net Income / (loss) and Adjusted Earnings / (loss) Per Share assist our management and investors by increasing the comparability of our performance from period to period since each such measure eliminates the effects of such non-cash items as loss on extinguishment of debt, stock based compensation, (gain) / loss on FX derivatives and other items which may vary from year to year, for reasons unrelated to overall operating performance. In addition, we believe that the presentation of the respective measure provides investors with supplemental data relating to our results of operations, and therefore, with a more complete understanding of factors affecting our business than with GAAP measures alone. Our method of computing Adjusted Net Income / (loss) and Adjusted Earnings / (loss) Per Share may not necessarily be comparable to other similarly titled captions of other companies due to differences in methods of calculation.
Third Quarter 2026 TCE Rate Guidance:
As of the date hereof, approximately 71% of the Company fleet’s expected operating days in the third quarter of 2026 have been fixed at an estimated TCE rate of approximately $30,112. Assuming that for the remaining operating days of our index-linked time charters, the BCI-180 rate will be equal to $33,980 (based on the FFA curve as of July 28, 2026), our estimated TCE rate for the third quarter of 2026 will be approximately $30,9984. The following table provides the breakdown of index-linked charters and fixed-rate charters in the third quarter of 2026:
______________________________ 4 This guidance is based on certain assumptions and the Company cannot provide assurance that these TCE rate estimates, or projected utilization rates will be realized. TCE estimates include certain floating (index) to fixed rate conversions concluded in previous periods. For vessels on index-linked T/Cs, the TCE rate realized will vary with the underlying index, and for the purposes of this guidance, the BCI 5TC 180 rate assumed for the remaining operating days of the quarter for an index-linked T/C is equal to $33,980 (based on the FFA curve as of July 28, 2026). Spot estimates are provided using the load-to-discharge method of accounting. The rates quoted are for days currently contracted. Increased ballast days at the end of the quarter will reduce the additional revenues that can be booked based on the accounting cut-offs and therefore the resulting TCE rate will be reduced accordingly.
Second Quarter and Recent Developments:
Dividend Distribution for Q1 2026 and Declaration of Q2 2026 Dividend
On July 10, 2026, the Company paid a quarterly cash dividend of $0.20 per common share for the first quarter of 2026 to all shareholders of record as of June 29, 2026.
The Company has declared a quarterly cash dividend of $0.35 per common share for the second quarter of 2026 payable on or about October 9, 2026, to all shareholders of record as of September 25, 2026.
The Company is renewing its fleet through the addition of advanced eco-design newbuildings and modern secondhand tonnage, while selectively divesting older vessels. The seven newbuildings under the Company’s fleet renewal and growth program are designed to meet International Maritime Organization requirements for Phase 3 greenhouse gas emissions reduction (“IMO GHG Phase 3”) and Tier III nitrogen oxide emissions (“IMO NOx Tier III”) and are scrubber-fitted.
In parallel, the Company continues to implement the environmental upgrade program across its existing fleet, having invested approximately $37.3 million since 2024 in environmental upgrades, vessel improvements and dry-dockings.
Together, the fleet renewal and environmental upgrade initiatives are expected to improve fuel efficiency and reduce greenhouse gas emissions. Having completed the majority of the scheduled upgrades in prior quarters, the Company expects approximately 50 off-hire days for the remainder of 2026 in connection with scheduled dry-dockings, vessel repairs and environmental upgrades.
Fleet Update
Acquisition of Two Japanese-Built Capesize Vessels for 2029 Delivery
The Company has entered into an agreement with unaffiliated third parties to acquire two Japanese Capesize vessels for aggregate consideration of approximately $130.0 million.
The acquisitions comprise:
a 181,000 dwt scrubber-fitted Capesize newbuilding, expected to be delivered between the first and second quarters of 2029; and
a 182,162 dwt Capesize vessel built in 2022, with forward delivery expected between the fourth quarter of 2028 and the second quarter of 2029.
The Company has already paid a deposit of 5% of the purchase price for the Capesize newbuilding. The remaining balance of the purchase price shall be payable as follows: 35% in three instalments by November 2028, and the remaining 60% upon delivery of the vessel. Concerning the 2022-built Capesize vessel, the agreement involves a 10% advance payment, while the remaining 90% of the purchase price will be payable upon the vessel’s delivery.
The newbuilding vessel will incorporate advanced eco-design features, intended to enhance fuel efficiency and reduce emissions. Together, the two acquisitions will add modern high-quality tonnage at a delivery point, which is aligned with the next phase of the Company’s fleet renewal strategy and expected requirements.
To date, the Company has already paid $72.6 million for its newbuilding and fleet renewal program while maintaining a strong liquidity position.
Sale of M/V Squireship
In June 2026, the Company delivered to United Maritime Corporation, a related party, the 170,018 dwt M/V Squireship, built in 2010. The gross sale price was approximately $29.5 million, generating net proceeds of about $13.8 million. Seanergy continues to provide technical and management services to the vessel, facilitating the continuation of the vessel’s existing commercial employment.
Commercial Updates
Long-Term Time Charters for Three 2027-Delivery Newbuildings
In July 2026, the Company entered into multi-year time charter agreements for three scrubber-fitted Capesize newbuildings scheduled for delivery between the second and fourth quarters of 2027.
Two of our vessels to be delivered in 2027, to be named M/V Primeship and M/V Chrysship, have each been chartered for a period of five years to a leading European operator, with three optional extension periods of minimum 10 to maximum 14 months each. The third vessel, a 181,000 dwt Capesize vessel scheduled for delivery in the fourth quarter of 2027 has been chartered for four years to a major mining company, with two optional extension periods of about 11 to about 13 months. The charters are expected to commence upon the respective delivery of each vessel.
The agreements provide for average floor rates of approximately $23,100 per day, designed to cover the vessels’ estimated cash breakeven levels. Above the floor, hire is calculated at a significant premium over the BCI-180 up to an average upper threshold of approximately $29,750 per day. Above the upper threshold, incremental earnings based on the same premium over the BCI-180 are shared equally between Seanergy and the respective charterer.
M/V Kaizenship – New Time Charter agreement
In July 2026, the Company entered into a new time charter agreement with Oldendorff Carriers GmbH & Co. KG (“Oldendorff”) for the M/V Kaizenship, for a period of about 18 to about 28 months. The new time charter agreement with Oldendorff is expected to commence in August 2026. The daily hire is based on the 5 T/C routes of the BCI, with an option for the Company to fix the rate for 1 to 16 months based on the prevailing Capesize FFA curve.
M/V Blueship – New Time Charter agreement
In June 2026, the Company entered into a new time charter agreement with Nippon Yusen Kabushiki Kaisha (“NYK”) for the M/V Blueship, for a period of about minimum 14 to about maximum 17 months. The new time charter agreement with NYK is expected to commence in November 2026, in direct continuation of the maximum period of the current charter. The daily hire is based on the 5 T/C routes of the BCI along with a fixed daily premium, with an option for the Company to fix the rate for 2 to 12 months based on the prevailing Capesize FFA curve.
M/V Fellowship – Time Charter Extension
In July 2026, the existing charterer exercised its option to extend the time charter agreement for the M/V Fellowship until a minimum of January 2028 and a maximum of March 2028, with the extension commencing immediately upon the expiration of the current charter period.
M/V Friendship – Time Charter Extension
In June 2026, the existing charterer of the vessel exercised its option to extend the time charter agreement for M/V Friendship by six months beyond the current minimum/maximum charter period, in direct continuation from the previous agreement.
Financing Updates
Successful Completion of €100 Million Five-Year Unsecured Corporate Bond Offering
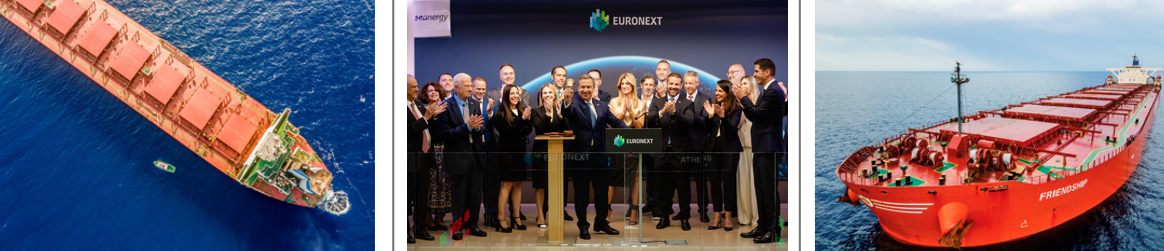
In July 2026, Seanergy successfully completed a €100 million unsecured bond offering to investors in Greece (ATHEX: SHIPB1). The bonds were admitted to trading on the Fixed Income Securities Segment of Euronext Athens Holding S.A. on July 13, 2026.
The bonds were issued at par, mature in July 2031 and carry a coupon of 4.90% per annum, payable semi-annually. The five-year bullet structure involves no scheduled principal amortization before maturity, preserving liquidity during the construction phase of the Company’s newbuilding program.
Newbuilding Capesize vessel – Sale and Leaseback agreement
The Company has agreed to enter into a $60.0 million sale and leaseback agreement to partially finance the acquisition of the Capesize vessel scheduled for delivery in the fourth quarter of 2027. The agreement also provides pre-delivery financing for certain instalments under the shipbuilding contract. Upon delivery, the vessel will be sold and chartered back for a period of 84 months. The Company will have continuous purchase options at predetermined prices as set forth in the agreement, commencing two years after the charter commencement date. The charterhire principal will amortize in 28 quarterly instalments of $0.7 million along with a purchase option of $40.0 million at the expiry of the bareboat charter. The pre-delivery financing amounts will accrue interest, payable quarterly in arrears.
Conference Call:
The Company’s management will host a conference call to discuss financial results on July 30, 2026, at 10:00 a.m. Eastern Time.
Audio Webcast and Earnings Presentation:
There will be a live, and then archived, webcast of the conference call and accompanying presentation available through the Company’s website. To access the presentation and listen to the archived audio file, visit our website, following the Webcast & Presentations section under our Investor Relations page. Participants to the live webcast should register on Seanergy’s website approximately 10 minutes prior to the start of the webcast, following this link.
Conference Call Details:
Participants have the option to register for the call using the following link. You can use any number from the list or add your phone number and let the system call you right away.
About Seanergy Maritime Holdings Corp.
Seanergy Maritime Holdings Corp. is a prominent pure-play Capesize shipping company publicly listed in the U.S. Seanergy provides marine dry bulk transportation services through a modern fleet of Capesize vessels. The Company owns or operates under finance leases 19 vessels (2 Newcastlemax and 17 Capesize) with an average age of approximately 15.1 years and an aggregate cargo carrying capacity of 3,463,843 dwt. Upon the sale of the M/V Dukeship and the delivery of the seven newbuilding vessels and one secondhand Capesize vessel, the Company will own or operates under finance lease 26 vessels (3 Newcastlemax and 23 Capesize), with an aggregate cargo carrying capacity of approximately 4,763,552 dwt.
The Company is incorporated in the Republic of the Marshall Islands and has executive offices in Glyfada, Greece. The Company’s common shares trade on the Nasdaq Capital Market under the symbol “SHIP”.
This press release contains forward-looking statements (as defined in Section 27A of the Securities Act of 1933, as amended, and Section 21E of the Securities Exchange Act of 1934, as amended) concerning future events, including with respect to declaration of dividends, market trends and shareholder returns. Words such as “may”, “should”, “expects”, “intends”, “plans”, “believes”, “anticipates”, “hopes”, “estimates” and variations of such words and similar expressions are intended to identify forward-looking statements. These statements involve known and unknown risks and are based upon a number of assumptions and estimates, which are inherently subject to significant uncertainties and contingencies, many of which are beyond the control of the Company. Actual results differ materially from those expressed or implied by such forward-looking statements. Factors that could cause actual results to differ materially include, but are not limited to, the Company’s operating or financial results; the Company’s liquidity, including its ability to service its indebtedness; competitive factors in the market in which the Company operates; shipping industry trends, including charter rates, vessel values and factors affecting vessel supply and demand; future, pending or recent acquisitions and dispositions, business strategy, impacts of litigation, areas of possible expansion or contraction, and expected capital spending or operating expenses; risks associated with operations outside the United States; risks arising from trade disputes between the U.S. and China, including the re-imposition of reciprocal port fees; broader market impacts arising from trade disputes or war (or threatened war) or international hostilities, such as between the U.S. and Israel and Iran, the U.S. and Venezuela, China and Taiwan and Russia and Ukraine; risks associated with the length and severity of pandemics; and other factors listed from time to time in the Company’s filings with the SEC, including its most recent annual report on Form 20-F. The Company’s filings can be obtained free of charge on the SEC’s website at www.sec.gov. Except to the extent required by law, the Company expressly disclaims any obligations or undertaking to release publicly any updates or revisions to any forward-looking statements contained herein to reflect any change in the Company’s expectations with respect thereto or any change in events, conditions or circumstances on which any statement is based.





 View original content to download multimedia: