Joe Gomes, CFA, Managing Director, Equity Research Analyst, Generalist , Noble Capital Markets, Inc.
Refer to the full report for the price target, fundamental analysis, and rating.
Upsized. Sky Harbour executed a third stock purchase agreement under its Registered Direct common stock placement. An additional one million shares were sold to M-Cor Capital at $10 per share, raising an additional $10 million on top of the original $40 million raised. We anticipate the additional capital to be used to support future hangar developments.
Portfolio I. Sky Harbour filed its monthly Construction Report for July 2026. The Company continued to make progress in June on its two remaining projects from the Obligated Group (PABs 2021 Series bond issue) – Opa Locka Phase 2 (OPF2) in Opa Locka, FL and Addison Phase 2 (ADS2) in Addison, TX. At OPF2, Alston Construction is substantially complete with construction. Temporary Certificates of Occupancy (TCO) have been issued for all hangars and the GSE. Tenants have started moving into the hangars, and the campus is in full operation. At ADS2 (Addison Airport), Ascend Aviation continues to work towards completion of the Earthwork and Utility scopes of work, with all site sanitary and water completed. The airside apron stabilization is completed, with 8 of 12 pours complete. All foundation piers have been completed on all hangars.
Equity Research is available at no cost to Registered users of Channelchek. Not a Member? Click ‘Join’ to join the Channelchek Community. There is no cost to register, and we never collect credit card information.
This Company Sponsored Research is provided by Noble Capital Markets, Inc., a FINRA and S.E.C. registered broker-dealer (B/D).
*Analyst certification and important disclosures included in the full report. NOTE: investment decisions should not be based upon the content of this research summary. Proper due diligence is required before making any investment decision.
Michael Kupinski, Director of Research, Equity Research Analyst, Digital, Media & Technology , Noble Capital Markets, Inc.
George Proost, Research Associate, Noble Capital Markets, Inc.
Refer to the full report for the price target, fundamental analysis, and rating.
Record-Breaking Q2. The company reported its highest quarterly revenue of $54.1 million, up a solid 16.5% YoY, and adj. EBTDA of $5.7 million, both of which beat our estimates of $52.5 million and a loss of $0.675 million, respectively. Notably, the company generated its first profitable quarter as a public company, driven primarily by higher affiliate fees and licensing revenue.
Higher-margin revenue streams gaining momentum. Affiliate fee revenue increased 81.9% to $13.4 million, while licensing revenue increased 563.5% to $4.6 million. In our view, continued affiliate repricing and licensing growth should improve the company’s revenue mix and provide an increasingly important driver of margin expansion.
Equity Research is available at no cost to Registered users of Channelchek. Not a Member? Click ‘Join’ to join the Channelchek Community. There is no cost to register, and we never collect credit card information.
This Company Sponsored Research is provided by Noble Capital Markets, Inc., a FINRA and S.E.C. registered broker-dealer (B/D).
*Analyst certification and important disclosures included in the full report. NOTE: investment decisions should not be based upon the content of this research summary. Proper due diligence is required before making any investment decision.
Oil prices were on track for a second consecutive weekly gain Friday, with Brent crude trading near $93.82 a barrel and US benchmark WTI near $86.78, after both benchmarks surged more than 7% and 8% respectively over the prior five sessions, reaching their highest levels since late July. The catalyst is a development that deserves far more attention than it has received: the ceasefire framework we detailed back in June has expired this week, with neither side making any apparent effort to restart formal talks.
President Trump escalated the rhetoric Wednesday evening, threatening what he described as economic warfare and isolation on an unprecedented scale against Tehran, along with consequences for any nation providing what he called a lifeline to Iran. The United Arab Emirates responded by suspending all financial and economic transactions with Iran until further notice, a significant move from a major Gulf oil producer that underscores just how fraught the regional picture has become.
The Physical Supply Picture Remains Severely Constrained
Markets are pricing in continued disruption to output from major regional producers including Saudi Arabia, Iraq, the UAE, and Kuwait, given the inconclusive state of the broader conflict. One analyst covering the region described both sides as dug in without the luxury of time to simply wait each other out, against a backdrop of crude prices grinding steadily higher. The physical reality in the Strait of Hormuz supports that read. Shipping traffic through the waterway registered just nine vessel transits this week, essentially unchanged from the prior day and still far below pre-war norms. Before the conflict began, roughly one-fifth of global oil consumption moved through that single passage.
The war itself, which began February 28 when the US and Israel launched strikes on Iran, has now killed thousands of people and disrupted global energy flows for nearly six months, with Tehran’s blockade of the strait and continued attacks on regional energy infrastructure both still very much active constraints on supply.
For investors tracking small and microcap companies, this is precisely the kind of reversal we flagged as a risk when covering the earlier gas price relief that followed the original ceasefire announcement. Consumer-facing companies in transportation, logistics, and retail that had begun benefiting from falling fuel costs are now facing renewed pressure as crude climbs back toward levels last seen a month ago. Domestic energy producers sit on the opposite side of that trade, with sustained prices above $85 continuing to support favorable economics for independent US operators. With no active diplomatic track currently underway and rhetoric escalating rather than cooling, this is a story worth watching closely rather than assuming will resolve quickly, since the pattern of ceasefire, relief, and renewed escalation has now repeated multiple times since February.
LIMASSOL, Cyprus, Aug. 21, 2026 (GLOBE NEWSWIRE) — GDEV Inc. (NASDAQ: GDEV), an international gaming and entertainment company (“GDEV” or the “Company”) released its unaudited financial and operational results for the second quarter and first half-year ended June 30, 2026.
Second quarter 2026 financial highlights:
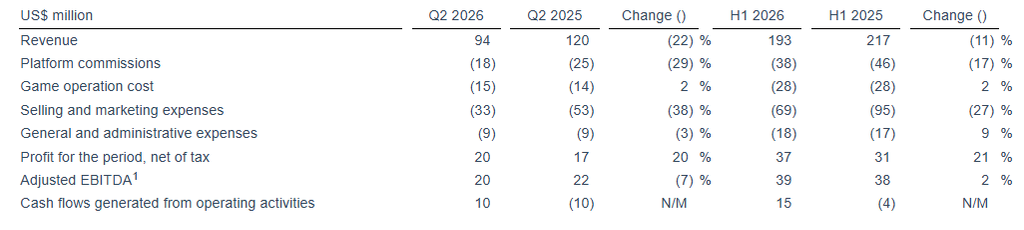
Revenue of $94 million decreased by 22% year-over-year.
Selling and marketing expenses of $33 million decreased by 38% year-over-year.
Profit for the period, net of tax, of $20 million in Q2 2026 increased vs. $17 million in Q2 2025.
Adjusted EBITDA amounted to $20 million in Q2 2026 decreased vs. $22 million in Q2 2025.
Second quarter and first half of 2026 financial performance in comparison
Second quarter 2026 financial performance
In the second quarter of 2026, our revenue decreased by $26 million (or 22%) year-over-year and amounted to $94 million. The decrease was primarily driven by a decrease in bookings.
Platform commissions decreased by $7 million (or 29%) in the second quarter of 2026 compared to the same period in 2025 in line with the decrease in revenue.
Game operation costs remained relatively stable at the level of $15 million in the second quarter of 2026 vs. $14 million in the second quarter of 2025.
Selling and marketing expenses in the second quarter of 2026 decreased by $20 million vs. the same period in 2025, amounting to $33 million. This decrease is driven by our continued focus on improving the efficiency of user acquisition activities. The decrease reflects a more selective approach to performance marketing, prioritizing channels that attract players with higher long-term value over broad-scale campaigns aimed at short-term growth.
General and administrative expenses remained stable at $9 million in the second quarters of both 2026 and 2025.
As a result of the factors above, together with (i) the effect of a net foreign exchange loss in the second quarter of 2026 in the amount of $1 million vs. a net foreign exchange gain in the amount of $1 million in the same period of the prior year and (ii) share of profits of equity accounted associates in the second quarter of 2026 in the amount of $2 million vs. the share of losses of equity accounted associates in the amount of $2 million in the same period of the prior year, we recorded a profit for the period, net of tax, of $20 million in the second quarter of 2026 compared with $17 million in the same period of 2025. Adjusted EBITDA in the second quarter of 2026 amounted to $20 million, a decrease of $2 million compared with the same period in 2025 driven primarily by the same factors as those affecting the profit, except for the share of profits or losses of equity accounted associates, which do not impact the Adjusted EBITDA.
Cash flows generated from operating activities were positive $10 million in the second quarter of 2026 compared with negative $10 million in the same period in 2025.
________________________ 1 For more information, see section titled “Presentation of Non-IFRS Financial Measures” on the last two pages of this report, including the reconciliation of the profit for the period, net of tax to the Adjusted EBITDA.
First half of 2026 financial performance
In the first half of 2026, our revenue decreased by $24 million (or 11%) year-over-year to $193 million. This decrease was primarily driven by a decrease in bookings.
Platform commissions decreased by $8 million (or 17%) in the first half of 2026 compared to the same period in 2025, driven by a decrease of revenues recognized from PC platforms.
Game operation cost remained stable at $28 million in the first halves of both 2026 and 2025.
Selling and marketing expenses in the first half of 2026 decreased by $25 million vs. the same period in 2025, amounting to $69 million. This decrease is driven by our continued focus on improving the efficiency of user acquisition activities. The decrease reflects a more selective approach to performance marketing, prioritizing channels that attract players with higher long-term value over broad-scale campaigns aimed at short-term growth.
General and administrative expenses remained relatively stable at $18 million in the first half of 2026 vs. $17 million in 2025.
As a result of the factors above, together with (i) the effect of a net foreign exchange loss in the first half of 2026 in the amount of $2 million vs. a net foreign exchange gain in the amount of $2 million in the same period of prior year and (ii) share of profits of equity accounted associates in the second quarter of 2026 in the amount of $2 million vs. the share of losses of equity accounted associates in the amount of $2 million in the same period of prior year, we recorded a profit for the period, net of tax, of $37 million compared with $31 million in the same period of 2025. Adjusted EBITDA in the first half of 2026 amounted to $39 million, an increase of $1 million compared with the same period in 2025 driven primarily by the same factors as those affecting the profit, except for the share of profits or losses of equity accounted associates, which do not impact the Adjusted EBITDA.
Cash flows generated from operating activities were positive $15 million in the first half of 2026 compared with negative $4 million in the same period in 2025.
Second quarter and first half 2026 operational performance comparison
Bookings declined in the second quarter and first half of 2026 to reach $73 million and $156 million, respectively, compared with $92 million and $173 million in the same periods in 2025. The decline was primarily due to a decline in monthly paying users of 23% and 15% in the second quarter and first half of 2026, respectively, vs. the same periods in 2025.
The share of advertisement sales as a percentage of total bookings decreased in the second quarter and first half of 2026 by 0.9 p.p. and 0.5 p.p. vs. the same period in 2025.
In the second quarter of 2026, the share of mobile and PC versions of our games remained relatively stable while in the first half of 2026 we recorded an increase in share of mobile to reach 64% vs. 61% in the same period in 2025 and a decrease in share of PC to reach 36% vs. 39% in the same period in 2025.
Our split of bookings by geography in the second quarter and first half of 2026 vs. the same periods in 2025 saw a decrease in the share of bookings derived from the US and Asia and an increase in bookings derived from other countries.
Note:
Due to rounding, the numbers presented throughout this release may not precisely add up to the totals. The period-over-period percentage changes are based on the actual numbers and may therefore differ from the percentage changes if those were to be calculated based on the rounded numbers.
Recent developments
On August 13, 2026, the Group entered into a game asset purchase agreement with an unrelated party for the sale of the mobile game “Island Hoppers”, together with all related intellectual property and game assets, for a total consideration of $5.0 million, of which $4.5 million was received upon execution and $0.5 million represents a deferred payment contingent on the satisfaction of a gross revenue condition and completion of the agreed migration obligations.
Island Hoppers contributed approximately 1% to the Group’s bookings in the first half of 2026 and approximately 3% in the year ended December 31, 2025.
As a result of the transaction, deferred revenue related to Island Hoppers’ bookings, totaling $2.1 million as of June 30, 2026, will be recognized on an accelerated basis, providing a one-time uplift to reported revenue in the period of closing.
About GDEV
GDEV is a gaming and entertainment holding company, focused on development and growth of its franchise portfolio across various genres and platforms. With a diverse range of subsidiaries including Nexters and Cubic Games, among others, GDEV strives to create games that will inspire and engage millions of players for years to come. Its franchises, such as Hero Wars, Island Hoppers, Pixel Gun 3D and others have accumulated over 550 million installs and $2.5 billion of bookings worldwide. For more information, please visit www.gdev.inc
Contacts:
Investor Relations Roman Safiyulin | Chief Corporate Development Officer [email protected]
Certain statements in this press release may constitute “forward-looking statements” for purposes of the federal securities laws. Such statements are based on current expectations that are subject to risks and uncertainties. In addition, any statements that refer to projections, forecasts or other characterizations of future events or circumstances, including any underlying assumptions, are forward-looking statements.
The forward-looking statements contained in this press release are based on the Company’s current expectations and beliefs concerning future developments and their potential effects on the Company. There can be no assurance that future developments affecting the Company will be those that the Company has anticipated. Forward-looking statements involve a number of risks, uncertainties (some of which are beyond the Company’s control) or other assumptions. You should carefully consider the risks and uncertainties described in the “Risk Factors” section of the Company’s 2025 Annual Report on Form 20-F, filed by the Company on March 31, 2026, and other documents filed by the Company from time to time with the Securities and Exchange Commission. Should one or more of these risks or uncertainties materialize, or should any of the Company’s assumptions prove incorrect, actual results may vary in material respects from those projected in these forward-looking statements. Forward-looking statements speak only as of the date they are made. Readers are cautioned not to put undue reliance on forward-looking statements, and the Company undertakes no obligation to update or revise any forward-looking statements, whether as a result of new information, future events or otherwise, except as may be required under applicable securities laws.
Presentation of Non-IFRS Financial Measures
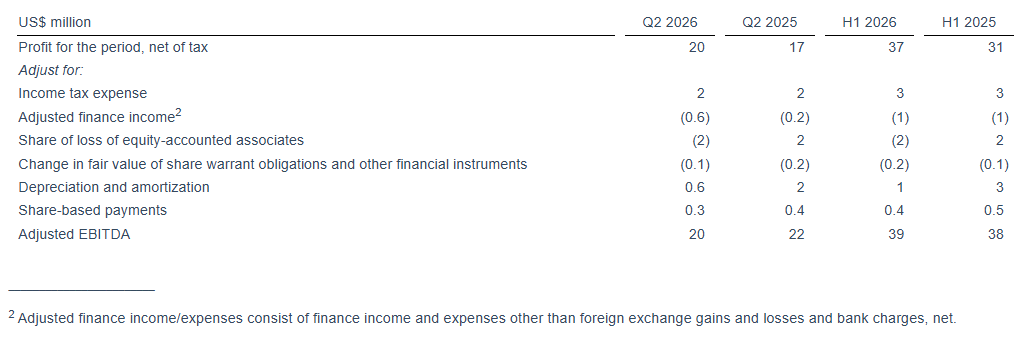
In addition to the results provided in accordance with IFRS throughout this press release, the Company has provided the non-IFRS financial measure “Adjusted EBITDA” (the “Non-IFRS Financial Measure”). The Company defines Adjusted EBITDA as the profit/loss for the period, net of tax as presented in the Company’s financial statements in accordance with IFRS, adjusted to exclude (i) goodwill and investments in equity-accounted associates’ impairment, (ii) loss on disposal of subsidiaries, (iii) income tax expense, (iv) other financial income, finance income and expenses other than foreign exchange gains and losses and bank charges, (v) change in fair value of share warrant obligations and other financial instruments, (vi) share of loss of equity-accounted associates, (vii) depreciation and amortization, (viii) share-based payments expense and (ix) certain non-cash or other special items that we do not consider indicative of our ongoing operating performance. The Company uses this Non-IFRS Financial Measure for business planning purposes and in measuring its performance relative to that of its competitors. The Company believes that this Non-IFRS Financial Measure is a useful financial metric to assess its operating performance from period-to-period by excluding certain items that the Company believes are not representative of its core business. This Non-IFRS Financial Measure is not intended to replace, and should not be considered superior to, the presentation of the Company’s financial results in accordance with IFRS. The use of the Non-IFRS Financial Measure terms may differ from similar measures reported by other companies and may not be comparable to other similarly titled measures.
Reconciliation of the profit for the period, net of tax to the Adjusted EBITDA
Markets are ending a genuinely turbulent week on a stronger note. US stock futures rose Friday morning, putting the Nasdaq 100 on track to snap a five-day losing streak, as Treasury yields stabilized and Bitcoin staged one of its sharpest rallies in years. The move offered real relief after a week that saw the 30-year Treasury yield spike to its highest level since 2007, a story we tracked closely as it unfolded, and dragged technology stocks lower in the process.
The catalyst behind the calm is the same one behind this week’s earlier stabilization attempt. Treasury Secretary Scott Bessent’s move to at least double the size of the government’s long-term debt buyback operations, aimed squarely at bringing borrowing costs back down after a sharp bond selloff, has now had a few days to work through markets, and the 10-year yield has settled meaningfully from its earlier peak. Treasuries themselves barely budged Friday following the burst of volatility earlier in the week, a sign the intervention is holding, at least for now.
Bitcoin’s Breakout Is the Story Beneath the Story
The more striking move by far is in crypto. Bitcoin surged as much as 8.9% Friday, briefly touching an intraday high above $79,600, breaking decisively out of the roughly $60,000 to $70,000 range that had held for most of 2026 and putting the token on pace for its best weekly gain in more than three years. The rally has been building since Wednesday’s Treasury buyback announcement, since falling yields and looser financial conditions have historically supported crypto and other risk assets. A separate catalyst added fuel this week as well, with renewed momentum behind the Clarity Act, the crypto regulatory framework moving through Congress that we covered closely back in June when its prospects were fading. That renewed momentum is a meaningful reversal from where things stood just two months ago.
The crypto-adjacent equity trade moved right alongside it. Strategy, the largest corporate holder of Bitcoin on its balance sheet, rose more than 7%, while Robinhood and Coinbase both jumped roughly 8%.
For investors tracking the broader market, this week is a useful reminder of just how tightly interconnected bond markets, equities, and crypto have become. A single Treasury Department decision aimed at containing long-term borrowing costs rippled through nearly every corner of risk assets within days, lifting everything from mega cap technology stocks to Bitcoin to the small cap names most sensitive to the direction of interest rates. Whether this stabilization holds into next week, particularly with the Federal Reserve’s Jackson Hole gathering still ahead, remains the open question that will determine if this is genuine relief or simply a pause before the next round of volatility.
CALGARY, AB, Aug. 21, 2026 /CNW/ — InPlay Oil Corp. (TSX: IPO) (TASE: IPO) (OTCQX: IPOOF) (“InPlay” or the “Company“) is pleased to announce the closing of its previously announced acquisition of a private oil and gas producer for cash consideration of $54.25 million, prior to closing adjustments (the “Acquisition“). Further details regarding the Acquisition can be found in InPlay’s press release dated August 5, 2026.
The Acquisition adds approximately 1,400 boe/d(1) (85% light oil and NGLs), bringing InPlay’s total Belly River production to approximately 2,000 boe/d and total corporate production to approximately 20,100 boe/d(1) (63% light oil and NGLs). InPlay has identified 50 drilling locations on the acquired assets including over 10 years of Tier 1 drilling inventory(2). The Acquisition was completed at 2.0x net operating income(3)(4) and delivered annualized per-share accretion of 18% to both Adjusted Funds Flow(5) and Free Adjusted Funds Flow (“FAFF”)(3), 12% to oil production per share, and 9% to funds flow per barrel netback.
ADVISORS
ATB Capital Markets acted as financial advisors to InPlay with respect to the Acquisition. Burnet, Duckworth & Palmer LLP acted as legal counsel to InPlay with respect to the Acquisition.
About InPlay Oil Corp.
InPlay Oil Corp. is a growth-oriented, sustainable oil and gas producer focused on long-term value creation for its shareholders. The Company’s operations are centered in the Western Canadian Sedimentary Basin, where InPlay holds a diverse portfolio of oil and natural gas assets. InPlay is committed to delivering strong per-share growth, maintaining a disciplined approach to capital investment, and providing consistent returns to shareholders.
For further information please contact:
Doug Bartole President and Chief Executive Officer InPlay Oil Corp. Telephone: (587) 955-0632
Kevin Leonard Vice President, Business & Corporate Development InPlay Oil Corp. Telephone: (587) 955-0635
Notes:
1.
See “Reader Advisories – Production Breakdown by Product Type” contained within this press release.
2.
See “Reader Advisories – Drilling Locations” for additional details.
3.
Non-GAAP financial measure or ratio. See “Reader Advisories – Non-GAAP and Other Financial Measures” for additional details.
4.
The acquired assets’ sustaining net operating income of $28 million multiplies 1,500 boe/d of sustaining production by the operating netback of $51.75/boe. Operating Netback estimate of $51.75/boe assumes current guidance commodity price assumptions of US$80.50 WTI, US$1.15 MSW differential, $1.75 AECO, 0.73 FX, in addition to $18.50/boe operating and transportation costs, and $16.90/boe royalties.
5.
Capital management measure. See “Non-GAAP and Other Financial Measures” for additional details.
Reader Advisories
Non-GAAP and Other Financial Measures
Throughout this document and other materials disclosed by the Company, InPlay uses certain measures to analyze financial performance, financial position and cash flow. These non-GAAP and other financial measures do not have any standardized meaning prescribed under GAAP and therefore may not be comparable to similar measures presented by other entities. The non-GAAP and other financial measures should not be considered alternatives to, or more meaningful than, financial measures that are determined in accordance with GAAP as indicators of the Company’s performance. Management believes that the presentation of these non-GAAP and other financial measures provides useful information to shareholders and investors in understanding and evaluating the Company’s ongoing operating performance, and the measures provide increased transparency and the ability to better analyze InPlay’s business performance against prior periods on a comparable basis.
Non-GAAP Financial Measures and Ratios
Included in this document are references to the terms “free adjusted funds flow”, “operating income” and “operating netback per boe”. Management believes these measures and ratios are helpful supplementary measures of financial and operating performance and provide users with similar, but potentially not comparable, information that is commonly used by other oil and natural gas companies. These terms do not have any standardized meaning prescribed by GAAP and should not be considered an alternative to, or more meaningful than “profit before taxes”, “profit and comprehensive income”, “adjusted funds flow”, “capital expenditures”, “net debt” or assets and liabilities as determined in accordance with GAAP as a measure of the Company’s performance and financial position.
Free Adjusted Funds Flow
Management considers FAFF an important measure to identify the Company’s ability to improve its financial condition through debt repayment and its ability to provide returns to shareholders. FAFF should not be considered as an alternative to or more meaningful than AFF as determined in accordance with GAAP as an indicator of the Company’s performance. FAFF is calculated by the Company as AFF less exploration and development capital expenditures and property dispositions (acquisitions) and is a measure of the cashflow remaining after capital expenditures before corporate acquisitions that can be used for additional capital activity, corporate acquisitions, repayment of debt or decommissioning expenditures or potentially return of capital to shareholders.
Operating Income/Operating Netback per boe/Operating Income Multiple
InPlay uses “operating income”, “operating netback per boe” and “operating income profit margin” as key performance indicators. Operating income is calculated by the Company as oil and natural gas sales less royalties, operating expenses and transportation expenses and is a measure of the profitability of operations before administrative, share-based compensation, financing and other non-cash items. Management considers operating income an important measure to evaluate its operational performance as it demonstrates its field level profitability. Operating income should not be considered as an alternative to or more meaningful than net income as determined in accordance with GAAP as an indicator of the Company’s performance. Operating netback per boe is calculated by the Company as operating income divided by average production for the respective period. Management considers operating netback per boe an important measure to evaluate its operational performance as it demonstrates its field level profitability per unit of production. Operating income multiple is calculated by the Company as the Acquisition consideration divided by operating income for the acquired assets for the relevant period. Management considers operating income multiple a key performance indicator as it is a key metric used to evaluate the Acquisition in comparison to other transactions. Refer below for a calculation of the operating income multiple in relation to the Acquisition.
2026E
Net Consideration (before adjustments)
$ millions
$54.25
Operating Income
$ millions
$26.5
Operating Income Multiple
2.0x
Capital Management Measures
Adjusted Funds Flow
Management considers adjusted funds flow to be an important measure of InPlay’s ability to generate the funds necessary to finance capital expenditures. Adjusted funds flow is a GAAP measure and is disclosed in the notes to the Company’s financial statements for the three and six months ended June 30, 2026. All references to adjusted funds flow throughout this document are calculated as funds flow adjusting for foreign exchange loss, transaction and integration costs and decommissioning expenditures. Foreign exchange loss is primarily an unrealized movement on the Company’s NIS denominated Bonds due to movements in the CAD/NIS exchange rate. In addition, InPlay has effectively mitigated its exposure to fluctuations in the CAD to NIS exchange rate on the NIS denominated Bond by entering into NIS/CAD foreign exchange hedges with notional amounts and terms that align with the future cash outflow requirements of the Bonds. Therefore, at the end of the life of the Bonds, the FX impact on the Company will be insignificant. Transaction and integration costs are non-recurring costs for the purposes of an acquisition, making the exclusion of these items relevant in Management’s view to the reader in the evaluation of InPlay’s operating performance. Decommissioning expenditures are adjusted from funds flow as they are incurred on a discretionary and irregular basis and are primarily incurred on previous operating assets. The Company also presents adjusted funds flow per share whereby per share amounts are calculated using weighted average shares outstanding consistent with the calculation of profit per common share.
Production Breakdown by Product Type:
Disclosure of production on a per boe basis in this press release consists of the constituent product types as defined in National Instrument 51-101, Standards of Disclosure for Oil and Gas Activities (“NI 51-101“) and their respective quantities disclosed in the table below:
Light and Medium Crude oil(bbls/d)
NGLs(boe/d)
Conventional Natural gas(Mcf/d)
Total(boe/d)
2025 Average Production
8,143
2,180
40,323
17,043
2026 Annual Guidance
9,605
2,290
43,530
19,150(1)
Acquired Assets
1,125
92
1,100
1,400
Post-Acquisition
10,500
2,200
44,400
20,100
Notes:
1.
This reflects the mid-point of the Company’s 2026 production guidance range of 18,900 to 19,400 boe/d.
2.
With respect to forward‑looking production guidance, product type breakdown is based upon management’s expectations based on reasonable assumptions but are subject to variability based on actual well results.
BOE Equivalent
Barrel of oil equivalents or BOEs may be misleading, particularly if used in isolation. A BOE conversion ratio of 6 mcf: 1 bbl is based on an energy equivalency conversion method primarily applicable at the burner tip and does not represent a value equivalency at the wellhead. Given that the value ratio based on the current price of crude oil as compared to natural gas is significantly different than the energy equivalency of 6:1, utilizing a 6:1 conversion basis may be misleading as an indication of value.
Drilling Locations
This press release discloses drilling inventory in two categories: (a) proved locations; and (b) probable locations. Proved locations and probable locations are derived from the independent reserves evaluation effective December 31, 2025 for the acquired assets and account for drilling locations that have associated proved and/or probable reserves, as applicable. Of the 50 net drilling locations identified herein, 25.5 are proved locations and 1.8 are probable locations. The drilling locations considered for future development will ultimately depend upon the availability of capital, regulatory approvals, seasonal restrictions, oil and natural gas prices, costs, actual drilling results, additional reservoir information that is obtained and other factors.
Booked locations are proved locations and probable locations derived from the independent reserves evaluation effective December 31, 2025 for the acquired assets, respectively, and account for drilling locations that have associated proved and/or probable reserves, as applicable. We have not risked potential drilling locations, and actual locations drilled and quantities that may be ultimately recovered may differ substantially from estimates. We make no commitment to drill all of the drilling locations that have been identified. Factors affecting ultimate recovery include the scope of our on‐going drilling program, which will be directly affected by the availability of capital, drilling, and production costs, availability of drilling and completion services and equipment, drilling results, lease expirations, regulatory approvals, and geological and mechanical factors. Estimates of reserves, type/decline curves, EURs, per‐well economics, and resource potential may change significantly as development of our oil and gas assets provides additional data. Additionally, initial production rates are subject to decline over time and should not be reflective of sustained production levels.
Abbreviations
2026E
Estimate for the year ending December 31, 2026
AECO
Alberta Energy Company “C” Meter Station of the NOVA Pipeline System
OLD GREENWICH, Conn., Aug. 21, 2026 (GLOBE NEWSWIRE) — Star Equity Holdings, Inc. (Nasdaq: STRR and STRRP) (“Star” or the “Company”), a diversified holding company, announced today announced today that its Board of Directors (the “Board”) declared a cash dividend to holders of the Company’s 10% Series A Cumulative Perpetual Preferred Stock of $0.25 per share. The record date for this dividend is September 1, 2026, and the payment date is September 10, 2026.
About Star Equity Holdings, Inc. Star Equity Holdings, Inc. is a diversified holding company that seeks to build long-term shareholder value by acquiring, managing, and growing businesses with strong fundamentals and market opportunities. Its current structure comprises four divisions: Building Solutions, Business Services, Energy Services, and Investments. For more information visit www.starequity.com. On August 22, 2025, the Company completed its previously announced acquisition of Star Operating Companies, Inc. (“Star Operating”, formerly known as Star Equity Holdings, Inc.), pursuant to the Agreement and Plan of Merger, dated as of May 21, 2025 (the “Merger Agreement”), by and among the Company, Star Operating and HSON Merger Sub, Inc., a wholly owned subsidiary of the Company (“Merger Sub”). Upon the terms and subject to the conditions of the Merger Agreement, on August 22, 2025, at the effective time of the merger pursuant to the Merger Agreement (the “Merger”), Merger Sub merged with and into Star Operating, with Star Operating continuing as the surviving corporation of the Merger as a wholly owned subsidiary of the Company. Effective September 5, 2025, the Company changed (i) its name to Star Equity Holdings, Inc. and (ii) its trading symbol on Nasdaq to STRR and STRRP.
Building Solutions The Building Solutions division operates in three niches: (i) modular building manufacturing; (ii) structural wall panel and wood foundation manufacturing, including building supply distribution operations; and (iii) glue-laminated timber (glulam) column, beam, and truss manufacturing.
Business Services The Business Services division provides flexible and scalable recruitment solutions to a global clientele, servicing organizations at all levels, from entry-level positions to the C-suite. The division focuses on mid-market and enterprise organizations worldwide, partnering consultatively with talent acquisition, HR, and procurement leaders to build diverse, high-impact teams and drive business success.
Energy Services The Energy Services division engages in the rental, sale, and repair of downhole tools used in the oil and gas, geothermal, mining, and water-well industries.
Investments The Investments division manages and finances the Company’s real estate assets as well as its investment positions in private and public companies.
For more information contact: The Equity Group Lena Cati Senior Vice President 212-836-9611 [email protected]
Forward-Looking Statements
This press release contains statements that the Company believes to be “forward-looking statements” within the meaning of Section 27A of the Securities Act of 1933, as amended, Section 21E of the Securities Exchange Act of 1934, as amended, and the Private Securities Litigation Reform Act of 1995. All statements other than statements of historical fact included in this press release, including statements regarding the Company’s future financial condition, results of operations, business operations and business prospects, are forward-looking statements. Words such as “anticipate,” “estimate,” “expect,” “project,” “intend,” “plan,” “predict,” “believe,” and similar words, expressions, and variations of these words and expressions are intended to identify forward-looking statements. All forward-looking statements are subject to important factors, risks, uncertainties, and assumptions, including industry and economic conditions that could cause actual results to differ materially from those described in the forward-looking statements. Such factors, risks, uncertainties, and assumptions include, but are not limited to, (1) global economic fluctuations, (2) the Company’s ability to successfully achieve its strategic initiatives, (3) risks related to potential acquisitions or dispositions of businesses by the Company, (4) risks related to the market price of the Company’s common stock relative to the value paid pursuant to the Merger Agreement, (5) unexpected costs, charges or expenses resulting from the Merger, (6) potential adverse reactions or changes to business relationships resulting from the completion of the Merger, (7) risks related to the inability of the combined company to successfully operate as a combined business, (8) risks associated with the possible failure to realize certain anticipated benefits of the proposed Merger, including with respect to future financial and operating results, (9) risks related to fluctuations in the Company’s operating results from quarter to quarter due to various factors such as rising inflationary pressures and interest rates, (10) the loss of or material reduction in our business with any of the Company’s largest customers, (11) the ability of clients to terminate their relationship with the Company at any time, (12) competition in the Company’s markets, (13) the negative cash flows and operating losses that may recur in the future, (14) risks relating to how future credit facilities may affect or restrict our operating flexibility, (15) risks associated with the Company’s investment strategy, (16) risks related to international operations, including foreign currency fluctuations, political events, trade wars, natural disasters or health crises, including the Russia-Ukraine war, and potential conflict in the Middle East, (17) the Company’s dependence on key management personnel, (18) the Company’s ability to attract and retain highly skilled professionals, management, and advisors, (19) the Company’s ability to collect accounts receivable, (20) the Company’s ability to maintain costs at an acceptable level, (21) the Company’s heavy reliance on information systems and the impact of potentially losing or failing to develop technology, (22) risks related to providing uninterrupted service to clients, (23) the Company’s exposure to employment-related claims from clients, employers and regulatory authorities, current and former employees in connection with the Company’s business reorganization initiatives, and limits on related insurance coverage, (24) the Company’s ability to utilize net operating loss carryforwards, (25) volatility of the Company’s stock price, (26) the impact of government regulations and deregulation efforts, (27) restrictions imposed by blocking arrangements, (28) risks related to the use of new and evolving technologies, (29) the adverse impacts of cybersecurity threats and attacks, (30) risks associated with our real estate ownership, (31) risks associated with the costs and availability of supplies and materials due to trade tariffs or other factors affecting the commodities and materials we use in our business, (32) risks associated with liability claims and disputes, (33) risks associated with restrictions on our operations caused by our indebtedness, (34) risks associated with the shutdown of the U.S. federal government, (35) risks associated with changes in tax laws or relations, and (36) those risks set forth in “Risk Factors in the Company’s Annual Report on Form 10-K for the year ended December 31, 2024.” The foregoing list should not be construed to be exhaustive. Actual results could differ materially from the forward-looking statements contained in this press release. In view of these uncertainties, you should not place undue reliance on any forward-looking statements, which are based on our current expectations. These forward-looking statements speak only as of the date of this press release. The Company assumes no obligation, and expressly disclaims any obligation, to update any forward-looking statements, whether as a result of new information, future events or otherwise.
RICHMOND, Va.–(BUSINESS WIRE)– Lucky Strike Entertainment (NYSE: LUCK), one of the world’s premier operators of location-based entertainment, will report financial results for the fourth quarter and full year fiscal 2026 on Thursday, August 27, 2026, before the U.S. stock market opens. Management will discuss the results via webcast at 9:00 AM ET on the same day.
The live webcast, replay, and results presentation will be available in the Events & Presentations section of the Lucky Strike Entertainment Investor Relations website at IR.LuckyStrikeEnt.com.
About Lucky Strike Entertainment
Lucky Strike Entertainment is one of the world’s premier location-based entertainment platforms. With over 360 locations across North America, Lucky Strike Entertainment provides experiential offerings in bowling, amusements, water parks, and family entertainment centers. The company also owns the Professional Bowlers Association, the major league of bowling and a growing media property that boasts millions of fans around the globe. For more information on Lucky Strike Entertainment, please visit IR.LuckyStrikeEnt.com.
Michael Kupinski, Director of Research, Equity Research Analyst, Digital, Media & Technology , Noble Capital Markets, Inc.
George Proost, Research Associate, Noble Capital Markets, Inc.
Refer to the full report for the price target, fundamental analysis, and rating.
Gamescom 2026 AAA unveiling. Snail announced its Gamescom 2026 lineup, headlined by the unveiling of its second internally developed AAA title in the 9 Yin Sutra universe, set in a parallel timeline and alternate universe to 9Yin Sutra: Immortal, which debuted at ChinaJoy on July 30th. In our note on August 12th, we had identified an unannounced AAA reveal at Gamescom as a near-term event, and the release confirms it.
The franchise builds. Both 9 Yin Sutra titles draw on the established Age of Wushu IP, offering different treatments of the same martial arts setting. Along with these titles, Snail will also show For The Stars, its space-survival AAA project. In our view, concentrating two out of the three AAA projects within a single IP family should improve development and marketing efficiency, while also making outcomes across those titles more correlated.
Equity Research is available at no cost to Registered users of Channelchek. Not a Member? Click ‘Join’ to join the Channelchek Community. There is no cost to register, and we never collect credit card information.
This Company Sponsored Research is provided by Noble Capital Markets, Inc., a FINRA and S.E.C. registered broker-dealer (B/D).
*Analyst certification and important disclosures included in the full report. NOTE: investment decisions should not be based upon the content of this research summary. Proper due diligence is required before making any investment decision.
Mark Reichman, Managing Director, Equity Research Analyst, Natural Resources, Noble Capital Markets, Inc.
Refer to the full report for the price target, fundamental analysis, and rating.
Q2 and 1H FY 2026 Financial Performance. Kuya Silver generated Q2 FY 2026 revenue of $1,252,925, compared with $1,163,673 in the prior-year period. The company reported a net loss of $1,529,381, or $(0.01) per share, compared with a net loss of $282,559, or $(0.00) per share, in Q2 of FY 2025. During the 1H of FY 2026, revenue totaled $2,717,922, compared with $1,389,670 during the same period in FY 2025. The 1H net loss increased to $2,766,547, or $(0.01) per share, from $1,631,545, or $(0.01) per share, in the 1H of FY 2025. The greater loss reflected increased activity at the Bethania mine associated with the production ramp-up, as well as higher administrative expenses as Kuya expanded the organizational structure and capabilities required to support its growing operations. Increases in these line items were partially offset by higher revenue from Bethania and lower exploration and evaluation expenses.
Operational Momentum. Kuya continues to add contractors at the Bethania mine to augment its workforce, which is expected to accelerate mine development and underground drilling productivity during the remainder of the year. The mine team has initiated a focused development program and is allocating additional resources to unlock mineralized material for mining later in 2026 and into 2027. Key underground development initiatives, including construction of a new ramp and ore-handling systems to support the Phase 1 expansion to 350 tonnes per day, are progressing and are expected to improve operational stability and long-term production capacity.
Equity Research is available at no cost to Registered users of Channelchek. Not a Member? Click ‘Join’ to join the Channelchek Community. There is no cost to register, and we never collect credit card information.
This Company Sponsored Research is provided by Noble Capital Markets, Inc., a FINRA and S.E.C. registered broker-dealer (B/D).
*Analyst certification and important disclosures included in the full report. NOTE: investment decisions should not be based upon the content of this research summary. Proper due diligence is required before making any investment decision.
Mortgage rates edged only slightly lower this week despite a genuinely dramatic stretch in the bond market that saw the 30-year Treasury yield hit its highest level since 2007. The average 30-year fixed-rate mortgage came in at 6.65% through Wednesday, according to Freddie Mac data, down marginally from 6.67% a week earlier. As of Thursday, Zillow data put the 30-year fixed rate at 6.52%.
The relative calm in mortgage rates masks real volatility underneath. Long-term government bond yields briefly topped 5.3% on Tuesday, the highest level in 19 years, as markets grew increasingly anxious about inflation and the country’s expanding fiscal deficit, a move we detailed as it happened earlier this week. The following day, the Treasury announced it was doubling the size of its long-term bond buying program specifically to support prices and bring yields back down. That intervention worked in the immediate term, yields fell sharply Wednesday, before climbing again Thursday, underscoring just how unsettled this corner of the market remains.
Because most homeowners refinance or sell well before their 30-year term is actually up, mortgage rates track the 10-year Treasury yield far more closely than the 30-year. The 10-year saw comparatively smaller swings than its longer-dated counterpart this week, which is largely why mortgage rates held relatively steady even as headlines focused on the 30-year hitting a 19-year high.
That stability may prove temporary. Economists covering the housing market have cautioned that the forces driving this week’s bond market shock, elevated concern over the fiscal deficit, oil price volatility, and rising debt tied to AI infrastructure spending, have not actually gone away, they were simply papered over mechanically by the Treasury’s buyback intervention. Several housing economists have specifically warned that mortgage rates are unlikely to fall meaningfully in the weeks ahead and could even drift higher, a genuinely difficult setup heading into a stretch of the year that has traditionally favored buyers.
For investors tracking the small cap space, this dynamic extends well beyond individual homebuyers. The same structural forces keeping a floor under mortgage rates, deficit concerns, energy price volatility, and the sheer scale of debt now being issued to fund AI infrastructure buildouts, are the identical pressures keeping borrowing costs elevated for smaller, more leveraged companies. Small and microcap businesses carry disproportionately more variable-rate debt than large cap peers, and a bond market that requires direct Treasury intervention just to stabilize, rather than genuinely ease, is not the kind of environment that delivers meaningful relief to smaller companies’ cost of capital anytime soon. Investors should treat this week’s mortgage rate stability as a temporary, mechanically induced calm rather than evidence that the broader rate pressure weighing on small caps has actually resolved.
Former Georgia Life Sciences Chair Selected for CEO Spotlight and Private Global Health Policy Roundtable With U.S. Rep. Rich McCormick
ATLANTA, Ga., August 20, 2026 — GeoVax Labs, Inc. (Nasdaq: GOVX), a clinical-stage biotechnology company developing vaccines and immunotherapies for infectious diseases and cancer, today announced that Chairman, President and Chief Executive Officer David Dodd will participate in two leadership and policy events associated with the 2026 Georgia Life Sciences Summit, August 25–26, at the Performing Arts Center in Sandy Springs, Georgia.
Dodd, a former Chair of Georgia Life Sciences, has been selected as one of four biotechnology CEOs participating in “CEO Spotlights: Decisions That Define a Company,” presented by BioSpark Labs, on August 26. The CEO Spotlights feature 10-minute, TED-style presentations focused on pivotal decisions, challenges and inflection points that have shaped the trajectory of each participating company.
Dodd will draw upon GeoVax’s evolution to discuss the leadership and strategic decisions involved in building and advancing a biotechnology company through changing scientific, financial, regulatory and public-health environments. The presentation will offer a candid perspective on navigating uncertainty, allocating resources, advancing innovative technologies and maintaining a long-term strategic vision while confronting the realities inherent in building a clinical-stage biotechnology company.
GeoVax today is advancing a diversified portfolio built around its Modified Vaccinia Ankara (MVA) vaccine platform and novel oncology technologies. Its programs include GEO-MVA, the Company’s vaccine candidate for mpox and smallpox; MVA-based vaccine candidates targeting Ebola, Sudan Ebola and Marburg viruses; and Gedeptin®, a novel gene-directed therapy for solid tumors.
“Building a biotechnology company is rarely a straight line,” said Dodd. “It requires making consequential decisions with incomplete information, adapting to changing circumstances and remaining focused on the scientific and strategic opportunities that can ultimately create meaningful value. I look forward to sharing some of the decisions and lessons that have shaped GeoVax’s journey with Georgia’s life sciences community.”
Dodd will be joined in the CEO Spotlight program by Samir Patel, President and CEO of Moonlight Therapeutics; Dr. Nikhil L. Shah, CEO and Co-Founder of Nephrodite; and Gareth Sheridan, Founder and CEO of Nutriband.
Private Roundtable with Congressman Rich McCormick
On August 25, Dodd will also participate in a private roundtable discussion with U.S. Representative Rich McCormick (GA-07), convened by Georgia Life Sciences, the Global Health Technologies Coalition and The Kyle House Group.
The roundtable will bring together leaders from Georgia’s global health, biotechnology, nonprofit and private sectors to discuss the state’s leadership in advancing global health and development through innovation, research and public-private partnerships. Participants will also have the opportunity to discuss key policy priorities and issues before Congress directly with Congressman McCormick.
For GeoVax, the discussion provides an opportunity to contribute perspectives informed by the Company’s work in infectious disease vaccines, medical countermeasures and global health preparedness, as well as the challenges faced by emerging biotechnology companies working to translate scientific innovation into products addressing significant public-health needs.
“Georgia has developed an increasingly important life sciences and global health ecosystem that brings together scientific innovation, entrepreneurship, academic expertise, public policy and investment,” Dodd said. “Having previously served as Chair of Georgia Life Sciences, I am especially pleased to participate in this year’s Summit and to engage with Congressman McCormick and other leaders on how we can further strengthen Georgia’s – and America’s – capacity for biotechnology innovation, health security and global health leadership.”
The Georgia Life Sciences Summit is the organization’s flagship annual gathering, bringing together leaders from industry, academia, government and the investment community to address major issues affecting scientific research, product development, financing, business development and public policy while showcasing innovation across Georgia’s life sciences sector.
About GeoVax
GeoVax Labs, Inc. is a clinical-stage biotechnology company focused on the development of vaccines and immunotherapies addressing high-consequence infectious diseases and solid tumor cancers. GeoVax’s priority program is GEO-MVA, a Modified Vaccinia Ankara (MVA)–based vaccine targeting mpox and smallpox. The program is advancing under an expedited regulatory pathway, with plans to initiate a pivotal Phase 3 clinical trial in the second half of 2026, to address critical global needs for expanded orthopoxvirus vaccine supply and biodefense preparedness. In oncology, GeoVax is developing Gedeptin®, a gene-directed enzyme prodrug therapy (GDEPT) designed to enhance immune checkpoint inhibitor activity. Gedeptin has completed a multicenter Phase 1/2 clinical trial in advanced head and neck cancer and is being advanced into combination strategies, including planned neoadjuvant and first-line settings. GeoVax maintains a global intellectual property portfolio supporting its infectious disease and oncology programs and continues to evaluate strategic partnerships and funding opportunities aligned with its development priorities. For more information, visit www.geovax.com.
Forward-Looking Statements
This release contains forward-looking statements regarding GeoVax’s business plans. The words “believe,” “look forward to,” “may,” “estimate,” “continue,” “anticipate,” “intend,” “should,” “plan,” “could,” “target,” “potential,” “is likely,” “will,” “expect” and similar expressions, as they relate to us, are intended to identify forward-looking statements. We have based these forward-looking statements largely on our current expectations and projections about future events and financial trends that we believe may affect our financial condition, results of operations, business strategy and financial needs. Actual results may differ materially from those included in these statements due to a variety of factors, including whether: GeoVax is able to obtain acceptable results from ongoing or future clinical trials of its investigational products, GeoVax’s immuno-oncology products and preventative vaccines can provoke the desired responses, and those products or vaccines can be used effectively, GeoVax’s viral vector technology adequately amplifies immune responses to cancer antigens, GeoVax can develop and manufacture its immuno-oncology products and preventative vaccines with the desired characteristics in a timely manner, GeoVax’s immuno-oncology products and preventative vaccines will be safe for human use, GeoVax’s vaccines will effectively prevent targeted infections in humans, GeoVax’s immuno-oncology products and preventative vaccines will receive regulatory approvals necessary to be licensed and marketed, GeoVax raises required capital to complete development, there is development of competitive products that may be more effective or easier to use than GeoVax’s products, GeoVax will be able to enter into favorable manufacturing and distribution agreements, and other factors, over which GeoVax has no control.
Further information on our risk factors is contained in our periodic reports on Form 10-Q and Form 10-K that we have filed and will file with the SEC. Any forward-looking statement made by us herein speaks only as of the date on which it is made. Factors or events that could cause our actual results to differ may emerge from time to time, and it is not possible for us to predict all of them. We undertake no obligation to publicly update any forward-looking statement, whether as a result of new information, future developments or otherwise, except as may be required by law.
CULVER CITY, Calif., Aug. 20, 2026 (GLOBE NEWSWIRE) — Snail, Inc. (Nasdaq: SNAL) (“Snail Games” or the “Company”), a leading independent global developer and publisher of interactive digital entertainment, unveils its Gamescom 2026 lineup that includes developing AAA titles, upcoming releases, and content updates across existing titles.
Taking the spotlight at Gamescom 2026 is the 9 Yin Sutra universe. Following the recent ChinaJoy announcement of9 Yin Sutra: Immortal, Snail Games CEO, Hai Shi, will officially unveil another internally developed AAA title, expanding the franchise into a parallel timeline and alternate universe. Both titles are rooted in the acclaimed Age of Wushu IP, offering distinct takes on the martial arts world while building on one of Snail Games’ most established franchises. Alongside the upcoming 9 Yin Sutra titles, Snail Games will also showcase For The Stars, the Company’s other developing AAA title and ambitious space survival experience.
Meanwhile, Honeycomb: The World Beyond is gearing up for its recently announced September 8, 2026 launch. The upcoming survival adventure will be featured at Gamescom, giving attendees an early look at the game ahead of release. Players can also get an early, hands-on experience through a PC-exclusive preview demo expected to launch on August 31, 2026.
Bellwright will celebrate its community of over 1 million players while teasing an upcoming update with one of its most anticipated developments. Consistently the #1 player-requested feature, Bellwright’s latest feature represents a major step in how players will experience and move through the world. The Gamescom showcase will offer an early look at what’s coming while celebrating the community that has helped shape Bellwright.
Leading into Gamescom, Echoes of Elysium has received a new weather-focused tempest that makes rain a more meaningful part of gameplay. Rain now directly affects ships and their contents, with wet components and stored items gaining weight and drag. Certain stations can become inoperable when soaked, while the updated weather system brings a darker, more atmospheric feel to the world.
Visit the Snail Games Booth at Gamescom Hall 8.1 A-041
For Media interested in interviews at Gamescom please reach out to [email protected]
For Creators interested in collaborations please reach out to [email protected]
About Snail, Inc. Snail, Inc. (Nasdaq: SNAL) is a leading global independent developer and publisher of interactive digital entertainment for consumers around the world, with a premier portfolio of premium games designed for use on a variety of platforms, including consoles, PCs, and mobile devices. For more information, please visit: https://snail.com/.
Forward-Looking Statements This press release contains statements that constitute forward-looking statements. Many of the forward-looking statements contained in this press release can be identified by the use of forward-looking words such as “anticipate,” “believe,” “could,” “expect,” “should,” “plan,” “intend,” “may,” “predict,” “continue,” “estimate” and “potential,” or the negative of these terms or other similar expressions. Forward-looking statements appear in a number of places in this press release and include, but are not limited to, statements regarding Honeycomb: The World Beyond gearing up for its recently announced September 8, 2026 launch; the survival adventure being featured at Gamescom, players getting an early hands-on experience through a PC-exclusive preview demo launching August 31; Bellwright teasing one of its most anticipated developments: traversal at Gamescom: Snail Games USA showcasing For The Stars and the 9 Yin Sutra universe; and Snail Games USA’s CEO officially unveiling another new 9 Yin Sutra title at Gamescom, 9 Yin Sutra, expanding the franchise into a parallel timeline and alternate universe. Any forward-looking statements included herein reflect our current views, and they involve certain risks and uncertainties, including, among others, the ability to launch The World Beyond on September 8, 2026 , the PC-exclusive demo and the other new games and titles when anticipated; acceptance of the Company’s titles in the marketplace and the successful development, marketing or sale of our titles and our ability to retain our key employees or maintain our Nasdaq listing. These risks should not be construed as exhaustive and should be read together with the other cautionary statement included in our Annual Report on Form 10-K for the year ended December 31, 2025, subsequent Quarterly Reports on Form 10-Q and current reports on Form 8-K filed with the Securities and Exchange Commission. Any forward-looking statement speaks only as of the date on which it was initially made. We undertake no obligation to publicly update or revise any forward-looking statement, whether as a result of new information, future events, changed circumstances or otherwise, unless required by law.
Investor Contact: John Yi and Steven Shinmachi Gateway Group, Inc. 949-574-3860 [email protected]