GDEV announces final results of previously announced self tender offer to purchase for cash up to $20,000,000 in value of its ordinary shares
(or up to 1,813,236 Ordinary Shares) at a purchase price of $11.03 per ordinary share
September 30, 2026 – Limassol, Cyprus – GDEV Inc. (NASDAQ: GDEV), an international gaming and entertainment company (“GDEV” or the “Company”), today announced the final results of the previously announced tender offer by the Company to purchase for cash up to $20,000,000 in value of its ordinary shares, no par value per ordinary share (each, a “share”), or up to 1,813,236 shares, at a purchase price of $11.03 per share, net to the seller in cash, without interest, less any applicable withholding taxes, which expired at 5:00 p.m., Eastern Time, on September 28, 2026.
Based on the final count by Continental Stock Transfer & Trust Company, the depositary for the tender offer (the “Depositary”), 57,110 shares were properly tendered and not properly withdrawn.
In accordance with the terms and conditions of the tender offer, and based on the final results reported by the Depositary, the Company has accepted for purchase 57,110 shares through the tender offer at a price of $11.03 per share, for an aggregate cost of approximately $629.9 thousand, excluding fees relating to the tender offer. The number of shares that the Company has accepted for purchase in the tender offer represents approximately 0.3% of the total number of issued ordinary shares of the Company outstanding as of the commencement of the tender offer on August 31, 2026.
The Company will have approximately 18.1 million shares outstanding immediately following payment for the shares purchased in the tender offer. The shares acquired pursuant to the tender offer will be held by the Company as treasury shares, and will remain available for the Company to issue in the future.
The Depositary will promptly pay for all of the shares accepted for purchase, and all shares not accepted for purchase will be returned to shareholders, in each case, in accordance with the terms and conditions of the tender offer.
D.F. King & Co., Inc. is serving as the information agent for the tender offer, and Continental Stock Transfer & Trust Company is serving as the Depositary. For all questions regarding the tender offer, please contact the information agent, D.F. King & Co., Inc., by calling +1 (800) 549-6864, or by emailing [email protected].
About GDEV
GDEV is a gaming and entertainment holding company, focused on development and growth of its franchise portfolio across various genres and platforms. With a diverse range of subsidiaries including Nexters and Cubic Games, among others, GDEV strives to create games that will inspire and engage millions of players for years to come. Its franchises, such as Hero Wars, Pixel Gun 3D and others have accumulated over 550 million installs and $2.5 billion of bookings worldwide. For more information, please visit www.gdev.inc.
Certain information regarding the tender offer
The information in this press release describing GDEV Inc.’s tender offer is for informational purposes only and does not constitute an offer to buy or the solicitation of an offer to sell shares of GDEV Inc. in the tender offer. The tender offer will only be made pursuant to the Offer to Purchase, the related Letter of Transmittal and other related materials filed as part of the Tender Offer Statement on Schedule TO, in each case as may be amended or supplemented from time to time. Shareholders should read such Offer to Purchase and related materials carefully and in their entirety because they contain important information, including the various terms and conditions of the tender offer.
Shareholders of GDEV Inc. may obtain a free copy of the Tender Offer Statement on Schedule TO, the Offer to Purchase and other documents that GDEV Inc. is filing with the Securities and Exchange Commission from the Securities and Exchange Commission’s website at www.sec.gov. Shareholders may also obtain a copy of these documents, without charge, from D.F. King & Co., Inc., the information agent for the tender offer, by calling (800) 549-6864 (U.S. toll‑free), or by emailing [email protected]. Shareholders are urged to carefully read all of these materials prior to making any decision with respect to the tender offer. Shareholders and investors who have questions or need assistance may call D.F. King & Co., Inc., the information agent for the tender offer, toll free at (800) 549-6864, or may email D.F. King & Co., Inc. at [email protected].
Certain statements in this press release may constitute “forward-looking statements” for purposes of the federal securities laws. Such statements are based on current expectations that are subject to risks and uncertainties. In addition, any statements that refer to projections, forecasts or other characterizations of future events or circumstances, including any underlying assumptions, are forward-looking statements.
The forward-looking statements contained in this press release are based on the Company’s current expectations and beliefs concerning future developments and their potential effects on the Company. There can be no assurance that future developments affecting the Company will be those that the Company has anticipated. Forward-looking statements involve a number of risks, uncertainties (some of which are beyond the Company’s control) or other assumptions. You should carefully consider the risks and uncertainties described in the “Risk Factors” section of the Company’s 2025 Annual Report on Form 20-F, filed by the Company on March 31, 2026, and other documents filed by the Company from time to time with the Securities and Exchange Commission. Should one or more of these risks or uncertainties materialize, or should any of the Company’s assumptions prove incorrect, actual results may vary in material respects from those projected in these forward-looking statements. Forward-looking statements speak only as of the date they are made. Readers are cautioned not to put undue reliance on forward-looking statements, and the Company undertakes no obligation to update or revise any forward-looking statements, whether as a result of new information, future events or otherwise, except as may be required under applicable securities laws.
Michael Kupinski, Director of Research, Equity Research Analyst, Digital, Media & Technology , Noble Capital Markets, Inc.
Jacob Mutchler, Research Analyst, Noble Capital Markets, Inc.
Refer to the full report for the price target, fundamental analysis, and rating.
Q2 Results. GDEV reported Q2 revenue of $93.6 million, down 22%, and adj. EBITDA of $20.1 million, only down 7% year over year. Notably, the year-over-year revenue decrease was primarily driven by a decline in bookings. As illustrated in Figure #1 Q2 Results, both revenue and adj. EBITDA missed our estimates of $115 million and $26 million, respectively, though adj. EBITDA proved far more resilient than revenue.
Marketing discipline held margins. That resilience was largely due to lower selling and marketing expenses, which fell 38% to $32.7 million from $52.5 million, lifting the adj. EBITDA margin to roughly 21% from 18% even as revenue declined. The reduction stems from the company’s more disciplined strategy for user acquisition, which focuses on higher-value cohorts rather than volume.
Equity Research is available at no cost to Registered users of Channelchek. Not a Member? Click ‘Join’ to join the Channelchek Community. There is no cost to register, and we never collect credit card information.
This Company Sponsored Research is provided by Noble Capital Markets, Inc., a FINRA and S.E.C. registered broker-dealer (B/D).
*Analyst certification and important disclosures included in the full report. NOTE: investment decisions should not be based upon the content of this research summary. Proper due diligence is required before making any investment decision.
LIMASSOL, Cyprus, Aug. 21, 2026 (GLOBE NEWSWIRE) — GDEV Inc. (NASDAQ: GDEV), an international gaming and entertainment company (“GDEV” or the “Company”) released its unaudited financial and operational results for the second quarter and first half-year ended June 30, 2026.
Second quarter 2026 financial highlights:
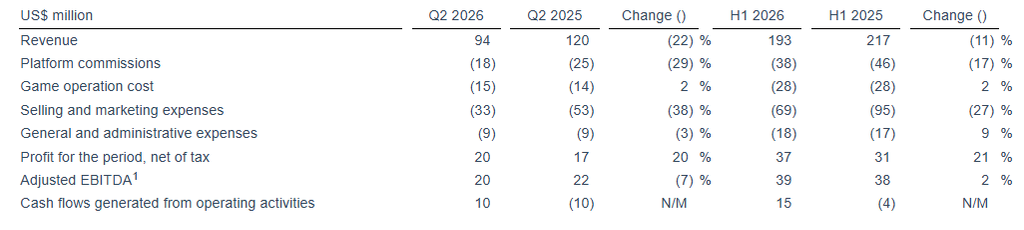
Revenue of $94 million decreased by 22% year-over-year.
Selling and marketing expenses of $33 million decreased by 38% year-over-year.
Profit for the period, net of tax, of $20 million in Q2 2026 increased vs. $17 million in Q2 2025.
Adjusted EBITDA amounted to $20 million in Q2 2026 decreased vs. $22 million in Q2 2025.
Second quarter and first half of 2026 financial performance in comparison
Second quarter 2026 financial performance
In the second quarter of 2026, our revenue decreased by $26 million (or 22%) year-over-year and amounted to $94 million. The decrease was primarily driven by a decrease in bookings.
Platform commissions decreased by $7 million (or 29%) in the second quarter of 2026 compared to the same period in 2025 in line with the decrease in revenue.
Game operation costs remained relatively stable at the level of $15 million in the second quarter of 2026 vs. $14 million in the second quarter of 2025.
Selling and marketing expenses in the second quarter of 2026 decreased by $20 million vs. the same period in 2025, amounting to $33 million. This decrease is driven by our continued focus on improving the efficiency of user acquisition activities. The decrease reflects a more selective approach to performance marketing, prioritizing channels that attract players with higher long-term value over broad-scale campaigns aimed at short-term growth.
General and administrative expenses remained stable at $9 million in the second quarters of both 2026 and 2025.
As a result of the factors above, together with (i) the effect of a net foreign exchange loss in the second quarter of 2026 in the amount of $1 million vs. a net foreign exchange gain in the amount of $1 million in the same period of the prior year and (ii) share of profits of equity accounted associates in the second quarter of 2026 in the amount of $2 million vs. the share of losses of equity accounted associates in the amount of $2 million in the same period of the prior year, we recorded a profit for the period, net of tax, of $20 million in the second quarter of 2026 compared with $17 million in the same period of 2025. Adjusted EBITDA in the second quarter of 2026 amounted to $20 million, a decrease of $2 million compared with the same period in 2025 driven primarily by the same factors as those affecting the profit, except for the share of profits or losses of equity accounted associates, which do not impact the Adjusted EBITDA.
Cash flows generated from operating activities were positive $10 million in the second quarter of 2026 compared with negative $10 million in the same period in 2025.
________________________ 1 For more information, see section titled “Presentation of Non-IFRS Financial Measures” on the last two pages of this report, including the reconciliation of the profit for the period, net of tax to the Adjusted EBITDA.
First half of 2026 financial performance
In the first half of 2026, our revenue decreased by $24 million (or 11%) year-over-year to $193 million. This decrease was primarily driven by a decrease in bookings.
Platform commissions decreased by $8 million (or 17%) in the first half of 2026 compared to the same period in 2025, driven by a decrease of revenues recognized from PC platforms.
Game operation cost remained stable at $28 million in the first halves of both 2026 and 2025.
Selling and marketing expenses in the first half of 2026 decreased by $25 million vs. the same period in 2025, amounting to $69 million. This decrease is driven by our continued focus on improving the efficiency of user acquisition activities. The decrease reflects a more selective approach to performance marketing, prioritizing channels that attract players with higher long-term value over broad-scale campaigns aimed at short-term growth.
General and administrative expenses remained relatively stable at $18 million in the first half of 2026 vs. $17 million in 2025.
As a result of the factors above, together with (i) the effect of a net foreign exchange loss in the first half of 2026 in the amount of $2 million vs. a net foreign exchange gain in the amount of $2 million in the same period of prior year and (ii) share of profits of equity accounted associates in the second quarter of 2026 in the amount of $2 million vs. the share of losses of equity accounted associates in the amount of $2 million in the same period of prior year, we recorded a profit for the period, net of tax, of $37 million compared with $31 million in the same period of 2025. Adjusted EBITDA in the first half of 2026 amounted to $39 million, an increase of $1 million compared with the same period in 2025 driven primarily by the same factors as those affecting the profit, except for the share of profits or losses of equity accounted associates, which do not impact the Adjusted EBITDA.
Cash flows generated from operating activities were positive $15 million in the first half of 2026 compared with negative $4 million in the same period in 2025.
Second quarter and first half 2026 operational performance comparison
Bookings declined in the second quarter and first half of 2026 to reach $73 million and $156 million, respectively, compared with $92 million and $173 million in the same periods in 2025. The decline was primarily due to a decline in monthly paying users of 23% and 15% in the second quarter and first half of 2026, respectively, vs. the same periods in 2025.
The share of advertisement sales as a percentage of total bookings decreased in the second quarter and first half of 2026 by 0.9 p.p. and 0.5 p.p. vs. the same period in 2025.
In the second quarter of 2026, the share of mobile and PC versions of our games remained relatively stable while in the first half of 2026 we recorded an increase in share of mobile to reach 64% vs. 61% in the same period in 2025 and a decrease in share of PC to reach 36% vs. 39% in the same period in 2025.
Our split of bookings by geography in the second quarter and first half of 2026 vs. the same periods in 2025 saw a decrease in the share of bookings derived from the US and Asia and an increase in bookings derived from other countries.
Note:
Due to rounding, the numbers presented throughout this release may not precisely add up to the totals. The period-over-period percentage changes are based on the actual numbers and may therefore differ from the percentage changes if those were to be calculated based on the rounded numbers.
Recent developments
On August 13, 2026, the Group entered into a game asset purchase agreement with an unrelated party for the sale of the mobile game “Island Hoppers”, together with all related intellectual property and game assets, for a total consideration of $5.0 million, of which $4.5 million was received upon execution and $0.5 million represents a deferred payment contingent on the satisfaction of a gross revenue condition and completion of the agreed migration obligations.
Island Hoppers contributed approximately 1% to the Group’s bookings in the first half of 2026 and approximately 3% in the year ended December 31, 2025.
As a result of the transaction, deferred revenue related to Island Hoppers’ bookings, totaling $2.1 million as of June 30, 2026, will be recognized on an accelerated basis, providing a one-time uplift to reported revenue in the period of closing.
About GDEV
GDEV is a gaming and entertainment holding company, focused on development and growth of its franchise portfolio across various genres and platforms. With a diverse range of subsidiaries including Nexters and Cubic Games, among others, GDEV strives to create games that will inspire and engage millions of players for years to come. Its franchises, such as Hero Wars, Island Hoppers, Pixel Gun 3D and others have accumulated over 550 million installs and $2.5 billion of bookings worldwide. For more information, please visit www.gdev.inc
Contacts:
Investor Relations Roman Safiyulin | Chief Corporate Development Officer [email protected]
Certain statements in this press release may constitute “forward-looking statements” for purposes of the federal securities laws. Such statements are based on current expectations that are subject to risks and uncertainties. In addition, any statements that refer to projections, forecasts or other characterizations of future events or circumstances, including any underlying assumptions, are forward-looking statements.
The forward-looking statements contained in this press release are based on the Company’s current expectations and beliefs concerning future developments and their potential effects on the Company. There can be no assurance that future developments affecting the Company will be those that the Company has anticipated. Forward-looking statements involve a number of risks, uncertainties (some of which are beyond the Company’s control) or other assumptions. You should carefully consider the risks and uncertainties described in the “Risk Factors” section of the Company’s 2025 Annual Report on Form 20-F, filed by the Company on March 31, 2026, and other documents filed by the Company from time to time with the Securities and Exchange Commission. Should one or more of these risks or uncertainties materialize, or should any of the Company’s assumptions prove incorrect, actual results may vary in material respects from those projected in these forward-looking statements. Forward-looking statements speak only as of the date they are made. Readers are cautioned not to put undue reliance on forward-looking statements, and the Company undertakes no obligation to update or revise any forward-looking statements, whether as a result of new information, future events or otherwise, except as may be required under applicable securities laws.
Presentation of Non-IFRS Financial Measures
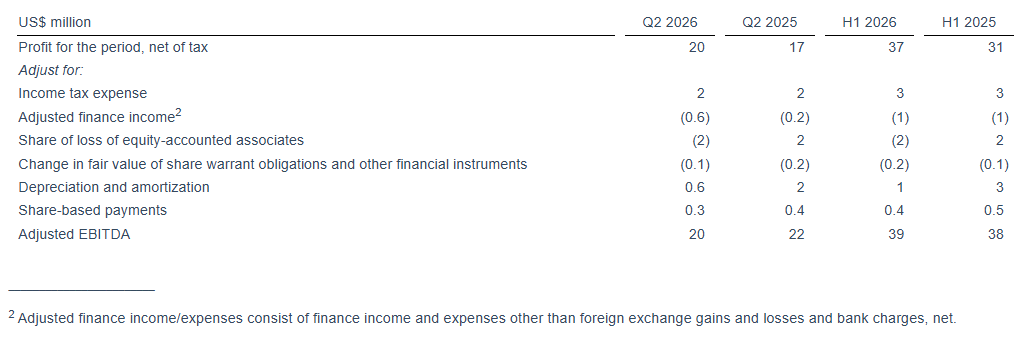
In addition to the results provided in accordance with IFRS throughout this press release, the Company has provided the non-IFRS financial measure “Adjusted EBITDA” (the “Non-IFRS Financial Measure”). The Company defines Adjusted EBITDA as the profit/loss for the period, net of tax as presented in the Company’s financial statements in accordance with IFRS, adjusted to exclude (i) goodwill and investments in equity-accounted associates’ impairment, (ii) loss on disposal of subsidiaries, (iii) income tax expense, (iv) other financial income, finance income and expenses other than foreign exchange gains and losses and bank charges, (v) change in fair value of share warrant obligations and other financial instruments, (vi) share of loss of equity-accounted associates, (vii) depreciation and amortization, (viii) share-based payments expense and (ix) certain non-cash or other special items that we do not consider indicative of our ongoing operating performance. The Company uses this Non-IFRS Financial Measure for business planning purposes and in measuring its performance relative to that of its competitors. The Company believes that this Non-IFRS Financial Measure is a useful financial metric to assess its operating performance from period-to-period by excluding certain items that the Company believes are not representative of its core business. This Non-IFRS Financial Measure is not intended to replace, and should not be considered superior to, the presentation of the Company’s financial results in accordance with IFRS. The use of the Non-IFRS Financial Measure terms may differ from similar measures reported by other companies and may not be comparable to other similarly titled measures.
Reconciliation of the profit for the period, net of tax to the Adjusted EBITDA
Michael Kupinski, Director of Research, Equity Research Analyst, Digital, Media & Technology , Noble Capital Markets, Inc.
Jacob Mutchler, Research Analyst, Noble Capital Markets, Inc.
Refer to the full report for the price target, fundamental analysis, and rating.
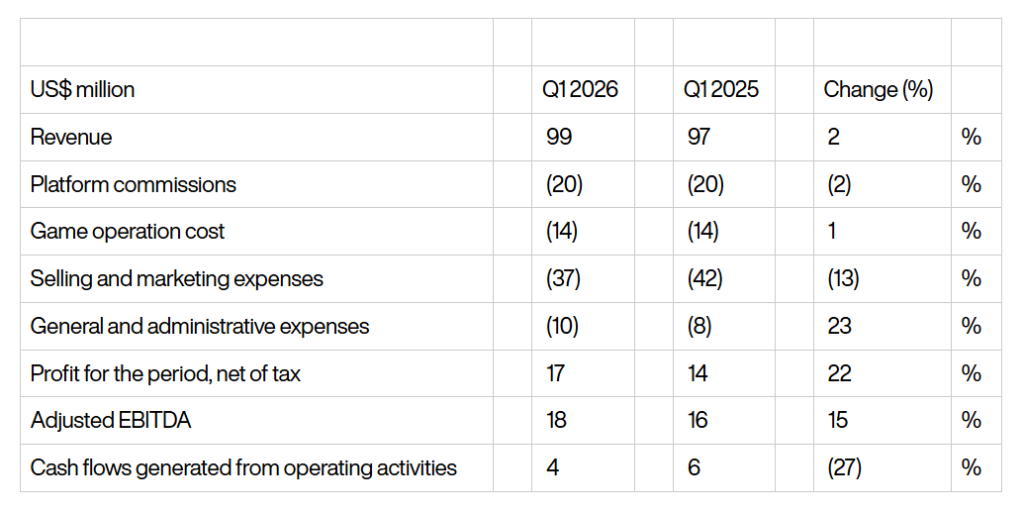
Q2 results preview. We expect GDEV’s second-quarter results to reflect continued disciplined user acquisition spending and a focus on profitable growth. For context, Q1 revenue increased 2% to $99 million, while adjusted EBITDA increased 15% to $18 million, benefiting from a 13% decline in selling and marketing expense, as illustrated in Figure #1 Q1 Results. The return to top-line growth, following a revenue decline in fiscal 2025, is encouraging.
Facing a difficult revenue comparison. Q2 will lap a relatively strong year-ago quarter, when revenue increased 13% to $120 million, driven in part by elevated performance marketing investment. As such, we believe the more important read-through will be the company’s ability to sustain engagement and monetization while maintaining its more disciplined approach to marketing expenditures.
Equity Research is available at no cost to Registered users of Channelchek. Not a Member? Click ‘Join’ to join the Channelchek Community. There is no cost to register, and we never collect credit card information.
This Company Sponsored Research is provided by Noble Capital Markets, Inc., a FINRA and S.E.C. registered broker-dealer (B/D).
*Analyst certification and important disclosures included in the full report. NOTE: investment decisions should not be based upon the content of this research summary. Proper due diligence is required before making any investment decision.
GDEV announces results for the first quarter of 2026
May 19, 2026 – Limassol, Cyprus – GDEV Inc. (NASDAQ: GDEV), an international gaming and entertainment company (“GDEV” or the “Company”) released its unaudited financial and operational results for the three-month period ended March 31, 2026.
First quarter 2026 financial highlights:
Revenue of $99 million increased by 2% year-over-year.
Selling and marketing expenses of $37 million decreased by 13% year-over-year.
Profit for the period, net of tax, of $17 million in Q1 2026 increased vs. $14 million in Q1 2025.
Adjusted EBITDA1 of $18 million in Q1 2026 increased vs. $16 million in Q1 2025.
First quarter of 2026 financial performance in comparison
First quarter 2026 financial performance
In the first quarter of 2026, our revenue increased by $2 million (or 2%) year-over-year and amounted to $99 million. The increase was primarily driven by an increase in in-app purchases made by players.
Platform commissions remained stable at $20 million in the first quarter of 2026 vs. 2025.
Game operation costs remained stable at $14 million in the first quarter of 2026 vs. 2025.
Selling and marketing expenses in the first quarter of 2026 decreased by $5 million vs. the same period in 2025, amounting to $37 million. This decrease is driven by our continued focus on improving the efficiency of user acquisition activities. The decrease reflects a more selective approach to performance marketing, prioritizing channels that attract players with higher long-term value over broad-scale campaigns aimed at short-term growth.
General and administrative expenses increased by $2 million in the first quarter of 2026 vs. the same period of prior year and amounted to $10 million primarily due to increase in legal expenses.
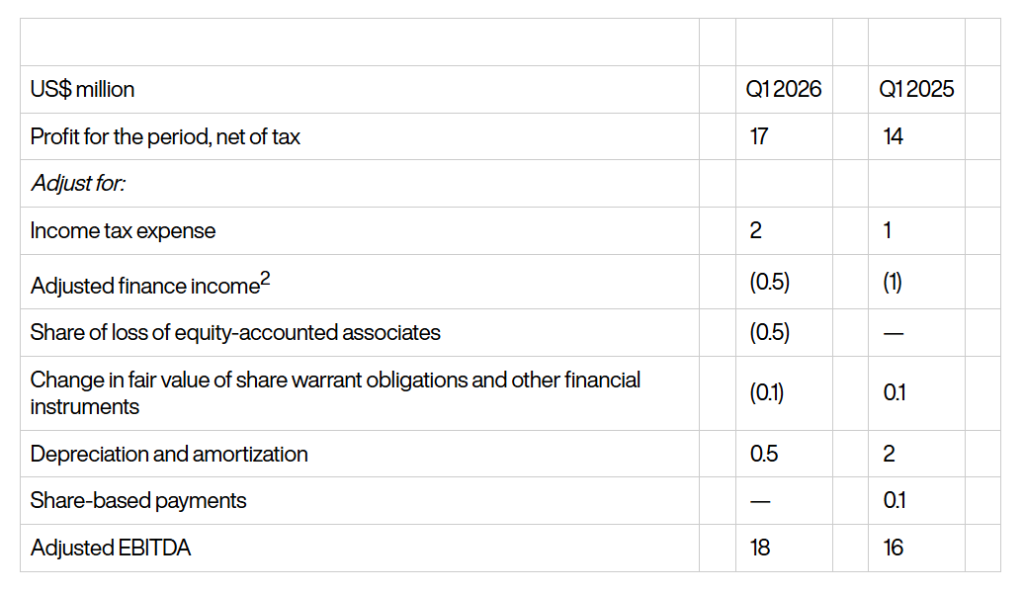
As a result of the factors above, together with the effect of the net foreign exchange loss in the first quarter of 2026 in the amount of $1 million vs. the net foreign exchange gain in the amount of $1 million in the same period of prior year, we recorded a profit for the period, net of tax, of $17 million in the first quarter of 2026 compared with $14 million in the same period of 2025. Adjusted EBITDA in the first quarter of 2026 amounted to $18 million, an increase of $2 million compared with the same period in 2025 driven primarily by the same factors as those affecting the profit.
Cash flows generated from operating activities were positive $4 million in the first quarter of 2026 compared with positive $6 million in the same period in 2025.
1 For more information, see section titled “Presentation of Non-IFRS Financial Measures” on the last two pages of this report, including the reconciliation of the profit for the period, net of tax to the Adjusted EBITDA.
First quarter 2026 operational performance comparison
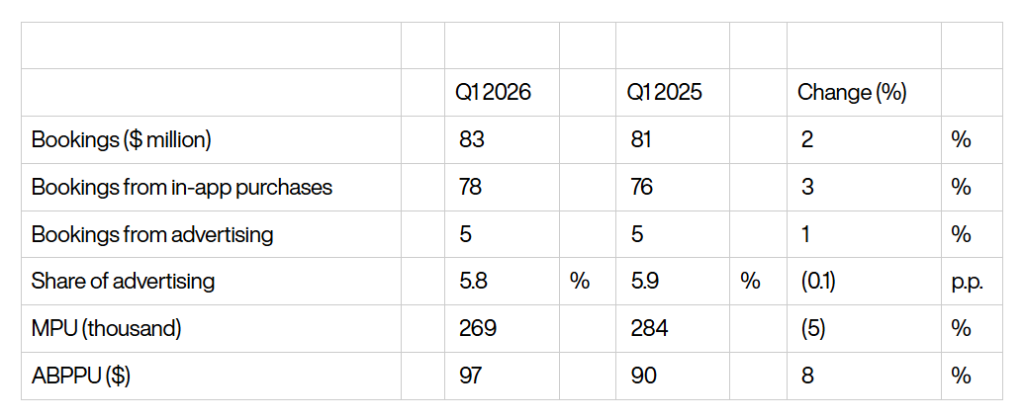
Bookings increased in the first quarter of 2026 to reach $83 million compared with $81 million in the same period in 2025. The increase was primarily due to an increase in ABPPU of 8% partially offset by a decrease in MPU of 5% in the first quarter of 2026 as compared with the same period of prior year.
The share of advertisement sales as a percentage of total bookings remained relatively stable at 5.8% in the first quarter of 2026 vs. 5.9% in the respective period in 2025.
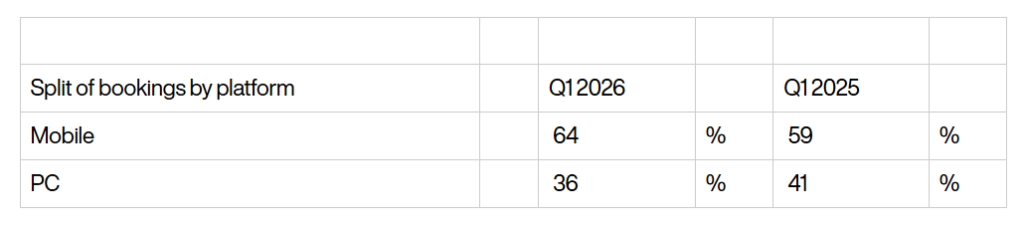
In the first quarter of 2026 we recorded an increase in share of mobile to reach 64% vs. 59% in the same period in 2025 and a corresponding decrease in share of PC which was fell to 36% vs. 41% in the same period in 2025.
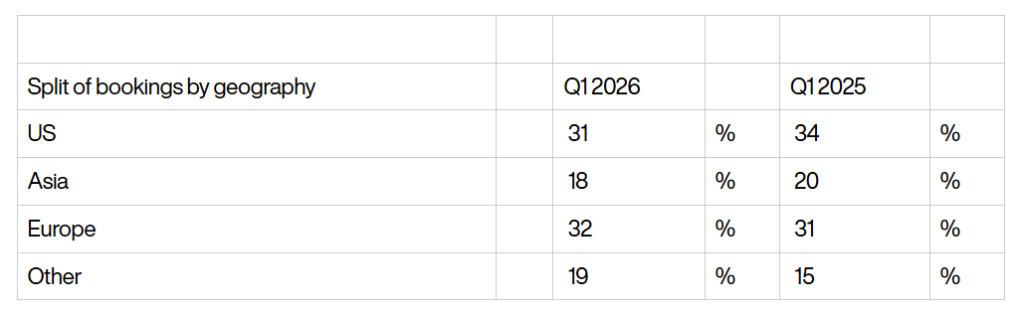
Our split of bookings by geography in the first quarter of 2026 vs. the same period in 2025 saw a decrease in the share of bookings derived from the US and Asia and an increase in bookings derived from Europe and Other.
Note:
Due to rounding, the numbers presented throughout this release may not precisely add up to the totals. The period-over-period percentage changes are based on the actual numbers and may therefore differ from the percentage changes if those were to be calculated based on the rounded numbers.
About GDEV
GDEV is a gaming and entertainment holding company, focused on development and growth of its franchise portfolio across various genres and platforms. With a diverse range of subsidiaries including Nexters and Cubic Games, among others, GDEV strives to create games that will inspire and engage millions of players for years to come. Its franchises, such as Hero Wars, Island Hoppers, Pixel Gun 3D and others have accumulated over 550 million installs and $2.5 billion of bookings worldwide. For more information, please visit www.gdev.inc
Contacts:
Investor Relations
Roman Safiyulin | Chief Corporate Development Officer [email protected]
Certain statements in this press release may constitute “forward-looking statements” for purposes of the federal securities laws. Such statements are based on current expectations that are subject to risks and uncertainties. In addition, any statements that refer to projections, forecasts or other characterizations of future events or circumstances, including any underlying assumptions, are forward-looking statements.
The forward-looking statements contained in this press release are based on the Company’s current expectations and beliefs concerning future developments and their potential effects on the Company. There can be no assurance that future developments affecting the Company will be those that the Company has anticipated. Forward-looking statements involve a number of risks, uncertainties (some of which are beyond the Company’s control) or other assumptions. You should carefully consider the risks and uncertainties described in the “Risk Factors” section of the Company’s 2025 Annual Report on Form 20-F, filed by the Company on March 31, 2026, and other documents filed by the Company from time to time with the Securities and Exchange Commission. Should one or more of these risks or uncertainties materialize, or should any of the Company’s assumptions prove incorrect, actual results may vary in material respects from those projected in these forward-looking statements. Forward-looking statements speak only as of the date they are made. Readers are cautioned not to put undue reliance on forward-looking statements, and the Company undertakes no obligation to update or revise any forward-looking statements, whether as a result of new information, future events or otherwise, except as may be required under applicable securities laws.
Presentation of Non-IFRS Financial Measures
In addition to the results provided in accordance with IFRS throughout this press release, the Company has provided the non-IFRS financial measure “Adjusted EBITDA” (the “Non-IFRS Financial Measure”). The Company defines Adjusted EBITDA as the profit/loss for the period, net of tax as presented in the Company’s financial statements in accordance with IFRS, adjusted to exclude (i) goodwill and investments in equity-accounted associates’ impairment, (ii) loss on disposal of subsidiaries, (iii) income tax expense, (iv) other financial income, finance income and expenses other than foreign exchange gains and losses and bank charges, (v) change in fair value of share warrant obligations and other financial instruments, (vi) share of loss of equity-accounted associates, (vii) depreciation and amortization, (viii) share-based payments expense and (ix) certain non-cash or other special items that we do not consider indicative of our ongoing operating performance. The Company uses this Non-IFRS Financial Measure for business planning purposes and in measuring its performance relative to that of its competitors. The Company believes that this Non-IFRS Financial Measure is a useful financial metric to assess its operating performance from period-to-period by excluding certain items that the Company believes are not representative of its core business. This Non-IFRS Financial Measure is not intended to replace, and should not be considered superior to, the presentation of the Company’s financial results in accordance with IFRS. The use of the Non-IFRS Financial Measure terms may differ from similar measures reported by other companies and may not be comparable to other similarly titled measures.
Reconciliation of the profit for the period, net of tax to the Adjusted EBITDA
2 Adjusted finance income/expenses consist of finance income and expenses other than foreign exchange gains and losses and bank charges, net.
March 17, 2026 – Limassol, Cyprus – GDEV Inc. (Nasdaq: GDEV), an international gaming and entertainment company (“GDEV” or the “Company”), today announced that Andrey Fadeev, Chief Executive Officer and Chairman of the Board of Directors, has notified the Company of his purchase of 2,730,384 GDEV ordinary shares from Boris Gertsovskiy, co-founder and former director of the Company, in a private transaction.
Following the transaction, Mr. Fadeev beneficially owns 6,709,391 GDEV ordinary shares, representing 37.0% of the Company’s issued and outstanding shares as of December 31, 2025. Mr. Gertsovskiy has divested himself of the entirety of his remaining shareholding in the Company. At the time of the transaction, Mr. Gertsovskiy did not hold any position of employment (including as a director or officer) at GDEV Inc.
The transaction was conducted by Mr. Fadeev solely in a personal capacity and is not connected with his role as Chief Executive Officer and/or Chairman of the Company. The Company was not a party to the transaction and did not act in concert with Mr. Fadeev in any manner in relation thereto.
About GDEV Inc.
GDEV is a gaming and entertainment holding company, focused on development and growth of its franchise portfolio across various genres and platforms. With a diverse range of subsidiaries including Nexters, Cubic Games, Royal Ark, Game Gears, Light Hour Games among others, GDEV strives to create games that will inspire and engage millions of players for years to come. Its franchises, such as Hero Wars, Island Hoppers, Pixel Gun 3D, Zombie Miner and others have accumulated over 550 million installs and $2.7 billion of bookings worldwide. For more information, please visit www.gdev.inc
Contacts:
Investor Relations Roman Safiyulin | Chief Corporate Development Officer [email protected]
Michael Kupinski, Director of Research, Equity Research Analyst, Digital, Media & Technology , Noble Capital Markets, Inc.
Jacob Mutchler, Research Associate, Noble Capital Markets, Inc.
Refer to the full report for the price target, fundamental analysis, and rating.
Solid Q4 results. The company reported Q4 revenue of $90.0 million and adj. EBITDA of $15.0 million. While revenue was modestly below our estimate of $99.0 million, adj. EBITDA was in line with our estimate of $15.1 million, as illustrated in Figure #1 Q4 Results. Notably, the strong adj. EBITDA figure was largely driven by more efficient use of marketing spend, which decreased approximately 25% y-o-y.
Key operating metrics. Bookings and monthly paying users (MPU) decreased by 7% and 10%, respectively, compared with the prior year period, but the decrease was expected as the company is focused on the quality of gameplay and retaining high-quality users. Furthermore, the company’s strategy appears to be paying off, as average bookings per paying user (ABPPU) increased from $102 in Q4’24 to $106 in Q4’25.
Equity Research is available at no cost to Registered users of Channelchek. Not a Member? Click ‘Join’ to join the Channelchek Community. There is no cost to register, and we never collect credit card information.
This Company Sponsored Research is provided by Noble Capital Markets, Inc., a FINRA and S.E.C. registered broker-dealer (B/D).
*Analyst certification and important disclosures included in the full report. NOTE: investment decisions should not be based upon the content of this research summary. Proper due diligence is required before making any investment decision.
March 5, 2026 – Limassol, Cyprus – GDEV Inc. (NASDAQ: GDEV), an international gaming and entertainment company (“GDEV” or the “Company”) released its preliminary, unaudited financial and operational results for the fourth quarter and twelve months ended December 31, 2025.
Fourth quarter 2025 financial highlights:
Revenue of $90 million decreased by 8% year-over-year.
Selling and marketing expenses of $35 million decreased by 25% year-over-year.
Profit for the period, net of tax, of $14 million in Q4 2025 increased vs. $2 million in Q4 2024.
Adjusted EBITDA¹ of $15 million in Q4 2025 increased vs. $9 million in Q4 2024.
Fourth quarter and twelve months 2025 financial performance in comparison
US$ million
Q42025
Q4 2024
Change (%)
12M 2025
12M 2024
Change (%)
Revenue
90
98
(8%)
404
421
(4%)
Platform commissions
(18)
(21)
(13%)
(85)
(91)
(7%)
Game operation cost
(15)
(13)
13%
(57)
(51)
12%
Selling and marketing expenses
(35)
(47)
(25%)
(159)
(209)
(24%)
General and administrative expenses
(9)
(8)
14%
(35)
(32)
10%
Profit/loss for the period, net of tax
14
2
N/M
69
26
N/M
Adjusted EBITDA²
15
9
66%
79
42
87%
Cash flows (used in)/generated from operating activities
18
5
N/M
29
29
3%
¹ For more information, see section titled “Presentation of Non-IFRS Financial Measures” on the last two pages of this report, including the reconciliation of the profit for the period, net of tax to the Adjusted EBITDA.
² The financial information presented for the comparative periods of 2024 may not reconcile exactly with the amounts previously published for those periods. This is due to the reclassification of the Impairment loss on loan receivables from Royal Ark to the Share of loss of equity-accounted associates line.
Fourth quarter 2025 financial performance
In the fourth quarter of 2025 our revenue decreased by $8 million (or 8%) year-over-year and amounted to $90 million, reflecting a decline in recognition of revenue from both current-period and prior-period bookings. This was mainly due to declining consumer spending levels in the current and preceding years, which reduced the amount of revenue recognized during the quarter. The decrease is consistent with our strategy to pursue more disciplined marketing spending and focus on attracting higher-quality, better-paying users rather than maximizing short-term volume.
Platform commissions decreased by $3 million (or 13%) in the fourth quarter of 2025 to reach $18 million, generally proportionate to the decrease in revenues.
Game operation cost increased by $2 million in the fourth quarter of 2025 and amounted to $15 million, mainly driven by an increase in investments in our IT infrastructure.
Selling and marketing expenses decreased by $12 million in the fourth quarter of 2025, amounting to $35 million. This decrease was driven by our continued focus on improving the efficiency of user acquisition activities. The decrease reflects a more selective approach to performance marketing, prioritizing channels that attract players with higher long-term value over broadscale campaigns aimed at short-term growth.
General and administrative expenses remained relatively stable at $9 million in the fourth quarter of 2025 vs. $8 million in the fourth quarter of 2024.
We recorded a profit for the period, net of tax, of $14 million in the fourth quarter of 2025 compared with $2 million in the same period of 2024, driven primarily by the factors above and i.) decrease of net financial expenses in Q4 2025 vs Q4 2024 in the amount of $3 million and ii.) decrease of share of loss of equity accounted associates by $6 million in Q4 2025 as compared with the same period of prior year. Adjusted EBITDA amounted to $15 million in the fourth quarter of 2025, an increase of $6 million compared with the same period in 2024 driven primarily by the same factors as those affecting the profit, except for the decrease of share of loss of equity accounted associates, which does not impact Adjusted EBITDA.
Cash flows generated from operating activities were positive $18 million in the fourth quarter of 2025 compared with positive $5 million in the same period in 2024.
Twelve months 2025 financial performance
In the year ended December 31, 2025, our revenue decreased by $17 million (or 4%) year-over-year and amounted to $404 million, reflecting a decline in recognition of revenue from both current-period and prior-period bookings. This was mainly due to declining consumer spending levels in the current and preceding years, which reduced the amount of revenue recognized during the year. The decrease is consistent with our strategy to pursue more disciplined marketing spending and focus on attracting higher-quality, better-paying users rather than maximizing short-term volume.
Platform commissions decreased by $7 million (or 7%) in the year ended December 31, 2025 to reach $85 million, generally proportionate to the decrease in revenues.
Game operation cost increased by $6 million in the year ended December 31, 2025 and amounted to $57 million, mainly driven by an increase in investments in our IT infrastructure.
Selling and marketing expenses decreased by $50 million in the year ended December 31, 2025, amounting to $159 million. This decrease was driven by our continued focus on improving the efficiency of user acquisition activities. The decrease reflects a more selective approach to performance marketing, prioritizing channels that attract players with higher long-term value over broadscale campaigns aimed at short-term growth.
General and administrative expenses increased by $3 million in the year ended December 31, 2025 and amounted to $35 million vs. $32 million in the year ended December 31, 2024. The increase was primarily driven by higher salary and related personnel expenses, reflecting the expansion of development activities and increased scale of operations across our game development studios.
We recorded a profit for the period, net of tax, of $69 million in the year ended December 31, 2025 compared with $26 million in the same period of 2024, driven primarily by the factors above and i.) decrease of net financial expenses in the year ended December 31 2025 vs the same period in 2024 in the amount of $7 million, ii.) increase in gain resulted from the change in fair value of share warrant obligation and other financial instruments by $3 million in the year ended December 31 2025 as compared with the same period of prior year and iii.) decrease of share of loss of equity accounted associates by $4 million in the year ended December 31, 2025 as compared with the same period of prior year. Adjusted EBITDA amounted to $79 million in the year ended December 31, 2025, an increase $37 million compared with the same period in 2024 driven primarily by the same factors as those affecting the profit, except for the increase in gain resulted from the change in fair value of share warrant obligation and other financial instruments and the decrease of share of loss of equity accounted associates, which do not impact Adjusted EBITDA.
Cash flows generated from operating activities remained the same, at $29 million, in the year ended December 31, 2025 vs. the same period of 2024. The divergence in earnings and cash flow dynamics reflects the significant impact of deferred revenue recognition on current-period income, which did not have a material effect on current-period cash flows.
Fourth quarter and twelve months 2025 operational performance comparison
Q42025
Q4 2024
Change (%)
12M 2025
12M 2024
Change (%)
Bookings ($ million)
88
94
(7%)
351
404
(13%)
Bookings from in-app purchases
83
89
(6%)
331
377
(12%)
Bookings from advertising
4
5
(18%)
20
27
(25%)
Share of advertising
5.1%
5.8%
(0.7) p.p
5.7%
6.7%
(1.0) p.p.
MPU (thousand)
262
292
(10%)
281
342
(18%)
ABPPU ($)
106
102
4%
98
92
7%
Bookings declined in the fourth quarter and twelve months of 2025 to reach $88 million and $351 million, respectively, compared with $94 million and $404 million in the same period in 2024. The decline is primarily due to a decline in monthly paying users by 10% in the fourth quarter of 2025 vs. the same period in 2024 and by 18% in the year ended December 31, 2025 vs. the same period in 2024, which we attribute to the decrease of the user acquisition investments throughout 2024 and 2025, partially offset by an increase in ABPPU.
The share of advertisement sales as a percentage of total bookings decreased in the fourth quarter of 2025 to reach 5.1% compared to 5.8% in the same respective period in 2024 and decreased in the year ended December 31, 2025 to reach 5.7% compared to 6.7% in the same period in 2024. This decline was primarily driven by a global trend of declining CPM rates for advertising throughout 2024 and 2025.
Split of bookings by platform
Q42025
Q4 2024
12M 2025
12M 2024
Mobile
58%
57%
60%
60%
PC
42%
43%
40%
40%
In the fourth quarter of 2025 we recorded an increase in share of mobile to reach 58% vs. 57% in the same period in 2024 and decrease in share of PC to reach 42% vs. 43% in the same period in 2024. In the year ended December 31, 2025 the share in mobile and PC remained the same compared to same period in 2024.
Split of bookings by geography
Q42025
Q4 2024
12M 2025
12M 2024
US
30%
34%
33%
34%
Asia
18%
21%
19%
22%
Europe
34%
32%
33%
30%
Other
18%
13%
15%
14%
Our split of bookings by geography in the fourth quarter and twelve months of 2025 vs. the same respective periods in 2024 saw a decrease in the share of bookings derived from the US and Asia and an increase in bookings derived from Europe and Other.
Note:
Due to rounding, the numbers presented throughout this release may not precisely add up to the totals. The period-over-period percentage changes are based on the actual numbers and may therefore differ from the percentage changes if those were to be calculated based on the rounded numbers.
The figures in this release are preliminary and unaudited. The Company’s 2025 Annual Report on Form 20-F, which will include the Company’s audited financial statements as of for the year ended December 31, 2025, is expected to be published within the prescribed filing period.
About GDEV
GDEV is a gaming and entertainment holding company, focused on development and growth of its franchise portfolio across various genres and platforms. With a diverse range of subsidiaries including Nexters and Cubic Games, among others, GDEV strives to create games that will inspire and engage millions of players for years to come. Its franchises, such as Hero Wars, Island Hoppers, Pixel Gun 3D and others have accumulated over 550 million installs and more than $2.5 billion of bookings worldwide. For more information, please visit www.gdev.inc.
Contacts:
Investor Relations
Roman Safiyulin | Chief Corporate Development Officer [email protected]
Certain statements in this press release may constitute “forward-looking statements” for purposes of the federal securities laws. Such statements are based on current expectations that are subject to risks and uncertainties. In addition, any statements that refer to projections, forecasts or other characterizations of future events or circumstances, including any underlying assumptions, are forward-looking statements.
The forward-looking statements contained in this press release are based on the Company’s current expectations and beliefs concerning future developments and their potential effects on the Company. There can be no assurance that future developments affecting the Company will be those that the Company has anticipated. Forward-looking statements involve a number of risks, uncertainties (some of which are beyond the Company’s control) or other assumptions. You should carefully consider the risks and uncertainties described in the “Risk Factors” section of the Company’s 2024 Annual Report on Form 20-F, filed by the Company on March 31, 2025, and other documents filed by the Company from time to time with the Securities and Exchange Commission. Should one or more of these risks or uncertainties materialize, or should any of the Company’s assumptions prove incorrect, actual results may vary in material respects from those projected in these forward-looking statements. Forward-looking statements speak only as of the date they are made. Readers are cautioned not to put undue reliance on forward-looking statements, and the Company undertakes no obligation to update or revise any forward-looking statements, whether as a result of new information, future events or otherwise, except as may be required under applicable securities laws.
Presentation of Non-IFRS Financial Measures
In addition to the results provided in accordance with IFRS throughout this press release, the Company has provided the non-IFRS financial measure “Adjusted EBITDA” (the “Non-IFRS Financial Measure”). The Company defines Adjusted EBITDA as the profit/loss for the period, net of tax as presented in the Company’s financial statements in accordance with IFRS, adjusted to exclude (i) goodwill and investments in equity-accounted associates’ impairment, (ii) loss on disposal of subsidiaries, (iii) income tax expense, (iv) other financial income, finance income and expenses other than foreign exchange gains and losses and bank charges, (v) change in fair value of share warrant obligations and other financial instruments, (vi) share of loss of equity-accounted associates, (vii) depreciation and amortization, (viii) share-based payments expense and (ix) certain non-cash or other special items that we do not consider indicative of our ongoing operating performance. The Company uses this Non-IFRS Financial Measure for business planning purposes and in measuring its performance relative to that of its competitors. The Company believes that this Non-IFRS Financial Measure is a useful financial metric to assess its operating performance from period-to-period by excluding certain items that the Company believes are not representative of its core business. This Non-IFRS Financial Measure is not intended to replace, and should not be considered superior to, the presentation of the Company’s financial results in accordance with IFRS. The use of the Non-IFRS Financial Measure terms may differ from similar measures reported by other companies and may not be comparable to other similarly titled measures.
Reconciliation of the profit for the period, net of tax to the Adjusted EBITDA
US$ million
Q42025
Q4 2024
12M 2025
12M 2024
Profit for the period, net of tax
14
2
69
26
Adjust for:
Income tax expense
0.9
1
5
5
Adjusted finance income/expenses³
(0.2)
0.7
(3)
(2)
Share of loss of equity-accounted associates2
(1)
5
4
8
Change in fair value of share warrant obligations and other financial instruments
(0.2)
(0.6)
(4)
(0.9)
Depreciation and amortization
2
2
7
6
Share-based payments
0.1
0.2
0.6
1
Adjusted EBITDA
15
9
79
42
³ Adjusted finance income/expenses consist of finance income and expenses other than foreign exchange gains and losses and bank charges, net.
Michael Kupinski, Director of Research, Equity Research Analyst, Digital, Media & Technology , Noble Capital Markets, Inc.
Jacob Mutchler, Research Associate, Noble Capital Markets, Inc.
Refer to the full report for the price target, fundamental analysis, and rating.
Strong Q2 Results. The company reported strong Q2 results. Revenue of $119.9 million, and adj. EBITDA of $20.7 million, both easily surpassed our estimates of $97.0 million and $7.0 million, respectively, as illustrated in Figure #1 Q2 Results. Notably, management attributed the strong quarter to an increase in consumable in-app purchases, which are recognized during the quarter rather than being deferred over the average player life cycle of 28 months.
Key operating metrics. Bookings and monthly paying users (MPU) decreased by 14% and 18%, respectively, compared to the prior year period, but the decrease was expected as the company is focused on the quality of gameplay and not over-monetizing its user base. However, the company is showing signs of returning to growth as both average bookings per paying user (ABPPU) and MPUs increased sequentially from Q1. ABPPU increased from $90 in Q1’25 to $93 in Q2’25, and MPUs increased from 284,000 to 312,000 over the same period.
Equity Research is available at no cost to Registered users of Channelchek. Not a Member? Click ‘Join’ to join the Channelchek Community. There is no cost to register, and we never collect credit card information.
This Company Sponsored Research is provided by Noble Capital Markets, Inc., a FINRA and S.E.C. registered broker-dealer (B/D).
*Analyst certification and important disclosures included in the full report. NOTE: investment decisions should not be based upon the content of this research summary. Proper due diligence is required before making any investment decision.
LIMASSOL, Cyprus, Aug. 05, 2025 (GLOBE NEWSWIRE) — GDEV Inc. (Nasdaq: GDEV), a global gaming and entertainment company, today announced the acquisition of Light Hour Games, a privately held mobile studio based in Cyprus.
Light Hour Games is a full-stack studio that builds and markets mobile casual games using AI-first workflows — enabling rapid iteration without compromising high-quality execution. Founded by industry veterans Konstantin Mitrofanov and Ilya Nikitin, the studio operates as a 15-person team with deep expertise across game development, art, and live operations.
The acquisition represents a strategic partnership that will grant the Light Hour Games studio the opportunity for continued creative freedom and long-term upside through a share in the future success of its games, while securing the necessary funding for its operations through GDEV. As part of GDEV’s ecosystem, Light Hour Games will gain access to GDEV’s knowledge and data platforms.
“By welcoming Light Hour Games into the GDEV family we secure a talented crew whose lean structure, deep industry experience and advanced AI-driven toolset perfectly complement our growth strategy. Our philosophy has always been about enabling the best creators with the resources and freedom they need to succeed,” said Andrey Fadeev, CEO of GDEV. “With Light Hour Games, we see an opportunity to bring fresh ideas and approaches to a proven genre – and we believe this team has the experience and ambition to build something truly special.”
Konstantin Mitrofanov, CEO of Light Hour Games, shared: “Partnering with GDEV gives our studio both the financial runway and the strategic reach to realise our ambitions. With GDEV’s support, we can focus on crafting a casual experience that not only engages players from day one, but grows over time into a meaningful part of their everyday lives.”
About GDEV Inc.
GDEV is a gaming and entertainment holding company, focused on development and growth of its franchise portfolio across various genres and platforms. With a diverse range of subsidiaries including Nexters and Cubic Games, among others, GDEV strives to create games that will inspire and engage millions of players for years to come. Its franchises, such as Hero Wars, Island Hoppers, Pixel Gun 3D and others have accumulated over 550 million installs and $2.7 billion of bookings worldwide. For more information, please visit www.gdev.inc.
About Light Hour Games
Light Hour Games is an AI-first game development studio and a part of GDEV. Based in Cyprus and founded by industry veterans, the company combines deep production expertise with cutting-edge AI workflows to accelerate development and enhance game quality. The studio focuses on creating mobile casual experiences that are emotionally engaging, scalable, and built to evolve with their players over time.
Contacts:
Investor Relations Roman Safiyulin | Chief Corporate Development Officer [email protected]
Certain statements in this press release may constitute “forward-looking statements” for purposes of the federal securities laws. Such statements are based on current expectations that are subject to risks and uncertainties. In addition, any statements that refer to projections, forecasts or other characterizations of future events or circumstances, including any underlying assumptions, are forward-looking statements. The forward-looking statements contained in this press release are based on the Company’s current expectations and beliefs concerning future developments and their potential effects on the Company. There can be no assurance that future developments affecting the Company will be those that the Company has anticipated. Forward-looking statements involve a number of risks, uncertainties (some of which are beyond the Company’s control) or other assumptions. You should carefully consider the risks and uncertainties described in the “Risk Factors” section of the Company’s 2024 Annual Report on Form 20-F, filed by the Company on March 31, 2025, and other documents filed by the Company from time to time with the SEC. Should one or more of these risks or uncertainties materialize, or should any of the Company’s assumptions prove incorrect, actual results may vary in material respects from those projected in these forward-looking statements. Forward-looking statements speak only as of the date they are made. Readers are cautioned not to put undue reliance on forward-looking statements, and the Company undertakes no obligation to update or revise any forward-looking statements, whether as a result of new information, future events or otherwise, except as may be required under applicable securities laws.
LIMASSOL, Cyprus, June 23, 2025 – GDEV Inc. (NASDAQ: GDEV), an international gaming and entertainment company (“GDEV” or the “Company”), today announced that Olga Loskutova will depart from her role as Chief Operating Officer effective July 1, 2025.
Since assuming the COO position in October 2024, Ms. Loskutova has successfully established the planning, reporting and cross-studio coordination frameworks that underpin GDEV’s operating model.
“Olga’s operational expertise helped us put the right structure in place at a critical moment,” said Andrey Fadeev, Founder and Chief Executive Officer of GDEV. “We are grateful for her contribution and wish her continued success in her next chapter.”
ABOUT GDEV
GDEV is a gaming and entertainment holding company, focused on development and growth of its franchise portfolio across various genres and platforms. With a diverse range of subsidiaries including Nexters and Cubic Games, among others, GDEV strives to create games that will inspire and engage millions of players for years to come. Its franchises, such as Hero Wars, Island Hoppers, Pixel Gun 3D and others have accumulated over 550 million installs and $2.5 billion of bookings worldwide. For more information, please visit www.gdev.inc
CONTACTS
Investor Relations
Roman Safiyulin | Chief Corporate Development Officer
Certain statements in this press release may constitute “forward-looking statements” for purposes of the federal securities laws. Such statements are based on current expectations that are subject to risks and uncertainties. In addition, any statements that refer to projections, forecasts or other characterizations of future events or circumstances, including any underlying assumptions, are forward-looking statements.
The forward-looking statements contained in this press release are based on the Company’s current expectations and beliefs concerning future developments and their potential effects on the Company. There can be no assurance that future developments affecting the Company will be those that the Company has anticipated. Forward-looking statements involve a number of risks, uncertainties (some of which are beyond the Company’s control) or other assumptions. You should carefully consider the risks and uncertainties described in the “Risk Factors” section of the Company’s 2024 Annual Report on Form 20-F, filed by the Company on March 31, 2025, and other documents filed by the Company from time to time with the Securities and Exchange Commission. Should one or more of these risks or uncertainties materialize, or should any of the Company’s assumptions prove incorrect, actual results may vary in material respects from those projected in these forward-looking statements. Forward-looking statements speak only as of the date they are made. Readers are cautioned not to put undue reliance on forward-looking statements, and the Company undertakes no obligation to update or revise any forward-looking statements, whether as a result of new information, future events or otherwise, except as may be required under applicable securities laws.
Michael Kupinski, Director of Research, Equity Research Analyst, Digital, Media & Technology , Noble Capital Markets, Inc.
Jacob Mutchler, Research Associate, Noble Capital Markets, Inc.
Refer to the full report for the price target, fundamental analysis, and rating.
Solid Q1 Results. The company reported Q1 revenue of $97.0 million and adj. EBITDA of $15.6 million, both of which easily surpassed our estimates of $87.0 million and a loss of $0.6 million, respectively. Notably, while revenue decreased 9% from last year, adj. EBITDA was up substantially from a loss of roughly $1.0 million. The improvement in adj. EBITDA was largely driven by the company’s efficient use of marketing spend and focus on profitability.
Key operating metrics. Bookings and monthly paying users decreased by 25% and 26%, respectively, compared to the prior year period, but the decrease was expected as the company is focused on improving the quality of gameplay and not over-monetizing its user base. For example, average bookings per paying user (ABPPU) increased from $88 in Q1’24 to $90 in Q1’25, despite a decrease in monthly paying users.
Equity Research is available at no cost to Registered users of Channelchek. Not a Member? Click ‘Join’ to join the Channelchek Community. There is no cost to register, and we never collect credit card information.
This Company Sponsored Research is provided by Noble Capital Markets, Inc., a FINRA and S.E.C. registered broker-dealer (B/D).
*Analyst certification and important disclosures included in the full report. NOTE: investment decisions should not be based upon the content of this research summary. Proper due diligence is required before making any investment decision.
Michael Kupinski, Director of Research, Equity Research Analyst, Digital, Media & Technology , Noble Capital Markets, Inc.
Jacob Mutchler, Research Associate, Noble Capital Markets, Inc.
Refer to the full report for the price target, fundamental analysis, and rating.
Strong Q1 Results. The company reported Q1 revenue of $97.0 million and adj. EBITDA of $15.6 million, both of which easily surpassed our estimates of $87.0 million and a loss of $0.6 million, respectively, as illustrated in Figure #1 Q1 Results. Notably, while revenue decreased 9% from last year, adj. EBITDA was up substantially from a loss of roughly $1.0 million. The improvement in adj. EBITDA was largely driven by the company’s efficient use of marketing spend and focus on profitability.
Key operating metrics. Notably, while bookings and monthly paying users decreased by 25% and 26%, respectively, compared to the prior year period, the decrease was largely expected as the company is focused on improving the quality of gameplay and not over-monetizing its user base. For example, average bookings per paying user (ABPPU) increased from $88 in Q1’24 to $90 in Q1’25, despite a decrease in monthly paying users.
Equity Research is available at no cost to Registered users of Channelchek. Not a Member? Click ‘Join’ to join the Channelchek Community. There is no cost to register, and we never collect credit card information.
This Company Sponsored Research is provided by Noble Capital Markets, Inc., a FINRA and S.E.C. registered broker-dealer (B/D).
*Analyst certification and important disclosures included in the full report. NOTE: investment decisions should not be based upon the content of this research summary. Proper due diligence is required before making any investment decision.