Research News and Market Data on XELB
PDF Version
NEW YORK, May 14, 2026 (GLOBE NEWSWIRE) — In a release issued earlier today by Xcel Brands, Inc (NASDAQ: XELB) please note that the “Conference Call and Webcast” section contained outdated information. The corrected release follows
- Net loss on a GAAP basis was $2.5 million for the current quarter compared with $2.8 million net loss for the prior year quarter.
- Year-to-Date Adjusted EBITDA for 2026 was approximately negative $0.7 million for both the current and prior year quarters.:
Xcel Brands, Inc. (NASDAQ: XELB) (“Xcel” or the “Company”), a media and consumer products company with significant expertise in building influencer lead brands, live-steam shopping and social commerce, today announced its financial results for the quarter ended March 31, 2026.
Robert W. D’Loren, Chairman and Chief Executive Officer of Xcel commented “I am very pleased with the progress we are making with all of our new influencer led brands”.
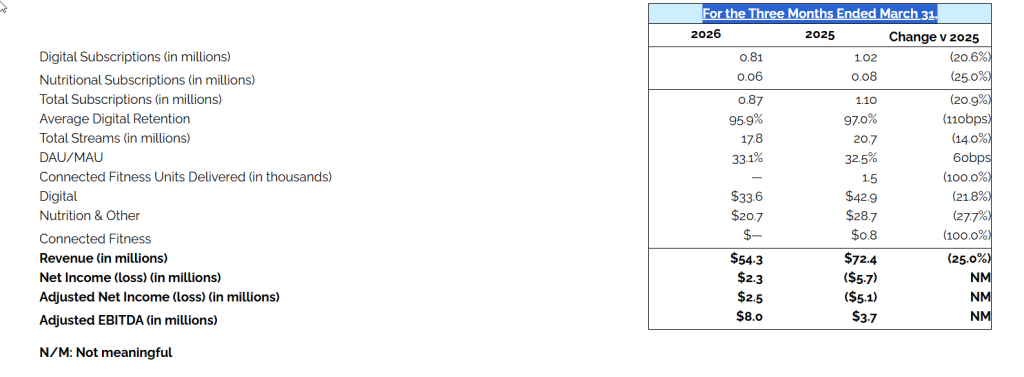
First Quarter 2025 Financial Results
Total revenue for the first quarter of 2026 was $1.1 million, representing a decrease of approximately $0.2 million (-14%) from the prior year quarter. This year-over-year decrease was primarily attributable to a transition to a new supplier for our interactive television business, impacting inventory availability during the early part of the quarter. Total revenue for the current quarter was consistent with total revenue for the fourth quarter of 2025.
Direct operating costs and expenses decreased approximately $0.2 million (-9%) from the prior year quarter to $2.1 million in the current quarter. Currently, the Company has reduced its direct operating expenses to an expected run rate of less than $8 million per annum.
During the quarter, the Company recognized a $0.06 million impairment charge related to the subsequent sale of the Judith Ripka brand in April, whereby the Company reclassified the Judith Ripka brand intangible assets to a current asset, assets held for sale.
Net loss attributable to Xcel Brands stockholders for the quarter was approximately $2.5 million, or $(0.42) per share, compared with net loss of $2.8 million, or $(1.18) per share, for the prior year quarter.
After adjusting certain cash and non-cash items, current quarter results on a non-GAAP basis were a net loss of approximately $1.4 million, or $(0.24) per share and a similar net loss of approximately $1.4 million, or $(0.58) per share, for the prior year quarter. Adjusted EBITDA was negative $0.7 million for both the current and prior year quarters.
Balance Sheet
The Company’s balance sheet on March 31, 2026, reflected stockholders’ equity of approximately $13.2 million, unrestricted cash and cash equivalents of approximately $0.2 million. On April 27, 2026, the Company netted $2 million of cash from the sale of the Judith Ripka Brand, as previously disclosed. The Company’s balance sheet on March 31, 2026, also reflected $12.6 million of long-term debt.
The Company’s working capital on March 31, 2026 (exclusive of the current portion of lease obligations, deferred revenue, and contingent obligations payable in shares or via other non-cash means and adjusted for the April debt refinancing) was break-even. On January 21, 2026, the Company entered into a common stock purchase agreement, pursuant to which the buyer has committed to purchase up to $15.0 million of the Company’s common stock. Under the terms and conditions of this agreement, the Company has the right, but not the obligation, to sell up to $15.0 million of the Company’s common stock. The actual amount and timing of any sales of Common Stock will be determined by the Company at its discretion.
Conference Call and Webcast
The Company will hold a conference call with the investment community on May 19, 2026, at 5:00 p.m. ET. A webcast of the conference call will be available live on the Investor Relations section of Xcel’s website at https://xcelbrands.co/pages/events-and-presentations or directly at https://edge.media-server.com/mmc/p/dk3zkyjv. Interested parties unable to access the conference call via the webcast may dial 800-715-9871 or 646-307-1963 and use the Conference ID 7958649. A replay of the webcast will be available on Xcel’s website.
About Xcel Brands
Xcel Brands, Inc. (NASDAQ: XELB) is a media and consumer products company engaged in the design, licensing, marketing, live streaming, and social commerce sales of branded apparel, footwear, accessories, fine jewelry, home goods and other consumer products, and the acquisition of dynamic consumer lifestyle brands. Xcel was founded in 2011 with a vision to reimagine shopping, entertainment, and social media as social commerce. Xcel owns the Halston and C. Wonder brands, as well as the co-branded collaboration brands Tower Hill by Christie Brinkley, Trust. Respect. Love by Cesar Millan, GemmaMade by Gemma Stafford and Off/Duty by Coco Rocha brand and holds noncontrolling interests or long-term license agreement in Mesa Mia by Jenny Martinez. Xcel also owns and manages the Longaberger by Shannon Doherty brand through its controlling interest in Longaberger Licensing, LLC. Xcel is pioneering a modern consumer products sales strategy which includes the promotion and sale of products under its brands through interactive television, digital live-stream shopping, social commerce, brick-and-mortar retailers, and e-commerce channels to be everywhere its customer’s shop. The company’s previously owned and current brands have generated more than $5 billion in retail sales via livestreaming in interactive television and digital channels alone and has over 20,000 hours of content production time in live-stream and social commerce. The brand portfolio reaches more than 46 million social media followers with broadcast reaching 200 million households. Headquartered in New York City, Xcel Brands is led by an executive team with significant live streaming, production, merchandising, design, marketing, retailing, and licensing experience, and a proven track record of success in elevating branded consumer products companies. For more information, visit www.xcelbrands.com.
Forward Looking Statements
This press release contains forward-looking statements. All statements other than statements of historical fact contained in this press release, including statements regarding future events, our future financial performance, business strategy and plans and objectives of management for future operations, are forward-looking statements. We have attempted to identify forward-looking statements by terminology including “anticipates,” “believes,” “can,” “continue,” “ongoing,” “could,” “estimates,” “expects,” “intends,” “may,” “appears,” “suggests,” “future,” “likely,” “goal,” “plans,” “potential,” “projects,” “predicts,” “seeks,” “should,” “would,” “guidance,” “confident” or “will” or the negative of these terms or other comparable terminology. These forward-looking statements include, but are not limited to, statements regarding our anticipated revenue, expenses, profitability, strategic plans and capital needs. These statements are based on information available to us on the date hereof and our current expectations, estimates and projections and are not guarantees of future performance. Forward-looking statements involve known and unknown risks, uncertainties, assumptions and other factors, including, without limitation, the risks discussed in the “Risk Factors” section and elsewhere in the Company’s Annual Report on form 10-K for the year ended December 31, 2024 and its other filings with the SEC, which may cause our or our industry’s actual results, levels of activity, performance or achievements to differ materially from those expressed or implied by these forward-looking statements. Moreover, we operate in a very competitive and rapidly changing environment. New risks emerge from time to time, and it is not possible for us to predict all risk factors, nor can we address the impact of all factors on our business or the extent to which any factor, or combination of factors, may cause our actual results to differ materially from those contained in any forward-looking statements. You should not place undue reliance on any forward-looking statements. Except as expressly required by the federal securities laws, we undertake no obligation to update any forward-looking statements, whether as a result of new information, future events, changed circumstances or any other reason.
For further information please contact:
Seth Burroughs
Xcel Brands
[email protected]
Non-GAAP net income and non-GAAP diluted EPS are non-GAAP unaudited terms. We define non-GAAP net income as net income (loss) attributable to Xcel Brands, Inc. stockholders, exclusive of amortization of trademarks, income (loss) from equity method investments, stock-based compensation and cost of licensee warrants, asset impairment charges, and income taxes. Non-GAAP net income (loss) and non-GAAP diluted EPS measures do not include the tax effect of the aforementioned adjusting items, due to the nature of these items and the Company’s tax strategy.
Adjusted EBITDA is a non-GAAP unaudited measure, which we define as net income (loss) attributable to Xcel Brands, Inc. stockholders before interest and finance expenses, accretion of lease liability for exited leases, income taxes, other state and local franchise taxes, depreciation and amortization, income (loss) from equity method investments, asset impairment charges, stock-based compensation and cost of licensee warrants, and costs associated with restructuring of operations. Costs associated with restructuring of operations include operating losses generated by certain of our businesses that have been restructured or discontinued (i.e., wholesale apparel and fine jewelry), as well as non-cash charges associated with the restructuring of certain contractual arrangements.
Management uses non-GAAP net income, non-GAAP diluted EPS, and Adjusted EBITDA as measures of operating performance to assist in comparing performance from period to period on a consistent basis and to identify business trends relating to our results of operations. Management believes non-GAAP net income, non-GAAP diluted EPS, and Adjusted EBITDA are also useful because these measures adjust for certain costs and other events that management believes are not representative of our core business operating results, and thus these non-GAAP measures provide supplemental information to assist investors in evaluating our financial results.
Non-GAAP net income, non-GAAP diluted EPS, and Adjusted EBITDA should not be considered in isolation or as alternatives to net income, earnings per share, or any other measure of financial performance calculated and presented in accordance with GAAP. Given that non-GAAP net income, non-GAAP diluted EPS, and Adjusted EBITDA are financial measures not deemed to be in accordance with GAAP and are susceptible to varying calculations, our non-GAAP net income, non-GAAP diluted EPS, and Adjusted EBITDA may not be comparable to similarly titled measures of other companies, including companies in our industry, because other companies may calculate these measures in a different manner than we do. In evaluating non-GAAP net income, non-GAAP diluted EPS, and Adjusted EBITDA, you should be aware that in the future we may or may not incur expenses similar to some of the adjustments in this document. Our presentation of non-GAAP net income, non-GAAP diluted EPS, and Adjusted EBITDA does not imply that our future results will be unaffected by these expenses or any unusual or non-recurring items. When evaluating our performance, you should consider non-GAAP net income, non-GAAP diluted EPS, and Adjusted EBITDA alongside other financial performance measures, including our net income and other GAAP results, and not rely on any single financial measure.
View full release here.
Source: Xcel Brands, Inc