Joe Gomes, CFA, Managing Director, Equity Research Analyst, Generalist , Noble Capital Markets, Inc.
Refer to the full report for the price target, fundamental analysis, and rating.
AI. AI demand continues to accelerate for ISG. In the first quarter, ISG delivered $21 million of AI-related revenue, about a third of the firm-wide total, up from $12 million a year ago. AI-related revenue includes work where AI is a key part of the client solution, including AI research and insights, AI strategy, sourcing governance, operating model design, business case validation, software, tech provider evaluation, and transformation support. AI and the cost optimization initiatives that fund digital transformation remain leading areas of client investment, and that plays to ISG’s strengths, in our view.
ISG AI Index. The Company’s recently launched ISG AI Index underscores how the AI market continues to develop. Initial spending is concentrated in infrastructure as hyperscalers ramp up capacity to meet demand. Software and platform providers are beginning to monetize their AI capabilities, while managed services are still in the early stages, indicating the larger opportunity remains to come.
Equity Research is available at no cost to Registered users of Channelchek. Not a Member? Click ‘Join’ to join the Channelchek Community. There is no cost to register, and we never collect credit card information.
This Company Sponsored Research is provided by Noble Capital Markets, Inc., a FINRA and S.E.C. registered broker-dealer (B/D).
*Analyst certification and important disclosures included in the full report. NOTE: investment decisions should not be based upon the content of this research summary. Proper due diligence is required before making any investment decision.
Mark Reichman, Managing Director, Equity Research Analyst, Natural Resources, Noble Capital Markets, Inc.
Refer to the full report for the price target, fundamental analysis, and rating.
Building an integrated North American phosphate supply platform. First Phosphate is focused on extracting and purifying high-purity igneous phosphate for the lithium iron phosphate (LFP) battery industry. The company is advancing a vertically integrated platform in the Saguenay–Lac-Saint-Jean region of Quebec, targeting the eventual downstream production of purified phosphoric acid and cathode active material (CAM) used in LFP batteries. The company’s flagship Bégin-Lamarche Project is a high-purity igneous phosphate deposit that hosts a pit-constrained indicated mineral resource of 41.5 million tonnes grading 6.49% phosphorus pentoxide and a pit-constrained inferred mineral resource of 214.0 million tonnes grading 6.01%.
Growing Demand for LFP Batteries. The LFP battery market is expanding rapidly due to growing demand from electric vehicles, energy storage, artificial intelligence data centers, and industrial applications. Phosphate accounts for approximately 60% of LFP battery chemistry, while lithium accounts for only 4%. Because only about 5% of global phosphate deposits are igneous in nature, these high-purity deposits are valuable strategic assets for North American battery production.
Equity Research is available at no cost to Registered users of Channelchek. Not a Member? Click ‘Join’ to join the Channelchek Community. There is no cost to register, and we never collect credit card information.
This Research is provided by Noble Capital Markets, Inc., a FINRA and S.E.C. registered broker-dealer (B/D).
*Analyst certification and important disclosures included in the full report. NOTE: investment decisions should not be based upon the content of this research summary. Proper due diligence is required before making any investment decision.
Joe Gomes, CFA, Managing Director, Equity Research Analyst, Generalist , Noble Capital Markets, Inc.
Refer to the full report for the price target, fundamental analysis, and rating.
Environment. CoreCivic’s near-term performance will reflect the ultimate moves ICE makes. We continue to believe the services provided by CoreCivic are the best value for the Federal government to manage the immigration crisis. We believe the new leadership at DHS is likely to continue to pursue the use of private operators going forward.
Clinical Solutions Pharmacy Acquisition. As mentioned in our initial First Look at 1Q26, subsequent to the quarter’s end, CoreCivic acquired Clinical Solutions Pharmacy (“CSP”), one of the largest providers of mail order pharmacy services to correctional facilities in the United States. We expect the acquisition of CSP to diversify CoreCivic’s cash flows in a complementary business and a growing market. We believe there are additional opportunities for CoreCivic to expand this business further.
Equity Research is available at no cost to Registered users of Channelchek. Not a Member? Click ‘Join’ to join the Channelchek Community. There is no cost to register, and we never collect credit card information.
This Company Sponsored Research is provided by Noble Capital Markets, Inc., a FINRA and S.E.C. registered broker-dealer (B/D).
*Analyst certification and important disclosures included in the full report. NOTE: investment decisions should not be based upon the content of this research summary. Proper due diligence is required before making any investment decision.
Apollo Global Management (NYSE: APO) announced Monday it has entered into separate definitive agreements to acquire Emerald Holding, Inc. (NYSE: EEX) and privately held Questex, LLC, with the explicit intention of combining the two businesses into a scaled North American B2B events and media platform. The Emerald deal is structured as an all-cash transaction at $5.03 per share, implying an estimated closing enterprise value of approximately $1.5 billion and representing a 42.1% premium to Emerald’s unaffected share price prior to deal speculation. Questex’s acquisition terms were not disclosed. Both transactions are expected to close in the second half of 2026, subject to customary regulatory approvals.
For Emerald shareholders — the vast majority of whom are represented by Onex, which controls more than 90% of the company’s outstanding shares and has already signed a support agreement — the premium is the headline. For investors trying to understand why Apollo, with over $1 trillion in assets under management, is paying up for a B2B trade show company, the more interesting question is the strategic logic.
Together, Emerald and Questex bring approximately 160 events across complementary industry verticals. Emerald has built one of the more recognized portfolios of category-leading trade exhibitions in the U.S., spanning industries from retail and licensing to safety and design. Questex operates a differentiated model built around a 365-day digital engagement layer that wraps its live events — providing year-round community access rather than the once-a-year interaction that defines most traditional trade show businesses. The combination is designed to produce a platform that generates recurring revenue and customer engagement well beyond the event floor.
The timing of this deal reflects something broader happening in the live events and B2B media space. The thesis that in-person events would be permanently diminished by digital alternatives never fully materialized post-pandemic. Instead, what has emerged is a more nuanced reality: the proliferation of digital tools and AI-driven communication has, paradoxically, elevated the perceived value of high-trust, face-to-face business interactions — particularly in industries where relationships, deals, and partnerships are made in person. Apollo’s bet is essentially that the B2B events market is structurally undervalued relative to the role these gatherings play in driving commerce, and that a consolidated, well-capitalized platform with a year-round digital backbone is worth considerably more than the sum of its parts.
Emerald had been running a strategic review process since last year, so this outcome isn’t a surprise — but the buyer and the structure are notable. Apollo is not a passive financial sponsor looking for a quick exit. The firm’s track record in media and experiential assets suggests this is a longer-horizon platform build, with Questex serving as a strategic complement that brings both digital infrastructure and a different set of industry relationships to the table.
For small-cap investors, EEX was exactly the kind of company that tends to be overlooked in public markets — a cash-generative events business with strong customer retention and a dominant position in its niches, trading at a discount to intrinsic value. The 42% premium Apollo paid is a reminder of how wide that gap can be, and why platform-building strategies in fragmented B2B markets continue to attract private equity capital.
Goldman Sachs advised Emerald. RBC Capital Markets, RAN Advisory, and PJT Partners advised Apollo.
Akamai Technologies (Nasdaq: AKAM) surged nearly 28% on Friday after Bloomberg reported the company has signed a seven-year, $1.8 billion cloud computing deal with Anthropic — the AI company behind the Claude family of large language models — to help meet what Anthropic describes as explosive and still-accelerating demand for its AI software. The contract is the largest in Akamai’s history and marks a significant pivot for a company that has built most of its business around content delivery networks and cybersecurity services.
Akamai had disclosed the agreement Thursday, describing it only as a deal with a “leading frontier model provider” without naming the counterparty. The identity of that provider — Anthropic — was confirmed Friday through sources familiar with the matter, per Bloomberg. Neither company commented publicly on the details.
The context driving the deal makes the scale easier to understand. Anthropic’s CEO Dario Amodei said this week at a public conference that his company experienced 80x growth in annualized revenue and usage in the first quarter of 2026 alone, driven by surging enterprise adoption of Claude for software development, workflow automation, and other AI-assisted tasks. That kind of growth rate creates an infrastructure procurement challenge that most companies would struggle to solve quickly — and Anthropic has been solving it aggressively. In addition to Akamai, the company has separately secured computing capacity through Alphabet’s Google and Elon Musk’s SpaceX in deals announced in recent weeks.
For Akamai, the significance of landing this contract goes well beyond the revenue figure. The company has been investing steadily in cloud computing infrastructure in an effort to grow beyond its legacy CDN and cybersecurity business, which — while profitable — has faced saturation and margin pressure. A seven-year, $1.8 billion commitment from one of the most prominent AI companies in the world is exactly the kind of anchor contract that validates a multi-year infrastructure buildout and gives the market a reason to re-rate the stock. Friday’s 28% move reflects not just the deal itself but a reassessment of what Akamai’s computing business could become if it continues to attract AI-scale customers at this level.
For investors watching the AI infrastructure buildout broadly, the Anthropic-Akamai deal is another data point in a clear and continuing theme: the most consequential compute deals being signed right now are not going exclusively to the hyperscalers. Microsoft, Amazon, and Google are still capturing the majority of AI cloud spending, but frontier AI labs are actively diversifying their infrastructure dependencies — and that is creating real commercial opportunities for companies like Akamai that have built credible distributed computing capacity at scale.
The broader implication for small and microcap investors is worth keeping in mind as well. Every dollar of infrastructure spending at the frontier AI layer flows downstream — into hardware, data center components, cooling systems, fiber networks, and specialized software. Companies across those supply chains that are positioned to benefit from a sustained, multi-year AI infrastructure buildout remain one of the more compelling structural themes in the small-cap space right now.
Akamai’s stock closed Friday at levels not seen in over a year. The company has not provided additional public details on the deal terms beyond confirming the seven-year compute contract.
CALGARY, AB, May 8, 2026 /CNW/ – InPlay Oil Corp. (TSX: IPO) (TASE: IPO) (OTCQX: IPOOF) (“InPlay” or the “Company”) is pleased to announce its financial and operating results for the three months ended March 31, 2026. InPlay’s unaudited interim financial statements and notes, and Management’s Discussion and Analysis (“MD&A”) for the three months ended March 31, 2026 will be available at “www.sedarplus.ca” and the Company’s website at “www.inplayoil.com“. An updated corporate presentation will be available on our website in due course.
First Quarter 2026 Highlights:
Closed an oversubscribed offering of senior unsecured bonds for total gross proceeds of C$244 million maturing on December 15, 2030 at an attractive interest rate of 6.23%. InPlay has fully hedged all cashflows relating to the New Israeli Shekel denominated bonds over the next four years.
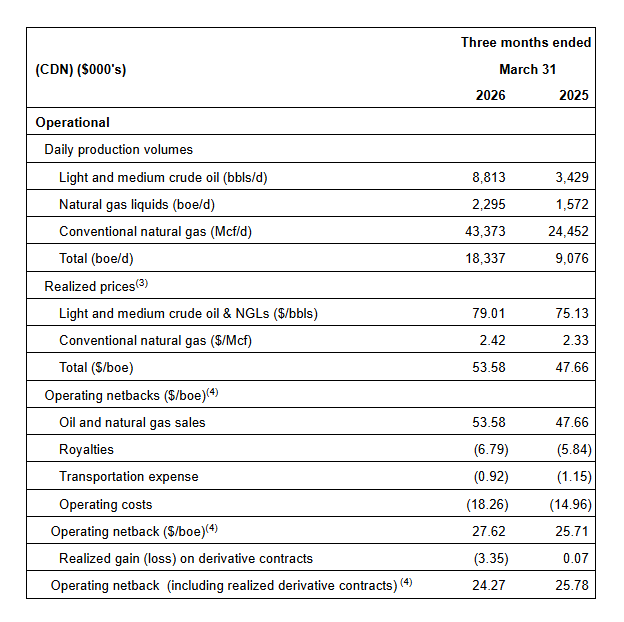
Achieved average quarterly production of 18,337 boe/d(1) (61% light crude oil and NGLs), a 102% increase from Q1 2025.
Improved light oil production to 8,813 bbl/d, a 157% increase from Q1 2025. Light crude oil weighting improved by 10% from Q1 2025 driving stronger per boe netbacks and returns.
Realized strong operating income of $45.6 million, a 117% increase from Q1 2025 and a 20% increase from Q4 2025. This resulted in an operating income profit margin(4) of 52%, an 11% improvement from Q4 2025.
Enhanced field operating netbacks(3) to $27.62/boe, an increase of 31% compared to Q4 2025.
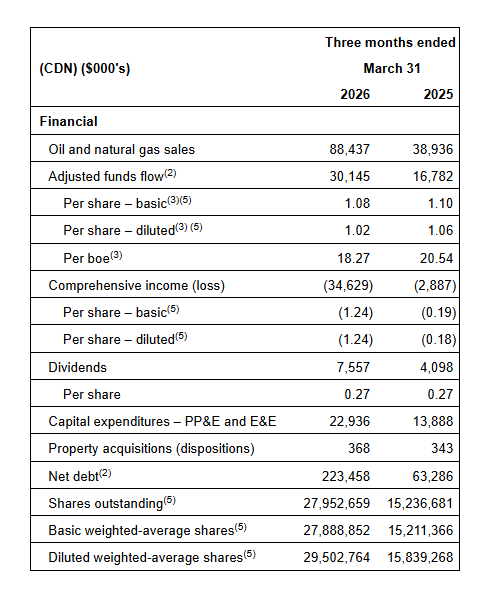
Generated AFF(2) of $30.1 million ($1.08 per weighted average basic share(3)), an 80% increase from Q1 2025.
Returned $7.6 million to shareholders via monthly dividends (6.4% yield relative to current share price). Since November 2022, InPlay has distributed $75 million in dividends, including dividends declared to date in the second quarter.
Message to Shareholders:
The ongoing conflict in the Middle East and associated uncertainty has driven extreme and unprecedented volatility in oil and gas commodity prices. Concerns surrounding the largest oil supply shock in recent history has led to significantly higher crude oil prices. The Company believes this supply shortfall, combined with years of underinvestment and relatively modest global reserve additions compared to global consumption of approximately 38 billion barrels per year, supports a higher WTI pricing environment going forward relative to the ~US$60 WTI prices experienced in recent years.
InPlay has maintained a smart and disciplined business approach through the previous US$60 WTI pricing environment, achieving one of the highest free cash flow yields amongst our peers, which is expected to increase materially in a US $70+ WTI price environment. This increase is anticipated to drive meaningful net debt reduction, further strengthening the Company’s ability to execute our strategy of disciplined organic growth coupled with our strong track-record of accretive acquisitions, while reinforcing our focus on Free Adjusted Funds Flow and delivering strong returns to shareholders.
Our strategically aligned relationship with Delek Group Ltd. (“Delek”), who have a solid track record of value creation in the oil and gas industry, puts us in an advantageous position to execute our strategy. This relationship has already created meaningful value through Delek’s support in facilitating the successful issuance of unsecured bonds on the Tel Aviv Stock Exchange (“TASE”). The bonds were issued at favorable rates and terms, and we are confident we will have continued access to this advantageous cost of capital resource going forward.
During the first quarter, InPlay continued to build on the strong momentum generated from our transformational 2025 acquisition and results. The Company executed an active drilling program in the first quarter with five (5.0 net) Pembina Extended Reach Horizontal (“ERH”) wells drilled. The first two wells were brought on production in mid-February and have delivered strong results ahead of internal expectations. Initial production (“IP”) rates for these two wells were 333 boe/d (88% light oil and NGLs) per well over the first 60 days of production (45% above type curve) and they are currently producing at a rate of 278 boe/d (83% light oil and NGLs) per well. The last three wells were brought on production in April and are currently in the clean-up phase. These wells have delivered initial production (“IP”) rates of 351 boe/d (91% light oil and NGLs) per well over the first 27 days of production and are currently producing at a rate of 462 boe/d (90% light oil and NGLs) per well. To date, results indicate performance is significantly ahead of internal estimates.
The Company was able to access the field early in the second quarter during spring break-up, allowing us to accelerate our capital program. Drilling operations recently finished three (3.0 net) ERH Pembina wells that are expected to be on-production in early June, approximately 40 days earlier than originally planned. Unlimited use of access roads that are owned and maintained by the Company and unrestricted entry to surface locations with minimal road bans in effect allowed us to advance drilling operations in response to the significantly improved crude oil commodity price environment. Given the Company’s financial flexibility and ability to quickly adjust operations, further modifications to upcoming capital programs can be made in response to changing market conditions.
Driven by strong production exiting the first quarter, InPlay reiterates its 2026 average annual production guidance of 18,600 boe/d – 19,200 boe/d(1) (60% – 62% light oil and NGLs). The Company is now forecasting WTI prices to average US$81.50 for the remainder of the year (compared to our previous estimate of US$63.00). This results in an increase in AFF(2) from $125 million (mid-point) to $147 million (mid-point), with estimated FAFF(3) increasing from $55 million (mid-point) to $77 million (mid-point), equating to a FAFF yield(3) of 15% (mid-point). The Company’s leverage metrics are projected to remain strong with net debt to EBITDA(3) forecasted to be 1.1x for 2026 (mid-point).
The Company continues to monitor the evolving pricing environment and remains focused on disciplined but flexible capital allocation and maintaining financial strength to support long-term sustainability and returns to shareholders.
First Quarter 2026 Financial & Operations Overview:
InPlay completed an active capital program during the first quarter investing $22.9 million in drilling five (5.0 net) Pembina ERH wells and related infrastructure. Operational execution remained strong during the quarter, with drilling and completion operations on budget and consistent with recent capital programs. Some service equipment delays and unseasonably warm weather in March impacted completion operations on the three-well pad, resulting in a three-week delay in bringing these wells on production. The Company benefitted from new flush production coming on-line into a favorable oil pricing environment, with WTI prices averaging US $91.00 and US $98.06 in March and April respectively, compared to approximately US $62.50 during the first two months of 2026.
Quarterly production averaged 18,337 boe/d(1) (61% light crude oil and NGLs), representing a 102% increase from the first quarter of 2025. Quarterly crude oil production averaged 8,813 bbl/d, a 157% increase from the first quarter of 2025. The Company forecasts an estimate of 3% – 5% of downtime per month, the first quarter was impacted by some extraordinary one-time events, resulting in incremental downtime of approximately 475 boe/d (47% light oil and NGLs). This included a severe windstorm in March which damaged power infrastructure affecting the Company’s core Pembina properties, resulting in downtime of approximately 300 boe/d (55% light oil and NGLs) for the quarter. The low-decline nature of the Company’s base production, combined with strong performance of recently drilled wells, continues to benefit the Company.
Quarterly operating costs decreased on an absolute basis compared to the fourth quarter of 2025, but were slightly higher on a per boe basis reflecting the impact of fixed operating costs on per boe metrics due to production downtime from the one-time events described above. In addition, the Company performed service operations on five low-rate wells that have been offline for up to three years. At current crude oil prices, these wells are estimated to payout in 6 – 9 months and are anticipated to produce without issues for an additional 5 – 10 years with minimal decline. InPlay will look to complete similar well servicing operations in the upcoming months given the current pricing environment.
InPlay generated AFF of $30.1 million ($1.08 per basic share), representing an 80% increase from the first quarter of 2025. These results were achieved despite $5.5 million in realized hedging losses, primarily due to the significant increase in WTI in March relative to the hedges required by our first lien bank lenders to facilitate the acquisition in 2025. The Company has significantly less crude oil volumes hedged in the second half of 2026 and all of 2027 and intends to remain opportunistic with future hedging activity while monitoring the current backwardation in the WTI forward price curve. Details of the Company’s current hedges are provided in the “Hedging Summary” section of the Reader Advisories.
During the quarter, InPlay paid dividends of $7.6 million to shareholders, representing a 6.1% yield relative to our current share price. Since November 2022, InPlay has distributed $75 million in dividends, including dividends declared to date in the second quarter.
The Company realized a net loss of $34.6 million ($1.24 per basic share; $1.24 per diluted share), which includes a $39 million impact from the unrealized future mark-to-market value of the Company’s hedges required by our first lien bank lenders to facilitate our acquisition in 2025.
Financial and Operating Results:
On behalf of our employees, management team and Board of Directors, we thank our shareholders for their continued support and look forward to providing updates on our progress throughout the year.
For further information please contact:
Doug Bartole President and Chief Executive Officer InPlay Oil Corp. Telephone: (587) 955-0632
Kevin Leonard Vice President Corporate & Business Development InPlay Oil Corp. Telephone: (587) 955-0635
Notes:
1.
See “Production Breakdown by Product Type” at the end of this press release.
2.
Capital management measure. See “Non-GAAP and Other Financial Measures” contained within this press release.
3.
Supplementary financial measure. See “Non-GAAP and Other Financial Measures” contained within this press release.
4.
Non-GAAP financial measure or ratio that does not have a standardized meaning under International Financial Reporting Standards (IFRS) and GAAP and therefore may not be comparable with the calculations of similar measures for other companies. Please refer to “Non-GAAP and Other Financial Measures” contained within this press release and in our most recently filed MD&A.
For further information please contact: Doug Bartole, President and Chief Executive Officer, InPlay Oil Corp., Telephone: (587) 955-0632; Kevin Leonard, Vice President Corporate & Business Development, InPlay Oil Corp., Telephone: (587) 955-0635
PDF VersionOnce Complete, Kratos’ Arc Jet and Laser Facility’s Multi-Domain Test Capability is Expected to Accelerate Hypersonic Materials Development for Decades, Advancing U.S. Defense Infrastructure
SAN DIEGO, May 08, 2026 (GLOBE NEWSWIRE) — Kratos Defense & Security Solutions, Inc. (Nasdaq: KTOS), a technology company in defense, national security, and global markets, announced today that it has selected Odon, Indiana, as the future home of its new mid-tier coupled arc jet and laser facility. The site selection represents a major milestone for Project Helios following the company’s prior announcement of award to design and build the new test capability.
After an extensive, multi-state review, Kratos determined that Odon, Indiana, best meets the technical and operational requirements for the Project. Kratos expresses its enthusiasm for joining the local community and contributing to the region’s growing role in the nation’s defense industrial base.
“This was a highly competitive process with several strong candidate locations,” said Michael Johns, Senior Vice President at Kratos. “Kratos continues to lean forward to support our critical defense infrastructure and partner with communities, like Odon, that share our passion for serving our nation. We deeply appreciate the support we received from local and state leadership throughout the selection process. Their commitment to fostering advanced technology development played a key role in this decision.”
Project Helios is driven by a set of core design priorities that advance both technical capability and national security objectives. The program provides a critical bridge between laboratory material development and fielded system applications, enabling more efficient transition of hypersonic materials into operational use. It expands the nation’s aerothermal testing bandwidth to support growing defense demands, while delivering higher-throughput, cost-effective evaluation at scale. At the same time, Project Helios reflects Kratos’ long-term commitment to collaboration, innovation, and investment in the infrastructure necessary to sustain and strengthen national defense capabilities.
The new facility is being designed to address critical gaps in the current U.S. test infrastructure by providing aerothermal testing for materials used on hypersonic systems at an accessible scale. Once complete, the Odon-based capability will complement existing national test ranges and increase access to vital material evaluation resources for all branches of the U.S. Armed Forces and Department of War.
“We are grateful for the outstanding partnership from Indiana’s leadership and our utility collaborators, including Utilities District of Western Indiana and Hoosier Energy,” said Dave Carter, President of Kratos’ Defense and Rocket Support Services Division. “Their proactive engagement was invaluable as we determined the best home for this critical capability, which we are excited to make available to the defense community. We look forward to a long and productive presence in the region.”
About Kratos Defense & Security Solutions Kratos Defense & Security Solutions, Inc. (NASDAQ: KTOS) is a technology, products, system and software company addressing the defense, national security, and commercial markets. Kratos makes true internally funded research, development, capital and other investments, to rapidly develop, produce and field solutions that address our customers’ mission critical needs and requirements. At Kratos, affordability is a technology, and we seek to utilize proven, leading-edge approaches and technology, not unproven bleeding edge approaches or technology, with Kratos’ approach designed to reduce cost, schedule and risk, enabling us to be first to market with cost effective solutions. We believe that Kratos is known as an innovative disruptive change agent in the industry, a company that is an expert in designing products and systems up front for successful rapid, large quantity, low-cost future manufacturing which is a value-add competitive differentiator for our large traditional prime system integrator partners and also to our government and commercial customers. Kratos intends to pursue program and contract opportunities as the prime or lead contractor when we believe that our probability of win (PWin) is high and any investment required by Kratos is within our capital resource comfort level. We intend to partner and team with a large, traditional system integrator when our assessment of PWin is greater or required investment is beyond Kratos’ comfort level. Kratos’ primary business areas include virtualized ground systems for satellites and space vehicles including software for command & control (C2) and telemetry, tracking and control (TT&C), jet powered unmanned aerial drone systems, hypersonic vehicles and rocket systems, propulsion systems for drones, missiles, loitering munitions, supersonic systems, space craft and launch systems, C5ISR and microwave electronic products for missile, radar, missile defense, space, satellite, counter UAS, directed energy, communication and other systems, and virtual & augmented reality training systems for the warfighter. For more information, visit www.KratosDefense.com.
Notice Regarding Forward-Looking Statements Certain statements in this press release may constitute “forward-looking statements” within the meaning of the Private Securities Litigation Reform Act of 1995. These forward-looking statements are made on the basis of the current beliefs, expectations and assumptions of the management of Kratos and are subject to significant risks and uncertainty. Investors are cautioned not to place undue reliance on any such forward-looking statements. All such forward-looking statements speak only as of the date they are made, and Kratos undertakes no obligation to update or revise these statements, whether as a result of new information, future events or otherwise. Although Kratos believes that the expectations reflected in these forward-looking statements are reasonable, these statements involve many risks and uncertainties that may cause actual results to differ materially from what may be expressed or implied in these forward-looking statements. For a further discussion of risks and uncertainties that could cause actual results to differ from those expressed in these forward-looking statements, as well as risks relating to the business of Kratos in general, see the risk disclosures in the Annual Report on Form 10-K of Kratos for the year ended December 28, 2025, and in subsequent reports on Forms 10-Q and 8-K and other filings made with the SEC by Kratos.
Toronto, Ontario–(Newsfile Corp. – May 8, 2026) – Aurania Resources Ltd. (TSXV: ARU) (OTCQB: AUIAF) (FSE: 20Q) (“Aurania” or the “Company”) is pleased to announce that it has closed the previously announced option agreement (the “Agreement”) dated April 27, 2026 (the “Execution Date”) with St-Georges Eco-Mining Corp (“St-Georges”) (CSE: SX), and its wholly owned subsidiary Iceland Resources ehf (“IR”), to work collaboratively to define and execute a phased exploration program aimed at advancing the Thormodsdalur gold project (“Thor’s Valley” or the “Project”), towards initial modern resource definition. Please see the Company’s press release dated April 28, 2026 for further details on the Project and the Agreement.
Pursuant to the terms of the Agreement, Aurania issued to St. Georges 988,359 common shares (the “Shares”) at a deemed price per Share of C$0.2068 for a total value of C$204,375 (US$150,000). The deemed price per Share is equal to the volume weighted average price of the Shares on each business day commencing on the Execution Date and ending on the last business day prior to the closing date of the Agreement. The Shares issued to St. Georges are subject to a hold period of four months and one day from the date of issuance.
To exercise the option to earn a 70% interest in the Project (the “First Option”), Aurania must incur exploration expenditures of US$5 million over four years as follows:
At least US$500,000 prior to the first anniversary of the Execution Date;
At least US$1,000,000 prior to the second anniversary of the Execution Date;
At least US$1,500,000 prior to the third anniversary of the Execution Date;
At least US$2,000,000 prior to the fourth anniversary of the Execution Date;
Upon completing the First Option, St-Georges will have the option to choose between maintaining a 30% interest in the Project through a joint venture or retain an up to 3% net smelter return royalty on the Project (the “Royalty”), with such Royalty to be reduced as necessary such that the aggregate royalty burden on the Project shall not exceed 3%, inclusive of any pre-existing NSR royalties. In the event the Royalty is granted, Aurania shall have the right to repurchase 1% of the Royalty for US$1,500,000, in cash or Shares (subject to the approval of the TSX Venture Exchange if the buy back will be made in Shares), at Aurania’s sole discretion, at any time prior to the one year anniversary of commercial production at the Project.
If St. Georges elects to retain the Royalty, Aurania will have the right, in its sole discretion, to increase its interest in the Project to 100% by incurring an additional US$2,000,000 of exploration expenditures prior to the 5th anniversary of the Execution Date.
About St-Georges Eco-Mining Corp. St-Georges develops new technologies and holds a diversified portfolio of assets and patent-pending Intellectual Property within several highly prospective subsidiaries including: EVSX, a leading North American advanced battery processing and recycling initiative; St-Georges Metallurgy, with metallurgical R&D and related IP, including processing and recovering high grade lithium from spodumene; Iceland Resources, with high grade gold exploration projects including the flagship Thor Project; H2SX, developing technology to convert methane into solid carbon and turquoise hydrogen; and Quebec exploration projects including the Manicouagan and Julie nickel, Copper and PGE critical mineral projects on Quebec’s North Shore, and Notre-Dame niobium Project in Lac St Jean.
About Iceland Resources Iceland Resources is an Icelandic mineral exploration company focused on early-stage precious metal projects, including Thormodsdalur. The company’s exploration strategy emphasizes systematic, data-driven evaluation of prospective targets in under-explored volcanic terrains.
About Aurania Aurania is a mineral exploration company engaged in the identification, evaluation, acquisition, and exploration of mineral property interests, with a focus on precious metals and critical energy in Europe and abroad.
Neither the TSX-V nor its Regulation Services Provider (as that term is defined in the policies of the TSX-V) accepts responsibility for the adequacy or accuracy of this release.
This news release contains forward-looking information as such term is defined in applicable securities laws, which relate to future events or future performance and reflect management’s current expectations and assumptions. The forward-looking information includes: statements regarding the terms of the Agreement, earn-in requirements, anticipated exploration programs, timing of activities, the potential to advance the Project, Aurania’s objectives, goals or future plans, statements, exploration results, potential mineralization, the tonnage and grade of mineralization which has the potential for economic extraction and processing, the merits and effectiveness of known process and recovery methods, the corporation’s portfolio, treasury, management team and enhanced capital markets profile, the estimation of mineral resources, exploration, timing of the commencement of operations, the commencement of any drill program and estimates of market conditions. Such forward-looking statements reflect management’s current beliefs and are based on assumptions made by and information currently available to Aurania, including the assumption that there will be no material adverse change in metal prices, all necessary consents, licenses, permits and approvals will be obtained, including various local government licenses and the market. Investors are cautioned that these forward-looking statements are neither promises nor guarantees and are subject to risks and uncertainties that may cause future results to differ materially from those expected. Risk factors that could cause actual results to differ materially from the results expressed or implied by the forward-looking information include, among other things: failure to achieve the anticipated results, incorrect assumptions made in the initial evaluation of the Project, failure to identify mineral resources; failure to convert estimated mineral resources to reserves; the inability to complete a feasibility study which recommends a production decision; the preliminary nature of metallurgical test results; the inability to recover and process mineralization using known mining methods; the presence of deleterious mineralization or the inability to process mineralization in an environmentally acceptable manner; commodity prices, supply chain disruptions, restrictions on labour and workplace attendance and local and international travel; a failure to obtain or delays in obtaining the required regulatory licenses, permits, approvals and consents; an inability to access financing as needed; a general economic downturn, a volatile stock price, labour strikes, political unrest, changes in the mining regulatory regime governing Aurania; a failure to comply with environmental regulations; a weakening of market and industry reliance on precious metals and base metals; and those risks set out in the Company’s public documents filed on SEDAR+. Aurania cautions the reader that the above list of risk factors is not exhaustive. Although the Company believes that the assumptions and factors used in preparing the forward-looking information in this news release are reasonable, undue reliance should not be placed on such information, which only applies as of the date of this news release, and no assurance can be given that such events will occur in the disclosed time frames or at all. The Company disclaims any intention or obligation to update or revise any forward-looking information, whether as a result of new information, future events or otherwise, other than as required by law.
The U.S. economy added 115,000 jobs in April — nearly double the 65,000 analysts had forecast — and the unemployment rate held steady at 4.3%, according to Friday’s Bureau of Labor Statistics release. On the surface, it’s a resilient labor market. Beneath it, the picture is more complicated, and for investors watching the Federal Reserve’s next move, the report effectively confirms what markets had already suspected: rate cuts aren’t coming anytime soon.
Job growth, which had been narrowly concentrated in healthcare for much of the year, showed some broadening in April, with gains in transportation, warehousing, and retail. That’s the good news. The bad news is that manufacturing employment declined and federal government payrolls continued to shrink — two sectors that tend to have downstream effects on smaller companies in industrial supply chains and government contracting. The labor force participation rate slipped further to 61.8%, down from 62.5% in January, a trend that complicates the headline unemployment number and signals that some workers are simply exiting the labor pool rather than finding jobs.
Monthly payroll data has also been unusually erratic this year. February showed a notable revision to a loss of 156,000 jobs, March was revised up to 185,000, and January produced 160,000. The April beat, while welcome, arrives in a context where the underlying trend line is genuinely difficult to read. That volatility, combined with an unemployment rate that has held in a narrow 4.3%–4.5% band, suggests the labor market is stable but not accelerating — and probably not deteriorating either.
With the employment side of the Fed’s dual mandate looking reasonably solid, central bank officials have pivoted their focus squarely toward inflation. The Fed’s preferred gauge — the Personal Consumption Expenditures index — rose 3.5% in March on a headline basis, up sharply from 2.8% in February. Core PCE, which strips out food and energy, came in at 3.2%. Both figures are well above the Fed’s 2% target, and inflation has now been running above that target for more than five years.
The concerns deepening at the Fed go beyond domestic data. The ongoing conflict in the Middle East is pushing energy prices higher, and several Fed officials flagged this week that sustained elevated energy costs could crimp consumer spending, slow business investment, and — critically — feed back into inflation even as demand softens. Tariffs are adding further upward pressure on goods prices. It’s a stagflationary cocktail that gives the Fed very little room to maneuver in either direction.
For small and microcap investors, the implications are direct. A Fed that is frozen in place — unable to cut because of inflation, unwilling to hike without clearer deterioration in employment — is a Fed that keeps borrowing costs elevated for longer. For smaller companies that rely on access to credit markets to fund growth, acquisitions, or operations, that environment remains a genuine headwind. Deal financing stays expensive. Multiples on growth-oriented companies stay compressed. The companies that will outperform in this environment are those generating cash, managing debt conservatively, and positioned in sectors with pricing power.
Kevin Warsh is set to take over as Federal Reserve Chair in less than two weeks. His first policy decision will be made against one of the more complex macroeconomic backdrops in recent memory.
Robert LeBoyer, Senior Vice President, Equity Research Analyst, Biotechnology, Noble Capital Markets, Inc.
Refer to the full report for the price target, fundamental analysis, and rating.
1Q26 Reported Strong Growth In Revenues. The Oncology Institute reported a net loss of $2.5 million or $(0.02) per share. Total Revenues of $147.4 million met our expectations with 41% growth over 1Q25. On the quarterly conference call, the company raised Free Cash Flow guidance to a range of $5 million to $15 million from the previous range of $(15) million to $5 million. Cash on March 31, 2026, was $30.3 million.
Financial Measures Showed Strong Growth Over 1Q25. TOI continues to show strong increases in the number of covered lives, leading to both year-over-year and sequential quarterly increases in revenues. Increased volume in Dispensary Services resulted in revenue of $87.5 million, representing 78% growth over 1Q25, while Patient Services revenues of $59.1 million showed 11% growth over 1Q25.
Equity Research is available at no cost to Registered users of Channelchek. Not a Member? Click ‘Join’ to join the Channelchek Community. There is no cost to register, and we never collect credit card information.
This Company Sponsored Research is provided by Noble Capital Markets, Inc., a FINRA and S.E.C. registered broker-dealer (B/D).
*Analyst certification and important disclosures included in the full report. NOTE: investment decisions should not be based upon the content of this research summary. Proper due diligence is required before making any investment decision.
Jacob Mutchler, Research Associate, Noble Capital Markets, Inc.
Michael Kupinski, Director of Research, Equity Research Analyst, Digital, Media & Technology , Noble Capital Markets, Inc.
Refer to the full report for the price target, fundamental analysis, and rating.
Q1 results. The company reported Q1 revenue of $22.9 million and adj. EBITDA loss of $1.6 million below our estimates of $24 million and a loss of $0.8 million, respectively, as illustrated in Figure #1 Q1 Results. Results were impacted by softness in traditional broadcast revenue, while digital Interactive revenue remained a bright spot, increasing 25% y-o-y.
Digital growth. The company continued to implement its blended digital-radio strategy, integrating broadcast and digital solutions to enhance advertiser engagement and retention. Total Interactive revenue reached $4.4 million, an increase of 25.2% year over year. This expansion was driven by triple-digit gains in high-margin segments, specifically search (up 105%) and targeted display (up 120%)
Equity Research is available at no cost to Registered users of Channelchek. Not a Member? Click ‘Join’ to join the Channelchek Community. There is no cost to register, and we never collect credit card information.
This Company Sponsored Research is provided by Noble Capital Markets, Inc., a FINRA and S.E.C. registered broker-dealer (B/D).
*Analyst certification and important disclosures included in the full report. NOTE: investment decisions should not be based upon the content of this research summary. Proper due diligence is required before making any investment decision.
Robert LeBoyer, Senior Vice President, Equity Research Analyst, Biotechnology, Noble Capital Markets, Inc.
Refer to the full report for the price target, fundamental analysis, and rating.
Cullgen Acquisition Has Been Completed. Gyre Therapeutics reported a 1Q26 loss of $9.9 million or $(0.11) per share, consistent with our expectations for a transition year between maturing products and the introduction of Hydronidone. Importantly, the company completed the acquisition of Cullgen, a private company with protein targeting and degradation technologies. This acquisition expands the company’s technology and pipeline beyond fibrosis. Cash and equivalents on March 31, 2026, was $79.2 million.
The Hydronidone NDA Has Been Submitted. Gyre completed the NDA submission for Hydronidone, its pirfenidone derivative, for the treatment of chronic hepatitis B (CHB)-associated liver fibrosis. In March, Hydronidone was awarded Priority Review by the Center for Drug Evaluation (CDE, a division of China’s National Medical Products Administration or NMPA). This was in recognition of its efficacy and potential impact on patient outcomes. The NDA is currently under review for completeness, with acceptance of the filing expected in 2Q26.
Equity Research is available at no cost to Registered users of Channelchek. Not a Member? Click ‘Join’ to join the Channelchek Community. There is no cost to register, and we never collect credit card information.
This Company Sponsored Research is provided by Noble Capital Markets, Inc., a FINRA and S.E.C. registered broker-dealer (B/D).
*Analyst certification and important disclosures included in the full report. NOTE: investment decisions should not be based upon the content of this research summary. Proper due diligence is required before making any investment decision.
Michael Kupinski, Director of Research, Equity Research Analyst, Digital, Media & Technology , Noble Capital Markets, Inc.
Jacob Mutchler, Research Associate, Noble Capital Markets, Inc.
Refer to the full report for the price target, fundamental analysis, and rating.
Retail distribution. On May 7, the company announced additional details regarding the initial phase of its retail distribution strategy for Shakeology, which is scheduled to launch in more than 80 Sprouts Farmers Market locations on May 18. Notably, the company secured a strategic partnership with KeHE Distributors, a national distributor specializing in organic, fresh, and specialty products, with distribution spanning more than 30,000 retail locations.
Details. For its initial rollout in the retail market, the company will be selling a convenient seven-serving bag of Shakeology for the first time. The seven-serving bag is priced at $34.99 and available in four flavors. Additionally, each Shakeology purchase also includes access to BODi’s digital fitness platform, supporting the company’s cross-over strategy. While Shakeology has never been sold in retail locations, it has generated more than $4 billion in direct-to-consumer sales and delivered more than 1 billion servings since its release in 2009.
Equity Research is available at no cost to Registered users of Channelchek. Not a Member? Click ‘Join’ to join the Channelchek Community. There is no cost to register, and we never collect credit card information.
This Company Sponsored Research is provided by Noble Capital Markets, Inc., a FINRA and S.E.C. registered broker-dealer (B/D).
*Analyst certification and important disclosures included in the full report. NOTE: investment decisions should not be based upon the content of this research summary. Proper due diligence is required before making any investment decision.


")