Mark Reichman, Managing Director, Equity Research Analyst, Natural Resources, Noble Capital Markets, Inc.
Refer to the full report for the price target, fundamental analysis, and rating.
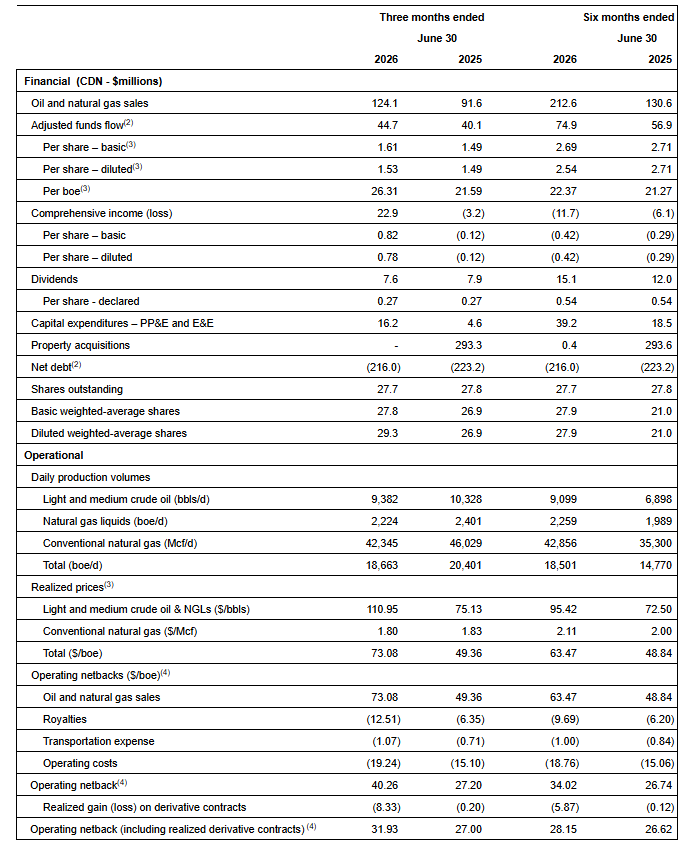
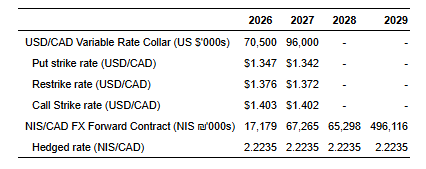
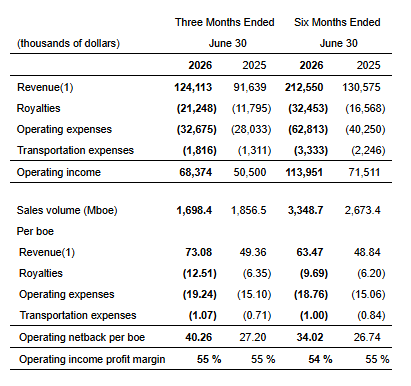
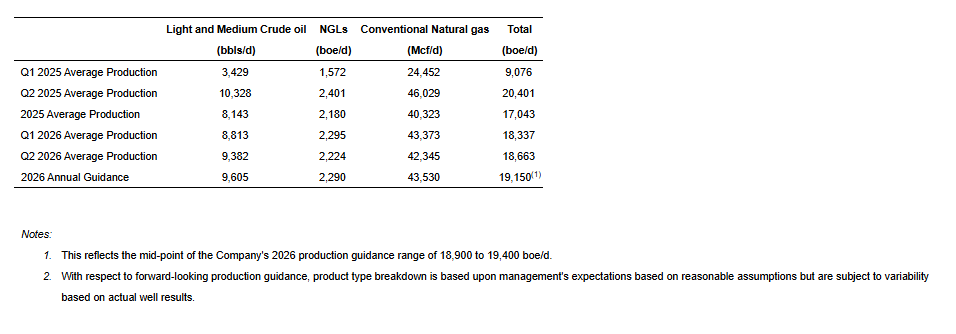
Second quarter financial results. Duringthe second quarter of 2026, InPlay production averaged 18,663 barrels of oil equivalents per day (boe/d), compared with 20,401 boe/d in the prior-year quarter. Despite lower production, stronger commodity pricing drove oil and natural gas sales to C$124.1 million, up 35% from C$91.6 million during the second quarter of 2025. Adjusted funds flow increased 11% to C$44.7 million from $40.1 million, while adjusted funds flow per basic share increased 8% to C$1.61 from C$1.49.
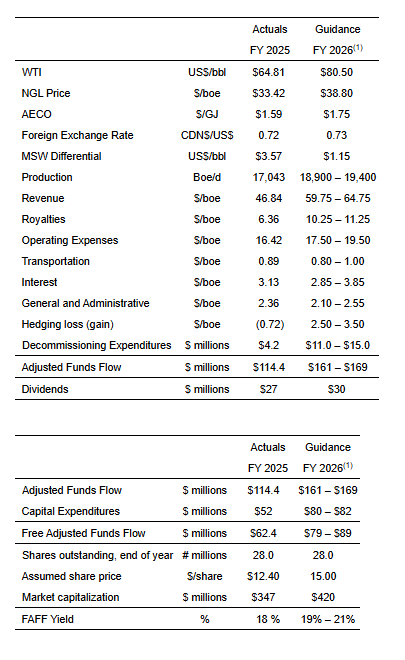
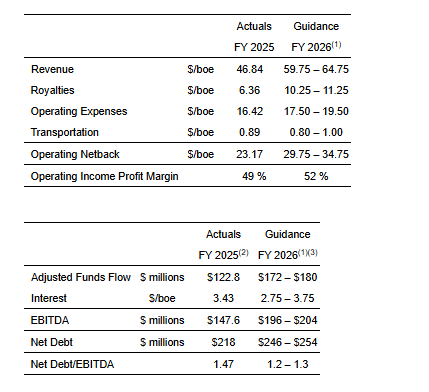
Outlook for the remainder of 2026. Supported by stronger oil prices and the expected impact of its recently announced acquisition, InPlay’s 2026 guidance forecasts average annual production of 18,900 to 19,400 boe/d, with approximately 61% to 63% light oil and natural gas liquids (NGLs), and adjusted funds flow of C$161 million to C$169 million, or approximately C$165 million at the midpoint.
Equity Research is available at no cost to Registered users of Channelchek. Not a Member? Click ‘Join’ to join the Channelchek Community. There is no cost to register, and we never collect credit card information.
This Company Sponsored Research is provided by Noble Capital Markets, Inc., a FINRA and S.E.C. registered broker-dealer (B/D).
*Analyst certification and important disclosures included in the full report. NOTE: investment decisions should not be based upon the content of this research summary. Proper due diligence is required before making any investment decision.
Robert LeBoyer, Senior Vice President, Equity Research Analyst, Biotechnology, Noble Capital Markets, Inc.
Refer to the full report for the price target, fundamental analysis, and rating.
2Q Financial Results Were Within Expectations. Eledon reported a 2Q26 loss of $31.6 million or $(0.27) per share. The Operating Loss of $22.9 million was close to our estimate of $22.4 million, before a charge of $9.6 million for Changes In The Fair Value of Warrant Liabilities. The Net Loss excluding the non-cash charge would have been $22 million. Cash balance on June 30, 2026 was $ $88.8 million.
Preparations For A Global Phase 3 Trial In Kidney Transplantation Continue. During 2Q26, an End-Of-Phase 2 meeting was held with the FDA to discuss the Phase 3 trial design and requirements for a BLA submission. The Phase 3 trial has been designed to test tegoprubart against tacrolimus to prevent kidney transplant rejection. It is scheduled to begin in late 2026 with a target enrollment of about 600 patients. The Primary Endpoint will be non-inferiority based on a composite of BPAR (biopsy-proven acute rejection), graft loss, and death.
Equity Research is available at no cost to Registered users of Channelchek. Not a Member? Click ‘Join’ to join the Channelchek Community. There is no cost to register, and we never collect credit card information.
This Company Sponsored Research is provided by Noble Capital Markets, Inc., a FINRA and S.E.C. registered broker-dealer (B/D).
*Analyst certification and important disclosures included in the full report. NOTE: investment decisions should not be based upon the content of this research summary. Proper due diligence is required before making any investment decision.
Reddit (NYSE: RDDT) will join the S&P 500 before markets open on Tuesday, August 18, S&P Dow Jones Indices announced Thursday, sending shares as much as 15% higher in after-hours and premarket trading. The stock will replace AvalonBay Communities, which is exiting the index following its acquisition by fellow S&P 500 member Equity Residential, a deal shareholders overwhelmingly approved this week. The combined entity will drop both legacy names and begin trading as Vivmark Residential once the transaction closes.
This is an off-cycle inclusion, triggered by the vacancy AvalonBay’s departure created rather than a scheduled quarterly rebalance, which is exactly the same mechanism we detailed in our earlier coverage of the Russell reconstitution process, index committees filling open seats based on eligibility rules rather than a fixed calendar.
The Detail That Actually Unlocked This Move
The most instructive part of this story is not the price pop itself, it is what made Reddit eligible in the first place. S&P’s index committee requires candidates to demonstrate sustained profitability, and Reddit did not post a full fiscal year of positive GAAP net income until 2025, when the company reported roughly $530 million in net income on $2.2 billion in revenue. That single financial milestone is what flipped Reddit from ineligible to eligible, ending months of speculation about when the company might finally clear the bar. Reddit becomes only the second pureplay social media company in the S&P 500, alongside Meta, with larger, longer-established platforms like Pinterest and Snap still falling short on scale.
Context Matters Here: This Is a Bounce, Not Just a Breakout
It is worth noting Reddit shares had fallen more than 22% over the prior month and were down roughly 31% year to date heading into this announcement, following concerns about Google search traffic dependency and AI-driven changes to how users discover content. Part of Thursday’s surge likely reflects short covering as much as new buying interest, with roughly 13% of Reddit’s available float sold short heading into the news, representing several days worth of potential buy-side pressure if those positions unwind.
Why the “Index Effect” Has Weakened Over Time
Academic research has long documented what is known as the index effect, a historical tendency for stocks to see a price bump between an inclusion announcement and the effective date, as funds tracking the S&P 500 are forced to buy shares regardless of valuation. That effect has thinned considerably over the past decade, largely because active managers now anticipate these moves and front-run them, meaning much of the price reaction happens on the announcement itself rather than during the actual passive buying window. History also offers a caution here. When Workday’s S&P 500 inclusion was announced in December 2024, shares initially jumped roughly 10%, only to fall 19% from that peak in the weeks after actually joining the index, a reminder that an inclusion pop and sustained outperformance are not the same thing.
For investors following the small cap space, this story is a useful real-time illustration of a dynamic that applies at every level of the market, not just the S&P 500. Whether it is a company graduating into the Russell 1000 from the Russell 2000 or, as in this case, into the S&P 500 itself, forced passive buying can create a genuine, mechanical demand shock independent of a company’s underlying fundamentals. Understanding that distinction, between a stock moving because trillions in indexed capital must now own it and a stock moving because its business has fundamentally improved, is one of the more useful lenses an investor can apply across market cap ranges.
Mobix Labs (Nasdaq: MOBX), a semiconductor and defense electronics company, announced Wednesday it has signed a definitive all-stock agreement to acquire Special Project Delivery, a pre-revenue infrastructure development platform pursuing rare earth elements, critical minerals, energy storage, and Western US water resources. The deal is structured with consideration capped at 4.8 million Mobix shares, with closing targeted before the end of 2026, subject to shareholder approval.
Shares of Mobix climbed 5% in premarket trading following the announcement, recovering from a nearly 6% decline the prior session.
This is not a typical semiconductor company acquisition. Mobix currently supplies advanced wireless components and RF technology used in aerospace, defense, and homeland security systems, work that includes existing relationships with Boeing on 737 aircraft programs. The SPD deal adds an entirely different layer to that business: upstream control over the raw materials, energy infrastructure, and water resources that defense manufacturing and critical mineral processing actually depend on.
Mobix Chairman Jim Peterson framed the deal as central to the company’s broader National Security Matters initiative, describing control of strategic domestic mineral rights as fundamental to America’s long-term industrial strength. That initiative, launched earlier this year, has already included a separate acquisition of drone maker Vision Aerial, positioning Mobix as a company trying to assemble components, autonomous systems, and now raw materials under a single national security platform, rather than remaining a narrow RF and semiconductor supplier.
Investors need to understand what this transaction is and is not. SPD is explicitly described as pre-revenue, meaning it currently generates no sales. The company’s positioning across rare earth elements, critical minerals, energy storage, and water infrastructure remains largely conceptual at this stage, with no specific mineral deposits, resource grades, separation technology, capital expenditure estimates, permitting status, or customer commitments disclosed publicly as part of this announcement. Mobix itself is a microcap company that has carried substantial losses and limited liquidity in its own recent financial history.
This combination of a loss-making microcap acquirer and a pre-revenue target operating in a capital-intensive, multi-year development category, rare earth and critical mineral processing, is a materially higher-risk profile than a typical revenue-generating acquisition. The strategic thesis, positioning around America’s push to reduce dependence on foreign rare earth supply chains, is genuinely timely and aligned with a broader theme playing out across defense and industrial policy in 2026. But thematic alignment and executable, funded infrastructure are two very different things at this stage of the deal.
Why the Theme Itself Is Worth Watching Regardless
Independent of this specific transaction’s execution risk, the broader push toward domestic rare earth and critical mineral supply chains remains one of the more significant structural themes in the small cap space this year. Government-backed investment in quantum computing, semiconductor manufacturing, and critical minerals has accelerated sharply, and smaller companies positioning early in that supply chain, whether through actual production assets or, as in this case, an earlier-stage development platform, are drawing real investor attention as a result.
For investors tracking this space, the Mobix-SPD deal is a useful case study in distinguishing between a company aligning itself with a compelling macro theme and a company that has actually built or acquired producing assets within that theme. The rare earth and critical minerals buildout in the United States is real and accelerating. Whether any single microcap deal successfully executes on that opportunity is a separate question entirely, one that depends on capital access, permitting, technical validation, and years of infrastructure development still ahead.
Late-breaking Phase 2 CAD-1005 data presented at ISTH support a late-stage portfolio organized around preoperative safety, orphan regulatory acceleration, and postoperative shielding
PONTE VEDRA, Fla., Aug. 13, 2026 (GLOBE NEWSWIRE) — Cadrenal Therapeutics, Inc. (Nasdaq: CVKD), a late-stage biopharmaceutical company advancing specialized therapies for critical care cardiology and orphan cardiovascular conditions, today reported financial results for the second quarter ended June 30, 2026, and provided a corporate update on the launch of a structured strategic partnering process following significant clinical, regulatory, and portfolio progress across its Cardiac Acute Critical Care Franchise.
“The second quarter and subsequent weeks marked an important milestone for Cadrenal,” said Quang X. Pham, Chairman and Chief Executive Officer of Cadrenal Therapeutics. “Our objective is to convert clinical and regulatory progress into strategic value while remaining capital disciplined. We are also pursuing multiple nondilutive grants to advance our programs. With CAD-1005, frunexian, and tecarfarin addressing complementary acute, critical care, and orphan cardiovascular opportunities, and CAD-2000 extending the 12-LOX platform to treat chronic conditions, we believe Cadrenal offers a differentiated pipeline that addresses critical unmet needs for high-risk patients.”
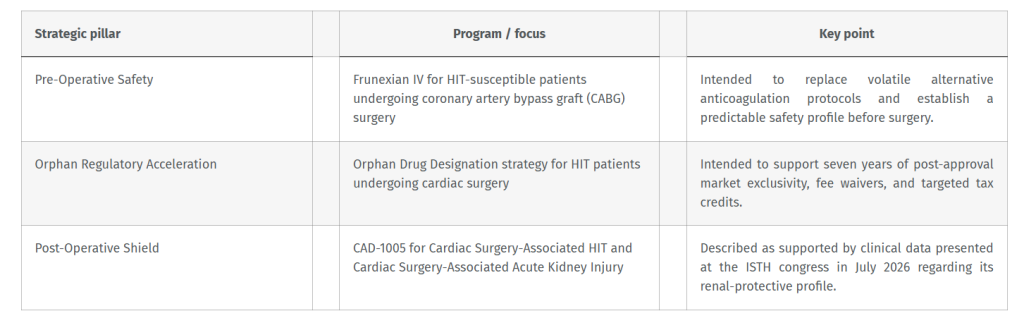
“Having achieved regulatory guidance on the Phase 3 path for CAD-1005, we delivered a late-breaking presentation to the global thrombosis community on Phase 2 data for CAD-1005, which demonstrated an absolute reduction of more than 25% in thrombotic events. Our portfolio, now organized into a Cardiac Acute Critical Care Franchise spanning pre-operative safety, orphan regulatory acceleration, and post-operative shielding, is structured to demonstrate to prospective partners how our assets can address multiple high-value needs across the cardiac surgery continuum.”
The strategic alignment of the Cardiac Acute Critical Care (CACC) Franchise organizes Cadrenal’s portfolio into three commercial pillars.
Recent Highlights
Presented late-breaking Phase 2 data on CAD-1005 at the International Society of Thrombosis and Hemostasis (ISTH) 2026 Congress in Paris. The randomized, blinded, placebo-controlled study demonstrated an absolute reduction of more than 25% in thrombotic events when CAD-1005 was added to standard anticoagulant therapy, with a favorable safety profile and renal-protective baseline.
Launched a structured partnering process to explore development, licensing, and commercialization transactions for CAD-1005, frunexian, and tecarfarin. Cadrenal is pursuing a capital-efficient model focused on strategic out-licensing, portfolio monetization, and commercial co-development rather than independently funding large late-stage clinical trials.
Solidified a multi-indication strategy for CAD-1005 in heparin-induced thrombocytopenia (HIT) and Cardiac Surgery-Associated Acute Kidney Injury (CSA-AKI). The Company believes that the shared cardiac intensive care infrastructure, intravenous administration, and complementary thrombotic and inflammatory mechanisms may create a differentiated critical care asset package for prospective partners.
Submitted a request to the U.S. Food and Drug Administration on July 8, 2026, for Rare Pediatric Disease Designation for tecarfarin for the prevention of life-threatening blood clots inside coronary artery aneurysms in children with Kawasaki Disease.
Signed an agreement with a global firm that has collectively secured over $500 million in non-dilutive funding for life science companies.
Continued advancing CAD-2000, a highly selective, orally bioavailable preclinical 12-lipoxygenase (12-LOX) inhibitor designed for chronic cardiorenal inflammatory and thrombotic indications, as a potential follow-on companion to the Company’s intravenous acute care platform.
Signed a private placement that generated approximately $3.0 million in gross proceeds, with up to approximately $5.8 million in additional gross proceeds if the associated warrants are exercised in full for cash. There can be no assurance that any warrants will be exercised.
Second Quarter 2026 Financial Highlights
Research and development expenses for the quarter ended June 30, 2026, were $0.7 million compared to $1.1 million for the same period in 2025. General and administrative expenses were $2.6 million compared to $2.7 million for the same period in 2025. Total operating expenses were $3.3 million compared to $3.7 million for the same period in 2025. Cadrenal reported a net loss of $3.3 million for the quarter ended June 30, 2026, compared to $3.7 million for the same period in 2025.
As of early August 2026, Cadrenal had approximately $4.2 million in cash and cash equivalents. Based on its current operating plan, the Company believes these resources are expected to fund operations through the first quarter of 2027. The Company’s existing cash resources are not sufficient to advance its product candidates to clinical trial readiness or to commence and complete any clinical trials. Cadrenal does not plan to commence a clinical trial unless funding sufficient to complete that trial is in place, which may include capital raised through strategic partnerships, out-licensing agreements, non-dilutive grants, equity or debt financing, or a combination of these sources.
About Cadrenal Therapeutics, Inc.
Cadrenal Therapeutics, Inc. is a late-stage biopharmaceutical company advancing specialized therapies for critical care cardiology and orphan cardiovascular conditions. The Company’s pipeline includes CAD-1005, tecarfarin, and frunexian. CAD-1005 is a novel investigational therapeutic in development for the treatment of heparin-induced thrombocytopenia (HIT) and Cardiac Surgery-Associated Acute Kidney Injury (CSA-AKI). CAD-1005 is designed to selectively inhibit 12-lipoxygenase (12-LOX), an enzyme central to platelet immune activation and thrombo-inflammatory signaling in HIT. CAD-1005 is intended to be used alongside existing standards of care and is being developed to address the underlying biological mechanisms that drive disease progression. CAD-1005 has an Orphan Drug Designation (“ODD”) from the U.S. Food and Drug Administration (“FDA”) for prophylaxis of thrombosis in patients with HIT, FDA Fast Track designation for the treatment and prevention of HIT, and an orphan designation from the European Medicines Agency for the treatment of platelet-activating factor 4 disorders. Second-generation 12-LOX oral therapeutics (CAD-2000) are also in development for chronic indications.
The Company’s broader pipeline includes tecarfarin, a late-stage oral vitamin K antagonist designed to prevent heart attacks, strokes, and deaths from blood clots in patients requiring chronic anticoagulation, including those with end-stage kidney disease and atrial fibrillation, those with left ventricular assist devices, and potentially those with Kawasaki disease (KD), an acute, self-limited, febrile illness that primarily affects children under 5 years old and is the leading cause of acquired heart disease in developed countries. The Company recently submitted a request for Rare Pediatric Disease Designation (RPDD) to the FDA for tecarfarin for “Prevention of the Formation of Life-Threatening Blood Clots Inside Coronary Artery Aneurysms in Children with Kawasaki Disease”. Tecarfarin has also received Orphan Drug and Fast Track designations from the FDA.
Any statements in this press release about future expectations, plans, and prospects, as well as any other statements regarding matters that are not historical facts, may constitute “forward-looking statements.” The words “anticipate,” “believe,” “continue,” “could,” “estimate,” “expect,” “intend,” “may,” “plan,” “potentially,” “predict,” “project,” “should,” “target,” “will,” “would” and similar expressions are intended to identify forward-looking statements, although not all forward-looking statements contain these identifying words. These statements include, without limitation, statements regarding the Company converting clinical and regulatory progress into strategic value while remaining capital disciplined; pursuing multiple nondilutive grants to advance the Company’s programs; Cadrenal offering a differentiated pipeline that addresses critical unmet needs for high-risk patients; the CACC Franchise demonstrating to prospective partners how the Company’s assets can address multiple high-value needs across the cardiac surgery continuum; frunexian IV replacing volatile alternative anticoagulation protocols for HIT-susceptible patients undergoing CABG surgery and establishing a predictable safety profile; ODD for HIT supporting seven years of post-approval market exclusivity, fee waivers and targeted tax credits; CAD-1005 serving as a post-operative shield for Cardiac Surgery-Associated HIT and CSA-AKI; the Company’s ability to enter into development, licensing, and commercialization transactions for CAD-1005, frunexian, and tecarfarin; the shared cardiac intensive care infrastructure, intravenous administration, and complementary thrombotic and inflammatory mechanisms creating a differentiated critical care asset package for prospective partners; the FDA’s ultimate decision regarding the Company’s request for RPDD for tecarfarin for the prevention of life-threatening blood clots inside coronary artery aneurysms in children with Kawasaki Disease; CAD-2000 potentially being a follow-on companion to the Company’s intravenous acute care platform; the potential exercise of the warrants issued in the Company’s private placement resulting in gross proceeds of up to $5.8 million; the Company’s belief that its resources will fund operations through the first quarter of 2027; the Company securing funding sufficient to complete a trial, which may include capital raised through strategic partnerships, out-licensing agreements, non-dilutive grants, equity or debt financing, or a combination of these sources; and tecarfarin, a late-stage oral vitamin K antagonist designed to prevent heart attacks, strokes, and deaths from blood clots in patients requiring chronic anticoagulation, potentially treating patients with Kawasaki disease. Actual results may differ materially from those indicated by such forward-looking statements as a result of various important factors, including the Company’s ability to advance its programs to clinical trial readiness; the Company’s ability to enter into development, licensing, and commercialization transactions for CAD-1005, frunexian, and tecarfarin; the Company’s ability to secure nondilutive grants to advance its programs; and the other risk factors described in the Company’s Annual Report on Form 10-K for the year ended December 31, 2025, and the Company’s subsequent filings with the Securities and Exchange Commission, including subsequent periodic reports on Quarterly Reports on Form 10-Q and Current Reports on Form 8-K. Any forward-looking statements contained in this press release speak only as of the date hereof and, except as required by federal securities laws, the Company specifically disclaims any obligation to update any forward-looking statement, whether as a result of new information, future events, or otherwise.
For more information, please contact:
Lytham Partners, LLC Robert Blum, Managing Partner 602-889-9700 [email protected]
Net loss on a GAAP basis was $2.5 million for the current quarter compared with $4.0 million net loss for the prior year quarter.
EBITDA for the current quarter was negative $0.48 million compared with negative$0.30 million EBITDA for the prior year quarter which is a 40% improvement when adjusted for a non-recurring expense reduction from an Employee Tax Credit received in Q2 last year and compared with negative $0.70 for the first quarter, a 32% improvement over Q1, 2026
NEW YORK, Aug. 13, 2026 (GLOBE NEWSWIRE) — Xcel Brands, Inc. (NASDAQ: XELB) (“Xcel” or the “Company”), a media and consumer products company with significant expertise in building influencer lead brands, live-steam shopping and social commerce, today announced its financial results for the quarter ended June 30, 2026.
Robert W. D’Loren, Chairman and Chief Executive Officer of Xcel commented, “Our second quarter earnings on an Adjusted EBITDA basis were the best since June 2024, this was driven by the product launch of two of our new influencer led brands and additional reductions in operating expenses. I am very excited by the enormous potential of these brands going into the future. The recent changes in the search box since Google went to AI Mode, will make video content created by influencers that are authorities in their category part of the cited AI answer. I am excited to be managing a portfolio of brands that generate awareness through a combined existing audience of over 46 million people.”
Second Quarter 2026 Financial Results
Total revenue for the second quarter of 2026 was $1.1 million, representing a decrease of approximately $0.2 million (-14%) from the prior year quarter. This year-over-year decrease was primarily attributable to divestiture of the Judith Ripka brand.
Direct operating costs and expenses were essentially flat from the prior year quarter of approximately $1.9 million. It should be noted that the prior year quarter included an expense reduction of approximately $0.50 million from an employee retention credit refund. Excluding this prior year, non-recurring expense reduction, direct operating expenses decreased by approximately $0.50 million from the prior year quarter.
Net loss attributable to Xcel Brands stockholders for the quarter was approximately $2.5 million, or $(0.40) per share, compared with net loss of $4.0 million, or $(1.66) per share, for the prior year quarter.
After adjusting certain cash and non-cash items, current quarter results on a non-GAAP basis were a net loss of approximately $1.3 million, or $(0.21) per share and net loss of approximately $0.9 million, or $(0.37) per share, for the prior year quarter. Adjusted EBITDA was negative $0.48 million for the current quarter, compared with Adjusted EBITDA of negative $0.30 million for the prior year quarter. The second quarter EBITDA, when excluding the non-recurring expense reduction referenced above, Adjusted EBITDA improved by approximately $0.32 million.
Six Month 2026 Financial Results
Total revenue for the current six-month period was $2.3 million, representing a decrease of approximately $0.4 million (-14%) from the prior year period. This year-over-year decrease was primarily attributable to divestiture of the Judith Ripka brand.
Direct operating costs and expenses decreased approximately $0.2 million from the prior year six months to $4.0 million in the current six months. When factoring in the prior year period, non-recurring expense reduction, the decrease in direct operating expenses would have been approximately $0.7 million. Currently, the Company has reduced its direct operating expenses to an expected run rate of less than $8 million per annum.
Net loss attributable to Xcel Brands stockholders for the current six months was approximately $5.0 million, or $(0.82) per share, compared with net loss of $6.8 million, or $(2.84) per share, for the prior year period.
After adjusting certain cash and non-cash items, the current six month period results on a non-GAAP basis were a net loss of approximately $2.7 million, or $(0.44) per share and net loss of approximately $2.3 million, or $(0.95) per share, for the prior year period. Adjusted EBITDA was negative $1.2 million for the current six months, compared with Adjusted EBITDA of negative $1.0 million for the prior year period. The current six month EBITDA, when excluding the non-recurring expense reduction referenced above, Adjusted EBITDA improved by approximately $0.3 million.
Balance Sheet
The Company’s balance sheet on June 30, 2026, reflected stockholders’ equity of approximately $12 million, unrestricted cash and cash equivalents of approximately $0.4 million. The Company’s balance sheet on June 30, 2026, also reflected approximately $12 million of long-term debt.
The Company’s working capital on June 30, 2026 (exclusive of the current portion of lease obligations and deferred revenue was negative $1.3 million. On January 21, 2026, the Company entered into a common stock purchase agreement, pursuant to which the buyer has committed to purchase up to $15.0 million of the Company’s common stock. Under the terms and conditions of this agreement, the Company has the right, but not the obligation, to sell up to $15.0 million of the Company’s common stock. The actual amount and timing of any sales of Common Stock will be determined by the Company at its discretion.
Conference Call and Webcast
The Company will host a conference call with members of the executive management team to discuss these results with additional comments and details at 9:00 a.m. Eastern Time on August 14, 2026. A webcast of the conference call will be available live on the Investor Relations section of Xcel’s website at www.xcelbrands.com. Interested parties unable to access the conference call via the webcast may dial 800-715-9871 or 646-307-1963 and use the conference ID 4300396. A replay of the webcast will be available on Xcel’s website.
About Xcel Brands
Xcel Brands, Inc. (NASDAQ: XELB) is a media and consumer products company engaged in the design, licensing, marketing, live streaming, and social commerce sales of branded apparel, footwear, accessories, fine jewelry, home goods and other consumer products, and the acquisition of dynamic consumer lifestyle brands. Xcel was founded in 2011 with a vision to reimagine shopping, entertainment, and social media as social commerce. Xcel owns the Halston and C. Wonder brands, as well as the co-branded collaboration brands Tower Hill by Christie Brinkley, Trust. Respect. Love by Cesar Millan, GemmaMade by Gemma Stafford and Off/Duty by Coco Rocha brand and holds noncontrolling interests or long-term license agreement in Mesa Mia by Jenny Martinez. Xcel also owns and manages the Longaberger by Shannon Doherty brand through its controlling interest in Longaberger Licensing, LLC. Xcel is pioneering a modern consumer products sales strategy which includes the promotion and sale of products under its brands through interactive television, digital live-stream shopping, social commerce, brick-and-mortar retailers, and e-commerce channels to be everywhere its customer’s shop. The company’s previously owned and current brands have generated more than $5 billion in retail sales via livestreaming in interactive television and digital channels alone and has over 20,000 hours of content production time in live-stream and social commerce. The brand portfolio reaches more than 46 million social media followers with broadcast reaching 200 million households. Headquartered in New York City, Xcel Brands is led by an executive team with significant live streaming, production, merchandising, design, marketing, retailing, and licensing experience, and a proven track record of success in elevating branded consumer products companies. For more information, visit www.xcelbrands.com.
Forward Looking Statements
This press release contains forward-looking statements. All statements other than statements of historical fact contained in this press release, including statements regarding future events, our future financial performance, business strategy and plans and objectives of management for future operations, are forward-looking statements. We have attempted to identify forward-looking statements by terminology including “anticipates,” “believes,” “can,” “continue,” “ongoing,” “could,” “estimates,” “expects,” “intends,” “may,” “appears,” “suggests,” “future,” “likely,” “goal,” “plans,” “potential,” “projects,” “predicts,” “seeks,” “should,” “would,” “guidance,” “confident” or “will” or the negative of these terms or other comparable terminology. These forward-looking statements include, but are not limited to, statements regarding our anticipated revenue, expenses, profitability, strategic plans and capital needs. These statements are based on information available to us on the date hereof and our current expectations, estimates and projections and are not guarantees of future performance. Forward-looking statements involve known and unknown risks, uncertainties, assumptions and other factors, including, without limitation, the risks discussed in the “Risk Factors” section and elsewhere in the Company’s Annual Report on form 10-K for the year ended December 31, 2024 and its other filings with the SEC, which may cause our or our industry’s actual results, levels of activity, performance or achievements to differ materially from those expressed or implied by these forward-looking statements. Moreover, we operate in a very competitive and rapidly changing environment. New risks emerge from time to time, and it is not possible for us to predict all risk factors, nor can we address the impact of all factors on our business or the extent to which any factor, or combination of factors, may cause our actual results to differ materially from those contained in any forward-looking statements. You should not place undue reliance on any forward-looking statements. Except as expressly required by the federal securities laws, we undertake no obligation to update any forward-looking statements, whether as a result of new information, future events, changed circumstances or any other reason.
For further information please contact: Seth Burroughs Xcel Brands [email protected]
Non-GAAP net income and non-GAAP diluted EPS are non-GAAP unaudited terms. We define non-GAAP net income as net income (loss) attributable to Xcel Brands, Inc. stockholders, exclusive of amortization of trademarks, income (loss) from equity method investments, stock-based compensation and cost of licensee warrants, asset impairment charges, loss on extinguishment of debt and income taxes. Non-GAAP net income (loss) and non-GAAP diluted EPS measures do not include the tax effect of the aforementioned adjusting items, due to the nature of these items and the Company’s tax strategy.
Adjusted EBITDA is a non-GAAP unaudited measure, which we define as net income (loss) attributable to Xcel Brands, Inc. stockholders before interest and finance expenses, accretion of lease liability for exited leases, income taxes, other state and local franchise taxes, depreciation and amortization, income (loss) from equity method investments, asset impairment charges, stock-based compensation and cost of licensee warrants, and costs associated with restructuring of operations. Costs associated with restructuring of operations include operating losses generated by certain of our businesses that have been restructured or discontinued (i.e., wholesale apparel and fine jewelry), as well as non-cash charges associated with the restructuring of certain contractual arrangements.
Management uses non-GAAP net income, non-GAAP diluted EPS, and Adjusted EBITDA as measures of operating performance to assist in comparing performance from period to period on a consistent basis and to identify business trends relating to our results of operations. Management believes non-GAAP net income, non-GAAP diluted EPS, and Adjusted EBITDA are also useful because these measures adjust for certain costs and other events that management believes are not representative of our core business operating results, and thus these non-GAAP measures provide supplemental information to assist investors in evaluating our financial results.
Non-GAAP net income, non-GAAP diluted EPS, and Adjusted EBITDA should not be considered in isolation or as alternatives to net income, earnings per share, or any other measure of financial performance calculated and presented in accordance with GAAP. Given that non-GAAP net income, non-GAAP diluted EPS, and Adjusted EBITDA are financial measures not deemed to be in accordance with GAAP and are susceptible to varying calculations, our non-GAAP net income, non-GAAP diluted EPS, and Adjusted EBITDA may not be comparable to similarly titled measures of other companies, including companies in our industry, because other companies may calculate these measures in a different manner than we do. In evaluating non-GAAP net income, non-GAAP diluted EPS, and Adjusted EBITDA, you should be aware that in the future we may or may not incur expenses similar to some of the adjustments in this document. Our presentation of non-GAAP net income, non-GAAP diluted EPS, and Adjusted EBITDA does not imply that our future results will be unaffected by these expenses or any unusual or non-recurring items. When evaluating our performance, you should consider non-GAAP net income, non-GAAP diluted EPS, and Adjusted EBITDA alongside other financial performance measures, including our net income and other GAAP results, and not rely on any single financial measure.
Successful End-of-Phase 2 meeting with FDA supports advancement of tegoprubart into a global Phase 3 kidney transplantation trial, on track to initiate in late 2026
Long-term Phase 2 BESTOW data presented at ATC 2026 demonstrated sustained higher kidney function and improved patient-reported outcomes with tegoprubart compared with tacrolimus
Updated islet cell transplantation data presented at ADA 2026 showed 100% insulin independence in all 12 patients with type 1 diabetes
Cash, cash equivalents and short-term investments of $88.8 million as of June 30, 2026
IRVINE, Calif., Aug. 13, 2026 (GLOBE NEWSWIRE) — Eledon Pharmaceuticals, Inc. (“Eledon”) (Nasdaq: ELDN) today reported its second quarter 2026 operating and financial results and provided recent business highlights.
“During the first half of the year, we made meaningful progress establishing the regulatory framework for our planned Phase 3 kidney transplantation program, which we expect to initiate later this year,” said David-Alexandre C. Gros, M.D., Chief Executive Officer of Eledon. “The continued strength of our clinical data, including sustained long-term kidney function in BESTOW and the compelling results from the UChicago Medicine islet cell transplantation study, reinforces the potential of tegoprubart to improve outcomes across multiple transplant settings. We look forward to advancing our Phase 3 program and expanding the clinical evidence for tegoprubart across additional transplant indications.”
Second Quarter 2026 Business Highlights
Kidney Transplantation
Completed a successful End-of-Phase 2 meeting with the U.S. Food and Drug Administration, establishing the regulatory framework for the planned Phase 3 trial of tegoprubart in kidney transplantation. The global trial is on track to initiate in late 2026 and enroll approximately 600 patients, with a primary endpoint of non-inferiority versus tacrolimus at 52 weeks based on a composite of biopsy-proven acute rejection (BPAR), graft loss and death.
Presented new long-term data from the Phase 2 BESTOW clinical program at the American Transplant Congress (ATC) in June 2026, demonstrating sustained higher kidney function in kidney transplant patients treated with tegoprubart compared with tacrolimus, the current standard-of-care immunosuppression therapy. At 18 months, the eGFR curves showed a statistically significant separation (p<0.05), with mean eGFR approximately 12 mL/min/1.73 m² higher for tegoprubart compared with tacrolimus (approximately 74 vs. 61 mL/min/1.73 m²). No BPAR events were observed in tegoprubart-treated patients after the first six months post-transplant, compared with seven BPAR events (9.4% of tacrolimus-treated patients) reported in the tacrolimus arm. Patient-reported outcomes at 52 weeks favored tegoprubart, with statistically significant improvements versus tacrolimus on two validated measures of symptom burden. Long-term data from the BESTOW extension trial also demonstrated favorable long-term safety and tolerability.
Treated the first two patients in an investigator-initiated study of kidney transplant tolerance induction at Massachusetts General Hospital.
Entered into a strategic partnership with Natera, Inc., a global leader in cell-free DNA testing and precision medicine, to incorporate Natera’s Prospera kidney transplant assessment test as the exclusive donor-derived cell-free DNA (dd-cfDNA) monitoring assay in Eledon’s planned Phase 3 kidney transplantation trial.
Islet Cell Transplantation
Presented updated data from the University of Chicago Medicine investigator-initiated islet cell transplantation study at ADA 2026. All 12 patients with T1D achieved insulin independence and HbA1c below 6.5%, with a mean most recent HbA1c of approximately 5.4% and no severe hypoglycemic episodes post-transplant. Tegoprubart demonstrated stable islet graft function through a maximum follow-up of 22 months and was generally well tolerated, with no evidence of nephrotoxicity, hypertension or neurotoxicity.
Anticipated Upcoming Milestones
The Company anticipates the following milestones in 2026 and over the next 12 months:
Initiate Phase 3 clinical trial evaluating tegoprubart in kidney transplantation in late 2026.
Support the initiation of an investigator-led study evaluating tegoprubart for the prevention of organ rejection in patients with renal dysfunction receiving an islet cell transplant in 2026.
Initiate company-sponsored, registration path study evaluating tegoprubart in islet cell transplantation.
Support the initiation of an investigator-led study evaluating tegoprubart for the prevention of organ rejection in patients receiving a de novo liver transplant.
Receive FDA regulatory guidance on the path to market for tegoprubart in xenotransplantation.
Second Quarter 2026 Financial Results
Cash, cash equivalents and short-term investments totaled $88.8 million as of June 30, 2026, compared to $133.3 million as of December 31, 2025. The Company expects current cash, cash equivalents and short-term investments to fund operations into the second quarter of 2027.
Research and development (R&D) expenses for the second quarter of 2026 were $18.2 million, including $2.1 million of non-cash stock-based compensation expense, compared to $20.3 million for the comparable period in 2025, including $1.1 million of non-cash stock-based compensation expense.
General and administrative (G&A) expenses for the second quarter of 2026 were $4.6 million, including $1.1 million of non-cash stock-based compensation expense, compared to $4.5 million for the comparable period in 2025, including $1.6 million of non-cash stock-based compensation expense.
Net loss for the second quarter of 2026 was $31.6 million, or $0.27 per basic common share, compared to a net loss of $11.2 million, or $0.13 per basic common share, for the comparable period in 2025. Net loss in the second quarter of 2026 included a non-cash loss of $9.6 million from changes in the fair value of warrant liabilities, while the 2025 net loss included a non-cash gain of $12.3 million from such changes. Excluding the non-cash items related to changes in the fair value of warrant liabilities, Eledon would have recorded a net loss of $22.0 million for the three months ended June 30, 2026, and $23.5 million for the three months ended June 30, 2025.
About Eledon Pharmaceuticals and tegoprubart
Eledon Pharmaceuticals, Inc. is a clinical stage biotechnology company that is developing immune-modulating therapies for the management and treatment of life-threatening conditions. The Company’s lead investigational product is tegoprubart, an anti-CD40L antibody with high affinity for the CD40 Ligand, a well-validated biological target that has broad therapeutic potential. The central role of CD40L signaling in both adaptive and innate immune cell activation and function positions it as an attractive target for non-lymphocyte depleting, immunomodulatory therapeutic intervention. The Company is building upon a deep historical knowledge of anti-CD40L biology to conduct preclinical and clinical studies in kidney allograft transplantation, xenotransplantation, islet cell transplantation, liver transplantation and amyotrophic lateral sclerosis (ALS). Eledon is headquartered in Irvine, California. For more information, please visit the Company’s website at www.eledon.com.
Follow Eledon Pharmaceuticals on social media: LinkedIn; X
Forward-Looking Statements
This press release contains forward-looking statements that involve substantial risks and uncertainties. Any statements about the company’s future expectations, plans and prospects, including statements about planned clinical trials, the development of product candidates, expected timing for initiation of future clinical trials, expected timing for receipt of data from clinical trials, the company’s capital resources and ability to finance planned clinical trials, as well as other statements containing the words “believes,” “anticipates,” “plans,” “expects,” “estimates,” “intends,” “predicts,” “projects,” “targets,” “looks forward,” “could,” “may,” and similar expressions, constitute forward-looking statements within the meaning of the Private Securities Litigation Reform Act of 1995. Forward-looking statements are inherently uncertain and are subject to numerous risks and uncertainties, including: our short operating history and shifts in our business strategy; our operating losses since inception; our need for additional funding to develop our lead drug candidate and our ability to secure additional funding on acceptable terms or at all; the impact of issuances of our common stock, including the possibility of dilution or a decline in our stock price; our ability to successfully develop our product candidates; unfavorable global economic and financial market conditions; the regulatory environment of our business and our ability to obtain required regulatory approvals; results of non-clinical studies and clinical trials, and risks that non-clinical studies or early clinical trials may not be predictive of results of later-stage clinical trials; delays or difficulties in enrollment of patients in clinical trials; our ability to attract and retain our executives and key employees; legislation of the pharmaceutical and healthcare industries; cybersecurity and data privacy risks; the ability of our products to achieve marketing approval; competition in our industry; our ability to obtain insurance coverage; our dependence on contract research organizations; our ability to protect our intellectual property; public health crises; our ability to maintain proper and effective internal control over financial reporting and other risks disclosed in our Annual Report on Form 10-K for the year ended December 31, 2025, filed with the Securities and Exchange Commission on March 19, 2026. Actual results may differ materially from those indicated by such forward-looking statements as a result of various factors. These risks and uncertainties, as well as other risks and uncertainties that could cause the company’s actual results to differ materially from the forward-looking statements contained herein, are discussed in our Annual Report on Form 10-K, and other filings with the U.S. Securities and Exchange Commission, which can be found at www.sec.gov. Any forward-looking statements contained in this press release speak only as of the date hereof and not as of any future date, and the company expressly disclaims any intent to update any forward-looking statements, whether as a result of new information, future events or otherwise.
Company Reports Record Quarterly Revenues of $54.1 million, a 16.5% Year-Over-Year Increase
Broadcast Revenues Increase to $45.8 million, a 20.5% Increase Year-Over-Year
Company Reports Net Income of $2.9 million and Adjusted EBITDA of $5.7 million, Its First Profitable Quarter as a Public Company
BOCA RATON, FL / ACCESS Newswire / August 13, 2026 / Newsmax Inc. (NYSE:NMAX) (“Newsmax” or the “Company”) today announced its financial results for the second quarter ended June 30, 2026.
Second Quarter 2026 Business and Operational Highlights
Delivered second quarter audience reach of 26.9 million total viewers, up 4% year-over-year and the highest second quarter total reach in the past four years, including 11.3 million Adults 35-64, reinforcing Newsmax’s position as the fourth highest-rated cable news channel and #2 in cable news audience engagement among Adults 35-64.
Continued to strengthen the Company’s multi-platform audience ecosystem, with total social media followers rising to 26.2 million as of June 30, 2026.
Entered into the Company’s first major AI content partnership, a multi-year partnership with Meta that puts Newsmax content across Meta’s apps and devices, reflecting a broader strategy of licensing content to leading AI technology companies.
Achieved exceptional growth in our international licensing business, with multiple brand content licenses signed this year and related licensing revenues expected to increase 344% year-over-year to approximately $16 million in 2026, including the Q2 launch of the Newsmax Poland channel with longtime partner Telekom Serbia, all strengthening the Newsmax brand, which reaches more than 100 countries worldwide.
Management Commentary
“This was a milestone quarter for Newsmax. We delivered record revenues and our first quarterly net income since becoming a public company, led by strong growth in affiliate fees and licensing, our highest-margin revenue streams,” said Christopher Ruddy, Chief Executive Officer of Newsmax. “Halfway through the year, we continue to execute on our growth strategy. With the majority of one-time costs of becoming a public company largely behind us, the value creation opportunities of our multi-platform model are showing positive results.”
Ruddy continued, “We are still in strategic investment mode, and that will not change. We continue to invest in content and streaming, while our licensing strategy is growing rapidly, domestically with AI deals like the one we completed with Meta, and internationally with media partners licensing our brand and content. Our strategy is to maximize these relationships to license the Newsmax brand and launch local channels in foreign markets, a model that requires minimal capital from us. We are also staying at the forefront of emerging technology, and our recently announced AI partnership will help us meet viewers wherever they consume content. The market for center right news is huge with limited options and significant whitespace to grow, increase monetization and deliver sustainable, long-term growth for our shareholders.”
“Our second quarter results demonstrate the operating leverage we are building across the business, with net income of $2.9 million and Adjusted EBITDA of $5.7 million,” commented Darryle Burnham, Chief Financial Officer of Newsmax. “The improvement in our revenue mix, combined with the operating discipline we have established in our second year as a public company, allowed strong top-line growth to flow through to the bottom line. We will continue to invest in content, distribution and OTT initiatives that support long-term growth, and with a strong balance sheet, no debt and a disciplined approach to capital allocation, we are reiterating our full-year revenue guidance and remain focused on sustainable, long-term shareholder value.”
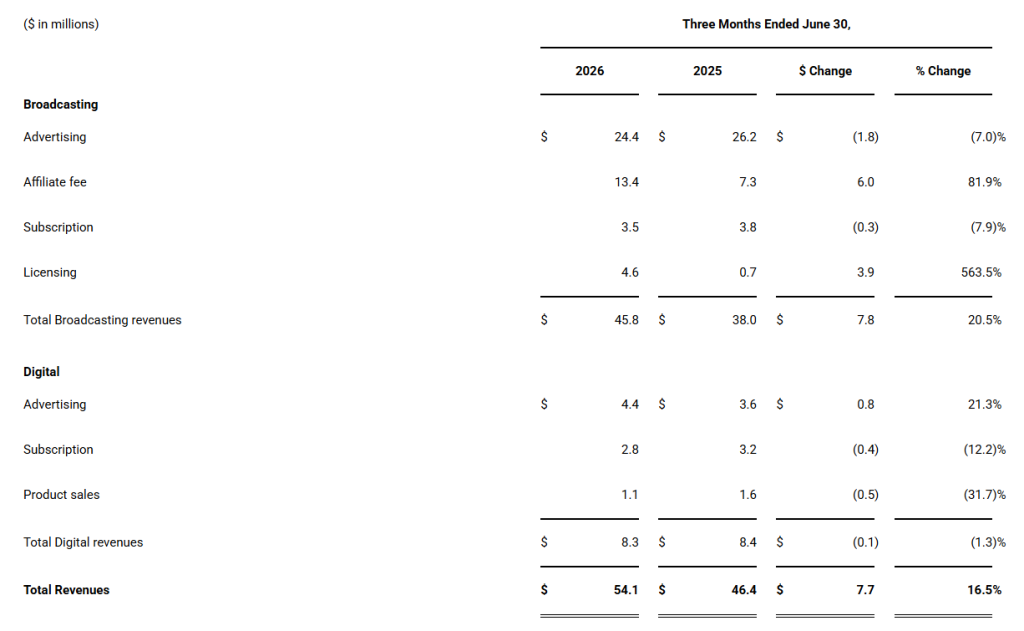
Financial Results: Revenue by Segment by Component Table (unaudited):
Second Quarter 2026 Financial Highlights:
Newsmax reported record total quarterly revenues of $54.1 million for the three-month period ended June 30, 2026, representing a 16.5% year-over-year increase and the highest quarterly revenues in the Company’s history.
Total broadcasting revenues grew 20.5% year-over year to $45.8 million for the second quarter of 2026. This was driven by an increase in affiliate fee revenue attributed to new contractual relationships and rate increases that took effect in late 2025 and 2026, as well as expanded international licensing agreements.
Newsmax reported a quarterly net income of $2.9 million, or $0.02 per share, the Company’s first quarterly net income since becoming a public company, as compared to a net loss of $(75.2) million reported in same quarter in the prior year. The improvement was primarily driven by higher total revenue, improved operating efficiency and the absence of legal settlement expenses recorded in the prior-year period.
Quarterly adjusted EBITDA was $5.7 million, the Company’s highest as a public company and an improvement of $9.5 million from $(3.8) million reported in the same quarter last year, primarily due to growth in high-margin affiliate fee and licensing revenue and lower general and administrative expenses, partially offset by continued investment in programming, production and OTT initiatives. See reconciliation of net income (loss) to adjusted EBITDA below.
The Company ended the quarter with $128.3 million in cash and short-term investments. Cash and cash equivalents were $25.9 million and short-term investments were $102.4 million.
The Company is reiterating its previously issued full-year 2026 revenue guidance of $212 million to $216 million, representing 13% year-over-year growth at the midpoint of the range.
About Newsmax
Newsmax Inc. is listed on the NYSE (NMAX) and operates, through Newsmax Broadcasting LLC, one of the nation’s leading news outlets, the Newsmax channel. The fourth highest-rated network is carried on all major pay TV providers. Newsmax’s media properties reach more than 50 million Americans regularly through Newsmax TV, the Newsmax App, its popular website Newsmax.com, and publications such as Newsmax Magazine. Through its social media accounts, Newsmax reaches over 26 million combined followers. Reuters Institute says Newsmax is one of the top U.S. news brands and Forbes has called Newsmax “a news powerhouse.”
For more information, please visit Investor Relations | Newsmax Inc.
This communication contains forward-looking statements. From time to time, we or our representatives may make forward-looking statements orally or in writing. We base these forward-looking statements on our expectations and projections about future events, which we derive from the information currently available to us. Forward-looking statements can be identified by those that are not historical in nature. The forward-looking statements discussed in this communication and other statements made from time to time by us or our representatives, may not occur, and actual events and results may differ materially and are subject to risks, uncertainties and assumptions about us. Newsmax does not guarantee future results, performance or achievements. Moreover, neither we nor any other person assumes responsibility for the accuracy or completeness of any of these forward-looking statements. Forward-looking statements should not be relied upon as predictions of future events. We are under no duty to update any of these forward-looking statements after the date of this communication to conform our prior statements to actual results or revised expectations, and we do not intend to do so. Factors that may cause actual results to differ materially from current expectations include various factors, including but not limited to changes in domestic and global general economic and macro-economic conditions and the volatility of the price of Common Stock that may result from, among other things, comments by securities analysts or other third parties, including blogs, articles, message boards and social and other media, large shareholders exiting their position in our Common Stock, any negative public perception of us, sales of shares previously registered for resale, or other uncertainties and the factors set forth in the sections entitled “Risk Factors” in Newsmax’s Annual Report on Form 10-K for the twelve months ended December 31, 2025 and other filings Newsmax makes with the Securities and Exchange Commission. Nothing in this communication should be regarded as a representation by any person that the forward-looking statements set forth herein will be achieved or that any of the contemplated results of such forward-looking statements will be achieved. Undue reliance should not be placed on forward-looking statements in this communication, which speak only as of the date they are made and are qualified in their entirety by reference to the cautionary statements herein.
USE AND DEFINITION OF NON-GAAP FINANCIAL MEASURES
This press release contains a financial measure that has not been prepared in accordance with United States Generally Accepted Accounting Principles (“U.S. GAAP”). This financial measure is Adjusted EBITDA.
Non-GAAP financial measures are used to supplement the financial information presented on a U.S. GAAP basis and should not be considered in isolation or as a substitute for the relevant U.S. GAAP measures and should be read in conjunction with information presented on a U.S. GAAP basis. Because not all companies use identical calculations, our presentation of Non-GAAP measures may not be comparable to other similarly titled measures of other companies.
Adjusted EBITDA1 is defined as revenues less cost of revenues and general and administrative expenses and does not include depreciation, amortization related to the incremental costs to obtain a contract, interest expense, net, impairment charges, unrealized gains (losses) on marketable securities, stock-based compensation, other corporate matters (consisting primarily of certain litigation expenses, and related fees, for specific legal proceedings that the Company has determined are infrequent and unusual in terms of their magnitude), other, net, and income tax expense.
You are encouraged to evaluate each adjustment used in calculating our non-GAAP financial measure and the reasons we consider our non-GAAP financial measure appropriate for supplemental analysis. In evaluating our non-GAAP financial measure, you should be aware that in the future we may incur expenses similar to the adjustments in our presentation. Our non-GAAP financial measure has limitations as an analytical tool, and you should not consider this measure in isolation or as a substitute for analysis of our results as reported under GAAP. Our presentation of our non-GAAP financial measure should not be construed as an inference that our future results will be unaffected by unusual or non-recurring items. Our non-GAAP financial measure may not be comparable to other companies. Please see a historical reconciliation of this measure to the most comparable GAAP measure presented in our consolidated financial statements below.
ATHENS, Greece, Aug. 13, 2026 (GLOBE NEWSWIRE) — Euroseas Ltd. (NASDAQ: ESEA, the “Company” or “Euroseas”), an owner and operator of container carrier vessels and provider of seaborne transportation for containerized cargoes, announced today its results for the three- and six-month periods ended June 30, 2026.
Second Quarter 2026 Financial Highlights:
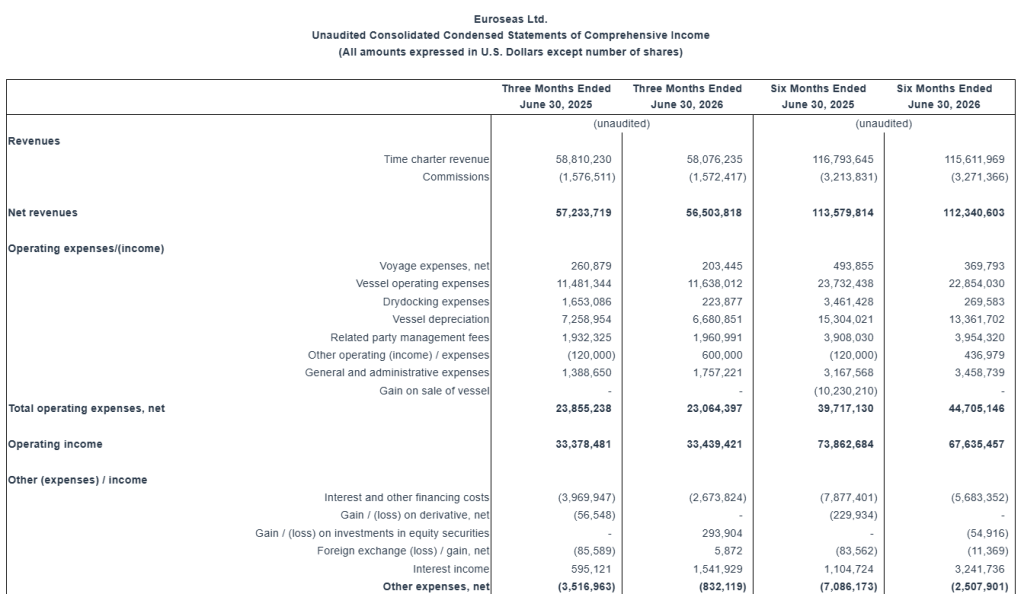
Total net revenues of $56.5 million.
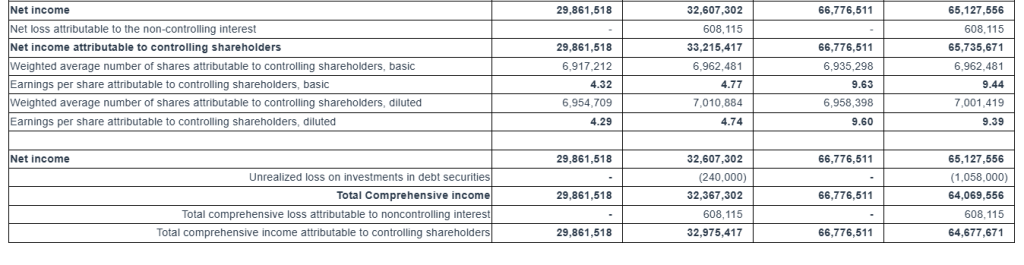
Net income attributable to controlling shareholders of $33.2 million or $4.77 and $4.74 earnings per share attributable to controlling shareholders basic and diluted, respectively.
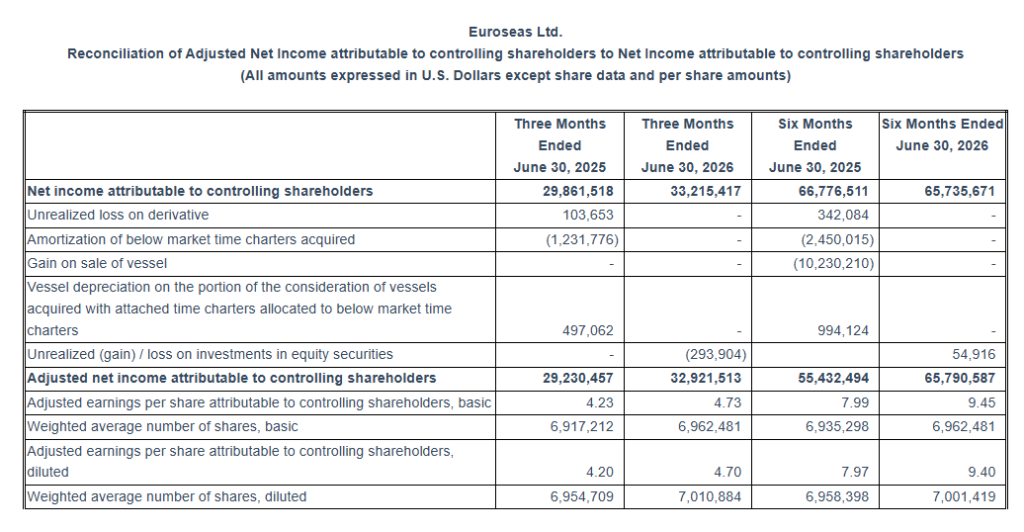
Adjusted net income1 attributable to controlling shareholders for the period of $32.9 million or $4.73 and $4.70 adjusted earnings per share1 basic and diluted, respectively, which represents the net income attributable to controlling shareholders excluding the unrealized gain on investments in equity securities.
Adjusted EBITDA1 was $40.1 million.
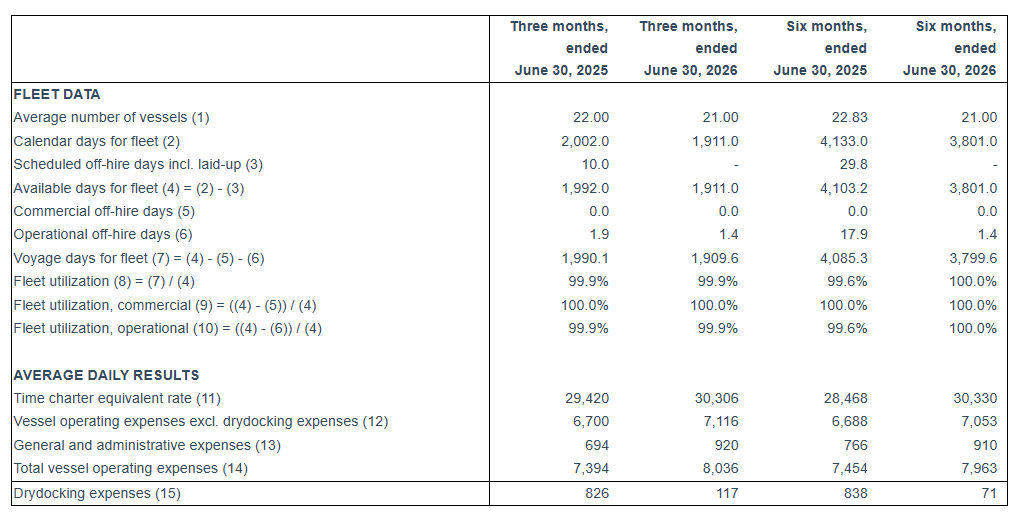
An average of 21.0 vessels were owned and operated during the second quarter of 2026 earning an average time charter equivalent rate of $30,306 per day.
Declared a quarterly dividend of $0.80 per share for the second quarter of 2026 payable on or about September 16, 2026, to shareholders of record on September 9, 2026, as part of the Company’s common stock dividend plan.
As of August 13, 2026, we had repurchased 480,460 of our common stock in the open market, representing about 6.8% of the outstanding shares, for a total of about $11.36 million, since the initiation of our share repurchase plan of up to $20 million announced in May 2022.
First Half 2026 Financial Highlights:
Total net revenues of $112.3 million.
Net income attributable to controlling shareholders of $65.7 million or $9.44 and $9.39 earnings per share attributable to controlling shareholders basic and diluted, respectively.
Adjusted net income1 attributable to controlling shareholders for the period was $65.8 million or $9.45 and $9.40 adjusted earnings per share1 attributable to controlling shareholders basic and diluted, respectively.
Adjusted EBITDA1 was $81.0 million.
An average of 21.0 vessels were owned and operated during the first half of 2026 earning an average time charter equivalent rate of $30,330 per day.
___________________________ 1 Adjusted EBITDA, Adjusted net income and Adjusted earnings per share are not recognized measurements under US GAAP (GAAP) and should not be used in isolation or as a substitute for Euroseas financial results presented in accordance with GAAP. Refer to a subsequent section of the Press Release for the definitions and reconciliation of these measurements to the most directly comparable financial measures calculated and presented in accordance with GAAP.
Aristides Pittas, Chairman and CEO of Euroseas, commented: “We are pleased to report financial results for the second quarter of 2026 at par with the first quarter of the year, making these two of our most profitable consecutive quarters of the last fifteen years. Solid contracts at highly profitable rates, combined with low drydocking expenses, as in the previous quarter, were the main factors supporting our strong financial results.
“The containership charter market remained very strong during the second quarter, with daily rates continuing at high levels through July and into the beginning of August 2026, shrugging off geopolitical uncertainty and inflationary pressures. Charterer interest in securing vessels has remained high, including for older tonnage. Our charter coverage is over 95% for the remainder of 2026, 81% for 2027 and 47% for 2028, ensuring that our profitability will remain strong regardless of the levels at which expiring charters are renewed. Secondhand vessel prices across all segments have also remained very firm and have continued to inch upwards.
“The macroeconomic environment during the quarter was largely influenced by continuing uncertainty surrounding the war in Iran and its effects on the use of the Strait of Hormuz. Whether these effects will prove short-lived or will ultimately result in lower economic growth remains to be seen. At the same time, continuing attacks by Houthi rebels on shipping in the Red Sea have prevented major liner companies from resuming regular Suez Canal transits. This has increased the number of teu-miles required and, consequently, the number of vessels needed, supporting demand for tonnage and charter rates.
“The eventual reversal of these inefficiencies, together with the absorption of the increased fleet orderbook, presents challenges for our sector over the medium term. The vessel orderbook, however, although high for the overall containership fleet, is concentrated in the larger sizes. The segments in which we operate—feeder and intermediate containerships—not only have a significantly smaller orderbook as a percentage of the existing fleet but also have an older age profile. This is likely to result in very modest fleet growth, or potentially even fleet shrinkage, in these segments.
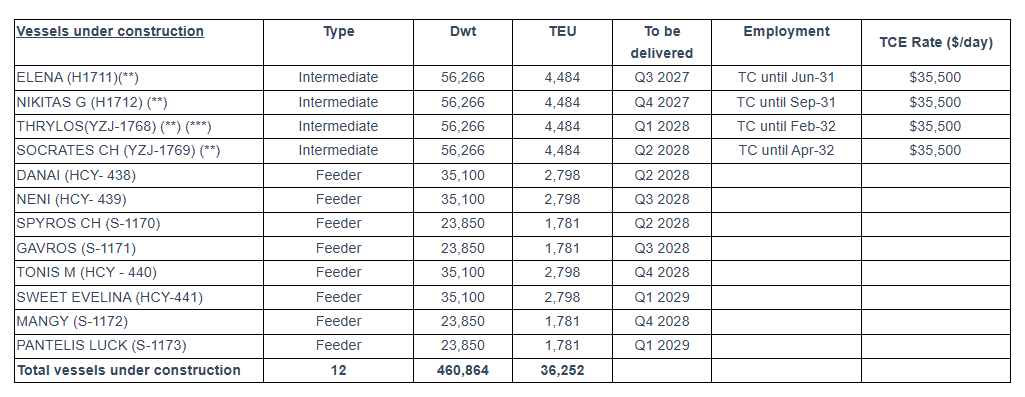
“On the investment front, we have expanded our newbuilding program to 12 vessels, focusing on the most commercial sizes within the feeder and intermediate containership segments. The vessels are scheduled for delivery from the third quarter of 2027 through the first quarter of 2029. Once all twelve vessels are delivered, we expect to have one of the youngest feeder and intermediate containership fleets in the industry. In addition, we continue to look for accretive investment opportunities in our sector, balancing project returns with residual value risks.
“Finally, I am also pleased to announce that our Board has decided to declare a dividend of $0.80 per share, representing an annualized yield of approximately 4.2% to 4.5% based on the recent range in which our share price has traded.”
Tasos Aslidis, Chief Financial Officer of Euroseas commented: “Our revenues for the second quarter of 2026 are slightly lower compared to the same period of 2025. This was the result of the lower average number of vessels owned and operated during the second quarter of 2026 compared to the same period of last year. On a per-vessel-per-day basis, our vessels earned a 3.0% higher average charter rate in the second quarter of 2026 as compared to the same period of 2025. Our net revenues decreased to $56.5 million in the second quarter of 2026 compared to $57.2 million during the same period of last year.
“Daily vessel operating expenses, including management fees but excluding drydocking costs, averaged $7,116 per vessel per day during the second quarter of 2026 as compared to $6,700 per vessel per day for the same quarter of last year. This was mainly the result of the falling value of the USD and the adjustment for inflation in the daily vessel management fee, effective from January 1, 2026, increasing it from 840 Euros to 875 Euros.
General and administrative expenses averaged $920 per vessel per day during the second quarter of 2026 as compared to $694 per vessel per day for the same quarter of last year, and $910 per vessel per day for the first half of 2026 as compared to $766 per vessel per day for the same period of 2025. The increase is due to increased professional fees and increased cost for our stock incentive plan within 2026 as compared to 2025.
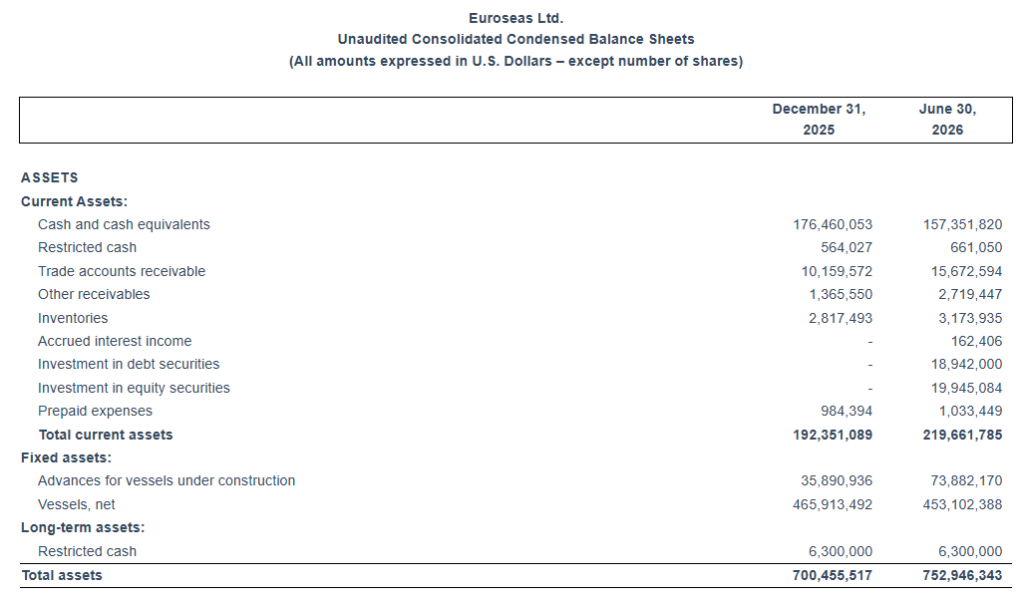
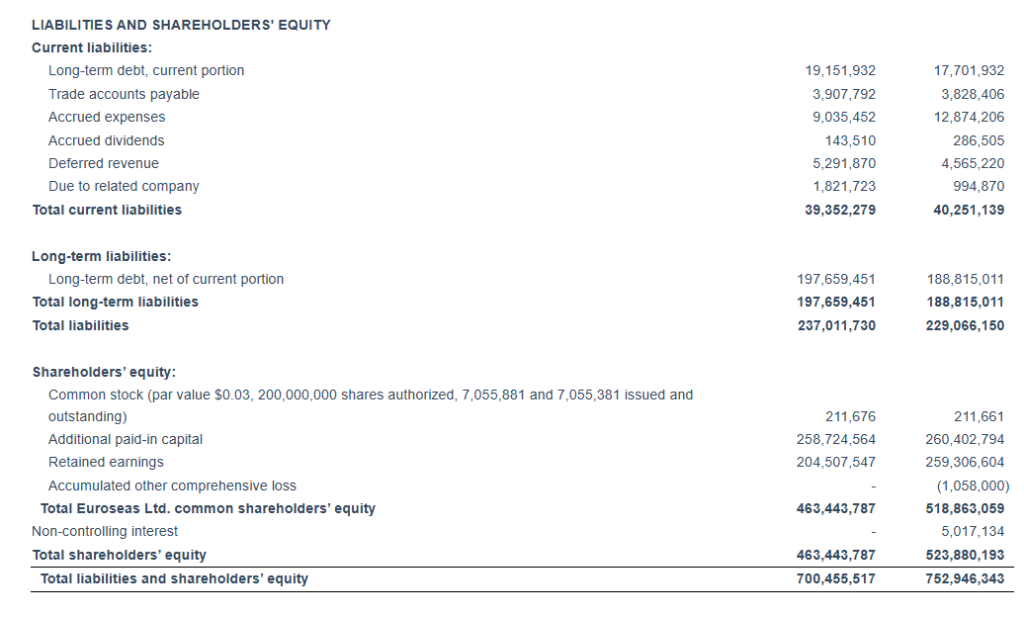
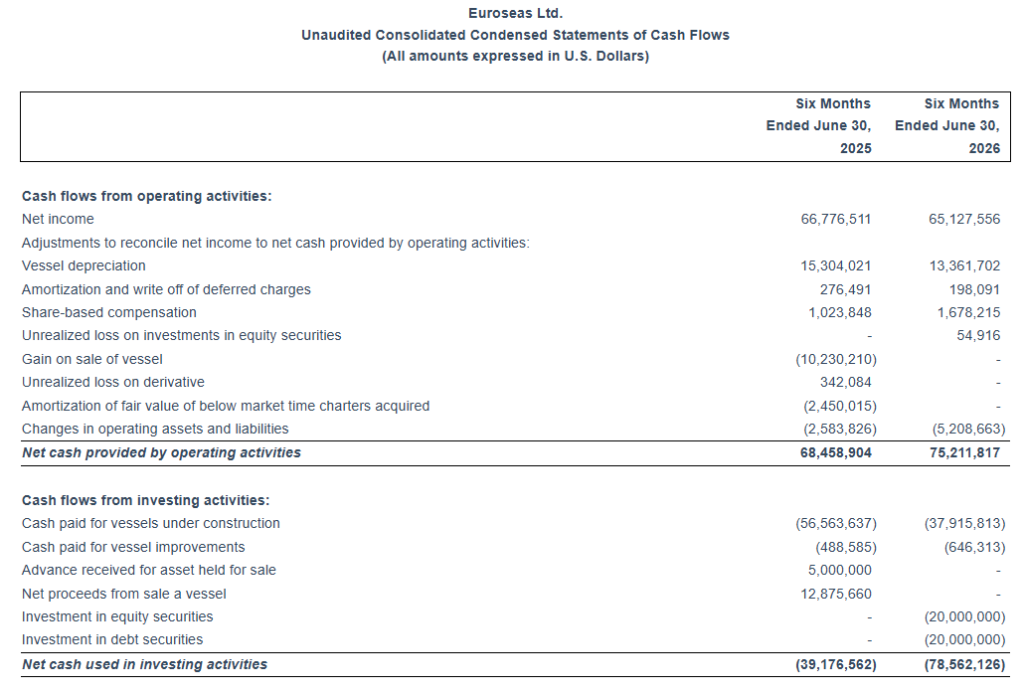
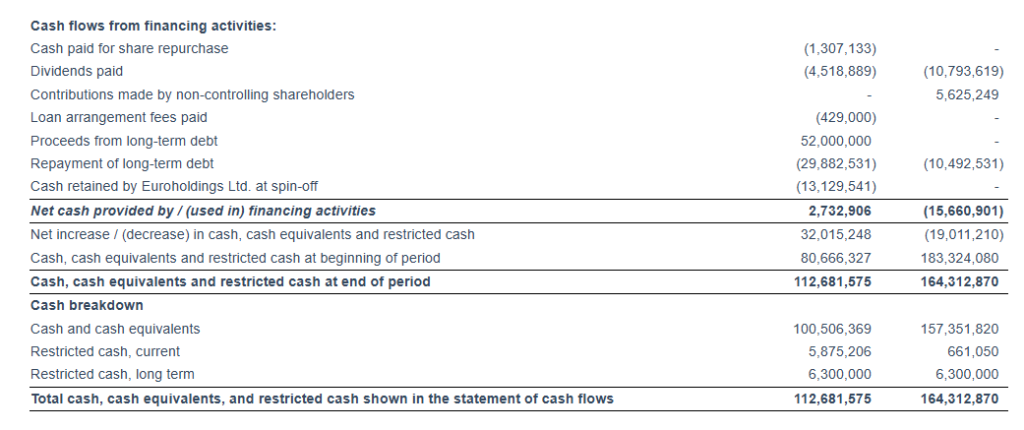
“Adjusted EBITDA during the second quarter of 2026 was $40.1 million versus $39.3 million in the second quarter of last year. As of June 30, 2026, our outstanding debt (before deducting the unamortized loan fees) was $208.1 million versus restricted and unrestricted cash of $164.3 million. As of the same date, our scheduled bank debt repayments over the next 12 months amounted to about $18.1 million (before deducting the unamortized loan fees).”
Second Quarter 2026 Results: For the second quarter of 2026, the Company reported total net revenues of $56.5 million representing a 1.2% decrease over total net revenues of $57.2 million during the second quarter of 2025. This was the result of the lower average number of vessels owned and operated in the second quarter of 2026 compared to the same period of 2025, partly offset by the increase in the time charter rates our vessels earned in the second quarter of 2026 compared to the same period of 2025. On average, 21.0 vessels were owned and operated during the second quarter of 2026 earning an average time charter equivalent rate of $30,306 per day compared to 22.0 vessels in the same period of 2025 earning on average $29,420 per day.
For the second quarter of 2026, voyage expenses, net amounted to $0.2 million, as compared to voyage expenses of $0.3 million for the same period of 2025. Voyage expenses for both periods related mainly to owners’ expenses incurred in various ports.
Vessel operating expenses were $11.6 million in the second quarter of 2026 as compared to $11.5 million for the second quarter of 2025. The increase is due to the increased cost of vessel supplies during the period, because of the war in the Middle East region, partly offset by the lower average number of vessels owned and operated in the second quarter of 2026, compared to the corresponding period of 2025.
In the second quarter of 2026 none of our vessels were drydocked. The total drydock cost for the quarter of $0.2 million relates to supplies performed for upcoming drydocks. In the second quarter of 2025 one of our vessels completed extensive repairs afloat. The total drydock cost for the quarter was $1.7 million and also includes costs in relation to the upcoming drydockings.
Vessel depreciation for the second quarter of 2026 decreased to $6.7 million compared to $7.3 million for the same period of 2025 due to the decreased number of vessels in the Company’s fleet.
Related party management fees for the second quarter of 2026 increased to $1.96 million from $1.93 million for the same period of 2025. Despite the lower number of vessels in our fleet, this increase is due to the adjustment for inflation in the daily vessel management fee, effective from January 1, 2026, increasing it from 840 Euros to 875 Euros, as well as due to the unfavorable movement of the euro/dollar exchange rate.
Other operating expenses of $0.6 million recognized in the second quarter of 2026 refers to expenses incurred for the formation of the Partnership (as defined below) with a group of investors represented by NRP Project Finance AS (“NRP Investors”). For the second quarter of 2025 the Company recognized other operating income of $0.12 million from an insurance claim.
General and administrative expenses increased to $1.8 million for the second quarter of 2026, compared to $1.4 million for the second quarter of 2025, due to increased professional fees and increased cost for our stock incentive plan.
Interest and other financing costs for the second quarter of 2026 amounted to $2.7 million, compared to $4.0 million for the second quarter of 2025. This decrease is due to the decreased amount of average outstanding debt and the decreased benchmark rates of our loans in the current period compared to the same period of 2025.
For the three months ended June 30, 2026, the Company recognized a $0.3 million unrealized gain on its investments in equity securities, resulting from an increase in the fair value of the investments from $19.65 million as of March 31, 2026 to $19.95 million as of June 30, 2026. These investments, which had an initial cost of $20.0 million and were acquired in the first quarter of 2026 as part of the Company’s short-term cash and liquidity management strategy, are classified as investments in equity securities and measured at fair value through profit or loss in accordance with U.S. GAAP. As part of the same strategy, the Company also acquired debt securities with an initial cost of $20.0 million, classified as available-for-sale under U.S. GAAP, for which the fair value decreased from $19.182 million as of March 31, 2026 to $18.942 million as of June 30, 2026, resulting in an additional unrealized loss of approximately $0.24 million during the second quarter of 2026, which was recognized in “Other comprehensive loss. None of these investments existed in the second quarter of 2025.
For the three months ended June 30, 2025, the Company recognized a $0.05 million realized gain and a $0.11 million unrealized loss for a total of $0.06 million net loss on its interest rate swap contract. The specific contract was closed within the year 2025 and no such case existed in the second quarter of 2026.
The Company reported net income for the period of $32.6 million and net income attributable to controlling shareholders of $33.2 million, as compared to net income and net income attributable to controlling shareholders of $29.9 million for the same period of 2025. The net loss attributable to the non-controlling interest of $0.6 million in the second quarter of 2026 represents the income attributable to the 49% ownership of the entity owning the M/V Thrylos represented by the NRP investors (the “Partnership”).
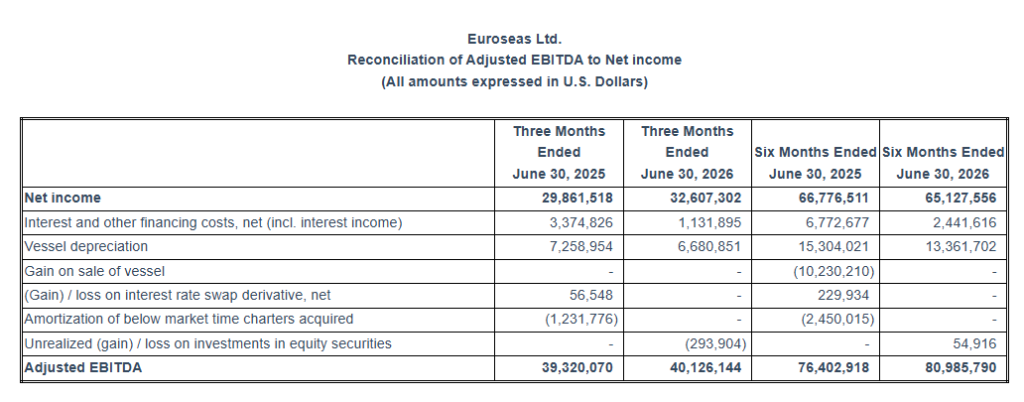
Adjusted EBITDA1 for the second quarter of 2026 was $40.1 million compared to $39.3 million achieved during the second quarter of 2025.
Basic and diluted earnings per share attributable to controlling shareholders for the second quarter of 2026 was $4.77 and $4.74, calculated on 6,962,481 basic and 7,010,884 diluted weighted average number of shares outstanding, compared to basic and diluted earnings attributable to controlling shareholders per share of $4.32 and $4.29, respectively, for the second quarter of 2025, calculated on 6,917,212 basic and 6,954,709 diluted weighted average number of shares outstanding.
The adjusted earnings per share attributable to controlling shareholders for the quarter ended June 30, 2026 would have been $4.73 and $4.70 per share basic and diluted, respectively, compared to adjusted earnings attributable to controlling shareholders of $4.23 and $4.20 per share basic and diluted for the quarter ended June 30, 2025. Usually, security analysts include Adjusted Net Income attributable to controlling shareholders in their determination of published estimates of earnings per share.
First Half 2026 Results: For the first half of 2026, the Company reported total net revenues of $112.3 million representing a 1.1% decrease over total net revenues of $113.6 million during the first half of 2025. On average, the Company owned and operated 21.0 vessels during the first half of 2026, earning an average time charter equivalent rate of $30,330 per day. For the same period of 2025 the Company owned and operated 22.83 vessels that earned on average $28,468 per day.
Voyage expenses, net for the first half of 2026 amounted to $0.4 million as compared to voyage expenses, net of $0.5 million for the same period of 2025. Voyage expenses for both periods related mainly to owners’ expenses incurred in various ports.
Vessel operating expenses for the first half of 2026 amounted to $22.9 million compared to $23.7 million for the same period of 2025. The decrease is due to the lower average number of vessels owned and operated in the first half of 2026 compared to the corresponding period of 2025 partly offset by the higher daily vessel operating expenses, mainly attributable to the increased cost of vessel supplies during the period, because of the war in the Middle East region.
In the first half of 2026 none of our vessels were drydocked. The total drydock cost for the period of $0.3 million relates to supplies performed for upcoming drydocks. In the same period of 2025 three of our vessels completed extensive repairs afloat for a total cost of approximately $3.5 million.
Vessel depreciation expense for the first half of 2026 was $13.4 million compared to $15.3 million during the same period of 2025, due to the decreased number of vessels in the Company’s fleet.
Related party management fees for the first half of 2026 increased to $3.95 million from $3.90 million for the same period of 2025. Despite the lower number of vessels in our fleet, this increase is due to the adjustment for inflation in the daily vessel management fee, effective from January 1, 2026, increasing it from 840 Euros to 875 Euros, as well as due to the unfavorable movement of the euro/dollar exchange rate.
Other operating expenses of $0.44 million recognized in the first half of 2026 refer to expenses incurred for the formation of the Partnership of $0.60 million, partly offset by an operating income from a settlement and closure of a claim with a charterer of $0.16 million. For the same period of 2025, the Company recognized other operating income of $0.12 million from an insurance claim.
General and administrative expenses increased to $3.5 million for the first half of 2026, as compared to $3.2 million for the same period of 2025, due to increased professional fees and increased cost for our stock incentive plan.
The results of the Company for the first half of 2025 include a $10.2 million gain on sale of M/V “Diamantis” that was completed in January 2025. No such case existed in the first half of 2026.
Interest and other financing costs for the first half of 2026 amounted to $5.7 million. Interest and other financing costs for the first half of 2025 amounted to $7.9 million. Capitalized interest charged on the cost of our newbuilding program was $0.1 million for the first six months of 2025. This decrease is due to the decreased amount of average outstanding debt and the decreased benchmark rates of our loans in the current period compared to the same period of 2025.
For the first half of 2026, the Company recognized a $0.1 million unrealized loss on its investments in equity securities. This was the result of an investment in equity securities with an initial cost of $20.0 million acquired in the first quarter of 2026 and fair valued at $19.9 million as of the end of the reporting period. This investment was made as part of the Company’s short-term cash and liquidity management strategy, in the context of which the Company also acquired debt securities of initial cost of $20.0 million and fair valued at $18.9 million as of June 30, 2026, classified as available-for-sale under US GAAP, for which an unrealized loss of $1.1 million was recorded in “Other comprehensive loss” for the period. None of these investments existed in the second quarter of 2025.
For the six months ended June 30, 2025 the Company recognized a $0.1 million realized gain and a $0.3 million unrealized loss for a total of $0.2 million net loss on its interest rate swap contract. The specific contract was closed within the year 2025 and no such case existed in the first half of 2026.
The Company reported net income for the period of $65.1 million and net income attributable to controlling shareholders of $65.7 million, for the first half of 2026, as compared to net income and net income attributable to controlling shareholders of $66.8 million for the same period of 2025. The net loss attributable to the non-controlling interest of $0.6 million in the first half of 2026 represents the loss attributable to the 49% ownership of the Partnership.
Adjusted EBITDA1 for the first half of 2026 was $81.0 million compared to $76.4 million achieved during the first half of 2025.
Basic and diluted earnings per share attributable to controlling shareholders for the first half of 2026 was $9.44 calculated on 6,962,481 basic and $9.39, calculated on 7,001,419 diluted weighted average number of shares outstanding, compared to $9.63 calculated on 6,935,298 basic and $9.60, calculated on 6,958,398 diluted weighted average number of shares outstanding, for the same period of 2025.
The adjusted earnings per share attributable to controlling shareholders for the six-month period ended June 30, 2026 would have been $9.45 and $9.40, basic and diluted, respectively, compared to adjusted earnings per share attributable to controlling shareholders of $7.99 basic and $7.97 diluted for the same period in 2025. As mentioned above, usually, security analysts include Adjusted Net Income attributable to controlling shareholders in their determination of published estimates of earnings per share.
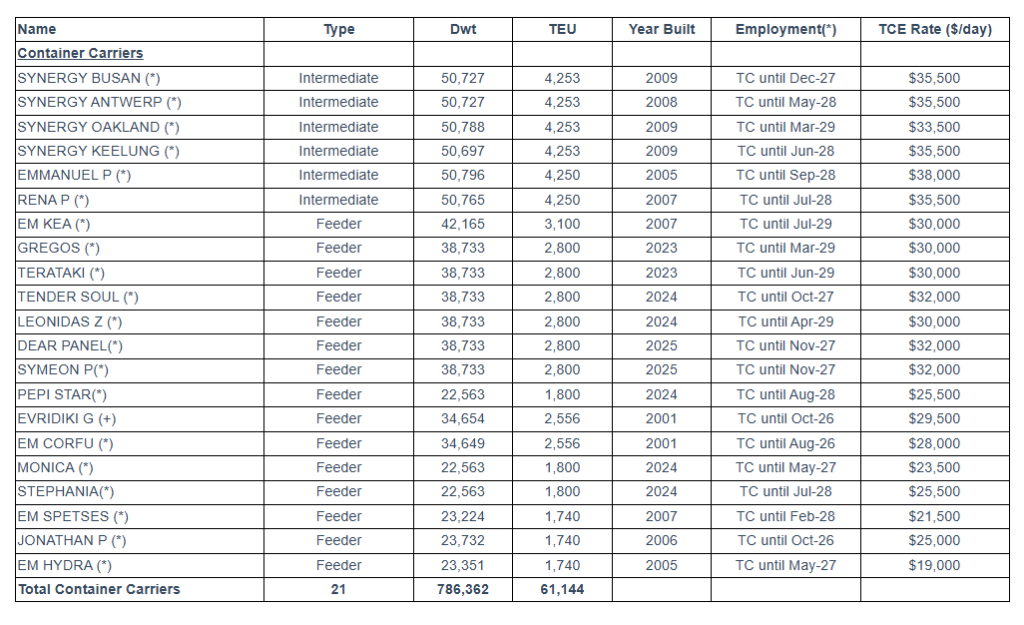
Fleet Profile: The Euroseas Ltd. fleet profile as of August 13, 2026 is as follows:
Note: (*) TC denotes time charter. All dates listed are the earliest redelivery dates under each TC unless the contract rate is lower than the current market rate in which cases the latest redelivery date is assumed; vessels with the latest redelivery date shown are marked by (+).
(**) Charterer has the option to convert to a five-year charter at $32,500/day for the entire period. (***) The entity owning the vessel under construction is 51% owned by Euroseas Ltd. and 49% by NRP Investors.
Summary Fleet Data:
(1) Average number of vessels is the number of vessels that constituted the Company’s fleet for the relevant period, as measured by the sum of the number of calendar days each vessel was a part of the Company’s fleet during the period divided by the number of calendar days in that period.
(2) Calendar days. We define calendar days as the total number of days in a period during which each vessel in our fleet was in our possession including off-hire days associated with major repairs, drydockings or special or intermediate surveys or days of vessels in lay-up. Calendar days are an indicator of the size of our fleet over a period and affect both the amount of revenues and the amount of expenses that we record during that period.
(3) The scheduled off-hire days including vessels laid-up, vessels committed for sale or vessels that suffered unrepaired damages, are days associated with scheduled repairs, drydockings or special or intermediate surveys or days of vessels in lay-up, or vessels that were committed for sale or suffered unrepaired damages.
(4) Available days. We define available days as the Calendar days in a period net of scheduled off-hire days as defined above. We use available days to measure the number of days in a period during which vessels were available to generate revenues.
(5) Commercial off-hire days. We define commercial off-hire days as days a vessel is idle without employment.
(6) Operational off-hire days. We define operational off-hire days as days associated with unscheduled repairs or other off-hire time related to the operation of the vessels.
(7) Voyage days. We define voyage days as the total number of days in a period during which each vessel in our fleet was in our possession net of commercial and operational off-hire days. We use voyage days to measure the number of days in a period during which vessels actually generate revenues or are sailing for repositioning purposes.
(8) Fleet utilization. We calculate fleet utilization by dividing the number of our voyage days during a period by the number of our available days during that period. We use fleet utilization to measure a company’s efficiency in finding suitable employment for its vessels and minimizing the amount of days that its vessels are off-hire for reasons such as unscheduled repairs or days waiting to find employment.
(9) Fleet utilization, commercial. We calculate commercial fleet utilization by dividing our available days net of commercial off-hire days during a period by our available days during that period.
(10) Fleet utilization, operational. We calculate operational fleet utilization by dividing our available days net of operational off-hire days during a period by our available days during that period.
(11) Average time charter equivalent rate, or average TCE, is a metric of the average daily net revenue performance of our vessels. Our method of calculating average TCE is determined by dividing time charter revenue and voyage charter revenue, if any, net of voyage expenses by voyage days for the relevant time period. Voyage expenses primarily consist of port, canal and fuel costs that are unique to a particular voyage, which would otherwise be paid by the charterer under a time charter contract, or are related to repositioning the vessel for the next charter. Average TCE, which is a non-GAAP metric, provides additional meaningful information in conjunction with time charter revenue and voyage charter revenue, if any, the most directly comparable GAAP measure, because it assists our management in making decisions regarding the deployment and use of our vessels and because we believe that it provides useful information to investors regarding our financial performance. Average TCE is a standard shipping industry performance metric used primarily to compare period-to-period changes in a shipping company’s performance despite changes in the mix of charter types (i.e., spot voyage charters, time charters and bareboat charters) under which the vessels may be employed between the periods. Our definition of average TCE may not be comparable to that used by other companies in the shipping industry.
(12) We calculate daily vessel operating expenses, which includes crew costs, provisions, deck and engine stores, lubricating oil, insurance, maintenance and repairs and related party management fees by dividing vessel operating expenses and related party management fees by fleet calendar days for the relevant time period. Drydocking expenses are reported separately.
(13) Daily general and administrative expenses are calculated by us by dividing general and administrative expenses by fleet calendar days for the relevant time period.
(14) Total vessel operating expenses, or TVOE, is a measure of our total expenses associated with operating our vessels. TVOE is the sum of vessel operating expenses, related party management fees and general and administrative expenses; drydocking expenses are not included. Daily TVOE is calculated by dividing TVOE by fleet calendar days for the relevant time period.
(15) Daily drydocking expenses are calculated by us by dividing drydocking expenses by the fleet calendar days for the relevant period, Drydocking expenses include expenses during drydockings that would have been capitalized and amortized under the deferral method. Drydocking expenses could vary substantially from period to period depending on how many vessels underwent drydocking during the period. The Company expenses drydocking expenses as incurred.
Conference Call and Webcast: Today, Thursday, August 13, 2026 at 09:00 a.m. Eastern Time, the Company’s management will host a conference call and webcast to discuss the results.
Conference Call details: Participants should dial into the call 10 minutes before the scheduled time using the following numbers: 877 405 1226 (US Toll-Free Dial In) or +1 201 689 7823 (US and Standard International Dial In). Please quote “Euroseas” to the operator and/or conference ID13762072. Click here for additional participant International Toll -Free access numbers.
Alternatively, participants can register for the call using the call me option for a faster connection to join the conference call. You can enter your phone number and let the system call you right away. Click here for the call me option.
Audio Webcast – Slides Presentation: There will be a live and then archived webcast of the conference call and accompanying slides, available on the Company’s website. To listen to the archived audio file, visit our website http://www.euroseas.gr and click on Company Presentations under our Investor Relations page. Participants to the live webcast should register on the website approximately 10 minutes prior to the start of the webcast.
The slide presentation for the second quarter ended June 30, 2026, will also be available in PDF format minutes prior to the conference call and webcast, accessible on the company’s website (www.euroseas.gr) on the webcast page. Participants to the webcast can download the PDF presentation.
Adjusted EBITDA Reconciliation: Euroseas Ltd. considers Adjusted EBITDA to represent net income before interest and other financing costs, net, depreciation, loss on interest rate swap derivative, net, gain on sale of vessel, amortization of fair value of below market time charters acquired and unrealized (gain) / loss on investments in equity securities. Adjusted EBITDA does not represent and should not be considered as an alternative to net income, as determined by United States generally accepted accounting principles, or GAAP. Adjusted EBITDA is included herein because it is a basis upon which the Company assesses its financial performance and liquidity position and because the Company believes that this non-GAAP financial measure assists our management and investors by increasing the comparability of our performance from period to period by excluding the potentially disparate effects between periods of financial costs, loss on interest rate swaps, gain on sale of vessel, depreciation, amortization of below market time charters acquired and unrealized (gain) / loss on investments in equity securities. The Company’s definition of Adjusted EBITDA may not be the same as that used by other companies in the shipping or other industries.
Adjusted net income attributable to controlling shareholders and Adjusted earnings per share attributable to controlling shareholders Reconciliation:
Euroseas Ltd. considers Adjusted net income attributable to controlling shareholders to represent net income attributable to controlling shareholders before unrealized loss on derivative, gain on sale of vessel, amortization of below market time charters acquired, vessel depreciation on the portion of the consideration of vessels acquired with attached time charters allocated to below market time charters and unrealized (gain) / loss on investments in equity securities. Adjusted net income attributable to controlling shareholders and Adjusted earnings attributable to controlling shareholders per share are included herein because we believe they assist our management and investors by increasing the comparability of the Company’s fundamental performance from period to period by excluding the potentially disparate effects between periods of the aforementioned items, which may significantly affect results of operations between periods.
Adjusted net income attributable to controlling shareholders and Adjusted earnings attributable to controlling shareholders per share do not represent and should not be considered as an alternative to net income or earnings per share, as determined by GAAP. The Company’s definition of Adjusted net income attributable to controlling shareholders and Adjusted earnings attributable to controlling shareholders per share may not be the same as that used by other companies in shipping or other industries. Adjusted net income attributable to controlling shareholders and Adjusted earnings per share attributable to controlling shareholders are not adjusted for all non-cash income and expense items that are reflected in our statement of cash flows.
About Euroseas Ltd. Euroseas Ltd. was formed on May 5, 2005 under the laws of the Republic of the Marshall Islands to consolidate the ship owning interests of the Pittas family of Athens, Greece, which has been in the shipping business over the past 140 years. Euroseas trades on the NASDAQ Capital Market under the ticker ESEA.
Euroseas operates in the container shipping market. Euroseas’ operations are managed by Eurobulk Ltd., an ISO 9001:2008 and ISO 14001:2004 certified affiliated ship management company, which is responsible for the day-to-day commercial and technical management and operations of the vessels. Euroseas employs its vessels on spot and period charters and through pool arrangements.
The Company has a fleet of 21 vessels, including 15 Feeder containerships and 6 Intermediate containerships. Euroseas 21 containerships have a cargo capacity of 61,144 teu. After the delivery of twelve containership newbuilding containerships gradually from the third quarter of 2027 until the first quarter of 2029, Euroseas’ fleet will consist of 33 vessels with a total carrying capacity of 97,396 teu.
Forward Looking Statement This press release contains forward-looking statements (as defined in Section 27A of the Securities Act of 1933, as amended, and Section 21E of the Securities Exchange Act of 1934, as amended) concerning future events and the Company’s growth strategy and measures to implement such strategy; including expected vessel acquisitions and entering into further time charters. Words such as “expects,” “intends,” “plans,” “believes,” “anticipates,” “hopes,” “estimates,” and variations of such words and similar expressions are intended to identify forward-looking statements. Although the Company believes that the expectations reflected in such forward-looking statements are reasonable, no assurance can be given that such expectations will prove to have been correct. These statements involve known and unknown risks and are based upon a number of assumptions and estimates that are inherently subject to significant uncertainties and contingencies, many of which are beyond the control of the Company. Actual results may differ materially from those expressed or implied by such forward-looking statements. Factors that could cause actual results to differ materially include but are not limited to changes in the demand for containerships, competitive factors in the market in which the Company operates; risks associated with operations outside the United States; and other factors listed from time to time in the Company’s filings with the Securities and Exchange Commission. The Company expressly disclaims any obligations or undertaking to release publicly any updates or revisions to any forward-looking statements contained herein to reflect any change in the Company’s expectations with respect thereto or any change in events, conditions or circumstances on which any statement is based.
CALGARY, AB, Aug. 13, 2026 /CNW/ — InPlay Oil Corp. (TSX: IPO) (TASE: IPO) (OTCQX: IPOOF) (“InPlay” or the “Company”) is pleased to announce its financial and operating results for the three and six months ended June 30, 2026. InPlay’s unaudited interim financial statements and notes, and Management’s Discussion and Analysis (“MD&A”) for the three and six months ended June 30, 2026 will be available at “www.sedarplus.ca” and the Company’s website at “www.inplayoil.com“. An updated corporate presentation will be available on our website in due course.
Second Quarter 2026 Highlights:
Achieved average quarterly production of 18,663 boe/d(1) (62% light crude oil and NGLs), a 2% increase from Q1 2026.
Improved light oil production to 9,382 bbl/d, a 6% increase from Q1 2026. Light crude oil weighting improved by 3% from Q1 2026 driving stronger per boe netbacks and returns.
Realized strong operating income of $68.4 million, a 50% increase from Q1 2026, resulting in an operating income profit margin(4) of 55%, a 7% improvement from Q1 2026. Field operating netbacks(4) improved to $40.26/boe, an increase of 46% compared to Q1 2026.
Delivered Adjusted Funds Flow (“AFF”)(2) of $44.7 million ($1.61 per weighted average basic share(3)), a 48% increase from Q1 2026.
Generated significant Free Adjusted Funds Flow (“FAFF”)(4) of $28.4 million.
Returned $7.6 million to shareholders via monthly dividends (7.2% yield relative to current share price). Since November 2022, InPlay has returned $82 million ($4.14/share) to shareholders through dividends, including dividends declared to date in the third quarter.
Under the Normal Course Issuer Bid initiated on May 21, 2026, began repurchasing shares in June and 0.5% of outstanding shares were cancelled.
Subsequent Events:
On August 5, 2026, the Company announced it had entered into a definitive agreement to acquire a private oil and gas producer for cash consideration of $54.25 million, prior to closing adjustments adding 1,400 boe/d of current production and 50 additional net drilling locations all in our core Pembina area.
On July 24, 2026, the Company renewed its Senior Credit Facility, which now consists of committed amounts of a $140 million revolving line of credit and a $50 million operating line of credit. In addition, the borrowing base was expanded by $60 million, for a total borrowing base of $250 million.
Message to Shareholders:
The second quarter of 2026 was another period of strong execution for InPlay. Operationally, InPlay’s first half capital program was executed under budget and ahead of schedule, continuing our track-record of doing more with less. InPlay’s H1 2026 drilling program also achieved IP rates that were 30% – 48% ahead of our internal projections, resulting in corporate oil production exceeding internal forecasts.
The combination of high oil prices and strong oil production led to InPlay delivering quarterly AFF of $44.7 million, the highest quarterly level in its 10- year history as a public company. InPlay also returned $7.6 million ($0.27/share) to shareholders through dividends and repurchased $2.2 million (0.5% of shares outstanding), while also reducing net debt.
InPlay’s financial strength positioned the Company to be able to sign a definitive agreement to acquire a private oil and gas producer for cash consideration of $54.25 million (the “Acquisition“), funded entirely through our recently expanded credit capacity. Completing an acquisition of this quality without dilution to shareholders directly enhances per share growth and accretion. The Acquisition is expected to be 18% accretive on both AFF per share and FAFF per share, while adding 1,400 boe/d of production (85% liquids) and 50 net drilling locations in our core areas.
The Acquisition builds on InPlay’s decade-long track record of value-add M&A, utilizing conservative leverage ratios to acquire high-quality, free cash flow generating assets to generate sustainable long-term shareholder returns while maintaining a conservative balance sheet. This approach supports the rapid repayment of acquisition debt, positioning the Company for the next accretive opportunity. The Acquisition advances InPlay’s strategy of building a disciplined, sustainable light oil growth company by increasing production, AFF and FAFF per share while expanding its high-quality drilling inventory. The complementary assets of the Acquisition directly offset InPlay’s existing operations and infrastructure, delivering immediate operational synergies.
InPlay’s year to date capital program has been completed below budget, allowing the Company to increase the number of planned wells by 30% with only a 15% increase in capital (from mid-point). InPlay expanded its pre-acquisition capital program to drill a total of 15.0 net Cardium wells, an increase from 13.0 net (mid-point) Cardium wells in our original capital budget. In addition, 2.0 net Belly River wells are planned on the acquired assets, resulting in a pro forma capital program of $80 – $82 million drilling 17.0 net horizontal wells.
InPlay has increased 2026 average annual production guidance to 18,900 boe/d – 19,400 boe/d(1) (61% – 63% light oil and NGLs). The Company also increased 2026 AFF by 12% to $165 million (mid-point) from $147 million (mid-point), with no change to commodity price assumptions. This is expected to increase FAFF by 9% from $77 million (mid-point) to $84 million (mid-point), equating to a FAFF yield(4) of 20% (mid-point). The Company’s leverage metrics are projected to remain strong with net debt to Q4 2026 EBITDA(4) now forecasted to be 1.25x (mid-point).
Further information related to the Acquisition and revised pro forma guidance is outlined in the Company’s August 5, 2026 Press Release (Press Release – August 5, 2026).
Second Quarter 2026 Financial & Operations Overview:
InPlay completed an active capital program during the second quarter, investing $16.3 million to complete and bring on production three (3.0 net) Pembina Cardium wells drilled in the first quarter of 2026, and to drill and complete three (3.0 net) additional Pembina Cardium wells. Operational execution remained strong during the quarter, with drilling and completion operations under budget. The three most recent wells were drilled approximately 40 days ahead of schedule, as field access occurred earlier than typically anticipated following spring break-up, which was beneficial as wet weather in the second half of June and into mid-July caused delays to the start of our H2 2026 drilling program.
Quarterly production averaged 18,663 boe/d(1) (62% light crude oil and NGLs), representing a 2% increase from the first quarter of 2026. Quarterly crude oil production averaged 9,382 bbl/d, a 6% increase from the first quarter of 2026. Oil production remained strong throughout the quarter and exceeded internal forecasts.
The second quarter was our largest to date for turnaround activity and resulted in slightly increased operating costs compared to the first quarter of 2026, as well as the reactivation of shut-in, low-rate wells that went down in a lower commodity environment and are economic to return to production in the strong commodity price environment.
InPlay generated record quarterly AFF of $44.7 million ($1.61 per basic share), representing a 48% increase from the first quarter of 2026. These results were achieved despite realizing $14.1 million in hedging losses, primarily reflecting the significant increase in WTI during the quarter relative to the hedges required by our first-lien lenders to facilitate the 2025 acquisition. The Company expects minimal hedge losses in the future at our current commodity price forecast as significantly less crude oil volumes are hedged going forward and due to our strong natural gas hedges. This is reflected in the mark-to-market value of the Company’s hedges, which was an asset of $6.9 million at June 30, 2026 compared to a liability of $30.5 million at March 31, 2026. Details of the Company’s current hedges are provided in the “Hedging Summary” section of the Reader Advisories.
During the quarter, InPlay paid dividends of $7.6 million to shareholders, representing a 7.2% yield relative to our current share price. Since November 2022, InPlay has distributed $82 million ($4.14/share) in dividends, including dividends declared to date in the third quarter.
Net income of $22.9 million ($0.82 per basic share; $0.78 per diluted share), was realized in the second quarter of 2026 which includes a $37 million unrealized mark-to-market gain on the Company’s hedge portfolio.
Financial and Operating Results:
On behalf of our employees, management team and Board of Directors, we thank our shareholders for their continued support. With a high-quality asset base, a strengthened outlook and the recently announced acquisition, InPlay is well positioned to continue generating sustainable free cash flow and long-term shareholder value.
For further information please contact: Doug Bartole, President and Chief Executive Officer, InPlay Oil Corp., Telephone: (587) 955-0632; Kevin Leonard, Vice President Corporate & Business Development, InPlay Oil Corp., Telephone: (587) 955-0635
Reader Advisories
Hedging Summary
Commodity Hedges
Foreign Exchange Hedges
Currency
USD refers to United States Dollars, NIS or ILS refers to New Israeli Shekels and CAD refers to Canadian Dollars.
Non-GAAP and Other Financial Measures
Throughout this document and other materials disclosed by the Company, InPlay uses certain measures to analyze financial performance, financial position and cash flow. These non-GAAP and other financial measures do not have any standardized meaning prescribed under GAAP and therefore may not be comparable to similar measures presented by other entities. The non-GAAP and other financial measures should not be considered alternatives to, or more meaningful than, financial measures that are determined in accordance with GAAP as indicators of the Company performance. Management believes that the presentation of these non-GAAP and other financial measures provides useful information to shareholders and investors in understanding and evaluating the Company’s ongoing operating performance, and the measures provide increased transparency and the ability to better analyze InPlay’s business performance against prior periods on a comparable basis.
Non-GAAP Financial Measures and Ratios
Included in this document are references to the terms “free adjusted funds flow”, “operating income”, “operating netback per boe”, “operating income profit margin” and “Net Debt to EBITDA”. Management believes these measures and ratios are helpful supplementary measures of financial and operating performance and provide users with similar, but potentially not comparable, information that is commonly used by other oil and natural gas companies. These terms do not have any standardized meaning prescribed by GAAP and should not be considered an alternative to, or more meaningful than “profit before taxes”, “profit and comprehensive income”, “adjusted funds flow”, “capital expenditures”, “net debt” or assets and liabilities as determined in accordance with GAAP as a measure of the Company’s performance and financial position.
Free Adjusted Funds Flow / FAFF Yield
Management considers FAFF and FAFF Yield as important measures to identify the Company’s ability to improve its financial condition through debt repayment and its ability to provide returns to shareholders. FAFF should not be considered as an alternative to or more meaningful than AFF as determined in accordance with GAAP as an indicator of the Company’s performance. FAFF is calculated by the Company as AFF less exploration and development capital expenditures and property dispositions (acquisitions) and is a measure of the cashflow remaining after capital expenditures before corporate acquisitions that can be used for additional capital activity, corporate acquisitions, repayment of debt or decommissioning expenditures or potentially return of capital to shareholders. Free adjusted funds flow yield is calculated by the Company as free adjusted funds flow divided by the market capitalization of the Company. Refer to the “Forward Looking Information and Statements” section for a calculation of forecast FAFF and FAFF yield.
Operating Income/Operating Netback per boe/Operating Income Profit Margin
InPlay uses “operating income”, “operating netback per boe” and “operating income profit margin” as key performance indicators. Operating income is calculated by the Company as oil and natural gas sales less royalties, operating expenses and transportation expenses and is a measure of the profitability of operations before administrative, share-based compensation, financing and other non-cash items. Management considers operating income an important measure to evaluate its operational performance as it demonstrates its field level profitability. Operating income should not be considered as an alternative to or more meaningful than net income as determined in accordance with GAAP as an indicator of the Company’s performance. Operating netback per boe is calculated by the Company as operating income divided by average production for the respective period. Management considers operating netback per boe an important measure to evaluate its operational performance as it demonstrates its field level profitability per unit of production. Operating income profit margin is calculated by the Company as operating income as a percentage of oil and natural gas sales. Management considers operating income profit margin an important measure to evaluate its operational performance as it demonstrates how efficiently the Company generates field level profits from its sales revenue. Refer below for a calculation of operating income, operating netback per boe and operating income profit margin. Refer to the “Forward Looking Information and Statements” section for a calculation of forecast operating income, operating netback per boe and operating income profit margin.
Net Debt to EBITDA
Management considers Net Debt to EBITDA an important measure as it is a key metric to identify the Company’s ability to fund financing expenses, net debt reductions and other obligations. EBITDA is calculated by the Company as adjusted funds flow before interest expense. When this measure is presented quarterly, EBITDA is annualized by multiplying by four. When this measure is presented on a trailing twelve month basis, EBITDA for the twelve months preceding the net debt date is used in the calculation. This measure is consistent with the EBITDA formula prescribed under the Company’s Credit Facility. Net Debt to EBITDA is calculated as Net Debt divided by EBITDA. Refer to the “Forward Looking Information and Statements” section for a calculation of forecast Net Debt to EBITDA.
Capital Management Measures
Adjusted Funds Flow
Management considers adjusted funds flow to be an important measure of InPlay’s ability to generate the funds necessary to finance capital expenditures. Adjusted funds flow is a GAAP measure and is disclosed in the notes to the Company’s financial statements for the three and six months ended June 30, 2026. All references to adjusted funds flow throughout this document are calculated as funds flow adjusting for foreign exchange loss, transaction and integration costs and decommissioning expenditures. Foreign exchange loss is primarily an unrealized movement on the Company’s NIS denominated Bonds due to movements in the CAD/NIS exchange rate. In addition, InPlay has effectively mitigated its exposure to fluctuations in the CAD to NIS exchange rate on the NIS denominated Bond by entering into NIS/CAD foreign exchange hedges with notional amounts and terms that align with the future cash outflow requirements of the Bonds. Therefore, at the end of the life of the Bonds, the FX impact on the Company will be insignificant. Transaction and integration costs are non-recurring costs for the purposes of an acquisition, making the exclusion of these items relevant in Management’s view to the reader in the evaluation of InPlay’s operating performance. Decommissioning expenditures are adjusted from funds flow as they are incurred on a discretionary and irregular basis and are primarily incurred on previous operating assets. The Company also presents adjusted funds flow per share whereby per share amounts are calculated using weighted average shares outstanding consistent with the calculation of profit per common share.
Net Debt
Net debt is a GAAP measure and is disclosed in the notes to the Company’s financial statements for the three and six months ended June 30, 2026. The Company closely monitors its capital structure with the goal of maintaining a strong balance sheet to fund the future growth of the Company. The Company monitors net debt as part of its capital structure. The Company uses net debt (Long-term debt (Bond at inception value) plus accounts payable and accrued liabilities less accounts receivables and accrued receivables, restricted cash, cash and cash equivalents, prepaid expenses and deposits and inventory) as an alternative measure of outstanding debt. Management considers net debt an important measure to assist in assessing the liquidity of the Company.
Supplementary Measures
“Average realized crude oil price” is comprised of crude oil commodity sales from production, as determined in accordance with IFRS, divided by the Company’s crude oil volumes. Average prices are before deduction of transportation costs and do not include gains and losses on financial instruments.
“Average realized NGL price” is comprised of NGL commodity sales from production, as determined in accordance with IFRS, divided by the Company’s NGL volumes. Average prices are before deduction of transportation costs and do not include gains and losses on financial instruments.
“Average realized natural gas price” is comprised of natural gas commodity sales from production, as determined in accordance with IFRS, divided by the Company’s natural gas volumes. Average prices are before deduction of transportation costs and do not include gains and losses on financial instruments.
“Average realized commodity price” is comprised of commodity sales from production, as determined in accordance with IFRS, divided by the Company’s volumes. Average prices are before deduction of transportation costs and do not include gains and losses on financial instruments.
“Adjusted funds flow per weighted average basic share” is comprised of adjusted funds flow divided by the basic weighted average common shares.
“Adjusted funds flow per weighted average diluted share” is comprised of adjusted funds flow divided by the diluted weighted average common shares.
“Adjusted funds flow per boe” is comprised of adjusted funds flow divided by total production.
Forward-Looking Information and Statements
This document contains certain forward-looking information and statements within the meaning of applicable securities laws. The use of any of the words “expect”, “anticipate”, “continue”, “estimate”, “may”, “will”, “project”, “should”, “believe”, “plans”, “intends”, “forecast” and similar expressions are intended to identify forward-looking information or statements. In particular, but without limiting the foregoing, this document contains forward-looking information and statements pertaining to the following: the Company’s business strategy, milestones and objectives; the anticipated funding and timing of the Acquisition, including the use of the Company’s credit facility and anticipated borrowing capacity; the anticipated timing of the closing of the Acquisition; the anticipated benefits of the Acquisition, including the impact of the Acquisition on the Company’s operations, inventory and development opportunities; financial results and shareholder returns; anticipated production from the acquired assets associated with the Acquisition; anticipated production following completion of the Acquisition; anticipated increases in light oil production and product mix; expected accretion to AFF per share; FAFF per share, production per share and funds flow netback metrics; anticipated FAFF and FAFF yield; anticipated dividends and dividend yield; anticipated benefits of the Company’s NCIB and shareholder return strategy; anticipated operating netbacks, operating income and FAFF generated by the acquired assets associated with the Acquisition; anticipated operating, infrastructure, administrative and other synergies associated with the Acquisition, including anticipated annual cost savings and the expectation that no additions to corporate office personnel will be required; anticipated Belly River production, development opportunities and drilling inventory associated with the acquired assets, including identified drilling locations and expected payout periods; the satisfaction or waiver of the closing conditions to the Acquisition; anticipated future liquidity, financial flexibility, borrowing capacity and financial capacity; anticipated net debt and Net Debt to EBITDA ratios; future development, exploration, acquisition and infrastructure activities and related capital expenditures; the Company’s planned 2026 capital program; the amount and timing of capital projects; the number of wells expected to be drilled and completed; the Company’s asset retirement and decommissioning activities; the Company’s 2026 guidance; the Company’s anticipated 2026 annual average production and product mix; future oil, natural gas and NGL prices; future results from operations and operating metrics, including AFF, FAFF, operating income, operating netbacks, operating income profit margins and Net Debt to EBITDA; future costs, expenses and royalty rates; future interest costs; the exchange rates between USD and CAD and between NIS and CAD; methods of funding the Company’s capital program; future debt levels, leverage ratios, dividends, share repurchase and other shareholder return initiatives; and other similar statements.
The internal projections, expectations, or beliefs underlying the 2026 capital budget and associated guidance are subject to change in light of, among other factors, changes to U.S. economic, regulatory and/or trade policies (including tariffs), the impact of world events including the Russia/Ukraine conflict and wars in the Middle East, ongoing results, prevailing economic circumstances, volatile commodity prices, and changes in industry conditions and regulations. InPlay’s 2026 financial outlook and guidance provides shareholders with relevant information on management’s expectations for results of operations, excluding any potential acquisitions or dispositions (other than the Acquisition), for such time periods based upon the key assumptions outlined herein. Readers are cautioned that events or circumstances could cause capital plans and associated results to differ materially from those predicted and InPlay’s guidance for 2026 may not be appropriate for other purposes. Accordingly, undue reliance should not be placed on same.
Forward-looking statements or information are based on a number of material factors, expectations or assumptions of InPlay which have been used to develop such statements and information, but which may prove to be incorrect. Although InPlay believes that the expectations reflected in such forward-looking statements or information are reasonable, undue reliance should not be placed on forward-looking statements because InPlay can give no assurance that such expectations will prove to be correct. In addition to other factors and assumptions which may be identified herein, assumptions have been made regarding, among other things: the current U.S. economic, regulatory and/or trade policies; the impact of increasing competition; the general stability of the economic and political environment in which InPlay operates; the timely receipt of any required regulatory approvals; the ability of InPlay to obtain qualified staff, equipment and services in a timely and cost efficient manner; drilling results; the ability of the operator of the projects in which InPlay has an interest in to operate the field in a safe, efficient and effective manner; the ability of InPlay to obtain debt financing on acceptable terms; the anticipated tax treatment of the monthly base dividend; that (i) the tariffs that are currently in effect on goods exported from or imported into Canada continue in effect for an extended period of time, the tariffs that have been threatened are implemented, that tariffs that are currently suspended are reactivated, the rate or scope of tariffs are increased, or new tariffs are imposed, including on oil and natural gas, (ii) the U.S. and/or Canada imposes any other form of tax, restriction or prohibition on the import or export of products from one country to the other, including on oil and natural gas, and (iii) the tariffs imposed or threatened to be imposed by the U.S. on other countries and retaliatory tariffs imposed or threatened to be imposed by other countries on the U.S., will trigger a broader global trade war which could have a material adverse effect on the Canadian, U.S. and global economies, and by extension the Canadian oil and natural gas industry and the Company, including by decreasing demand for (and the price of) oil and natural gas, disrupting supply chains, increasing costs, causing volatility in global financial markets, and limiting access to financing; the duration and impact of tariffs that are currently in effect on goods exported from or imported into Canada, and that other than the tariffs that are currently in effect, neither the U.S. nor Canada (i) increases the rate or scope of such tariffs, reenacts tariffs that are currently suspended, or imposes new tariffs, on the import of goods from one country to the other, including on oil and natural gas, and/or (ii) imposes any other form of tax, restriction or prohibition on the import or export of products from one country to the other, including on oil and natural gas; changes in political and economic conditions, including risks associated with tariffs, export taxes, export restrictions or other trade actions; impacts of any tariffs imposed on Canadian exports into the United States by the Trump administration and any retaliatory steps taken by the Canadian federal government; that InPlay’s results and operations could be adversely affected by economic or geopolitical developments, including protectionist trade policies such as tariffs, or other events; conditions in international markets, including social and political conditions, civil unrest, terrorist activity, governmental changes, restrictions on the ability to transfer capital across borders, tariffs and other protectionist measures; field production rates and decline rates; the ability to replace and expand oil and natural gas reserves through acquisition, development and exploration; the timing and cost of pipeline, storage and facility construction and the ability of InPlay to secure adequate product transportation; future commodity prices; that various conditions to a shareholder return strategy can be satisfied; the ongoing impact of the Russia/Ukraine conflict and wars in the Middle East; currency, exchange and interest rates; regulatory framework regarding royalties, taxes and environmental matters in the jurisdictions in which InPlay operates; and the ability of InPlay to successfully market its oil and natural gas products.
Without limitation of the foregoing, readers are cautioned that the Company’s future dividend payments to shareholders of the Company, if any, and the level thereof will be subject to the discretion of the Board of Directors of InPlay. The Company’s dividend policy and funds available for the payment of dividends, if any, from time to time, is dependent upon, among other things, levels of FAFF, leverage ratios, financial requirements for the Company’s operations and execution of its growth strategy, fluctuations in commodity prices and working capital, the timing and amount of capital expenditures, credit facility availability and limitations on distributions existing thereunder, and other factors beyond the Company’s control. Further, the ability of the Company to pay dividends will be subject to applicable laws, including satisfaction of solvency tests under the Business Corporations Act (Alberta), and satisfaction of certain applicable contractual restrictions contained in the agreements governing the Company’s outstanding indebtedness. Further, the actual amount, the declaration date, the record date and the payment date of any dividend are subject to the discretion of the Board of Directors of InPlay. There can be no assurance that InPlay will pay dividends in the future.
The forward-looking information and statements included herein are not guarantees of future performance and should not be unduly relied upon. Such information and statements, including the assumptions made in respect thereof, involve known and unknown risks, uncertainties and other factors that may cause actual results or events to differ materially from those anticipated in such forward-looking information or statements including, without limitation: changes in industry regulations and legislation (including, but not limited to, tax laws, royalties, and environmental regulations); that (i) the tariffs that are currently in effect on goods exported from or imported into Canada continue in effect for an extended period of time, the tariffs that have been threatened are implemented, that tariffs that are currently suspended are reactivated, the rate or scope of tariffs are increased, or new tariffs are imposed, including on oil and natural gas, (ii) the U.S. and/or Canada imposes any other form of tax, restriction or prohibition on the import or export of products from one country to the other, including on oil and natural gas, and (iii) the tariffs imposed or threatened to be imposed by the U.S. on other countries and retaliatory tariffs imposed or threatened to be imposed by other countries on the U.S., will trigger a broader global trade war which could have a material adverse effect on the Canadian, U.S. and global economies, and by extension the Canadian oil and natural gas industry and the Company, including by decreasing demand for (and the price of) oil and natural gas, disrupting supply chains, increasing costs, causing volatility in global financial markets, and limiting access to financing; the continuing impact of the Russia/Ukraine conflict and war in the Middle East; potential changes to U.S. economic, regulatory and/or trade policies as a result of a change in government; inflation and the risk of a global recession; changes in our planned capital program; changes in our approach to shareholder returns; changes in commodity prices and other assumptions outlined herein; the risk that dividend payments may be reduced, suspended or cancelled; the potential for variation in the quality of the reservoirs in which InPlay operates; changes in the demand for or supply of InPlay’s products; unanticipated operating results or production declines; changes in tax or environmental laws, royalty rates or other regulatory matters; changes in development plans or strategies of InPlay or by third party operators of InPlay’s properties; changes in InPlay’s credit structure, increased debt levels or debt service requirements; inaccurate estimation of InPlay’s light crude oil and natural gas reserve and resource volumes; limited, unfavorable or a lack of access to capital markets; increased costs; a lack of adequate insurance coverage; the impact of competitors; and certain other risks detailed from time-to-time in InPlay’s continuous disclosure documents filed on SEDAR+ including InPlay’s Annual Information Form dated March 30, 2026 and InPlay’s annual management’s discussion & analysis for the year ended December 31, 2025.
This document contains future-oriented financial information and financial outlook information (collectively, “FOFI“) about InPlay’s financial and leverage targets and objectives, potential dividends, and beliefs underlying our 2026 capital budget, anticipated 2026 production and associated guidance, all of which are subject to the same assumptions, risk factors, limitations, and qualifications as set forth in the above paragraphs. The actual results of operations of InPlay and the resulting financial results will likely vary from the amounts set forth in this document and such variation may be material. InPlay and its management believe that the FOFI has been prepared on a reasonable basis, reflecting management’s reasonable estimates and judgments. However, because this information is subjective and subject to numerous risks, it should not be relied on as necessarily indicative of future results. Except as required by applicable securities laws, InPlay undertakes no obligation to update such FOFI. FOFI contained in this document was made as of the date of this document and was provided for the purpose of providing further information about InPlay’s anticipated future business operations and strategy. Readers are cautioned that the FOFI contained in this document should not be used for purposes other than for which it is disclosed herein.
The forward-looking statements and FOFI contained in this document speak only as of the date hereof and InPlay does not assume any obligation to publicly update or revise any of the included forward-looking statements or FOFI, whether as a result of new information, future events or otherwise, except as may be required by applicable securities laws.
Risk Factors to FLI
Risk factors that could materially impact successful execution and actual results of the Company’s 2026 capital program and associated guidance and estimates include:
risks related to an international trade war, including the risk that the U.S. government imposes additional tariffs on Canadian goods, including crude oil and natural gas, and that such tariffs (and/or the Canadian government’s response to such tariffs) adversely affect the demand and/or market price for the Company’s products and/or otherwise adversely affects the Company;
volatility of petroleum and natural gas prices and inherent difficulty in the accuracy of predictions related thereto;
changes in Federal and Provincial regulations;
the Company’s ability to secure financing for the 2026 capital program and longer-term capital plans sourced from AFF, bank or other debt instruments, asset sales, equity issuance, infrastructure financing or some combination thereof; and
those additional risk factors set forth in the Company’s MD&A and most recent Annual Information Form filed on SEDAR+.
Key Budget and Underlying Material Assumptions to FLI
The key budget and underlying material assumptions used by the Company in the development of its 2026 guidance are as follows:
Test Results and Initial Production Rates
Any references in this press release to initial production (“IP”) rates are useful in confirming the presence of hydrocarbons, however, such rates are not determinative of the rates at which such wells will continue production and decline thereafter and are not indicative of long-term performance or ultimate recovery. Test results and IP rates disclosed herein, particularly those short in duration, may not necessarily be indicative of long-term performance or of ultimate recovery. A pressure transient analysis or well-test interpretation has not been carried out and thus certain of the test results provided herein should be considered to be preliminary until such analysis or interpretation has been completed. While encouraging, readers are cautioned not to place reliance on such rates in calculating the aggregate production of the Company.
Production Breakdown by Product Type:
Disclosure of production on a per boe basis in this document consists of the constituent product types as defined in National Instrument 51-101, Standards of Disclosure for Oil and Gas Activities (“NI 51-101“) and their respective quantities disclosed in the table below:
References to crude oil, light oil, NGLs or natural gas production in this press release refer to the light and medium crude oil, natural gas liquids and conventional natural gas product types, respectively, as defined in NI 51-101.
BOE Equivalent
Barrel of oil equivalents or BOEs may be misleading, particularly if used in isolation. A BOE conversion ratio of 6 mcf: 1 bbl is based on an energy equivalency conversion method primarily applicable at the burner tip and does not represent a value equivalency at the wellhead. Given that the value ratio based on the current price of crude oil as compared to natural gas is significantly different than the energy equivalency of 6:1, utilizing a 6:1 conversion basis may be misleading as an indication of value.
Dividends
InPlay’s future shareholder distributions, including but not limited to the payment of dividends, if any, and the level thereof is uncertain. Any decision to pay dividends on InPlay’s shares (including the actual amount, the declaration date, the record date and the payment date in connection therewith and any special dividends) will be subject to the discretion of the Board of Directors and may depend on a variety of factors, including, without limitation, InPlay’s business performance, financial condition, financial requirements, growth plans, expected capital requirements and other conditions existing at such future time including, without limitation, contractual restrictions and satisfaction of the solvency tests imposed on InPlay under applicable corporate law. Further, the actual amount, the declaration date, the record date and the payment date of any dividend are subject to the discretion of the Board of Directors. There can be no assurance that InPlay will pay dividends in the future.
WEST HARRISON, N.Y.–(BUSINESS WIRE)– Sky Harbour Group Corporation (NYSE: SKYH, SKYH WS) (“SHG” or the “Company”), an aviation infrastructure company building the first nationwide network of Home Base Operator (“HBO”) campuses for business aircraft, announced the release of its unaudited financial results for the three and six months ended June 30, 2026 on Form 10-Q. The Company also announced the filing of its unaudited financial results for the three and six months ended June 30, 2026 for Sky Harbour Capital LLC (“Obligated Group”) with MSRB/EMMA. Please see the following links to access the filings:
Financial Highlights on a Consolidated Basis for SHG include:
Constructed assets and construction in progress reached over $393 million at quarter-end, a year-to-date increase of $65 million.
Q2 2026 consolidated revenues increased approximately 50% as compared to Q2 2025 and 13% as compared to Q1 2026.
Q2 2026 net cash provided by operating activities was approximately $0.5 million, compared to net cash used of approximately $3.9 million in Q1 2026. This is the first quarter of recurrent positive operating cash flow in the Company’s history.
Quarter-end liquidity and capital resources are strong, with consolidated cash and US Treasuries totaling $206.9 million and access to an additional $130.2 million of capacity under the committed JP Morgan drawdown construction bank facility (“JPM Facility”).
These figures exclude $40 million in proceeds from a registered direct common stock issuance that settled earlier today.
Refer to our 10-Q for presentation of GAAP net income and adjusted EBITDA (Non-GAAP) results.
Financial Highlights at Sky Harbour Capital LLC (“Obligated Group”) include:
Q2 2026 Obligated Group revenues increased 79% as compared to Q2 2025 and 22% as compared to Q1 2026.
Q2 2026 net cash provided by operating activities was approximately $2.9 million in Q2 2026, compared to $2.2 million in Q2 2025.
Cash and US Treasuries at the Obligated Group totaled $26.2 million as of June 30th, 2026. Separately, proceeds of the Series 2026 Bonds are available for the construction completion of Phase 2 at Dallas Addison Airport (“ADS”).
Debt service coverage tests, calculated as per the Series 2021 bond indenture for the period ending June 30th, 2026, and the next-twelve-months budget, are compliant with all applicable covenant ratios.
During the quarter, the Company contributed $20.0 million as equity to the Obligated Group to reimburse past cash advances from the Company to partially fund certain expenditures associated with the construction of Phase 2 at Miami–Opa Locka Executive Airport (“OPF”) . OPF Phase 2 opened for operations in May. In addition, the Company contributed $7.3 million to the Obligated Group from the Series 2026 Bonds for construction expenditures at Phase 2 at ADS. ADS Phase 2 is expected to be completed by year end. The latter will constitute the final project of the first vintage of campuses financed by the Series 2021 Bonds under the Obligated Group.
Update on Leasing Activities
Stabilized campuses: The Company continues to enjoy higher-than-forecast revenue per square foot at its stabilized campuses, with economic occupancy reaching as high as 132% at one campus. Revenue per square foot continues to grow as original hangar leases turn over, with an average revenue escalation of 19% upon re-lease for the trailing 12 months as of 8/1/2026 (excluding typical annual escalations of CPI with a floor of 4%).
OPF combined occupancy is now 80%, with high leasing velocity, and all leases in 2026 signed at Tier-1 rates. As of today, ADS Phase 1, Phoenix Deer Valley Airport (“DVT”) Phase 1 and Denver’s Centennial Airport (“APA”) have achieved 98%, 76% and 44% occupancy respectively.
San Jose Mineta Internation Airport (“SJC”) Phase 1 has reached 132% economic occupancy. SJC Phase 2, not yet constructed, has been 100% pre-leased.
Bradley International Airport (“BDL”) in Hartford, CT is on schedule and expected to be completed by December 2026.
Salt Lake City International Airport (“SLC”) is on schedule and expected to be completed in Q1 2027.
Hudson Valley Regional Airport (“POU”), in Poughkeepsie, NY is on schedule and expected to be completed by Q3 2027.
Orlando Executive Airport (“ORL”) is on schedule and expected to be completed by Q3 2027.
BDL and SLC are part of our second vintage portfolio of airport projects (“Portfolio 2”), financed through the JPM Facility and the Series 2026 Bonds. Their construction progress can be monitored through a monthly construction report filed with MSRB/EMMA: https://emma.msrb.org/P22066264-P21570861-P22031143.pdf
Portfolio 2 Development
Washington Dulles International Airport (“IAD”), Trenton-Mercer Airport (“TTN”) in New Jersey, and Chicago Executive Airport (“PWK”) are all scheduled to begin construction by Q4 2026.
Update on Airport Operations
As of Q2 2026, the Company is operating 1.04 million square feet of hangar and associated office and support space, with approximately 2 million square feet of aviation ramp and vehicle parking.
The campus-level OPEX-Efficiency Program is in implementation at pilot campuses across the country, with initial cost-savings already realized. The program will be implemented across all campuses in the coming quarters.
The Company launched its proprietary selection, training, and professional development program for line crew and Harbour Masters (campus leaders), including proprietary training equipment, an HBO Syllabus, and standard operating procedures. The HBO service model has become a major differentiator for Sky Harbour and the Company will continue to invest in enhancing its resident services.
Update on Capital Formation
Earlier today, the Company closed a $40 million common stock issuance at $10.00 per share through a registered direct placement with two new long-term investors; funds managed by Oasis Management Company and a prominent member of the California Bay Area tech community. The proceeds of this primary placement are expected to be paired with an expanded tax-exempt bank facility to fund additional hangar projects totaling approximately 400,000 rentable square feet.
As of June 30th, 2026, the Company has drawn nearly $70 million from the JPM Facility for capital expenditures and reimbursement of prior advances related to projects at BDL, SLC and OPF Phase 2. As of today, there is an additional $130 million of committed undrawn capacity under the JPM Facility.
Reaffirmation of 2026 End of Year Guidance
We expect to achieve consolidated revenues of $42-46 million on an annualized run-rate basis by year end, up from an annualized run rate of $39.4 million in Q2 2026.
We expect to achieve consolidated Adjusted EBITDA of $4-6 million on an annualized run rate basis by year end.
CEO Tal Keinan commented: “The Sky Harbour HBO model is an increasingly established triple-win, aligning the interests of Airports, the Business Aviation Community, and Sky Harbour shareholders. This drives the Site Acquisition pipeline, which is at its most robust to date. The Sky Harbour Development team is meeting its construction-pace and quality targets, while continuing to lower development costs. Per-square-foot revenue is exceeding forecasts. And the Sky Harbour Operations team continues delivering the safest, fastest and most secure service offering in Business Aviation.”
CFO Francisco Gonzalez commented: “We welcome two long-term strategic investors to the Sky Harbour shareholder family. The $40 million (raised with minimal transaction costs given existing shelf and without banker fees) will be paired with additional tax-exempt debt to fund approximately 400,000 new square feet of hangar, an accretive exercise for our shareholders. At $10 a share, it represents a relatively small discount to our last 30-day (thru 8/10) VWAP of $10.49, a very efficient execution.”
CEO Tal Keinan commented on the equity issuance: “Sky Harbour shareholders have been active partners, helping us to secure the top airport sites in the country and, increasingly, supporting our ambition to serve the top business aircraft operators in the country. We are honored to be joined today by two new partners who will propel that part of our business forward.”
About Sky Harbour
Sky Harbour Group Corporation is an aviation infrastructure company developing the first nationwide network of Home-Basing campuses for business aircraft. The company develops, leases, and manages general aviation hangar campuses across the United States. Sky Harbour’s Home-Basing offering aims to provide private and corporate residents with the best physical infrastructure in business aviation, coupled with dedicated service, tailored specifically to based aircraft, offering the shortest time to wheels-up in business aviation. To learn more, visit www.skyharbour.group.
Forward Looking Statements
Certain statements made in this release are “forward looking statements” within the meaning of the “safe harbor” provisions of the United States Private Securities Litigation Reform Act of 1995, including statements about the financial condition, results of operations, earnings outlook and prospects of SHG, including statements regarding our expectations for future results, our expectations for future ground leases, our plans for future capital raising activity, the transactions contemplated by the letter of intent, our expectations on future construction and development activities and lease renewals, and our plans for future financings. When used in this press release, the words “plan,” “believe,” “expect,” “anticipate,” “intend,” “outlook,” “estimate,” “forecast,” “project,” “continue,” “could,” “may,” “might,” “possible,” “potential,” “predict,” “should,” “would” and other similar words and expressions (or the negative versions of such words or expressions) are intended to identify forward-looking statements, but the absence of these words does not mean that a statement is not forward-looking. The forward-looking statements are based on the current expectations of the management of Sky Harbour Group Corporation (the “Company”) as applicable and are inherently subject to uncertainties and changes in circumstances. These forward-looking statements involve a number of risks, uncertainties or other assumptions that may cause actual results or performance to be materially different from those expressed or implied by these forward-looking statements. For more information about risks facing the Company, see the Company’s annual report on Form 10-K for the year ended December 31, 2025 and other filings the Company makes with the SEC from time to time. The Company’s statements herein speak only as of the date hereof, and the Company undertakes no obligation to update or revise any forward-looking statements, whether as a result of new information, future events or otherwise, except as required by law.
Key Performance Indicators
We use a number of metrics, including annualized revenue run rate per leased rentable square foot, to help us evaluate our business, measure our performance, identify trends affecting our business, formulate business plans, and make strategic decisions. Our key performance indicators may be calculated in a manner different than similar key performance indicators used by other issuers. These metrics are estimated operating metrics and not projections, nor actual financial results, and are not indicative of current or future performance.
Saguenay, Quebec–(Newsfile Corp. – August 13, 2026) – First Phosphate Corp. (NASDAQ: PHOS) (CSE: PHOS) (OTCQX: FRSPF) (FSE: KD0) (“First Phosphate” or the “Company“) is pleased to announce that its board and management team will be present at the Nasdaq Market Site (Times Square, New York) on Thursday, August 13, 2026, to ring the Nasdaq Opening Bell in celebration of the Company’s recent listing on the Nasdaq Global Market.
The ceremony recognizes the Company’s journey from its founding to a recognized leader in the building and onshoring of a vertically integrated mine-to-market lithium iron phosphate (“LFP”) battery supply chain for North America.
“We are pleased to be able to offer accessibility in the shares of First Phosphate to investors around the world who wish exposure to rare North American igneous phosphate,” says John Passalacqua, CEO of First Phosphate. “It has been our goal since the outset to build Saguenay-Lac-St-Jean, Quebec into the mine-to-market LFP battery valley of North America.”
First Phosphate (NASDAQ: PHOS) (CSE: PHOS) (OTCQX: FRSPF) (FSE: KD0) is a mineral exploration and development and clean technology company dedicated to building and reshoring a vertically integrated mine-to-market supply chain for the production of LFP batteries in North America. Target markets include energy storage, data centers, robotics, mobility, and national security. First Phosphate’s flagship Bégin-Lamarche property, located in Saguenay-Lac-Saint-Jean, Québec, Canada, represents a rare North American igneous phosphate resource producing high-purity phosphate characterized by very low levels of impurities.
Forward-Looking Information and Cautionary Statements
This release includes certain statements that may be deemed “forward-looking information”. Any statement that discusses predictions, expectations, beliefs, plans, projections, objectives, assumptions, future events or performance (often but not always using phrases such as “expects”, or “does not expect”, “is expected”, “anticipates” or “does not anticipate”, “plans”, “budget”, “scheduled”, “forecasts”, “estimates”, “believes” or “intends” or variations of such words and phrases or stating that certain actions, events or results “may” or “could”, “would”, “might” or “will” be taken to occur or be achieved) are not statements of historical fact and may be forward-looking information. In particular, this press release contains forward-looking information relating to, among other things, the building and onshoring of a vertically integrated mine-to-market lithium iron phosphate battery supply chain for North America and the Company’s future contributions to such endeavour.
Although the Company believes the expectations expressed in such forward-looking statements are based on reasonable assumptions, such statements are not guarantees of future performance and actual results or developments may differ materially from those forward-looking statements. Factors that could cause actual results to differ materially from those in forward-looking statements include market prices, development and exploration successes, and continued availability of capital and financing and general economic, market or business conditions. These statements are based on a number of assumptions including, among other things, assumptions regarding general business and economic conditions that engineering and construction timetables and capital costs for the Company’s, exploration, development and expansion projects are correctly estimated and not affected by unforeseen circumstances; the ability to obtain financing for its proposed operations on acceptable terms; no material deterioration in general business and economic conditions; no material delays in obtaining permits and other approvals; no significant disruptions affecting the activities of the Company or its ability to access required project equipment and services, and operating supplies in sufficient quantities and on a timely basis; inflation and prices for Company project inputs being approximately consistent with anticipated levels; the ability to complete the exploration and development programs consistent with the Company’s expectations; commodity price expectations including assumptions for P2O5; the Company’s relationship with local municipalities and First Nations remaining consistent with the Company’s expectations; the Company’s relationship with other third-party partners and suppliers remaining consistent with the Company’s expectations; and government relations and actions being consistent with Company expectations. Investors are cautioned that any such statements are not guarantees of future performance and actual results or developments may differ materially from those projected in the forward-looking statements. Accordingly, readers should not place undue reliance on the forward-looking information contained in this press release. The Company does not assume any obligation to update or revise its forward-looking statements, whether because of new information, future events or otherwise, except as required by applicable law. All forward-looking information contained in this release is qualified by these cautionary statements.
Flock Safety, the license plate reader company at the center of a spreading privacy controversy, unveiled new privacy guardrails Thursday in response to months of backlash over allegations its technology enables mass surveillance. CEO Garrett Langley addressed the criticism directly, stating the company is not Big Brother and is focused on protecting people.
The changes are specific. Flock is cutting its default data retention window from 30 days down to seven, giving customers control over which offense types can be searched, and making case codes mandatory rather than optional for every search. The company is also adding mandatory audit logs and a feature that automatically blocks users when the system detects abnormal search patterns, pending review. Flock says these changes exceed what most states currently require by law.
Why Flock Is Making These Changes Now
The backlash has been building for months. A Washington Post investigation published earlier this month found at least 50 law enforcement officers had been charged with or accused of misusing license plate reader systems, including using the technology to stalk women without their knowledge or consent, with 46 of those cases involving Flock’s system specifically. The EFF and ACLU have both raised formal concerns, with EFF describing the technology as susceptible to grave abuses, including tracking protesters and targeting people by immigration status. Some communities have cancelled contracts outright, and in more extreme cases, citizens have covered or destroyed cameras. Last month, Flock removed a feature that detected human screaming following a nine-month EFF pressure campaign.
The Business Is Growing Despite the Controversy
Here is what makes this genuinely relevant for investors. Flock’s revenue is accelerating even as the backlash intensifies. Langley disclosed the company’s annual revenue run rate climbed to $500 million in June, up from $300 million in January, more than 65% growth in six months. More than half of that growth is coming from newer product lines beyond license plate cameras, including surveillance drones, mobile security trailers, and audio detection systems for gunshots and crashes.
Langley was candid about the strategy. The core license plate reader market is largely fixed, since Flock does not add new cities very often once a market matures. Growth going forward depends on drones, trailers, and software, not the camera network itself. Flock, backed by more than $1 billion from Andreessen Horowitz and other venture investors, recently raised $200 million in equity and $300 million in venture debt at an $8.3 billion valuation.
A Public Company in the Same Space Just Had a Rough Day
Flock has no public ticker, but Cellebrite (Nasdaq: CLBT), which makes digital forensics software for law enforcement, saw its stock plunge nearly 32% Thursday after missing revenue estimates, cutting guidance, and announcing an abrupt CEO change. That drop was driven by company-specific factors rather than the Flock controversy directly. Still, Cellebrite’s management cited new procurement and data-sovereignty requirements as a factor delaying deals, echoing the broader regulatory scrutiny now facing government surveillance technology generally.
What It Means for Investors
Together, these stories show the same dynamic from different angles. Flock is proactively building governance guardrails to get ahead of political backlash before it costs more contracts. Cellebrite’s guidance cut shows how quickly new compliance requirements can delay revenue even for an established public player. For investors evaluating companies in this space, contract renewal risk and public trust are becoming financially material factors, not separate from growth metrics.