Release – Alliance Resource Partners, L.P. Reports Second Quarter Financial and Operating Results; Declares Quarterly Cash Distribution of $0.60 Per Unit; and Updates 2026 Guidance

Alliance Resource Partners, L.P. Logo

Research News and Market Data on ARLP

2026 Quarter Highlights

  • Total revenue of $551.6 million, net income of $79.6 million, and Adjusted EBITDA of $185.7 million, up year-over-year 0.7%, 33.9% and 14.7%, respectively
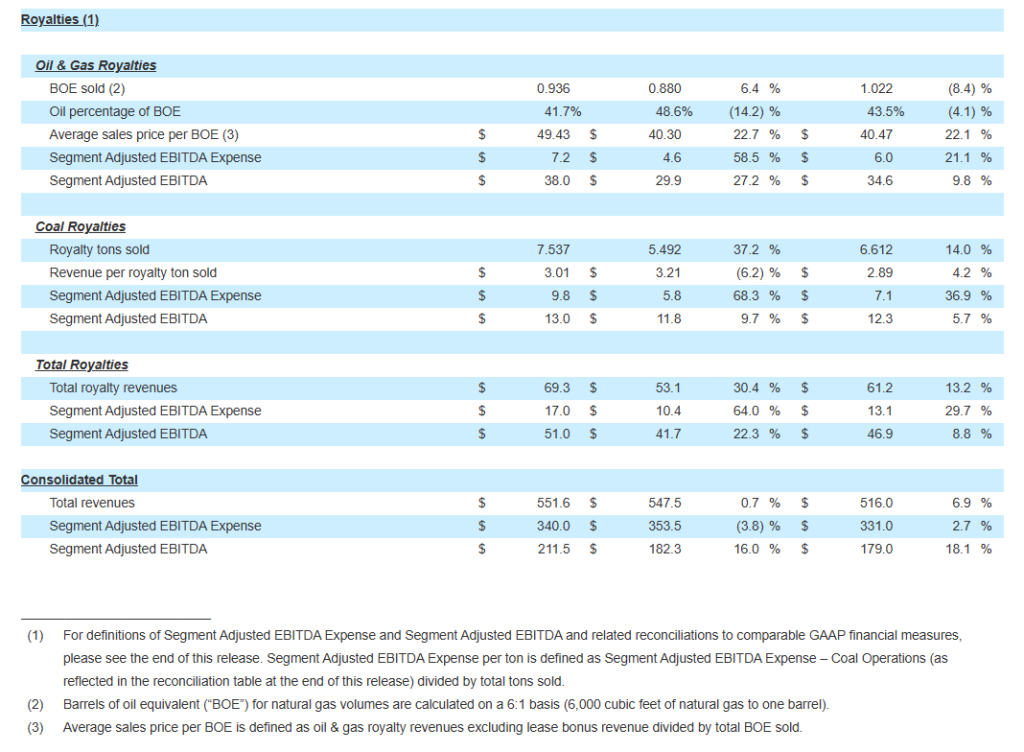
  • Record oil & gas royalty revenues of $46.3 million, up 30.5% year-over-year
  • Secured 21.2 million additional committed and priced sales tons over the 2026 – 2031 time period
  • Distributable Cash Flow of $108.2 million and Distribution Coverage Ratio of 1.39x both improved by 39.0% sequentially
  • Declares quarterly cash distribution of $0.60 per unit, or $2.40 per unit annualized
  • On July 1, 2026, completed our $206.2 million acquisition of oil & gas mineral interests, adding 48,500 net royalty acres to the Oil & Gas Royalties segment

TULSA, Okla.–(BUSINESS WIRE)–Alliance Resource Partners, L.P. (NASDAQ: ARLP) (“we,” “us,” “our,” “ARLP” or the “Partnership”) today reported financial and operating results for the three and six months ended June 30, 2026 (the “2026 Quarter” and “2026 Period,” respectively). This release includes comparisons of results to the three and six months ended June 30, 2025 (the “2025 Quarter” and “2025 Period,” respectively) and to the quarter ended March 31, 2026 (the “Sequential Quarter”). All references in the text of this release to “net income” refer to “net income attributable to ARLP.” For a definition of Distributable Cash Flow, Distribution Coverage Ratio, EBITDA, Adjusted EBITDA and Segment Adjusted EBITDA Expense and related reconciliations to comparable GAAP financial measures, please see the end of this release.

For the 2026 Quarter, net income increased 33.9% to $79.6 million, or $0.61 per basic and diluted limited partner unit, compared to $59.4 million, or $0.46 per basic and diluted limited partner unit for the 2025 Quarter primarily as a result of higher total revenues and equity method investment income, and the impact of an impairment loss taken in the 2025 Quarter on a preferred equity investment. Total revenues increased to $551.6 million in the 2026 Quarter compared to $547.5 million for the 2025 Quarter as a result of record oil & gas royalty revenues, increased coal sales volumes and higher other revenues, partially offset by lower coal sales price per ton. Adjusted EBITDA increased 14.7% to $185.7 million in the 2026 Quarter compared to $161.9 million in the 2025 Quarter.

Compared to the Sequential Quarter, total revenues increased 6.9% due to higher coal sales volumes, which rose 8.9% to 8.6 million tons sold in the 2026 Quarter compared to 7.9 million tons sold in the Sequential Quarter, partially offset by 2.7% lower coal sales prices per ton. Net income increased by $70.5 million compared to the Sequential Quarter driven by higher revenues, increased investment income, a smaller decline in the fair value of our digital assets, and a $37.8 million non-cash asset impairment charge in the Sequential Quarter at our Mettiki mine. Adjusted EBITDA for the 2026 Quarter increased by 19.8% compared to the Sequential Quarter.

Total revenues decreased slightly to $1.07 billion for the 2026 Period compared to $1.09 billion for the 2025 Period primarily due to lower coal sales, partially offset by record oil & gas royalty revenues. Net income for the 2026 Period was $88.7 million, or $0.68 per basic and diluted limited partner unit, compared to $133.4 million, or $1.03 per basic and diluted limited partner unit, for the 2025 Period. Adjusted EBITDA for the 2026 Period increased 5.8% to $340.7 million compared to $321.9 million for the 2025 Period.

CEO Commentary

“Our coal operations performed well during the quarter, highlighted by strong productivity and disciplined cost control,” said Joseph W. Craft III, Chairman, President and Chief Executive Officer. “River View and Tunnel Ridge generated superior operating results, driving Segment Adjusted EBITDA expense per ton sold lower by 6.3% year-over-year and 6.6% sequentially. With Hamilton recently returning to longwall production and no additional longwall moves expected until 2027, we believe our operations are well-positioned to meaningfully increase production and cash flow generation during the second half of this year.”

Mr. Craft added, “Our Oil & Gas Royalties segment delivered record quarterly revenue of $46.3 million and Segment Adjusted EBITDA of $38.0 million, driven by stronger realized commodity pricing. Subsequent to quarter end, we successfully closed the $206.2 million AllDale III & IV acquisition. With this transaction, our cumulative investment in oil & gas royalties now exceeds $1.0 billion, marking a significant milestone in the evolution of ARLP’s diversified natural resource platform.”

Mr. Craft continued, “Repeating my comments when we announced our agreement to buy these reserves, this acquisition accelerates the continued growth of our Oil & Gas Royalties segment, adding scale and development upside across multiple U.S. basins, anchored by a meaningful Permian position. It also expands our natural gas footprint with entry into the Haynesville, a resource play well-positioned to benefit from long-term LNG export demand growth. We believe this acquisition will be immediately accretive to ARLP’s free cash flow per unit and strengthens ARLP’s long-term royalty platform, broadens our exposure to high-quality operators and advances our long-term strategy of building a durable, cash-generating royalties business that complements our existing coal operations.”

Segment Results and Analysis (Unaudited)
Coal Operations

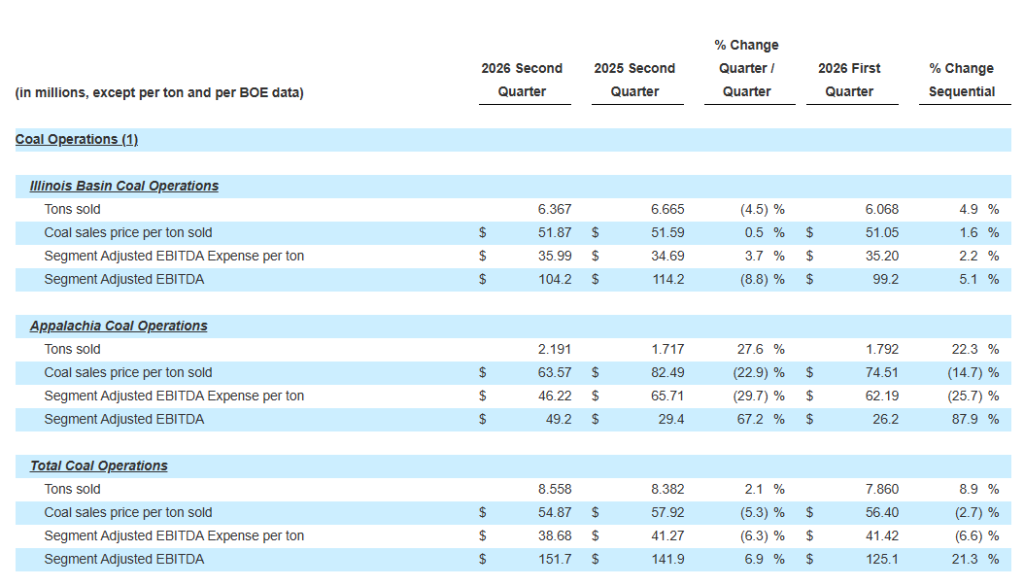
Coal sales volumes decreased by 4.5% in the Illinois Basin compared to the 2025 Quarter due primarily to decreased tons sold from our Hamilton mine as a result of a planned extended longwall move during the 2026 Quarter, partially offset by a strong sales performance and productivity at our River View complex. Compared to the Sequential Quarter, tons sold increased by 4.9% driven primarily by River View’s strong performance during the 2026 Quarter. In Appalachia, tons sold increased by 27.6% and 22.3% compared to the 2025 Quarter and Sequential Quarter, respectively, primarily as a result of increased production at our Tunnel Ridge longwall operation due to improved recoveries and higher productivity. Coal sales price per ton decreased by 22.9% and 14.7% in Appalachia compared to the 2025 Quarter and Sequential Quarter, respectively, primarily due to an increased sales mix of lower priced Tunnel Ridge sales volumes in the 2026 Quarter and reduced sales price per ton at Mettiki. ARLP ended the 2026 Quarter with total coal inventory of 0.8 million tons, representing a decrease of 0.3 million tons compared to the end of both the 2025 Quarter and Sequential Quarter.

Segment Adjusted EBITDA Expense per ton in the Illinois Basin increased 3.7% and 2.2% compared to the 2025 Quarter and Sequential Quarter, respectively, due primarily to the planned extended longwall move at our Hamilton mine during the 2026 Quarter. In Appalachia, Segment Adjusted EBITDA Expense per ton for the 2026 Quarter decreased by 29.7% and 25.7% compared to the 2025 Quarter and Sequential Quarter, respectively, as a result of increased production at our Tunnel Ridge operation.

Royalties

Segment Adjusted EBITDA for the Oil & Gas Royalties segment increased to a record $38.0 million in the 2026 Quarter compared to $29.9 million and $34.6 million in the 2025 Quarter and Sequential Quarter, respectively, primarily due to higher average sales prices per MBOE, which increased 22.7% and 22.1%, respectively, partially offset by higher expenses. Oil & gas royalty volumes increased 6.4% compared to the 2025 Quarter as a result of increased drilling and completion activities on our acreage combined with additional oil & gas mineral interests acquired. Volumes decreased 8.4% sequentially due to natural decline from high-ownership pads completed in the Sequential Quarter.

Segment Adjusted EBITDA for the Coal Royalties segment increased to $13.0 million in the 2026 Quarter compared to $11.8 million and $12.3 million in the 2025 Quarter and Sequential Quarter, respectively, due to higher royalty tons sold, primarily from Tunnel Ridge and River View, partially offset by higher expenses.

Balance Sheet and Liquidity

As of June 30, 2026, total debt and finance leases were outstanding in the amount of $590.2 million. The Partnership’s total and net leverage ratios were 0.82 times and 0.67 times debt to trailing twelve months Adjusted EBITDA, respectively, as of June 30, 2026. ARLP ended the 2026 Quarter with total liquidity of $424.0 million, which included $111.2 million of cash and cash equivalents and $312.8 million of borrowings available under its revolving credit and accounts receivable securitization facilities. In addition, ARLP held 646 bitcoins valued at $37.9 million as of June 30, 2026.

Distributions

ARLP announced today that the Board of Directors of ARLP’s general partner approved a cash distribution to unitholders for the 2026 Quarter of $0.60 per unit (an annualized rate of $2.40 per unit), payable on August 14, 2026, to all unitholders of record as of the close of trading on August 7, 2026. The Distribution Coverage Ratio for the 2026 Quarter was 1.39x.

Concurrent with this announcement, we are providing qualified notice to brokers and nominees that hold ARLP units on behalf of non-U.S. investors under Treasury Regulation Section 1.1446-4(b) and (d) and Treasury Regulation Section 1.1446(f)-4(c)(2)(iii). Brokers and nominees should treat one hundred percent (100%) of ARLP’s distributions to non-U.S. investors as being attributable to income that is effectively connected with a United States trade or business. In addition, brokers and nominees should treat one hundred percent (100%) of the distribution as being in excess of cumulative net income for purposes of determining the amount to withhold. Accordingly, ARLP’s distributions to non-U.S. investors are subject to federal income tax withholding at a rate equal to the highest applicable effective tax rate plus ten percent (10%). Nominees, and not ARLP, are treated as the withholding agents responsible for withholding on the distributions received by them on behalf of non-U.S. investors.

July 2026 Acquisition of Oil & Gas Royalties

On July 1, 2026, we completed the previously announced acquisition of certain general partner and limited partner interests in AllDale Minerals III, LP and AllDale Minerals IV, LP (collectively “AllDale III & IV”) for approximately $206.2 million, subject to customary post-closing adjustments. The AllDale III & IV acquisition expands and diversifies our portfolio of mineral and royalty interests through the added control of approximately 48,500 net royalty acres across premier basins and resource plays including the Permian, Anadarko, Bakken and Haynesville.

ARLP funded the acquisition using a combination of cash on hand, borrowings under its revolving credit facility, and a new $150.0 million term loan at its wholly owned subsidiary Alliance Minerals, LLC.

Outlook

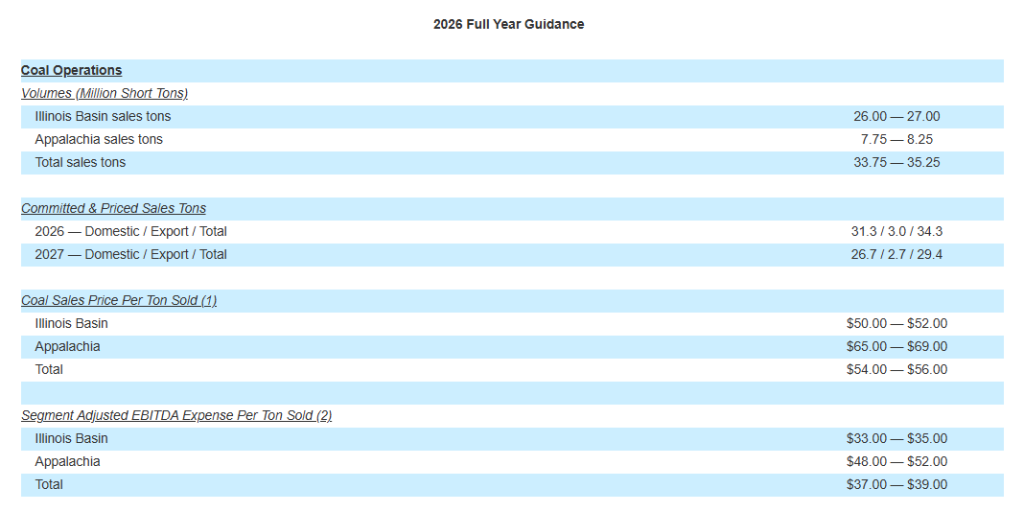
“Due to our strong contracted sales book, we were minimally impacted this quarter by lower domestic coal demand in the first half of this year due to mild weather and lower natural gas prices,” Mr. Craft continued. “During the quarter, we continued to add to our sales book by securing an additional 21.2 million committed and priced coal sales tons over the 2026 to 2031 time period. Our expected 2026 coal sales tons are essentially fully committed at the midpoint of guidance, and we now have 29.4 million tons committed and priced for 2027 delivery. We believe this level of forward commitment reflects both the strategic importance of our coal supply and the confidence customers place in ARLP’s ability to deliver.”

Mr. Craft concluded, “We are increasing our full-year oil & gas royalties volume guidance to reflect the contribution of the AllDale III & IV acquisition beginning in the third quarter of 2026. Similar to our coal segment, we believe our Oil & Gas Royalties segment is well-positioned to meaningfully increase production and cash flow generation during the second half of this year. Looking ahead, our strategy within this segment is focused on reducing leverage, maintaining financial flexibility, and pursuing disciplined acquisition opportunities that enhance long-term unitholder value.”

Guidance

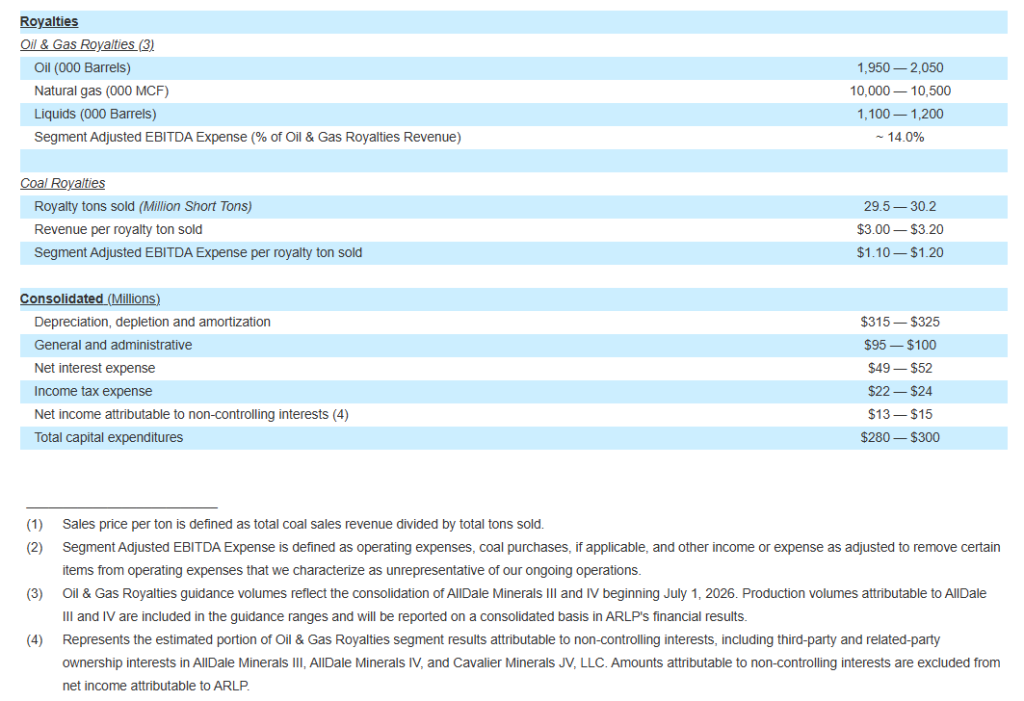
ARLP is updating the following guidance for the full year ending December 31, 2026:
Derivatives

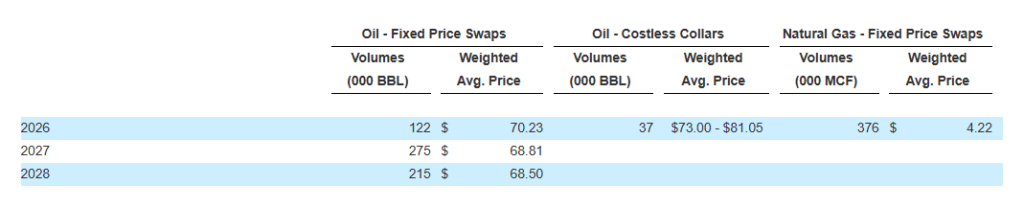
As of the date of this press release, ARLP had the following outstanding derivative contracts assumed in connection with the AllDale III & IV acquisition. When aggregating multiple contracts, the weighted average contract price is disclosed.
Conference Call

A conference call regarding ARLP’s 2026 Quarter financial results and updated 2026 guidance is scheduled for today at 10:00 a.m. Eastern. To participate in the conference call, dial (877) 407-0784 and request to be connected to the Alliance Resource Partners, L.P. earnings conference call. International callers should dial (201) 689-8560 and request to be connected to the same call. Investors may also listen to the call via the “Investors” section of ARLP’s website at www.arlp.com.

An audio replay of the conference call will be available for approximately one week. To access the audio replay, dial U.S. Toll Free (844) 512-2921; International Toll (412) 317-6671 and request to be connected to replay using access code 13761715.

About Alliance Resource Partners, L.P.

ARLP is a diversified natural resource company that is currently the second largest coal producer in the eastern United States, supplying reliable, affordable energy domestically and internationally to major utilities, metallurgical and industrial users. ARLP also generates operating and royalty income from mineral interests it owns in strategic coal and oil & gas producing regions in the United States. In addition, ARLP is positioning itself as a reliable energy partner for the future by pursuing opportunities that support the growth and development of energy-related technologies and infrastructure.

News, unit prices and additional information about ARLP, including filings with the Securities and Exchange Commission (“SEC”), are available at www.arlp.com. For more information, contact the investor relations department of ARLP at (918) 295-7673 or via e-mail at [email protected].

The statements and projections used throughout this release are based on current expectations. These statements and projections are forward-looking, and actual results may differ materially. These projections do not include the potential impact of any mergers, acquisitions or other business combinations that may occur after the date of this release. We have included more information below regarding business risks that could affect our results.

FORWARD-LOOKING STATEMENTS: With the exception of historical matters, any matters discussed in this press release are forward-looking statements that involve risks and uncertainties that could cause actual results to differ materially from projected results. Those forward-looking statements include expectations with respect to our future financial and operational performance, coal and oil & gas consumption and expected future prices, our ability to increase or maintain unitholder distributions in future quarters, business plans and potential growth with respect to our energy and infrastructure investments, optimizing cash flows, reducing operating and capital expenditures, infrastructure projects at our existing properties, growth in domestic electricity demand, preserving liquidity and maintaining financial flexibility, and our future repurchases of units. These risks to our ability to achieve these outcomes include, but are not limited to, the following: decline in the coal industry’s share of electricity generation, including as a result of environmental concerns related to coal mining and combustion, the cost and perceived benefits of other sources of electricity and fuels, such as oil & gas, nuclear energy, and renewable fuels and the retirement of coal-fired power plants in the U.S.; our ability to provide fuel for growth in domestic energy demand, should it materialize; changes in macroeconomic and market conditions and market volatility, and the impact of such changes and volatility on our financial position; changes in global economic and geo-political conditions or changes in industries in which our customers operate; changes in commodity prices, demand and availability which could affect our operating results and cash flows; impacts of geopolitical events, including the conflicts in Ukraine and in the Middle East, including Iran and disruption of maritime traffic through the Strait of Hormuz; actions of the major oil-producing countries with respect to oil production volumes and prices and the direct and indirect impacts over the near and long term on oil & gas exploration and production operations at the properties in which we hold mineral interests; changes in competition in domestic and international coal markets and our ability to respond to such changes; potential shut-ins of production by the operators of the properties in which we hold oil & gas mineral interests due to low commodity prices or the lack of downstream demand or storage capacity; risks associated with the expansion of and investments into the infrastructure of our operations and properties, including the timing of such investments coming online; our ability to identify and complete acquisitions and to successfully integrate such acquisitions into our business and achieve the anticipated benefits therefrom; our ability to identify and invest in new energy and infrastructure ventures; the success of our development and growth plans for our wholly owned subsidiary, Matrix Design Group, LLC, and our investments in emerging and other infrastructure and technology companies; dependence on significant customer contracts, and failure of customers to renew existing contracts upon expiration; adjustments made in price, volume, or terms to existing coal supply agreements; the effects of and changes in trade, monetary and fiscal policies and laws, and the results of central bank policy actions including interest rates, bank failures, and associated liquidity risks; the effects of and changes in taxes or tariffs and other trade measures adopted or threatened by the United States and foreign governments, including the imposition of or increase in tariffs on steel and/or other raw materials; legislation, regulations, and court decisions and interpretations thereof, both domestic and foreign, including those relating to the environment and the release of greenhouse gases, such as state legislation seeking to impose liability on a wide range of energy companies under greenhouse gas “superfund” laws, mining, miner health and safety, hydraulic fracturing, and health care; deregulation of the electric utility industry or the effects of any adverse change in the coal industry, electric utility industry, or general economic conditions; investors’ and other stakeholders’ attention to sustainability matters; liquidity constraints, including those resulting from any future unavailability of financing; customer bankruptcies, cancellations or breaches to existing contracts, or other failures to perform; customer delays, failure to take coal under contracts or defaults in making payments; our productivity levels and margins earned on our coal sales; disruptions to oil & gas exploration and production operations at the properties in which we hold mineral interests; changes in equipment, raw material, service or labor costs or availability, including due to inflationary pressures or tariffs; changes in our ability to recruit, hire and maintain labor; our ability to maintain satisfactory relations with our employees; increases in labor costs, including increases in the costs of health insurance, adverse changes in work rules, or cash payments or projections associated with workers’ compensation claims; increases in transportation costs and risk of transportation delays or interruptions; operational interruptions due to geologic, permitting, labor, weather, supply chain shortage of equipment or mine supplies, or other factors; risks associated with major mine-related accidents, mine fires, mine floods or other interruptions; results of litigation, including claims not yet asserted; foreign currency fluctuations that could adversely affect the competitiveness of our coal abroad; difficulty maintaining our surety bonds for mine reclamation as well as workers’ compensation and black lung benefits; difficulty in making accurate assumptions and projections regarding post-mine reclamation as well as pension, black lung benefits, and other post-retirement benefit liabilities; uncertainties in estimating and replacing our coal mineral reserves and resources; uncertainties in estimating and replacing our oil & gas reserves; uncertainties in the amount of oil & gas production due to the level of drilling and completion activity by the operators of our oil & gas properties; the impact of current and potential changes to federal or state tax rules and regulations, including a loss or reduction of benefits from certain tax deductions and credits; difficulty obtaining commercial property insurance, and risks associated with our participation in the commercial insurance property program; evolving cybersecurity risks, such as those involving unauthorized access, denial-of-service attacks, malicious software, data privacy breaches by employees, insiders or others with authorized access, cyber or phishing attacks, ransomware, malware, social engineering, physical breaches, or other actions; and difficulty in making accurate assumptions and projections regarding future revenues and costs associated with equity investments in companies we do not control.

Additional information concerning these, and other factors can be found in ARLP’s public periodic filings with the SEC, including ARLP’s Annual Report on Form 10-K for the year ended December 31, 2025, filed on February 26, 2026, and ARLP’s Quarterly Report on Form 10-Q for the quarter ended March 31, 2026, filed on May 8, 2026. Except as required by applicable securities laws, ARLP does not intend to update its forward-looking statements.

View full release here.

Contacts

Investor Relations Contact
Cary P. Marshall
Senior Vice President and Chief Financial Officer
918-295-7673
[email protected]

Release – V2X Joins S&P SmallCap 600 Index

V2X

Research News and Market Data on VVX

July 27, 2026

RESTON, Va., July 27, 2026 /PRNewswire/ — V2X, Inc. (NYSE: VVX), a leading provider of global mission solutions supporting national security, defense, and civilian customers, today announced it has joined the S&P SmallCap 600 Index, following S&P Dow Jones Indices’ previously announced rebalancing.

“Joining the S&P SmallCap 600 is an important milestone for V2X and reflects the progress we’ve made in executing our strategy and delivering long-term value,” said Jeremy C. Wensinger, President and Chief Executive Officer of V2X. “Our inclusion recognizes the progress of our business and the dedication of our employees, who deliver exceptional outcomes for our customers every day. We remain focused on executing our strategy and creating lasting value for our shareholders.”

The S&P SmallCap 600 is widely recognized as a leading benchmark for the U.S. small-cap equity market and is designed to measure the performance of established companies that meet specific criteria for market capitalization, liquidity, public float, and financial viability. Inclusion in the index may increase visibility among institutional investors and investment funds that track the benchmark.

About V2X
V2X builds innovative solutions that integrate physical and digital environments by aligning people, actions, and technology. V2X is embedded in all elements of a critical mission’s lifecycle to enhance readiness, optimize resource management, and boost security. The company provides innovation spanning national security, defense, civilian, and international markets. With a global team of approximately 16,000 professionals, V2X enables mission success by injecting AI and machine learning capabilities to meet today’s toughest challenges across all operational domains.

Investor Contact
Mike Smith, CFA
Vice President, Treasury, Corporate Development and Investor Relations
[email protected]
719-637-5773

Media Contact
Angelica Spanos Deoudes
Senior Director, Marketing and Communications
[email protected]
571-338-5195

Cision View original content to download multimedia:https://www.prnewswire.com/news-releases/v2x-joins-sp-smallcap-600-index-302834152.html
SOURCE V2X, Inc.

Release – Kratos Delivers Critical Component for Lockheed Martin’s High-Performance Propulsion Initiative

Primary Logo

Research News and Market Data on KTOS

July 27, 2026

PDF Version

Advanced Turbomachinery Successfully Validated Ahead of Integration into Next-Generation Missile Propulsion System

SAN DIEGO, July 27, 2026 (GLOBE NEWSWIRE) — Kratos Defense & Security Solutions, Inc. (Nasdaq: KTOS), a technology company in the defense, national security and global markets, today announced that it has successfully developed, tested, and delivered advanced turbomachinery supporting development of Lockheed Martin’s advanced ramjet propulsion system.

Kratos designed a compact, high-performance turbomachinery solution that harnesses ram air energy to support propulsion system operations. This self-regulating design delivers a superior size and weight solution compared to alternative approaches, contributing to the overall performance and affordability objectives of the program. Prior to integration into the propulsion system, Kratos completed a comprehensive standalone turbomachinery test campaign to validate operating points, component durability, and performance.

The successful validation of Kratos’ turbomachinery contributed to the broader propulsion system’s testing, which validated the propulsion system’s readiness to advance toward flight testing. Representatives from Lockheed Martin and the U.S. Army’s Aviation and Missile Center were present to witness the propulsion system test, which demonstrated that the missile’s core propulsion is a validated capability ready to support near-term fielding plans.

“Kratos is a leader in propulsion technology, dedicated to the rapid development, demonstration and deployment of innovative solutions,” said Stacey Rock, President of Kratos Turbine Technologies. “Our philosophy is to collaborate with industry leaders who share our mission of delivering cutting-edge technologies and capabilities to market quickly and cost-effectively. This opportunity with Lockheed Martin has been highly successful and represents a cornerstone of our long-term strategic initiatives.”

Kratos has and continues to invest in technology and infrastructure to support its growing family of turbomachinery products for advanced propulsion applications. At Kratos, affordability is a technology, and the company’s internally funded research, development, and capital investments enable rapid delivery of high-performance solutions that address the nation’s most challenging defense requirements.

About Kratos Defense & Security Solutions
Kratos Defense & Security Solutions, Inc. (NASDAQ: KTOS) is a technology, products, system and software company addressing the defense, national security, and commercial markets. Kratos makes true internally funded research, development, capital and other investments, to rapidly develop, produce and field solutions that address our customers’ mission critical needs and requirements. At Kratos, affordability is a technology, and we seek to utilize proven, leading-edge approaches and technology, not unproven bleeding edge approaches or technology, with Kratos’ approach designed to reduce cost, schedule and risk, enabling us to be first to market with cost effective solutions. We believe that Kratos is known as an innovative disruptive change agent in the industry, a company that is an expert in designing products and systems up front for successful rapid, large quantity, low-cost future manufacturing which is a value-add competitive differentiator for our large traditional prime system integrator partners and also to our government and commercial customers. Kratos intends to pursue program and contract opportunities as the prime or lead contractor when we believe that our probability of win (PWin) is high and any investment required by Kratos is within our capital resource comfort level. We intend to partner and team with a large, traditional system integrator when our assessment of PWin is greater or required investment is beyond Kratos’ comfort level. Kratos’ primary business areas include virtualized ground systems for satellites and space vehicles including software for command & control (C2) and telemetry, tracking and control (TT&C), jet powered unmanned aerial drone systems, hypersonic vehicles and rocket systems, propulsion systems for drones, missiles, loitering munitions, supersonic systems, space craft and launch systems, C5ISR and microwave electronic products for missile, radar, missile defense, space, satellite, counter UAS, directed energy, communication and other systems, and virtual & augmented reality training systems for the warfighter. For more information, visit www.KratosDefense.com and follow Kratos on LinkedIn and X.

Notice Regarding Forward-Looking Statements
Certain statements in this press release may constitute “forward-looking statements” within the meaning of the Private Securities Litigation Reform Act of 1995. These forward-looking statements are made on the basis of the current beliefs, expectations and assumptions of the management of Kratos and are subject to significant risks and uncertainty. Investors are cautioned not to place undue reliance on any such forward-looking statements. All such forward-looking statements speak only as of the date they are made, and Kratos undertakes no obligation to update or revise these statements, whether as a result of new information, future events or otherwise. Although Kratos believes that the expectations reflected in these forward-looking statements are reasonable, these statements involve many risks and uncertainties that may cause actual results to differ materially from what may be expressed or implied in these forward-looking statements. For a further discussion of risks and uncertainties that could cause actual results to differ from those expressed in these forward-looking statements, as well as risks relating to the business of Kratos in general, see the risk disclosures in the Annual Report on Form 10-K of Kratos for the year ended December 28, 2025, and in subsequent reports on Forms 10-Q and 8-K and other filings made with the SEC by Kratos.

Press Contact:
Claire Cantrell
[email protected]

Kratos Investor Information:
877-934-4687
[email protected]

Primary Logo

Release – First Phosphate Selected for “Filon” Fastrack Status with the Québec Ministry of Natural Resources and Forests

First Phosphate Corp.

Research News and Market Data on FRSPF

July 27, 2026 7:01 AM EDT | Source: First Phosphate Corp.

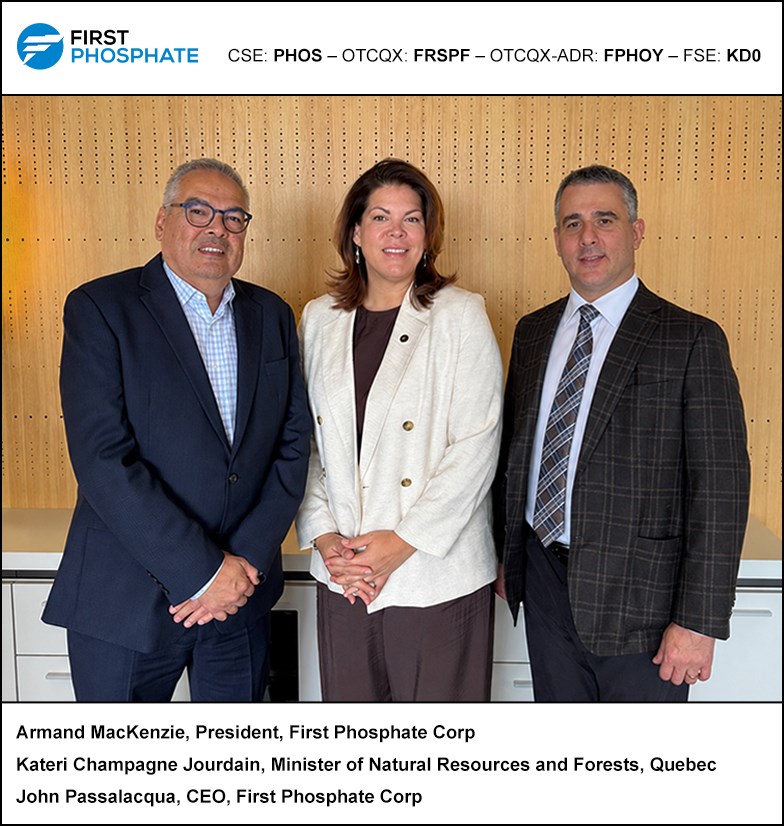
Saguenay-Lac-Saint-Jean, Québec–(Newsfile Corp. – July 27, 2026) – First Phosphate Corp. (CSE: PHOS) (OTCQX: FRSPF) (OTCQX ADR: FPHOY) (FSE: KD0) (“First Phosphate“) is pleased to announce that its Bégin-Lamarche igneous rock phosphate mining project has been selected for “Filon” support status with the Quebec Ministry of Natural Resources and Forests (“MRNF”), an initiative aimed at accelerating mining projects in Quebec.

The objective of the MRNF’s Filon support is to foster a common understanding of the Bégin-Lamarche phosphate mining project with a view to accelerate its key development milestones. The specialized support to be provided to First Phosphate is intended to facilitate discussions with the government departments and agencies responsible for issuing mining authorizations or permits.

“With the Bégin-Lamarche project, Québec is transforming its geological potential into an economic advantage. By developing a high-purity phosphate deposit intended for the battery sector, we are helping to build a more innovative, more resilient economy focused on future markets. Filon will advance this structural project through a specialized support mechanism.”

Kateri Champagne Jourdain, Québec Minister of Natural Resources and Forests

“We appreciate that the Government of Québec has granted accelerated status to our Bégin-Lamarche igneous rock phosphate project,” said John Passalacqua, CEO of First Phosphate. “Our project holds significant strategic value in helping to onshore the lithium iron phosphate (“LFP”) battery supply chain in North America.”

Announced as part of the Québec Strategy for the Development of Critical and Strategic Minerals 2025-2031, Filon targets critical and strategic mineral projects in Quebec.


To view an enhanced version of this graphic, please visit:
https://images.newsfilecorp.com/files/8917/306577_b86c3d31c47b2977_001full.jpg

Qualified Person

The scientific and technical information relating to First Phosphate contained in this press release has been reviewed and approved by Steeve Lavoie, P.Geo., Chief Geologist of First Phosphate, who is a Qualified Person within the meaning of National Instrument 43-101 – Standards of Disclosure for Mineral Projects (“NI 43-101”).

About First Phosphate Corp.

First Phosphate (CSE: PHOS) (OTCQX: FRSPF) (OTCQX ADR: FPHOY) (FSE: KD0) is a mineral exploration and development and clean technology company dedicated to building and reshoring a vertically integrated mine-to-market supply chain for the production of LFP batteries in North America. Target markets include energy storage, data centers, robotics, mobility, and national security. First Phosphate’s flagship Bégin-Lamarche property, located in Saguenay-Lac-Saint-Jean, Québec, Canada, represents a rare North American igneous phosphate resource producing high-purity phosphate characterized by very low levels of impurities.

For additional information

Armand MacKenzie
President
Tel: +1 (514) 618-5289

Investor Relations: https://firstphosphate.com/investors
General Inquiries: https://firstphosphate.com/contact
Website: www.FirstPhosphate.com

X: https://x.com/FirstPhosphate
LinkedIn: https://www.linkedin.com/company/first-phosphate

Forward-Looking Information and Cautionary Statement

This release includes certain statements that may be deemed “forward-looking information”. Any statement that discusses predictions, expectations, beliefs, plans, projections, objectives, assumptions, future events or performance (often but not always using phrases such as “expects”, or “does not expect”, “is expected”, “anticipates” or “does not anticipate”, “plans”, “budget”, “scheduled”, “forecasts”, “estimates”, “believes” or “intends” or variations of such words and phrases or stating that certain actions, events or results “may” or “could”, “would”, “might” or “will” be taken to occur or be achieved) are not statements of historical fact and may be forward-looking information. In particular, this press release contains forward-looking information relating to, among other things: the Company’s participation in the Filon program, the support to be provided and the expected outcomes.

Although the Company believes the expectations expressed in such forward-looking statements are based on reasonable assumptions, such statements are not guarantees of future performance and actual results or developments may differ materially from those forward-looking statements. Factors that could cause actual results to differ materially from those in forward-looking statements include market prices, development and exploration successes, and continued availability of capital and financing and general economic, market or business conditions. These statements are based on a number of assumptions including, among other things, assumptions regarding general business and economic conditions that engineering and construction timetables and capital costs for the Company’s, exploration, development and expansion projects are correctly estimated and not affected by unforeseen circumstances; the ability to obtain financing for its proposed operations on acceptable terms; no material deterioration in general business and economic conditions; no material delays in obtaining permits and other approvals; no significant disruptions affecting the activities of the Company or its ability to access required project equipment and services, and operating supplies in sufficient quantities and on a timely basis; inflation and prices for Company project inputs being approximately consistent with anticipated levels; the ability to complete the exploration and development programs consistent with the Company’s expectations; commodity price expectations including assumptions for P2O5; the Company’s relationship with local municipalities and First Nations remaining consistent with the Company’s expectations; the Company’s relationship with other third-party partners and suppliers remaining consistent with the Company’s expectations; and government relations and actions being consistent with Company expectations. Investors are cautioned that any such statements are not guarantees of future performance and actual results or developments may differ materially from those projected in the forward-looking statements. Accordingly, readers should not place undue reliance on the forward-looking information contained in this press release. The Company does not assume any obligation to update or revise its forward-looking statements, whether because of new information, future events or otherwise, except as required by applicable law. All forward-looking information contained in this release is qualified by these cautionary statements.

info

Source: First Phosphate Corp.

Release – Perfect Corp. Reports Unaudited Financial Results for the Three Months and Six Months Ended June 30, 2026

Perfect Corp

Research News and Market Data on PERF

July 27, 2026

NEW YORK–(BUSINESS WIRE)– Perfect Corp. (NYSE: PERF) (“Perfect” or the “Company”), a leading artificial intelligence (“AI”) company offering AI and augmented reality (“AR”) powered solutions to beauty and fashion industries, today announced its unaudited financial results for the three months and six months ended June 30, 2026.

Highlights for the Three Months Ended June 30, 2026

  • Total revenue was $16.3 million for the three months ended June 30, 2026, remaining stable compared to the same period of 2025.
  • Gross profit was $13.2 million for the three months ended June 30, 2026, compared to $12.3 million in the same period of 2025, an increase of 7.4%.
  • Operating loss was $0.1 million for the three months ended June 30, 2026, compared to an operating loss of $1.5 million in the same period of 2025, representing an improvement of $1.4 million.
  • Netincome was $1.3 million for the three months ended June 30, 2026, compared to $0.2 million during the same period of 2025, an increase of 518.4%.

Ms. Alice H. Chang, Founder, Chairwoman, and Chief Executive Officer of Perfect Corp., commented, “Perfect Corp. continues to prioritize the advancement of our consumer (B2C) and enterprise (B2B) businesses through AI-driven innovation. While the rapid evolution of AI is creating both opportunities and challenges across the sector, ongoing demand for Generative AI and Agentic AI solutions reinforces our commitment to developing products and services that address these evolving needs. We also remain focused on strengthening our technology capabilities and expanding our solutions to pursue opportunities across both business segments.”

Financial Results for the Three Months Ended June 30, 2026

Revenue

Total revenue remained stable at $16.3 million for the three months ended June 30, 2026, compared to the same period of 2025, as continued growth in YouCam mobile app and web services subscriptions was offset by a decrease in licensing revenue.

  • AI- and AR- cloud solutions and subscription revenue remained relatively stable at $14.9 million for the three months ended June 30, 2026, compared to the same period of 2025. AI- and AR- cloud solutions and subscription revenue was primarily driven by the revenue growth from YouCam mobile app and web subscriptions, supported by growing popularity among consumers for Generative AI technologies and AI editing features for photos and videos.
  • Licensing revenue was $0.7 million for the three months ended June 30, 2026, compared to $1.0 million in the same period of 2025, a decrease of 25.3%. The Company anticipates that this legacy non-recurring revenue will become increasingly immaterial as it continues to prioritize enhancing its market leadership in the consumer beauty and AI mobile apps and web subscriptions as well as AI- and AR-based SaaS subscription solutions for brands and customers.

Gross Profit

Gross profit was $13.2 million for the three months ended June 30, 2026, compared with $12.3 million in the same period of 2025, an increase of 7.4%. Gross margin was 80.9% for the three months ended June 30, 2026, an increase from 75.3% in the same period of 2025. The increase in gross margin during the quarter was primarily due to the increase in operational efficiency resulting from the ongoing realignment of engineering professionals as we continue to transition from customization of software toward more standardized AI/API solutions for our customer base.

Total Operating Expenses

Total operating expenses were $13.3 million for the three months ended June 30, 2026, compared with $13.8 million in the same period of 2025, a decrease of 3.2%. The decrease was primarily due to decreases in research and development and general and administrative expenses in the second quarter of 2026.

  • Sales and marketing expenses remained stable at $7.8 million for the three months ended June 30, 2026, compared to the same period of 2025.
  • Research and development expenses were $3.6 million for the three months ended June 30, 2026, compared to $4.0 million during the same period of 2025, a decrease of 11.0%. This decrease was primarily due to reduction of engineering resources by creating better synergies among different product development teams.
  • General and administrative expenses were at $1.9 million for the three months ended June 30, 2026, and compared to $2.0 million for the same period of 2025, a decrease of 6.9%, demonstrating our effective cost control.

Total Operating Loss

Total operating loss narrowed to $0.1 million for the three months ended June 30, 2026, compared to $1.5 million during the same period of 2025. The improvement in operating results was primarily driven by higher gross profit, while operating expenses remained steady.

Net Income

Net income was $1.3 million for the three months ended June 30, 2026, compared to $0.2 million during the same period of 2025. The significant increase in net income was primarily due to improved gross margin, increase in gains on financial liabilities and lower operating expenses resulting from effective cost control.

Operating Cash Flow

Operating cash flow was $1.0 million in the three months ended June 30, 2026, compared to $3.7 million in the same period of 2025, a decrease of 73.6%. This decrease was primarily due to fewer current contract liabilities and higher income tax paid, partially offset by higher profit before tax.

Financial Results for the Six Months Ended June 30, 2026

Revenue

Total revenue was $34.3 million for the six months ended June 30, 2026, compared to $32.4 million in the same period of 2025, an increase of 5.9%.

  • AI- and AR- cloud solutions and subscription revenue was $30.4 million for the six months ended June 30, 2026, compared to $29.0 million in the same period of 2025, an increase of 5.0%. The increase was primarily driven by the continued revenue growth from YouCam mobile app and web subscriptions, supported by growing popularity among consumers for Generative AI technologies and AI editing features for photos and videos.
  • Licensing revenue was $2.2 million for the six months ended June 30, 2026, compared to $2.6 million in the same period of 2025, a decrease of 13.2%.

Gross Profit

Gross profit was $27.9 million for the six months ended June 30, 2026, compared with $24.8 million in the same period of 2025, an increase of 12.7%. Gross margin was 81.5% for the six months ended June 30, 2026, an increase from 76.6% in the same period of 2025. The increase in gross margin during the first half of 2026 was primarily due to the increase in operational efficiency by supplying standardized SaaS solutions with fewer brand-specific customization efforts.

Total Operating Expenses

Total operating expenses were $26.6 million for the six months ended June 30, 2026, compared with $26.4 million in the same period of 2025, an increase of 0.6%.

  • Sales and marketing expenses remained relatively stable at $15.5 million for the six months ended June 30, 2026, compared to $15.2 million during the same period of 2025.
  • Research and development expenses was $7.1 million for the six months ended June 30, 2026, compared to $7.6 million during the same period of 2025, a slight decrease of 6.3%.
  • General and administrative expenses were at $3.6 million for the six months ended June 30, 2026, and compared to $3.7 million for the same period of 2025, a slight decrease of 3.1%, demonstrating our effective cost control.

Total Operating Income/Loss

Total operating income was $1.4 million for the six months ended June 30, 2026, compared to an operating loss of $1.6 million during the same period of 2025. The swing to profitability was primarily driven by higher gross profit, while operating expenses grew only modestly.

Net Income

Net income was $3.6 million for the six months ended June 30, 2026, compared to $2.5 million during the same period of 2025, an increase of 45.3%. The positive net income was supported by our steady revenue growth and effective cost control.

Operating Cash Flow

Operating cash inflow was $5.2 million in the six months ended June 30, 2026, compared to $8.0 million in the same period of 2025, a decrease of 34.8%. The decrease was primarily driven by lower current contract liabilities and higher income tax paid. The Company continues to invest in growth while maintaining a positive operating cash flow to support business operations.

Liquidity and Capital Resource

As of June 30, 2026, the Company’s cash and cash equivalents remained stable at $125.6 million (or $177.1 million when including 6-month time deposits of $36.4 million and US Treasuries of $15.1 million, which are classified as current and non-current financial assets at amortized cost under IFRS, respectively), compared to $120.6 million (or $176.4 million when including time deposits, US Treasuries and money market funds) as of March 31, 2026.

Key Business Metrics

  • The number of active subscribers for the Company’s YouCam mobile beauty apps and web services was 820,000 as of June 30, 2026, compared to over 960,000 as of June 30, 2025, a decrease of 14.6%. The decline was attributable to the increased competition through the rapidly shifting landscape of AI driven apps.
  • The number of Key Customers 1 of the Company as of June 30, 2026 was 113 compared to 139 as of June 30, 2025. The net decline in the number of Key Customers was primarily due to customer downgrades in service subscription spending.

Recent Development

On March 18, 2026, Perfect announced receipt of preliminary non-binding “Going Private” proposal.

On March 23, 2026, Perfect’s Board announced the formation of special committee to evaluate on the preliminary non-binding “Going Private” proposal received on March 18, 2026.

On April 20, 2026, Perfect announced appointment of financial advisor and legal counsel to the special committee.

On July 10, 2026, Perfect announced that it has entered into a Definitive Agreement for a Going-Private Transaction.

About Perfect Corp.

Founded in 2015, Perfect Corp. is a leading AI company offering self-developed AI- and AR- powered solutions dedicated to transforming the world with digital tech innovations that make your virtual world beautiful. On Perfect’s direct consumer business side, Perfect operates a family of YouCam consumer apps and web-editing services for photo, video and camera users, centered on unleashing creativity with AI-driven features for creation, beautification and enhancement. On Perfect’s enterprise business side, Perfect empowers major beauty, skincare, fashion, jewelry, and watch brands and retailers by supplying them with omnichannel shopping experiences through AR product try-ons and AI-powered skin diagnostics. With cutting-edge technologies such as Generative AI, real-time facial and hand 3D AR rendering and cloud solutions, Perfect enables personalized, enjoyable, and engaging shopping journey and helps brands elevate customer engagement, increase conversion rates, and propel sales growth. Throughout this journey, Perfect maintains its unwavering commitment to environmental sustainability and fulfilling social responsibilities. For more information, visit https://ir.perfectcorp.com/.

Forward-Looking Statements

This communication contains forward-looking statements within the meaning of Section 27A of the U.S. Securities Act of 1933, as amended, or the Securities Act, and Section 21E of the U.S. Securities Exchange Act of 1934, as amended, or the Exchange Act, that are based on beliefs and assumptions and on information currently available to Perfect. In some cases, you can identify forward-looking statements by the following words: “may,” “will,” “could,” “would,” “should,” “expect,” “intend,” “plan,” “anticipate,” “believe,” “estimate,” “predict,” “project,” “potential,” “continue,” “ongoing,” “target,” “seek” or the negative or plural of these words, or other similar expressions that are predictions or indicate future events or prospects, although not all forward-looking statements contain these words. Any statements that refer to expectations, projections or other characterizations of future events or circumstances, including strategies or plans, are also forward-looking statements. These statements involve risks, uncertainties and other factors that may cause actual results, levels of activity, performance or achievements to be materially different from those expressed or implied by these forward-looking statements. These statements are based on Perfect’s reasonable expectations and beliefs concerning future events and involve risks and uncertainties that may cause actual results to differ materially from current expectations. These factors are difficult to predict accurately and may be beyond Perfect’s control. Forward-looking statements in this communication or elsewhere speak only as of the date made. New uncertainties and risks arise from time to time, and it is impossible for Perfect to predict these events or how they may affect Perfect. In addition, risks and uncertainties are described in Perfect’s filings with the Securities and Exchange Commission. These filings may identify and address other important risks and uncertainties that could cause actual events and results to differ materially from those contained in the forward-looking statements. Perfect cannot assure you that the forward-looking statements in this communication will prove to be accurate. There may be additional risks that Perfect presently does not know or that Perfect currently does not believe are immaterial that could also cause actual results to differ from those contained in the forward-looking statements. In light of the significant uncertainties in these forward-looking statements, you should not regard these statements as a representation or warranty by Perfect, its directors, officers or employees or any other person that Perfect will achieve its objectives and plans in any specified time frame, or at all. Except as required by applicable law, Perfect does not have any duty to, and does not intend to, update or revise the forward-looking statements in this communication or elsewhere after the date of this communication. You should, therefore, not rely on these forward-looking statements as representing the views of Perfect as of any date subsequent to the date of this communication.

argenx Pays an 86% Premium for Forte Biosciences. What Made a Clinical-Stage Biotech Worth $2.2 Billion

argenx (Euronext & Nasdaq: ARGX) announced Monday it has entered into a definitive agreement to acquire Forte Biosciences (Nasdaq: FBRX) for $77 per share in cash, a total equity value of approximately $2.2 billion. The price represents an 86% premium to Forte’s volume-weighted average trading price since July 9, when the company reported positive Phase 1b data in vitiligo. That is an unusually large premium even by the standards of this year’s active biotech M&A market, and it reflects just how quickly clinical data can transform a small cap company’s valuation.

The transaction is structured as a cash tender offer funded entirely from argenx’s existing cash on hand, with no financing condition attached. Closing is expected in the third quarter of 2026, subject to a majority of Forte shares being tendered and clearance under the Hart-Scott-Rodino Antitrust Improvements Act.

From Strategic Investor to Full Acquirer

This deal did not appear out of nowhere. argenx had already made a strategic investment in Forte Biosciences prior to this announcement, giving it an early window into the company’s clinical progress before committing to a full buyout. That structure, investing first and acquiring later once the data supports it, reflects a disciplined approach that reduces risk for the acquirer while still preserving the option to move quickly once a program proves itself out.

The proof came fast. Forte’s lead asset, FB102, is a first-in-class anti-CD122 antibody that recently delivered statistically significant Phase 1b results in vitiligo, following earlier positive Phase 1b data in celiac disease reported last year, with Phase 2 celiac data expected in the second half of 2026. Those clinical readouts were the direct trigger for argenx’s decision to convert its strategic stake into a full acquisition.

Why CD122 Biology Matters

FB102’s mechanism targets pathogenic T-cell and NK-cell activity through CD122 biology, a distinct approach from the antibody mechanisms already in argenx’s portfolio, which includes efgartigimod, empasiprubart, adimanebart, and ARGX-121. Rather than duplicating existing capability, the acquisition broadens argenx’s ability to address autoimmune disease through an entirely different dimension of immune system dysfunction.

The commercial upside extends well beyond vitiligo and celiac disease. Management described FB102 as having pipeline-in-a-product potential, meaning the same molecule could eventually address multiple autoimmune conditions including alopecia areata, each representing a separate commercial opportunity from a single clinical asset. That kind of multi-indication potential is precisely what allows a clinical-stage company with no approved products to command a multibillion-dollar acquisition price.

What It Signals for Small Cap Biotech Investors

For investors tracking clinical-stage companies in the small and microcap immunology and autoimmune disease space, the Forte transaction reinforces a pattern that has defined biotech M&A throughout 2026. Large, well-capitalized immunology and oncology platforms are increasingly using strategic minority investments as a low-risk way to monitor promising early-stage science, then moving decisively to full acquisitions once clinical data de-risks the program. Statistically significant Phase 1b results, even well ahead of any approval pathway, are proving sufficient to justify premiums approaching 90% over recent trading prices.

That dynamic matters for the broader small cap biotech landscape. Companies advancing differentiated mechanisms in autoimmune disease, a therapeutic area with persistent unmet need and limited recent innovation, are demonstrating that credible early clinical validation can translate into outsized valuation outcomes well before a drug ever reaches the market. The Forte deal is the latest evidence that the current biotech M&A cycle rewards genuine scientific differentiation over scale.

Apple Passed Nvidia as the World’s Most Valuable Company. Spending Less on AI Just Became a Winning Strategy

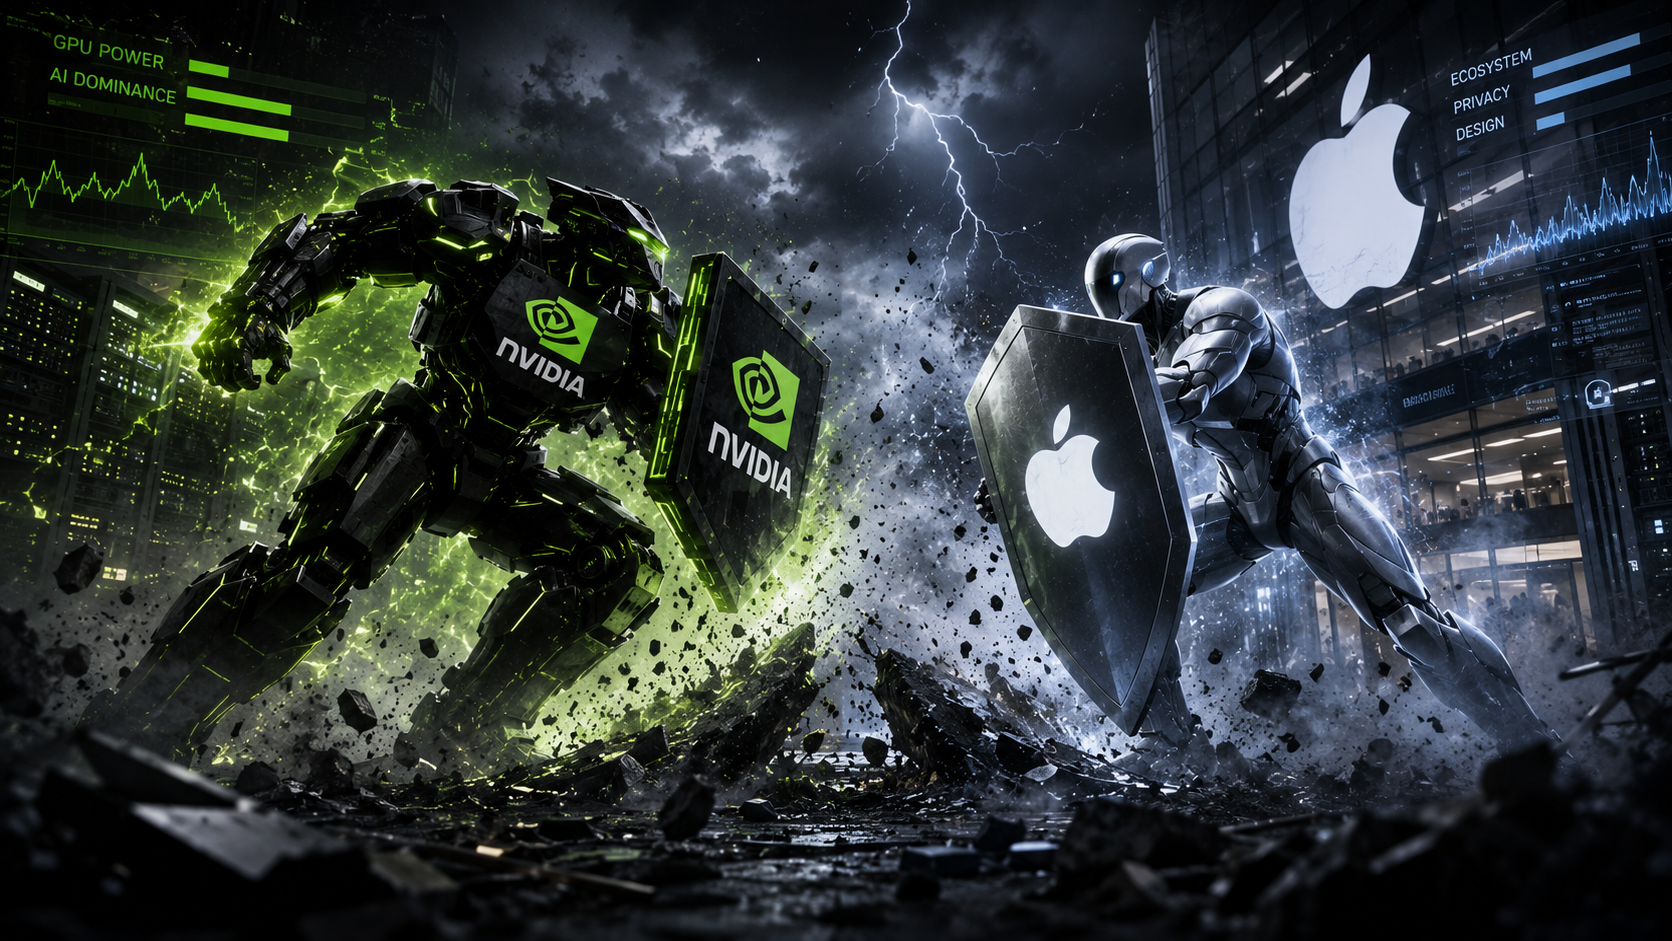
Apple reclaimed the title of the world’s most valuable public company Monday, overtaking Nvidia as its stock pushed toward a record high close. Apple’s market capitalization reached approximately $4.94 trillion, edging past Nvidia’s $4.83 trillion. The shift caps a remarkable turnaround for a company that spent much of the past two years being criticized for lagging behind its peers on artificial intelligence investment.

Apple shares have climbed more than 22% year to date, outperforming every other member of the so-called Magnificent Seven. The reason is almost the inverse of what drove the group’s dominance over the past two years. Investors are increasingly rewarding Apple precisely because it has not spent aggressively on AI infrastructure, treating capital discipline as a genuine strength rather than a competitive weakness.

The Capex Divide Reshaping Big Tech

Data tracked through Yahoo Finance’s AlphaSpace shows Apple’s capital expenditures have actually declined over the past three quarters, a striking contrast to nearly every other major technology company racing to build AI infrastructure. That restraint stands in sharp relief against Alphabet, which raised its capital spending outlook last week to fund its AI infrastructure buildout, and Tesla, which increased spending to support its robotaxi and robotics ambitions. Shares of both companies fell following their respective earnings reports. Alphabet is up only about 3% year to date, and Tesla has tumbled roughly 30% over the same period.

The market’s message has become increasingly clear this earnings season. Companies spending aggressively on AI capacity are being asked hard questions about return on that investment, while companies demonstrating they can capture AI-driven demand without ballooning capital expenditures are being rewarded with premium valuations.

A Pivotal Week Ahead

Apple reports earnings Thursday after the closing bell, and the report carries added significance beyond the usual quarterly scrutiny. Investors will be watching closely for signs the company can scale its Apple Intelligence features across its device lineup without a meaningful increase in capital expenditures or pressure on operating margins. If Apple can demonstrate that its AI strategy works within its existing capital-light framework, it would validate the market’s current thesis in dramatic fashion.

The timing carries additional weight. Thursday will mark Tim Cook’s final earnings call as CEO before he steps down September 1 to become executive chairman, with John Ternus, a longtime hardware engineering veteran at Apple, taking over as chief executive. Microsoft, Amazon, and Meta all report later this week as well, and all three are expected to announce further increases in AI-related spending, setting up a direct contrast with Apple’s approach in real time.

What This Means for the Broader Market

For investors tracking the AI infrastructure ecosystem, the leadership change at the top of the market matters beyond Apple and Nvidia individually. It reinforces a theme that has run through this entire earnings season: the market is no longer rewarding AI spending simply because it is AI spending. It is scrutinizing whether that capital is translating into visible product outcomes and sustainable margins.

That distinction has real implications down the market cap spectrum. Smaller companies supplying components, software, and infrastructure into the AI buildout are increasingly being evaluated on the same terms, whether their growth is funded responsibly or whether it depends on the kind of unchecked capital expenditure that has weighed on stocks like Alphabet and Tesla this earnings season. Apple’s ascent back to the top is, in part, the market rewarding exactly the kind of capital discipline that investors are now demanding across the board.

BlackRock Is Selling $12.3 Billion in Bonds to Fund a Meta Data Center. Wall Street Is Watching to See Who Buys

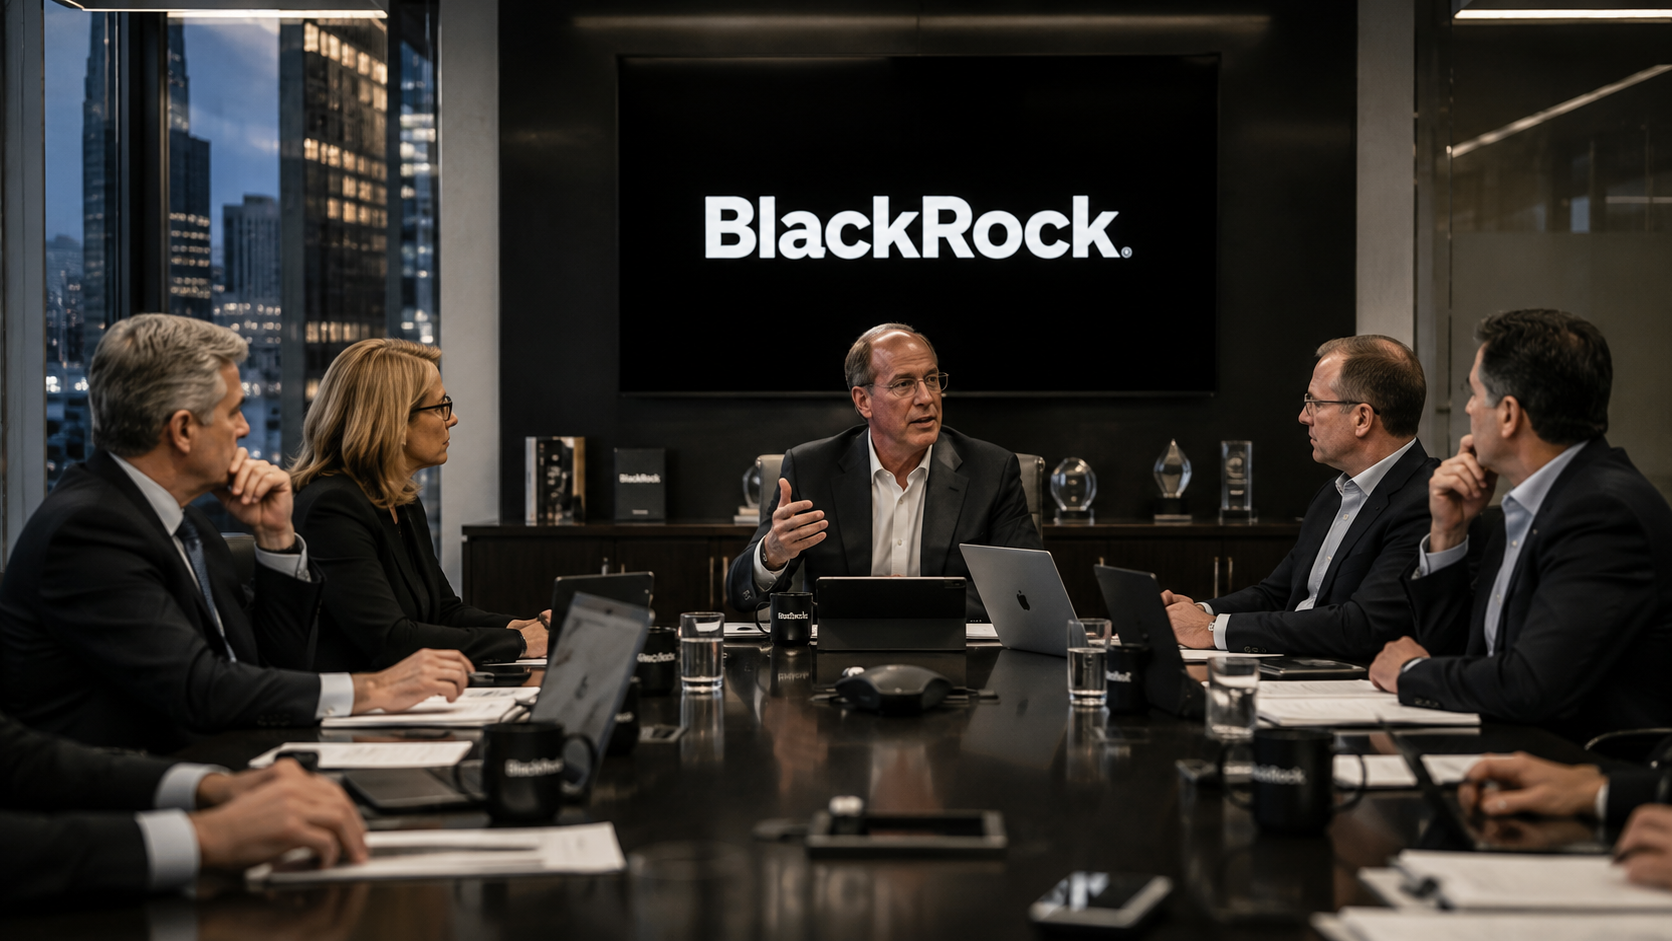
The debt-financed AI buildout just got its next major test. BlackRock began marketing $12.3 billion in high-grade bonds Friday to fund a massive data center campus in El Paso, Texas, built to power Meta Platforms’ artificial intelligence workloads. The offering is being sold through a single tranche of notes due in 2048, with price talk at approximately 2.875 percentage points over Treasuries. JPMorgan Chase and Morgan Stanley are running the offering.

The financing structure is worth understanding. The project is owned through a holding company tied to BlackRock, with BlackRock subsidiaries Global Infrastructure Management and HPS Investment Partners holding an 80% stake and Meta owning the remaining 20%. Once complete, the facility is expected to provide as much as 1 gigawatt of computing capacity dedicated to AI workloads, enough to power hundreds of thousands of homes if it were serving the grid instead of server racks.

Why This Deal Matters Beyond Its Size

At $12.3 billion, this is one of the largest single data center bond offerings to reach the market this year, and the timing makes it a genuine test of investor appetite. The offering arrives just days after Oracle’s stock fell more than 50% from its June high on concerns about debt-funded AI infrastructure spending and customer concentration risk tied to its own data center buildout. It also follows Alphabet shares falling after the company disclosed a $205 billion spending plan that fueled fresh investor anxiety about the pace and sustainability of AI capital expenditure across the industry.

Against that backdrop, BlackRock’s bond sale is effectively asking bond investors a direct question: is the market still willing to underwrite massive, long-duration AI infrastructure debt at reasonable spreads, or has sentiment shifted enough that these deals now require a real risk premium to get done. A note due in 2048 is a 22-year commitment, and how tightly or loosely it prices will say a great deal about whether fixed income investors share the equity market’s growing skepticism about AI capex, or whether they view infrastructure-backed debt with a hyperscaler tenant as a fundamentally different risk than a company’s own balance sheet leverage.

The Structural Shift Toward Off-Balance-Sheet AI Financing

This deal also reflects a broader trend worth watching. Rather than funding data centers directly on their own balance sheets the way Oracle largely has, companies like Meta are increasingly structuring these projects through joint ventures with infrastructure investors like BlackRock, keeping the debt at arm’s length while still securing the compute capacity they need. That structure spreads the financial risk of the AI buildout across a wider pool of infrastructure capital rather than concentrating it entirely on the tech company’s own credit.

What It Means for Smaller Companies

For investors tracking the broader AI infrastructure ecosystem, this offering is a useful barometer independent of Meta or BlackRock specifically. If a $12.3 billion, investment-grade-rated data center bond prices well, it signals that credit markets still have confidence in the underlying demand for AI compute, which supports continued capital flowing to the smaller companies supplying power infrastructure, cooling systems, and specialized components into projects exactly like this one. If it prices poorly or gets downsized, it would be an early signal that the capital markets are beginning to price AI infrastructure risk more conservatively across the board, a dynamic that would eventually reach every tier of the supply chain, including the smallest companies in it.

Release – ACCO Brands Corporation Declares Quarterly Dividend

ACCO Brands Logo

Research News and Market Data on ACCO

07/24/2026

    LAKE ZURICH, Ill.–(BUSINESS WIRE)– ACCO Brands Corporation (NYSE: ACCO) today announced that its board of directors has declared a quarterly cash dividend of $0.075 per share. The dividend will be paid on September 9, 2026, to stockholders of record as of the close of business on August 21, 2026.

    About ACCO Brands Corporation

    ACCO Brands is the leader in branded consumer products that enable productivity, confidence and enjoyment while working, when learning and while playing. Our widely recognized brands include AT-A-GLANCE®, Five Star®, Kensington®, Leitz®, Mead®, PowerA®, Swingline®, Tilibra® and many others. More information about ACCO Brands Corporation (NYSE: ACCO) can be found at www.accobrands.com.

    For further information:

    Chris McGinnis
    Investor Relations
    (847) 796-4320

    Kori Reed
    Media Relations
    (224) 501-0406

    Source: ACCO Brands Corporation

    Release – NanoViricides Announces Pricing of ~$3.8 Million Registered Direct Offering

    NanoViricides Announces Pricing of ~$3.8 Million Registered Direct Offering

    Research News and Market Data on NNVC

    Friday, 24 July 2026 08:00 AM

    SHELTON, CT / ACCESS Newswire / July 24, 2026 / NanoViricides, Inc. (NYSE American:NNVC) (“NanoViricides” or the “Company”), a clinical stage, leading global pioneer in the development of broad-spectrum antivirals based on host-mimetic nanomedicine technology that viruses and their variants cannot escape, today announced it has entered into a securities purchase agreement with a single fundamental institutional investor for the purchase and sale of 2,516,339 shares of common stock (or pre-funded warrants in lieu thereof), together with accompanying warrants to purchase 2,516,339 shares of common stock for gross proceeds of approximately US$3.8 million in a registered direct offering (the “Offering”). The common shares are being sold in combination with an accompanying full warrant (with each whole warrant being exercisable into one common share of the Company). Each whole warrant has an exercise price of US$1.75 per share and will expire five and half years from the date of issuance.

    D. Boral Capital LLC is acting as the exclusive placement agent for the Offering.

    The closing of the Offering is expected to occur on or about July 27, 2026, subject to the satisfaction of customary closing conditions. The Company expects to receive aggregate gross proceeds of ~$3.8 million from the Offering, before deducting placement agent fees and other related expenses.

    The ordinary shares (or pre-funded warrants in lieu thereof) are being offered by the Company pursuant to an effective shelf registration statement on Form S-3 (Registration No. 333-296790), which was declared effective by the U.S. Securities and Exchange Commission (the “SEC”) on June 15, 2026.

    A prospectus supplement describing the terms of the proposed registered direct offering will be filed with the SEC. Once filed, it will be available on the SEC’s website at http://www.sec.gov and on the Company’s website at https://www.nanoviricides.com/. A copy of the prospectus supplement and accompanying base prospectus relating to the offering may be obtained, when available, from D. Boral Capital LLC, 590 Madison Avenue, 39th Floor, New York, NY 10022, or by telephone at (212) 404-7002, or by email at [email protected].

    This press release shall not constitute an offer to sell or the solicitation of an offer to buy, nor shall there be any sale of securities in any state or jurisdiction in which such offer, solicitation or sale would be unlawful prior to registration or qualification under the securities laws of any such state or jurisdiction.

    About NanoViricides

    NanoViricides, Inc., is a publicly traded company (NYSE American:NNVC) (the “Company”), and a clinical stage, leading global pioneer in the development of broad-spectrum antivirals based on host-mimetic nanomedicine technology that viruses and their variants cannot escape. Its clinical stage, broad-spectrum, antiviral drug NV-387 has been granted an “Orphan Drug Designation” (ODD) by the US FDA Office of Orphan Products Development (OOPD). This could provide 7 years market exclusivity, tax credits for clinical trial costs, and fee exemptions upon approval. NV-387 is a revolutionary antiviral that we believe will be the drug offered at “first visit” when the patient presents to a doctor with any respiratory viral illness. NV-387 was also found to be highly effective in lethal animal infection models of Influenza, RSV, Coronaviruses, Monkeypox, Smallpox, and Measles.

    Forward-Looking Statements

    Statements made in this press release include forward-looking statements within the meaning of Section 27A of the Securities Act of 1933, as amended, and Section 21E of the Securities Exchange Act of 1934. Forward-looking statements can be identified by the use of words such as “may,” “will,” “plan,” “should,” “expect,” “anticipate,” “estimate,” “continue,” or comparable terminology. Such forward-looking statements are inherently subject to certain risks, trends, and uncertainties, many of which the Company cannot predict with accuracy and some of which the Company might not even anticipate and involve factors that may cause actual results to differ materially from those projected or suggested. These risks include, but are not limited to, the ability to complete the offering on the terms described or at all, the ability to satisfy customary closing conditions, market conditions, regulatory developments affecting the digital asset and stablecoin industries, and other risks described in the Company’s filings with the SEC. Readers are cautioned not to place undue reliance on these forward-looking statements and are advised to consider the factors listed above together with the additional factors under the heading “Risk Factors” in the Company’s Annual Reports on Form 20-F, as may be supplemented or amended by the Company’s Reports of a Foreign Private Issuer on Form 6-K. The Company assumes no obligation to update or supplement forward-looking statements that become untrue because of subsequent events, new information, or otherwise.

    Contacts:

    For Inquiries, Contact:
    NanoViricides, Inc.
    [email protected]

    Public Relations Contact:
    [email protected]

    SOURCE: NanoViricides

    SelectQuote (SLQT) – Q4 Preview—Building Toward a Cash Flow Inflection


    Friday, July 24, 2026

    Michael Kupinski, Director of Research, Equity Research Analyst, Digital, Media & Technology , Noble Capital Markets, Inc.

    Jacob Mutchler, Research Analyst, Noble Capital Markets, Inc.

    Refer to the full report for the price target, fundamental analysis, and rating.

    Q4 Should Reinforce Improving Cash Flow Story. Although fourth quarter revenue should normalize following the seasonally strong Medicare enrollment period, we expect another quarter of healthy profitability and cash generation that reinforces management’s expectation for a significant cash flow acceleration entering fiscal 2027.

    Senior Business Demonstrates Structural Earnings Strength. Even amid continued Medicare Advantage disruption, the Senior business has consistently produced EBITDA margins above 25% during enrollment periods. We expect another solid quarter as disciplined marketing spend and strong customer retention continue to support attractive economics.


    Get the Full Report

    Equity Research is available at no cost to Registered users of Channelchek. Not a Member? Click ‘Join’ to join the Channelchek Community. There is no cost to register, and we never collect credit card information.

    This Company Sponsored Research is provided by Noble Capital Markets, Inc., a FINRA and S.E.C. registered broker-dealer (B/D).

    *Analyst certification and important disclosures included in the full report. NOTE: investment decisions should not be based upon the content of this research summary. Proper due diligence is required before making any investment decision. 

    Resources Connection (RGP) – Reports 4Q26 Results In-line with Expectations


    Friday, July 24, 2026

    Joe Gomes, CFA, Managing Director, Equity Research Analyst, Generalist , Noble Capital Markets, Inc.

    Refer to the full report for the price target, fundamental analysis, and rating.

    Overview. Resources Connection’s 4Q26 results were mostly in line with management expectations. Overall industry conditions were consistent with 3Q26, suggesting the market is stabilizing. During the quarter, RGP continued to make focused investments to support future growth, which we are hopeful will occur in 2HFY27.

    4Q26 Details. Revenue of $106.1 million was down 18.3% on a constant currency basis y-o-y but was within management’s $104-$109 guide. 4Q26 also had one less week of billable activity compared to 4Q25. Gross margin of 37.6% was down from 40.2% y-o-y but exceeded the top end of management’s guide. Adjusted EPS was a net loss of $0.07 compared to EPS of $0.16 in 4Q25.


    Get the Full Report

    Equity Research is available at no cost to Registered users of Channelchek. Not a Member? Click ‘Join’ to join the Channelchek Community. There is no cost to register, and we never collect credit card information.

    This Company Sponsored Research is provided by Noble Capital Markets, Inc., a FINRA and S.E.C. registered broker-dealer (B/D).

    *Analyst certification and important disclosures included in the full report. NOTE: investment decisions should not be based upon the content of this research summary. Proper due diligence is required before making any investment decision. 

    Aurania Resources (AUIAF) – Board Member Assumes Expanded Role


    Friday, July 24, 2026

    Mark Reichman, Managing Director, Equity Research Analyst, Natural Resources, Noble Capital Markets, Inc.

    Refer to the full report for the price target, fundamental analysis, and rating.

    Supporting Project Advancement. Aurania Resources has appointed current independent director Mr. Thomas Ullrich as Special Advisor, effective immediately, to support the advancement of the company’s strategic projects. Working closely with President and Chief Executive Officer Dr. Keith Barron, Mr. Ullrich will provide strategic guidance on operational and mineral exploration activities, evaluate strategic opportunities, assist with project management, strengthen industry relationships, and help prioritize key initiatives across the company’s portfolio while continuing to serve on the Board of Directors.

    Leveraging Experience and Expertise. Mr. Ullrich offers more than 35 years of experience in mineral exploration and geoscience, with expertise encompassing technical exploration, project evaluation, and capital markets. He currently serves as Chief Executive Officer and a director of Aston Bay Holdings Ltd. and previously held senior technical roles with Antofagasta Minerals and Almaden Minerals, where he managed the drill program that led to the discovery of the Ixtaca silver-gold deposit in Mexico. We think Mr. Ullrich’s expanded role will enhance Aurania’s ability to advance its exploration and development initiatives to create long-term shareholder value.


    Get the Full Report

    Equity Research is available at no cost to Registered users of Channelchek. Not a Member? Click ‘Join’ to join the Channelchek Community. There is no cost to register, and we never collect credit card information.

    This Company Sponsored Research is provided by Noble Capital Markets, Inc., a FINRA and S.E.C. registered broker-dealer (B/D).

    *Analyst certification and important disclosures included in the full report. NOTE: investment decisions should not be based upon the content of this research summary. Proper due diligence is required before making any investment decision.