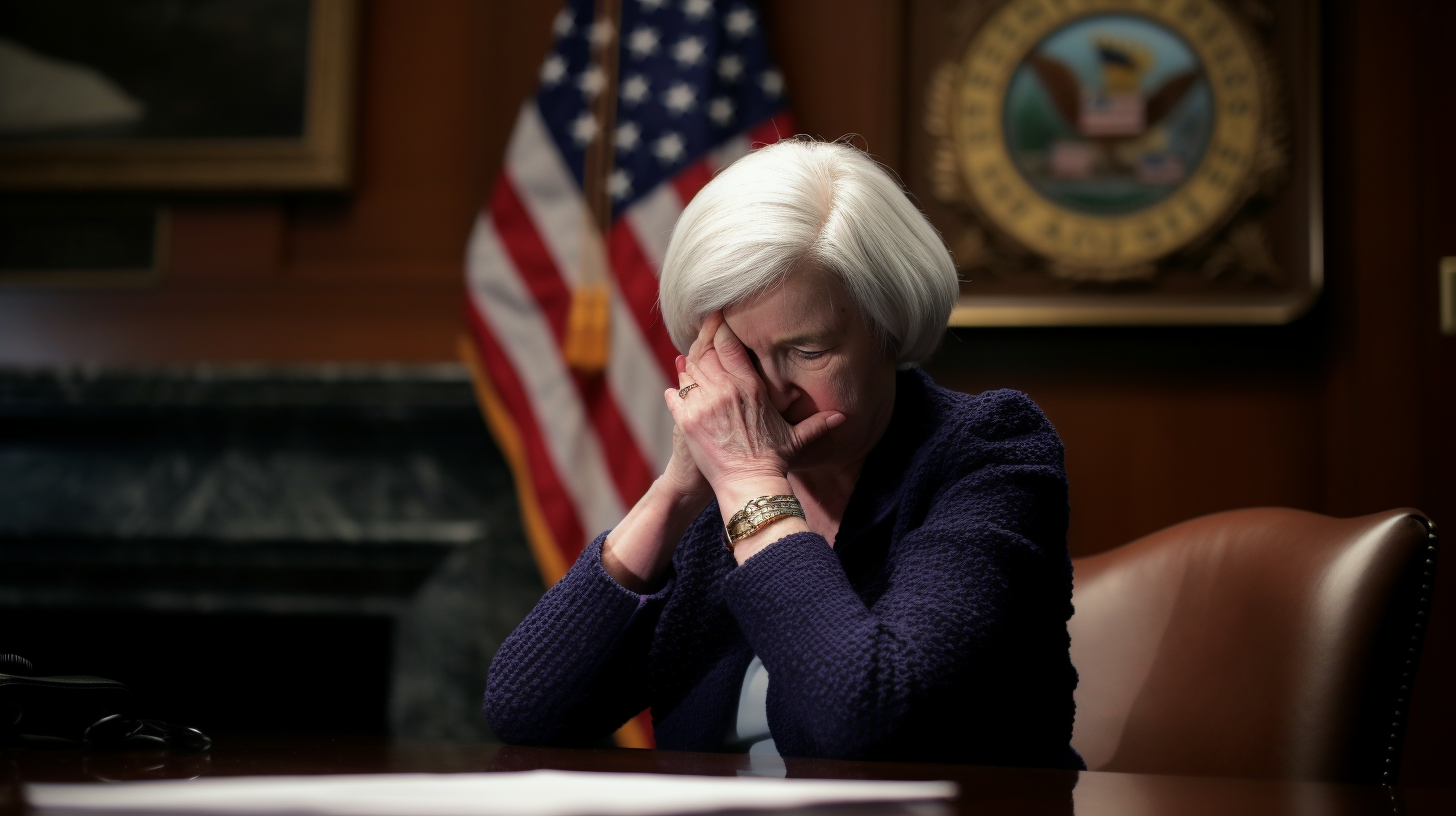
Release – ZyVersa Therapeutics Announces Article in Peer-Reviewed Journal, Ecotoxicology and Environmental Safety, Linking Air Pollution with Development and Progression of Chronic Kidney Disease That Can Be Attenuated by Inhibiting Inflammasome NLRP3 Activation

Research News and Market Data on ZVSA

Nov 6, 2023

PDF Version

  • Despite decades of effective environmental policy and improved air quality in the US, air pollution remains the greatest environmental health risk factor, contributing to 100,000 to 200,000 incremental deaths annually, primarily from fine particulate matter (PM2.5) derived from pollutants including vehicle and industrial emissions from fuel and biomass combustion, cigarette smoke, volcanos, fires, and desert dust.
  • PM2.5 is inhaled into the lungs, spreading through the bloodstream to other organs, especially the kidney, which accumulates it during glomerular filtration, where it triggers NLRP3 inflammasome activation resulting in damaging inflammation and cell death (pyroptosis) leading to chronic kidney disease and its progression.
  • ZyVersa is developing Inflammasome ASC Inhibitor IC 100 which can inhibit up to 12 different inflammasomes (including NLRP3 inflammasomes) and their associated ASC specks which perpetuate damaging inflammation.

WESTON, Fla., Nov. 06, 2023 (GLOBE NEWSWIRE) — ZyVersa Therapeutics, Inc. (Nasdaq: ZVSA, or “ZyVersa”), a clinical stage specialty biopharmaceutical company developing first-in-class drugs for treatment of inflammatory and renal diseases, announces publication of an article in the peer-reviewed journal, Ecotoxicology and Environmental Safety, demonstrating that inhibiting NLRP3 inflammasomes can attenuate kidney damage and dysfunction associated with the environmental pollutant, PM2.5.

In the paper titled, “PM2.5 induces renal tubular injury by activating NLRP3-mediated pyroptosis,” the authors conducted studies in a mouse model exposed to high concentrations of ambient PM2.5 for 12 weeks, and in a mouse kidney cell line. Following are key findings reported in the paper:

  • PM2.5 exposure leads to kidney structural changes and functional impairment.
  • Inflammasome NLRP3-induced Inflammation and pyroptosis were increased in PM2.5-exposed kidney tissues.
  • Inhibiting the inflammasome NLRP3 pathway, including downstream caspase-1, rescued the kidneys from PM2.5-induced cell death.

The authors stated, “We further provided evidence that NLRP3-mediated pyroptosis plays critical roles in the progression of kidney injury induced by PM2.5 exposure. Inhibiting the activation of NLRP3 inflammasome can remarkably protect the renal tubular epithelial cells from PM2.5-induced proptosis.” To read the article, Click Here.

“The research published in the Journal, Ecotoxicology and Environmental Safety, reinforces other published data demonstrating that inhibiting NLRP3 inflammasomes can attenuate kidney damage and dysfunction of multiple causes, now including kidney damage associated with the environmental pollutant, PM2.5,” commented Stephen C. Glover, ZyVersa’s Co-founder, Chairman, CEO and President. “This research provides increasing support for inflammasome inhibition as a promising treatment option for kidney disease, a major health problem affecting over 35 million adults in the United States. ZyVersa is developing Inflammasome ASC inhibitor IC 100. Unlike NLRP3 inhibitors, designed to inhibit formation of one inflammasome to block initiation of the inflammatory cascade, IC 100 was designed to inhibit multiple types of inflammasomes and their associated ASC specks to uniquely block both initiation and perpetuation of damaging inflammation.” To review a white paper summarizing the mechanism of action and preclinical data for IC 100, Click Here.

About Inflammasome ASC Inhibitor IC 100

IC 100 is a novel humanized IgG4 monoclonal antibody that inhibits the inflammasome adaptor protein ASC. IC 100 was designed to attenuate both initiation and perpetuation of the inflammatory response. It does so by binding to a specific region of the ASC component of multiple types of inflammasomes, including NLRP1, NLRP2, NLRP3, NLRC4, AIM2, Pyrin. Intracellularly, IC 100 binds to ASC monomers, inhibiting inflammasome formation, thereby blocking activation of IL-1β early in the inflammatory cascade. IC 100 also binds to ASC in ASC Specks, both intracellularly and extracellularly, further blocking activation of IL-1β and the perpetuation of the inflammatory response that is pathogenic in inflammatory diseases. Because active cytokines amplify adaptive immunity through various mechanisms, IC 100, by attenuating cytokine activation, also attenuates the adaptive immune response.

About ZyVersa Therapeutics, Inc.

ZyVersa (Nasdaq: ZVSA) is a clinical stage specialty biopharmaceutical company leveraging advanced, proprietary technologies to develop first-in-class drugs for patients with renal and inflammatory diseases who have significant unmet medical needs. The Company is currently advancing a therapeutic development pipeline with multiple programs built around its two proprietary technologies – Cholesterol Efflux Mediator™ VAR 200 for treatment of kidney diseases, and Inflammasome ASC Inhibitor IC 100, targeting damaging inflammation associated with numerous CNS and other inflammatory diseases. For more information, please visit www.zyversa.com.

Cautionary Statement Regarding Forward-Looking Statements

Certain statements contained in this press release regarding matters that are not historical facts, are forward-looking statements within the meaning of Section 21E of the Securities Exchange Act of 1934, as amended, and the Private Securities Litigation Reform Act of 1995. These include statements regarding management’s intentions, plans, beliefs, expectations, or forecasts for the future, and, therefore, you are cautioned not to place undue reliance on them. No forward-looking statement can be guaranteed, and actual results may differ materially from those projected. ZyVersa Therapeutics, Inc (“ZyVersa”) uses words such as “anticipates,” “believes,” “plans,” “expects,” “projects,” “future,” “intends,” “may,” “will,” “should,” “could,” “estimates,” “predicts,” “potential,” “continue,” “guidance,” and similar expressions to identify these forward-looking statements that are intended to be covered by the safe-harbor provisions. Such forward-looking statements are based on ZyVersa’s expectations and involve risks and uncertainties; consequently, actual results may differ materially from those expressed or implied in the statements due to a number of factors, including ZyVersa’s plans to develop and commercialize its product candidates, the timing of initiation of ZyVersa’s planned preclinical and clinical trials; the timing of the availability of data from ZyVersa’s preclinical and clinical trials; the timing of any planned investigational new drug application or new drug application; ZyVersa’s plans to research, develop, and commercialize its current and future product candidates; the clinical utility, potential benefits and market acceptance of ZyVersa’s product candidates; ZyVersa’s commercialization, marketing and manufacturing capabilities and strategy; ZyVersa’s ability to protect its intellectual property position; and ZyVersa’s estimates regarding future revenue, expenses, capital requirements and need for additional financing.

New factors emerge from time-to-time, and it is not possible for ZyVersa to predict all such factors, nor can ZyVersa assess the impact of each such factor on the business or the extent to which any factor, or combination of factors, may cause actual results to differ materially from those contained in any forward-looking statements. Forward-looking statements included in this press release are based on information available to ZyVersa as of the date of this press release. ZyVersa disclaims any obligation to update such forward-looking statements to reflect events or circumstances after the date of this press release, except as required by applicable law.

This press release does not constitute an offer to sell, or the solicitation of an offer to buy, any securities.

Corporate and IR Contact:
Karen Cashmere
Chief Commercial Officer
kcashmere@zyversa.com
786-251-9641

Media Contacts
Tiberend Strategic Advisors, Inc.
Casey McDonald
cmcdonald@tiberend.com
646-577-8520

Dave Schemelia
dschemelia@tiberend.com
609-468-9325

Jeff Bezos Joins the Florida Billionaire Club, Ditching High Taxes in Seattle for Miami Life

Amazon founder Jeff Bezos announced he is moving from Seattle to Miami in an emotional Instagram post on Thursday. The billionaire said that while the move is exciting, leaving Seattle is bittersweet.

“Seattle, you will always have a place in my heart,” Bezos wrote.

Bezos established Amazon in Seattle back in 1994, starting out in his garage in the suburb of Bellevue. Over the decades, Amazon transformed Seattle into a major tech hub and is the city’s largest private employer. Bezos stepped down as Amazon CEO last year to become executive chairman, with Andy Jassy succeeding him in the top role.

The billionaire recently purchased two luxury homes in Miami for $79 million and $68 million. He said the move brings him closer to his parents, his partner Lauren Sanchez, and operations for his space company Blue Origin which are increasingly shifting to Cape Canaveral.

Miami has been attracting more of the ultra-wealthy and their companies, luring them with a combination of lifestyle, business opportunities, and low taxes. Finance moguls like Ken Griffin, Dan Loeb and Josh Harris have also bought multi-million dollar Miami Beach mansions during the pandemic.

Griffin notably moved the headquarters of his hedge fund Citadel from Chicago to Miami last year. He is also planning to build a new $1 billion headquarters for Citadel in the city. Inter Miami CF, the Florida soccer club owned by David Beckham, recently signed superstar Lionel Messi who purchased his own lavish home in the area.

While being closer to family and friends is likely a factor, the tax benefits of moving to Florida also can’t be ignored. Jeff Bezos currently resides in Washington State which passed a 7% tax on capital gains that could cost wealthy individuals like Bezos millions when they sell stock.

Meanwhile, Florida is one of nine U.S. states without personal income or capital gains taxes. This tax haven status has drawn more billionaires to make Florida their primary residence. By moving from Seattle to Miami, Bezos could avoid Washington’s new capital gains tax and save huge amounts of money when he eventually sells his Amazon shares.

Why Florida is a Hotspot for Investors

In addition to its tax advantages, Florida offers an appealing climate and business-friendly environment that makes it attractive for investors and investment funds. The state has no personal income tax and no estate tax, allowing investors and funds to grow their capital faster.

Miami has also established itself as a hub for venture capital, with VC funding to Florida startups increasing year over year. Several high-profile investors have already established offices in Miami, and the city is actively trying to recruit more VC funds and angels.

With no state capital gains tax and rising startup activity, Florida provides an optimal environment for investors looking to maximize returns. The influx of investment funds and business incentives continue to make the state more appealing for entrepreneurs as well.

Jeff Bezos is the world’s third richest man according to Bloomberg’s Billionaire Index, with a current net worth of around $139 billion. Nearly all of his wealth comes from the 16% stake he still holds in Amazon stock.

By leaving Washington for Florida, Bezos joins other tech billionaires and investors like PayPal co-founder Peter Thiel and hedge fund manager Paul Tudor Jones who have relocated to the Sunshine State. Miami Mayor Francis Suarez has specifically been trying to court more tech entrepreneurs, investors and venture capital to Miami.

While Bezos did not mention taxes as a reason for his move, the massive savings he will enjoy underscores why Florida has become increasingly popular with the mega-rich. Fellow billionaire Elon Musk also moved himself to Texas in 2020 which does not collect personal income tax.

With no state income tax and a low cost of living relative to coastal cities like New York and San Francisco, Florida provides financial incentives for the wealthy to establish residency. For Jeff Bezos, the hundreds of millions he could save in taxes make relocating to Miami well worth leaving Seattle, the place that birthed his legendary company Amazon.

Release – V2X Announces Third Quarter 2023 Results Earnings

Research News and Market Data on VVX

November 6, 2023

DOWNLOAD(OPENS IN NEW WINDOW)

Third Quarter 2023 Summary

  • Reported record revenues of $1.0 billion, up 5% y/y
  • Awarded bookings of $1.3 billion, increasing backlog to a record high of $13.3 billion
  • Reported operating income of $21.0 million; adjusted operating income1 of $59.5 million
  • Adjusted EBITDA1 of $64.7 million with a margin1 of 6.5%
  • Diluted EPS1 of ($0.21); Adjusted diluted EPS1 of $0.73
  • Reported year-to-date cash flow from operations of $135.2 million, and reduced net debt $88.9 million

MCLEAN, Va., Nov. 6, 2023 /PRNewswire/ — V2X, Inc. (NYSE:VVX) announced third quarter 2023 financial results.

“We achieved record revenue in the third quarter of approximately $1 billion, which demonstrates our unwavering commitment to our clients and the missions we support,” said Chuck Prow, President and Chief Executive Officer of V2X. “Bookings activity in the quarter was strong at $1.3 billion in awards. This yielded total backlog of $13.3 billion, an all-time high for the company and provides solid revenue visibility moving into 2024. Importantly, we are executing the “Expand the Base” component of our strategic framework and were successful in achieving extended scope through client engagement initiatives on existing business, which has yielded $332 million of awards in the quarter and $1.2 billion year-to-date. We are also leveraging our converged capabilities to pursue new business and currently have a robust pipeline of opportunities, which includes ~$19 billion of bids we plan to submit over the next twelve months and over $6 billion submitted and in evaluation.”

Mr. Prow continued, “During the quarter, we had notable success capturing several key pursuits that are representative of V2X’s differentiated ability to deliver technology and operational solutions across the mission lifecycle.  For example, we secured a $190 million five-year, fixed price contract to continue providing training and range operations services to the U.S. Army in the Middle East. Our team will provide training support services as well as instruction, operation, and maintenance of training aids, devices, simulators, and simulations; fixed ranges; deployable ranges; and numerous training facilities. This successful capture leverages our decades of experience providing high consequence training as well as our global scale and will allow V2X to bring our Army client unparalleled service delivery in support of enhancing the warfighting skills via the use of live and virtual training. We continue to invest in the future and are developing the next generation of training capabilities, techniques, and enablers.”

“We have also made remarkable progress organically growing V2X’s environmental capabilities and were recently awarded an $85 million two-year contract to support the recovery and remediation of drinking water. This win builds on V2X’s original work to support the Department of Defense with the establishment of a water supply system for military housing at Red Hill, Hawaii.  Our ability to deliver solutions that generate tangible results and public health benefits have led to incremental work and are now helping to deliver safe drinking water to the local communities. We have also successfully leveraged this capability to win similar work in Japan. We are proud to be supporting such an important environmental mission and believe there is significant opportunity to expand our efforts to other geographic areas both within and outside of the Pacific region.”

“Finally, subsequent to the end of the quarter, we were awarded a $458 million five-year, fixed price program to provide depot site standup as well as organizational, selected intermediate and limited depot level maintenance, and logistics support for the F-5 Adversary aircraft with the Navy and Marine Corps. The F-5 contract, combined with our Naval Test Wing Pacific and Atlantic awards, equates to over $1.7 billion in new work V2X has won with the U.S. Navy over the past ~18 months. I’d like to thank our teams for their commitment to delivering unique and value-added solutions that provide differentiation and enhanced client outcomes.”

Mr. Prow concluded, “We are pleased with our continued revenue growth and record backlog which is supported by the momentum generated through our efforts to converge solutions across our clients’ mission lifecycle.  V2X is differentiating its capability offerings through the intersection of technology and operations, which we believe will continue to create value for our shareholders.”  

Third Quarter 2023 Results 

  • Revenue of $1.0 billion, up 4.5% y/y
  • Operating income of $21.0 million, including merger and integration related costs of $15.8 million, and amortization of acquired intangible assets of $22.6 million 
  • Adjusted operating income1 of $59.5 million
  • Adjusted EBITDA1 of $64.7 million with a 6.5% adjusted EBITDA margin1
  • Diluted EPS1 of ($0.21); Adjusted Diluted EPS1 of $0.73
  • Net debt as of September 29, 2023 of $1.1 billion
  • Total backlog as of September 29, 2023 of $13.3 billion   

“V2X reported revenue of $1.0 billion in the quarter, which represents 4.5% year-over-year growth,” said Shawn Mural, Senior Vice President and Chief Financial Officer. “Revenue growth in the quarter was achieved through continued program execution on existing programs, plus the phase-in of recent awards, including our first task order win with the Department of State, which reached full operational capability approximately two weeks ahead of schedule and has since expanded in size.  We were also successful in continuing to defend our core and have won over $1 billion in recompete programs year to date.” 

“For the quarter, the Company reported operating income of $21.0 million and adjusted operating income1 of $59.5 million. Adjusted EBITDA1 was $64.7 million with a margin of 6.5%, which was influenced by contract mix and performance on certain integrated electronic security programs. Third quarter diluted EPS was ($0.21), due primarily to merger and integration related costs, amortization of acquired intangible assets, and interest expense. Adjusted diluted EPS1 for the quarter was $0.73.”

“Cash generation was strong and net cash provided by operating activities was $135.2 million year to date. Adjusted net cash provided by operating activities1 year to date was $83.6 million, adding back $20.9 million of M&A and integration costs with $13.4 million of CARES act payments, and removing the contribution of the master accounts receivable purchase or MARPA facility of $85.8 million.”

“At the end of the quarter, net debt for V2X was $1,131.8 million.  Our solid cash generation has enabled V2X to reduce its total debt by $88.9 million year to date. Net consolidated indebtedness to EBITDA(net leverage ratio) was 3.46x.  Additionally, our strong fundamentals and cash flow profile allowed us to reprice our Term Loan B shortly after the quarter close. We expect the new pricing to reduce annual interest expense by $2 million,” said Mr. Mural.  

Total backlog as of September 29, 2023, was $13.3 billion. Funded backlog was $3.2 billion. Bookings in the quarter were $1.3 billion, resulting in a book-to-bill of 1.3x. The trailing twelve-month book-to-bill was 1.1x.

2023 Guidance
Mr. Mural concluded, “Based on what we are seeing in the business we are raising the low end and mid-point of our full year revenue projections. Given third-quarter results and our outlook, we are lowering the ranges for adjusted EBITDA and adjusted diluted EPS. This change incorporates year-to-date results, including the program performance mentioned earlier and timing of activities associated with national security support. We are reaffirming guidance for adjusted net cash provided by operating activities.” The Company is adjusting its 2023 guidance and is as follows:       

$ millions, except for per share amounts2023 Guidance
(Updated)
2023 Mid-Point
(Updated)
Revenue$3,900$3,950$3,925
Adjusted EBITDA1$285$295$290
Adjusted Diluted Earnings Per Share1$3.50$3.75$3.62
Adjusted Net Cash Provided by Operating Activities 1$115$135$125

Forward-looking statements are based upon current expectations and are subject to factors that could cause actual results to differ materially from those suggested here, including those factors set forth in the Safe Harbor Statement below. 

Third Quarter 2023 Conference Call

Management will conduct a conference call with analysts and investors at 8:00 a.m. ET on Monday, November 6, 2023. U.S.-based participants may dial in to the conference call at 877-407-3982, while international participants may dial 201-493-6780. A live webcast of the conference call as well as an accompanying slide presentation will be available here: https://app.webinar.net/gAed3AVKra2

A replay of the conference call will be posted on the V2X website shortly after completion of the call and will be available for one year. A telephonic replay will also be available through November 20, 2023, at 844-512-2921 (domestic) or 412-317-6671 (international) with passcode 13742132.

Presentation slides that will be used in conjunction with the conference call will also be made available online in advance on the “investors” section of the company’s website at https://gov2x.com/. V2X recognizes its website as a key channel of distribution to reach public investors and as a means of disclosing material non-public information to comply with its obligations under the U.S. Securities and Exchange Commission (“SEC”) Regulation FD.

Footnotes:
1 See “Key Performance Indicators and Non-GAAP Financial Measures” for descriptions and reconciliations.

About V2X
V2X builds smart solutions designed to integrate physical and digital infrastructure – from base to battlefield – by aligning people, actions, and outputs. Formed by the merger of Vectrus and Vertex, we bring a combined 120 years of successful mission support. Our lifecycle solutions improve security, streamline logistics, and enhance readiness.

The Company delivers a comprehensive suite of integrated solutions across the operations and logistics, aerospace, training, and technology markets to national security, defense, civilian and international clients. Our global team of approximately 15,000 employees brings innovation to every point in the mission lifecycle, from preparation to operations, to sustainment, as it tackles the most complex challenges with agility, grit, and dedication.

Safe Harbor Statement

Safe Harbor Statement under the Private Securities Litigation Reform Act of 1995 (the “Act”): Certain material presented herein includes forward-looking statements intended to qualify for the safe harbor from liability established by the Act. These forward-looking statements include, but are not limited to, all the statements and items listed under “2023 Guidance” above and other assumptions contained therein for purposes of such guidance, other statements about our 2023 performance outlook, revenue, contract opportunities, and any discussion of future operating or financial performance.

Forward-looking statements generally can be identified by the use of forward-looking terminology such as “may,” “will,” “expect,” “intend,” “estimate,” “anticipate,” “believe,” “could,” “potential,” “continue” or similar terminology. These statements are based on the beliefs and assumptions of the management of the Company based on information currently available to management.

These forward-looking statements are not guarantees of future performance, conditions, or results, and involve a number of known and unknown risks, uncertainties, assumptions, and other important factors, many of which are outside our management’s control, which could cause actual results to differ materially from the results discussed in the forward-looking statements.  In addition, forward-looking statements are subject to certain risks and uncertainties that could cause actual results to differ materially from the Company’s historical experience and our present expectations or projections. For a discussion of some of the risks and uncertainties that could cause actual results to differ from such forward-looking statements, see the risks and other factors detailed from time to time our Annual Report on Form 10-K, Quarterly Reports on Form 10-Q, and other filings with the SEC.

We undertake no obligation to update any forward-looking statements, whether as a result of new information, future events or otherwise, except as required by law.

Key Performance Indicators and Non-GAAP Measures

The primary financial performance measures we use to manage our business and monitor results of operations are revenue trends and operating income trends. Management believes that these financial performance measures are the primary drivers for our earnings and net cash from operating activities. Management evaluates its contracts and business performance by focusing on revenue, operating income, and operating margin. Operating income represents revenue less both cost of revenue and selling, general and administrative (SG&A) expenses. Cost of revenue consists of labor, subcontracting costs, materials, and an allocation of indirect costs, which includes service center transaction costs. SG&A expenses consist of indirect labor costs (including wages and salaries for executives and administrative personnel), bid and proposal expenses and other general and administrative expenses not allocated to cost of revenue. We define operating margin as operating income divided by revenue.

We manage the nature and amount of costs at the program level, which forms the basis for estimating our total costs and profitability. This is consistent with our approach for managing our business, which begins with management’s assessing the bidding opportunity for each contract and then managing contract profitability throughout the performance period.

In addition to the key performance measures discussed above, we consider adjusted net income, adjusted diluted earnings per share, adjusted operating income, adjusted EBITDA, adjusted EBITDA margin, adjusted operating cash flow, and pro forma revenue to be useful to management and investors in evaluating our operating performance, and to provide a tool for evaluating our ongoing operations. This information can assist investors in assessing our financial performance and measures our ability to generate capital for deployment among competing strategic alternatives and initiatives. We provide this information to our investors in our earnings releases, presentations, and other disclosures.

Adjusted net income, adjusted diluted earnings per share, adjusted operating income, adjusted EBITDA, adjusted EBITDA margin, adjusted net cash provided by (used in) operating activities, and pro forma revenue, however, are not measures of financial performance under GAAP and should not be considered a substitute for financial measures determined in accordance with GAAP.  Definitions and reconciliations of these items are provided below.

  • Pro forma revenue is defined as the combined results of our operations as if the Merger had occurred on January 1, 2021.
  • Adjusted operating income is defined as operating income, adjusted to exclude items that may include, but are not limited to, significant charges or credits, and unusual and infrequent non-operating items that impact current results but are not related to our ongoing operations, such as M&A, integration, and related costs.
  • Adjusted EBITDA is defined as operating income, adjusted to exclude depreciation and amortization of intangible assets, and items that may include, but are not limited to, significant charges or credits, and unusual and infrequent non-operating items that impact current results but are not related to our ongoing operations, such as M&A, integration, and related costs.
  • Adjusted EBITDA margin is defined as adjusted EBITDA divided by revenue.
  • Adjusted net income is defined as net income, adjusted to exclude items that may include, but are not limited to, significant charges or credits, and unusual and infrequent non-operating items that impact current results but are not related to our ongoing operations, such as M&A, integration and related costs, amortization of acquired intangible assets, amortization of debt issuance costs, and loss on extinguishment of debt.
  • Adjusted diluted earnings per share is defined as adjusted net income divided by the weighted average diluted common shares outstanding.
  • Cash interest, net is defined as interest expense, net adjusted to exclude amortization of debt issuance costs.
  • Adjusted net cash provided by ( used in) operating activities is defined as net cash provided by (or used in) operating activities adjusted to exclude infrequent non-operating items, such as M&A payments and related costs.
  • Net leverage ratio is defined as net debt (or total debt less unrestricted cash) divided by trailing twelve-month (TTM) bank EBITDA.

In this document, the Company presents certain forward-looking non-GAAP metrics. The Company does not provide outlook on a GAAP basis because the items that the Company excludes from GAAP to calculate the comparable non-GAAP measure can be dependent on future events that are less capable of being controlled or reliably predicted by management and are not part of the Company’s routine operating activities. Additionally, management does not forecast many of the excluded items for internal use and therefore cannot create or rely on outlook done on a GAAP basis.  The occurrence, timing, and amount of any of the items excluded from GAAP to calculate non-GAAP could significantly impact the Company’s fiscal 2023 GAAP results.

CONTACT:

V2X, Inc.
Mike Smith, CFA
719-637-5773
ir@gov2x.com

View original content to download multimedia:https://www.prnewswire.com/news-releases/v2x-announces-third-quarter-2023-results-301977997.html

SOURCE V2X, Inc.

Release – Harte Hanks Bolsters Inside Sales Leadership, Names Ron Lee, Proven Sales Leader, as Senior Vice President of Inside Sales

Research News and Market Data on HHS

Monday, 06 November 2023 08:30

CHELMSFORD, MA / ACCESSWIRE / November 6, 2023 / Harte Hanks, Inc. (NASDAQ:HHS), a leading global customer experience company focused on bringing companies closer to customers for 100 years, today announced that Ron Lee, an experienced executive with a proven track record of driving revenue growth and operational improvement by developing talent, leveraging analytics and innovating through technology modernization, has joined Harte Hanks as Senior Vice President of Sales Services. Mr. Lee will lead Harte Hanks’ sales offering, which includes inside sales outsourcing, sales transformation and optimization, and sales play development.

Lee joins Harte Hanks from Procore Technologies, a leading SaaS provider specializing in the construction industry, where he served as the Head of Revenue Planning and Productivity. Previously, he spent 10 years at ADP developing and executing the global inside sales strategy, transforming the sales & marketing tech stack and implementing predictive analytics within GTM processes. Mr. Lee started his career at PwC and has also served in sales operations and finance leadership roles at Lucent Technologies, D&B and Merck. He holds a Bachelor’s degree in Accounting from Villanova University and a MBA in Marketing, Finance and International Business from New York University.

Kirk Davis, Chief Executive Officer, commented: “We continue to recruit top sales talent to revitalize our growth engine. Ron, along with Kelly Waller, our new Corporate SVP for Sales and Marketing, are both accomplished leaders with a deep understanding of how to create solutions for enterprise clients. Ron takes the helm of Harte Hanks’ Sales Services division, which originated through our acquisition of InsideOut last December. Ron is a critical hire at a pivotal time. Inside sales is a valuable offering for our clients, and an area in which we expect to achieve a strong rebound, accelerating growth and higher profitability in 2024.”

“Inside sales is essential for the growth and transformation of sales through digital technology, cost savings, and the ability to meet the changing preferences of buyers,” commented Mr. Lee. “Harte Hanks has built powerful tools to streamline this process for clients, and this offering provides a quantifiable return on investment. I look forward to bringing this value proposition to new logos and expanding our relationships with existing customers.”

About Harte Hanks:

Harte Hanks (NASDAQ: HHS) is a leading global customer experience company whose mission is to partner with clients to provide them with CX strategy, data-driven analytics and actionable insights combined with seamless program execution to better understand, attract and engage their customers.

Using its unparalleled resources and award-winning talent in the areas of Customer Care, Fulfillment and Logistics, and Marketing Services, Harte Hanks has a proven track record of driving results for some of the world’s premier brands, including Bank of America, GlaxoSmithKline, Unilever, Pfizer, HBOMax, Volvo, Ford, FedEx, Midea, Sony and IBM among others. Headquartered in Chelmsford, Massachusetts, Harte Hanks has over 2,500 employees in offices across the Americas, Europe, and Asia Pacific.

For more information, visit hartehanks.com

As used herein, “Harte Hanks” or “the Company” refers to Harte Hanks, Inc. and/or its applicable operating subsidiaries, as the context may require. Harte Hanks’ logo and name are trademarks of Harte Hanks.

Cautionary Note Regarding Forward-Looking Statements:

Our press release and related earnings conference call contain “forward-looking statements” within the meaning of U.S. federal securities laws. All such statements are qualified by this cautionary note, provided pursuant to the safe harbor provisions of Section 27A of the Securities Act of 1933 and Section 21E of the Securities Exchange Act of 1934. Statements other than historical facts are forward-looking and may be identified by words such as “may,” “will,” “expects,” “believes,” “anticipates,” “plans,” “estimates,” “seeks,” “could,” “intends,” or words of similar meaning. These forward-looking statements are based on current information, expectations and estimates and involve risks, uncertainties, assumptions and other factors that are difficult to predict and that could cause actual results to vary materially from what is expressed in or indicated by the forward-looking statements. In that event, our business, financial condition, results of operations or liquidity could be materially adversely affected and investors in our securities could lose part or all of their investments. These risks, uncertainties, assumptions and other factors include: (a) local, national and international economic and business conditions, including (i) the outbreak of diseases, such as the COVID-19 coronavirus, which has curtailed travel to and from certain countries and geographic regions, created supply chain disruption and shortages, disrupted business operations and reduced consumer spending, (ii) market conditions that may adversely impact marketing expenditures, (iii) the impact of the Russia/Ukraine conflict on the global economy and our business, including impacts from related sanctions and export controls and (iv) the impact of economic environments and competitive pressures on the financial condition, marketing expenditures and activities of our clients and prospects; (b) the demand for our products and services by clients and prospective clients, including (i) the willingness of existing clients to maintain or increase their spending on products and services that are or remain profitable for us, and (ii) our ability to predict changes in client needs and preferences; (c) economic and other business factors that impact the industry verticals we serve, including competition and consolidation of current and prospective clients, vendors and partners in these verticals; (d) our ability to manage and timely adjust our facilities, capacity, workforce and cost structure to effectively serve our clients; (e) our ability to improve our processes and to provide new products and services in a timely and cost-effective manner though development, license, partnership or acquisition; (f) our ability to protect our facilities against security breaches and other interruptions and to protect sensitive personal information of our clients and their customers; (g) our ability to respond to increasing concern, regulation and legal action over consumer privacy issues, including changing requirements for collection, processing and use of information; (h) the impact of privacy and other regulations, including restrictions on unsolicited marketing communications and other consumer protection laws; (i) fluctuations in fuel prices, paper prices, postal rates and postal delivery schedules; (j) the number of shares, if any, that we may repurchase in connection with our repurchase program; (k) unanticipated developments regarding litigation or other contingent liabilities; (l) our ability to complete anticipated divestitures and reorganizations, including cost-saving initiatives; (m) our ability to realize the expected tax refunds; and (n) other factors discussed from time to time in our filings with the Securities and Exchange Commission, including under “Item 1A. Risk Factors” in our Annual Report on Form 10-K for the year ended December 31, 2022 which was filed on March 31, 2023. The forward-looking statements in this press release and our related earnings conference call are made only as of the date hereof, and we undertake no obligation to update publicly any forward-looking statement, even if new information becomes available or other events occur in the future.

Investor Relations Contact:

Rob Fink or Tom Baumann
646.809.4048 / 646.349.6641
FNK IR
HHS@fnkir.com

SOURCE: Harte Hanks, Inc.

Kratos Defense & Security (KTOS) – Third Quarter Results Above Expectations


Monday, November 06, 2023

Kratos Defense & Security Solutions, Inc. (NASDAQ:KTOS) develops and fields transformative, affordable technology, platforms, and systems for United States National Security related customers, allies, and commercial enterprises. Kratos is changing the way breakthrough technologies for these industries are rapidly brought to market through proven commercial and venture capital backed approaches, including proactive research, and streamlined development processes. At Kratos, affordability is a technology, and we specialize in unmanned systems, satellite communications, cyber security/warfare, microwave electronics, missile defense, hypersonic systems, training and combat systems and next generation turbo jet and turbo fan engine development. For more information go to www.kratosdefense.com.

Joe Gomes, Managing Director, Equity Research Analyst, Generalist , Noble Capital Markets, Inc.

Joshua Zoepfel, Research Associate, Noble Capital Markets, Inc.

Refer to the full report for the price target, fundamental analysis, and rating.

3Q23 Results. Partially helped by one extra week, third quarter results came in above expectations. Revenue totaled $274.6 million, up 20.1% y-o-y. Adjusted EBITDA came in at $27.7 million, up from $20 million in 3Q22. GAAP EPS loss was $0.01 and adjusted EPS was $0.12, compared to a EPS loss of $0.06 and adjusted EPS of $0.08, respectively, a year ago. We had forecasted $250 million, $20.5 million, breakeven, and $0.09, respectively.

Organic Growth Again the Driver. Kratos generated 20.1% overall organic growth in the quarter. The Government Solutions Segment saw overall revenue increase 22% organically to $217.9 million. The Unmanned Systems segment saw 13.4% organic revenue growth, with revenue of $56.7 million.


Get the Full Report

Equity Research is available at no cost to Registered users of Channelchek. Not a Member? Click ‘Join’ to join the Channelchek Community. There is no cost to register, and we never collect credit card information.

This Research is provided by Noble Capital Markets, Inc., a FINRA and S.E.C. registered broker-dealer (B/D).

*Analyst certification and important disclosures included in the full report. NOTE: investment decisions should not be based upon the content of this research summary. Proper due diligence is required before making any investment decision. 

Information Services Group (III) – A Mixed Third Quarter but Optimism Remains


Monday, November 06, 2023

ISG (Information Services Group) (Nasdaq: III) is a leading global technology research and advisory firm. A trusted business partner to more than 700 clients, including more than 75 of the world’s top 100 enterprises, ISG is committed to helping corporations, public sector organizations, and service and technology providers achieve operational excellence and faster growth. The firm specializes in digital transformation services, including automation, cloud and data analytics; sourcing advisory; managed governance and risk services; network carrier services; strategy and operations design; change management; market intelligence and technology research and analysis. Founded in 2006, and based in Stamford, Conn., ISG employs more than 1,300 digital-ready professionals operating in more than 20 countries—a global team known for its innovative thinking, market influence, deep industry and technology expertise, and world-class research and analytical capabilities based on the industry’s most comprehensive marketplace data. For additional information, visit www.ISG-One.com

Joe Gomes, Managing Director, Equity Research Analyst, Generalist , Noble Capital Markets, Inc.

Joshua Zoepfel, Research Associate, Noble Capital Markets, Inc.

Refer to the full report for the price target, fundamental analysis, and rating.

A Miss but Record Quarter. Although revenue was below management’s guidance, it was still a record third quarter on a revenue basis. Business is not being lost, but clients are taking an extended approach to starting projects. We expect this situation to be short-term in nature.

Ventana. We are excited by the opportunities Ventana brings to ISG. In addition to adding to ISG’s recurring revenue stream, Ventana adds some 40 new clients in a new vertical for ISG. We believe there are significant synergistic and cross selling opportunities.


Get the Full Report

Equity Research is available at no cost to Registered users of Channelchek. Not a Member? Click ‘Join’ to join the Channelchek Community. There is no cost to register, and we never collect credit card information.

This Company Sponsored Research is provided by Noble Capital Markets, Inc., a FINRA and S.E.C. registered broker-dealer (B/D).

*Analyst certification and important disclosures included in the full report. NOTE: investment decisions should not be based upon the content of this research summary. Proper due diligence is required before making any investment decision. 

Eagle Bulk Shipping (EGLE) – September Quarter Results Near Expectations, Management Locks in More Pricing


Monday, November 06, 2023

Eagle Bulk Shipping Inc. (“Eagle”) is a US-based drybulk owner-operator focused on the Supramax/Ultramax mid-size asset class, which ranges from 50,000 and 65,000 deadweight tons in size; these vessels are equipped with onboard cranes allowing for the self-loading and unloading of cargoes, a feature which distinguishes them from the larger classes of drybulk vessels and provides for greatly enhanced flexibility and versatility- both with respect to cargo diversity and port accessibility. The Company transports a broad range of major and minor bulk cargoes around the world, including coal, grain, ore, pet coke, cement, and fertilizer. Eagle operates out of three offices, Stamford (headquarters), Singapore, and Hamburg, and performs all aspects of vessel management in-house including: commercial, operational, technical, and strategic.

Michael Heim, Senior Vice President, Equity Research Analyst, Energy & Transportation, Noble Capital Markets, Inc.

Refer to the full report for the price target, fundamental analysis, and rating.

Eagle Bulk Shipping 2023-3Q revenues and earnings were in line with recently updated projections. Eagle reported an average TCE rate of $11,482/day down from $14,367/day in the previous quarter. Eagle continues to command a premium to index rates due to its fleet of newer, scrubber-installed ships.

Management indicated it locked in 68% of 2023-4Q shipping days at a favorable rate of $15,655/day. Guidance for costs per day were largely unchanged from the recently reported quarter. The upcoming jump in TCE rates should result in an improvement in cash flow. Management indicated it will likely use free cash flow to pay down debt. The company fixed additional debt with swaps during the quarter and now estimates that 75% of its debt has been fixed at a rate of 5.2%. 


Get the Full Report

Equity Research is available at no cost to Registered users of Channelchek. Not a Member? Click ‘Join’ to join the Channelchek Community. There is no cost to register, and we never collect credit card information.

This Research is provided by Noble Capital Markets, Inc., a FINRA and S.E.C. registered broker-dealer (B/D).

*Analyst certification and important disclosures included in the full report. NOTE: investment decisions should not be based upon the content of this research summary. Proper due diligence is required before making any investment decision. 

E.W. Scripps (SSP) – Favorable Tailwinds in 2024


Monday, November 06, 2023

The E.W. Scripps Company (NASDAQ: SSP) is a diversified media company focused on creating a better-informed world. As one of the nation’s largest local TV broadcasters, Scripps serves communities with quality, objective local journalism and operates a portfolio of 61 stations in 41 markets. The Scripps Networks reach nearly every American through the national news outlets Court TV and Newsy and popular entertainment brands ION, Bounce, Defy TV, Grit, ION Mystery, Laff and TrueReal. Scripps is the nation’s largest holder of broadcast spectrum. Scripps runs an award-winning investigative reporting newsroom in Washington, D.C., and is the longtime steward of the Scripps National Spelling Bee. Founded in 1878, Scripps has held for decades to the motto, “Give light and the people will find their own way.”

Michael Kupinski, Director of Research, Equity Research Analyst, Digital, Media & Technology , Noble Capital Markets, Inc.

Refer to the full report for the price target, fundamental analysis, and rating.

Overachieves Q3 expectations. Total company revenue of $ 566.5 million was in line with our expectations of $567.0 million. But, the company overachieved adj. EBITDA, $100.9 million versus our $84.0 million estimate, with the upside variance split evenly between its Local Media and Network segments. 

Adds color on its sports initiative. Management indicated that its two NHL sports licenses will account for a 4% point increase in its core advertising in the fourth quarter and 3% for the full year 2023. The sports license in Las Vegas allowed the company to flip an ION station to an independent station allowing it to receive substantial retransmission revenue. 


Get the Full Report

Equity Research is available at no cost to Registered users of Channelchek. Not a Member? Click ‘Join’ to join the Channelchek Community. There is no cost to register, and we never collect credit card information.

This Research is provided by Noble Capital Markets, Inc., a FINRA and S.E.C. registered broker-dealer (B/D).

*Analyst certification and important disclosures included in the full report. NOTE: investment decisions should not be based upon the content of this research summary. Proper due diligence is required before making any investment decision. 

Commercial Vehicle Group, Inc. (CVGI) – What One Hand Gives…


Monday, November 06, 2023

Joe Gomes, Managing Director, Equity Research Analyst, Generalist , Noble Capital Markets, Inc.

Joshua Zoepfel, Research Associate, Noble Capital Markets, Inc.

Refer to the full report for the price target, fundamental analysis, and rating.

Moving Forward, but Cyclicality Still Here. CVG is making progress on the business transformation to a less cyclical, higher margin, faster growing business, as evidenced by the 17% y-o-y growth in the Electrical Systems business. But the cyclicality of the Vehicle Solutions business remains, and will be a headwind in 2024.

Continuing to Add New Business. CVG recorded approximately $15 million of new business wins in the quarter, increasing the YTD number to $140 million, almost to the 2023 goal of $150 million of new business wins. The majority of new business wins continue to be within the Electrical Systems segment.


Get the Full Report

Equity Research is available at no cost to Registered users of Channelchek. Not a Member? Click ‘Join’ to join the Channelchek Community. There is no cost to register, and we never collect credit card information.

This Company Sponsored Research is provided by Noble Capital Markets, Inc., a FINRA and S.E.C. registered broker-dealer (B/D).

*Analyst certification and important disclosures included in the full report. NOTE: investment decisions should not be based upon the content of this research summary. Proper due diligence is required before making any investment decision. 

ACCO Brands (ACCO) – A Mixed Third Quarter


Monday, November 06, 2023

ACCO Brands Corporation is one of the world’s largest designers, marketers and manufacturers of branded academic, consumer and business products. Our widely recognized brands include AT-A-GLANCE®, Esselte®, Five Star®, GBC®, Kensington®, Leitz®, Mead®, PowerA®, Quartet®, Rapid®, Rexel®, Swingline®, Tilibra®, and many others. Our products are sold in more than 100 countries around the world. More information about ACCO Brands, the Home of Great Brands Built by Great People, can be found at www.accobrands.com.

Joe Gomes, Managing Director, Equity Research Analyst, Generalist , Noble Capital Markets, Inc.

Joshua Zoepfel, Research Associate, Noble Capital Markets, Inc.

Refer to the full report for the price target, fundamental analysis, and rating.

Continued Margin Expansion. Gross profit margin increased 400 basis points to 32.3%, primarily due to the cumulative effect of global price increases and cost reduction actions. Year-to-date, ACCO has delivered 380 basis points of gross margin improvement and is now back to 2019 gross margin rate.

But Environment Is Challenged. Macroeconomic weakness, with prolonged softer global demand for technology accessories, and a stronger U.S. dollar, led to lower than expected sales in the quarter. In addition, major retailers in North America continue to focus on holding lower inventory levels, impacting ACCO revenue. The challenged environment is expected to continue at least through the fourth quarter.


Get the Full Report

Equity Research is available at no cost to Registered users of Channelchek. Not a Member? Click ‘Join’ to join the Channelchek Community. There is no cost to register, and we never collect credit card information.

This Company Sponsored Research is provided by Noble Capital Markets, Inc., a FINRA and S.E.C. registered broker-dealer (B/D).

*Analyst certification and important disclosures included in the full report. NOTE: investment decisions should not be based upon the content of this research summary. Proper due diligence is required before making any investment decision. 

Israel-Hamas Conflict Could Catapult Oil Prices to Record High of $157 Per Barrel

The ongoing fighting between Israel and Hamas risks causing substantial disruptions to the global oil market, threatening to send crude prices to unprecedented levels according to a new warning from the World Bank.

In a worst-case scenario where the conflict escalates and key oil producing nations impose embargos, oil prices could surge as high as $157 per barrel. That would far surpass the previous record of $147 set in 2008 and have dramatic ripple effects across industries.

The World Bank laid out various scenarios in its latest commodity outlook report. In a “large disruption” comparable to the 1973 Arab oil embargo, global supplies could drop by 6 to 8 million barrels per day. This massive shortage of oil on the international market would cause prices to jump by 56-75%, catapulting prices up to the $140 to $157 range.

The crisis in 1973 quadrupled oil prices after Arab producers like Saudi Arabia and Iraq imposed an export ban on nations supporting Israel in the Yom Kippur War. While neither Israel nor Hamas are major oil exporters themselves, provoking producers in the surrounding region poses a major risk.

Surging crude prices would directly impact consumers at the gas pump. Each $10 rise in the cost of a barrel of crude translates to about a 25 cent increase in gas prices according to analysts. That means if oil hit $150, gas could surge above $4 per gallon nationally, far exceeding the recent highs earlier this year. Areas like California would likely see prices cross $5 or even $6 per gallon.

High fuel costs not only hurt commuters but drive up expenses for the transportation industry. Airlines would be forced to raise ticket prices to cover the inflated expense of jet fuel. Trucking and freight companies would also pass on the costs through higher shipping rates, feeding inflation throughout the economy.

Plastics and chemical manufacturers dependent on petrochemical feedstocks would see margins squeezed as oil prices stay elevated. Other goods with significant transportation expenses embedded in their supply chains would also see prices increased.

The pain would not be limited to oil-reliant sectors. As consumers are forced to spend more on transportation and energy needs, discretionary income gets reduced. This results in lower spending at retailers, restaurants and entertainment venues. Tourism also declines as pricier gas dissuades vacations and trips.

In essence, persistently high oil prices threaten to stall the economy by depressing spending, raising inflation and input costs across many industries all at once. While the US is now a net exporter of crude and refined fuels, it remains exposed to global price movements shaped by international events.

The World Bank warned that an escalation of the Israel-Hamas tensions could create a dual supply shock when combined with reduced oil and gas exports from Russia. Global markets are still reeling from the loss of Russian energy supplies due to Western sanctions and bans.

Prior to Russia’s invasion of Ukraine, investment bank Goldman Sachs had predicted oil could reach $100 per barrel this year. The fighting has already caused prices to spike above $120 at points, showing how geopolitical instability in one region can roil prices worldwide.

The grim scenarios described by the World Bank underscore the interconnectedness binding energy markets across the globe. An event thousands of miles away increasing instability in the Middle East could end up costing American consumers, businesses, and the economy dearly.

While the baseline forecast calls for prices to moderate over the next year, an expansion of the Israel-Hamas conflict could upend those predictions. Investors, businesses, and policymakers must watch the situation closely to prepare for the economic impacts of further turmoil.

All parties involved must also be cognizant of how violence that disrupts oil production and trade risks global fallout. Diplomatic solutions take on new urgency to prevent a worst-case scenario that would inflict widespread hardship as oil races past $150 per barrel into uncharted territory.

Cargo Therapeutics Positions for One of 2023’s Largest Biotech IPOs

Cargo Therapeutics is gearing up for an initial public offering (IPO) that could be one of the biggest biotech listings in 2023. The cancer-focused gene therapy startup aims to raise around $300 million through the sale of 18.75 million shares priced between $15 to $17.

If successful, it would be a rare bright spot in an otherwise dreary IPO market for life science companies this year. Cargo’s offering comes at a time when biotech IPOs have slowed to a trickle amid volatile market conditions.

The company is developing CRG-022, an experimental CD22 CAR-T therapy for certain blood cancers. Cargo’s candidate takes a patient’s own T-cells and engineers them to target and kill cancerous B-cells expressing the CD22 antigen.

Cargo hopes CRG-022 can benefit patients with large B-cell lymphoma who have failed previous CD19 CAR-T treatment. It initiated a potentially pivotal Phase 2 trial for this population in September. Data from the study could support regulatory approval in 2025.

Beyond blood cancers, Cargo intends to study CRG-022 in solid tumors expressing CD22. This includes some forms of breast, lung, colorectal and liver cancers. The company believes its therapy may demonstrate activity in a wider range of advanced cancers than existing CAR-Ts.

Proceeds from the IPO will help fund Cargo’s clinical programs and earlier R&D. According to its SEC filing, the company had $42.4 million in cash at the end of June 2022 but accumulated losses exceeding $77 million. The capital infusion will provide runway through the expected interim Phase 2 data readout.

Take a moment to take a look at more emerging biotech companies by looking at Noble Capital Markets’ Senior Research Analyst Robert LeBoyer’s coverage universe.

Cargo’s offering will be a key test of investor appetite for preclinical biotech IPOs. These platform companies developing multiple experimental drugs based on a core technology have fallen out of favor recently.

However, Cargo could attract more interest with CRG-022 already in mid-stage testing and potential for near-term commercialization. The FDA has approved several CAR-T cell therapies over the past five years, providing a regulatory pathway for followers like Cargo.

But biotech IPOs in general face challenges in the current environment. Volatility, rising interest rates, and recession fears have rocked stock markets in 2022. Biotech has been among the hardest hit sectors, with the Nasdaq Biotech Index down over 30% year-to-date.

Companies pursuing IPOs have been forced to scale back valuations and offering sizes. Those that do list are often trading below issue price. So far in 2022, only around 15 biotechs have braved public markets compared to 60+ in recent years.

Yet some experts believe companies with innovative therapies and strong data can still obtain IPO financing. Cargo will provide a barometer of latent investor demand for biotech offerings amid the downturn.

A successful IPO could potentially reinvigorate biotech’s depressed financing environment. It may encourage other firms contemplating IPOs to move forward with planned deals.

Conversely, a lackluster response would signal biotech IPOs remain out-of-favor for now. This could lead companies to instead pursue private financing to advance programs and extend runways.

In any case, Cargo’s listing will generate insight into the health of biotech capital markets. The deal’s performance could significantly influence investment decisions and sentiment around the battered sector heading into 2023.

All eyes will be on whether one of biotech’s most promising young companies can buck the prevailing IPO trends. Cargo’s offering will help determine if the window for issuance might finally be opening back up.

Release – Eagle Bulk Shipping Inc. Reports Results for the Third Quarter of 2023

Research News and Market Data on EGLE

November 2, 2023 at 4:30 PM EDT

PDF Version

STAMFORD, Conn., Nov. 02, 2023 (GLOBE NEWSWIRE) — Eagle Bulk Shipping Inc. (NYSE: EGLE) (“Eagle” or the “Company”), one of the world’s largest owner-operators within the midsize drybulk vessel segment, today reported financial results for the quarter ended September 30, 2023.

Quarter Highlights:

  • Generated Revenues, net of $82.6 million
    • Achieved TCE(1) of $11,482 based on TCE Revenue(1) of $54.1 million
  • Incurred a net loss of $5.2 million, or $0.55 per basic share
    • Adjusted net loss(1) of $2.9 million, or $0.31 per basic share(1)
  • Generated Adjusted EBITDA(1) of $15.6 million
  • Completed the sale of the Sankaty Eagle, a non-core, non-scrubber-fitted Supramax bulkcarrier
  • Declared a quarterly dividend of $0.10 per share for the third quarter of 2023

    • Dividend is payable on November 22, 2023 to shareholders of record at the close of business on November 14, 2023

1 These are non-GAAP financial measures. A reconciliation of GAAP to non-GAAP financial measures has been provided in the financial tables included in this press release. An explanation of these measures and how they are calculated are also included below under the heading “Supplemental Information – Non-GAAP Financial Measures.”

Recent Developments:

  • Coverage position for the fourth quarter of 2023 is as follows:
    • 68% of owned available days fixed at an average TCE of $15,655

Eagle’s CEO Gary Vogel commented, “Although our financial results for the third quarter are reflective of the headwinds faced by the broader industry, we were able to once again outperform the BSI (Baltic Supramax Index) by 14%, achieving a net TCE of $11,482. Specifically, market fundamentals remained challenging during the quarter, with the BSI averaging just over $10,000 for the period.

Freight rates bottomed as we moved through the quarter, with September benefiting from a strong rally as the index reached almost $15,000. The Atlantic market was the main driver for this recovery in rates, catalyzed by robust exports of soybeans and corn out of Brazil following this season’s record crop. Looking ahead to the fourth quarter, spot rates have come off from their recent highs, but remain supported with the BSI averaging approximately $13,700 quarter-to-date. Further, as of today, we have fixed approximately 68% of our owned available days, at a net TCE of $15,655.

During the quarter, we continued to focus on operational efficiencies and improvements. Our OPEX costs were down sequentially for the third quarter in a row and Eagle’s entire fleet is now leveraging SoFar Ocean’s advanced voyage optimization system achieving meaningful fuel and emissions reductions.

We remain positive about the medium-term prospects for the drybulk industry, particularly given strong supply side fundamentals, macroeconomic risks notwithstanding. With a fully modern fleet of 52, predominately scrubber-fitted vessels, and approximately $170 million in total liquidity, Eagle is well-positioned to continue to take advantage of opportunities for the benefit of our stakeholders.”

Fleet Operating Data 

  Three Months Ended Nine Months Ended
  September 30,
2023
 September 30,
2022
 September 30,
2023
 September 30,
2022
Ownership Days 4,808 4,831 14,425 14,424
Owned Available Days 4,708 4,588 13,791 13,599


Fleet Development

  • Sankaty Eagle, a 2011-built Supramax (58k DWT)
    • Sold in second quarter of 2023 for $16.4 million and delivered to new owners in third quarter of 2023
  • Owned fleet totals 52 vessels (96% scrubber-fitted) with an average age of 10.0 years

Results of Operations for the three and nine months ended September 30, 2023 and 2022

For the three months ended September 30, 2023, the Company reported a net loss of $5.2 million, or basic and diluted net loss per share of $0.55. In the comparable quarter of 2022, the Company reported net income of $77.2 million, or basic and diluted net income per share of $5.94 and $4.77, respectively.

For the three months ended September 30, 2023, the Company reported an adjusted net loss of $2.9 million, which excludes net unrealized losses on FFAs and bunker swaps of $2.2 million, or basic and diluted adjusted net loss per share of $0.31. In the comparable quarter of 2022, the Company reported adjusted net income of $74.3 million, which excludes net unrealized gains on FFAs and bunker swaps of $7.1 million and a loss on debt extinguishment of $4.2 million, or basic and diluted adjusted net income per share of $5.72 and $4.58, respectively.

For the nine months ended September 30, 2023, the Company reported net income of $16.1 million, or basic and diluted net income per share of $1.38 and $1.36, respectively. For the nine months ended September 30, 2022, the Company reported net income of $224.7 million, or basic and diluted net income per share of $17.31 and $13.86, respectively.

For the nine months ended September 30, 2023, the Company reported adjusted net income of $17.2 million, which excludes net unrealized losses on FFAs and bunker swaps of $0.4 million and impairment of operating lease right-of-use assets of $0.7 million, or basic and diluted adjusted net income per share of $1.47 and $1.44, respectively. For the nine months ended September 30, 2022, the Company reported adjusted net income of $220.4 million, which excludes net unrealized gains on FFAs and bunker swaps of $8.5 million and a loss on debt extinguishment of $4.2 million, or basic and diluted adjusted net income per share of $16.97 and $13.59, respectively.

Revenues, net 

Revenues, net for the three months ended September 30, 2023 were $82.6 million compared to $185.3 million for the comparable quarter of 2022. Revenues, net decreased $102.7 million primarily due to lower rates on both time and voyage charters, driven by a decline in the drybulk market.

Revenues, net for the nine months ended September 30, 2023 were $289.2 million compared to $568.4 million for the nine months ended September 30, 2022. Revenues, net decreased $279.2 million primarily due to lower rates on both time and voyage charters, driven by a decline in the drybulk market.

Voyage expenses

Voyage expenses for the three months ended September 30, 2023 were $23.8 million compared to $40.8 million for the comparable quarter of 2022. Voyage expenses decreased $17.0 million primarily due to a $15.0 million reduction in bunker consumption expenses primarily due to decreases in voyage charters and bunker prices and a $1.2 million decrease in broker commissions due to lower freight rates driven by a decline in the drybulk market.

Voyage expenses for the nine months ended September 30, 2023 were $82.7 million compared to $120.7 million for the nine months ended September 30, 2022. Voyage expenses decreased $38.0 million primarily due to a $25.4 million reduction in bunker consumption expenses due to decreases in voyage charters and bunker prices, a $9.1 million reduction in port expenses due to a decrease in voyage charters and a $3.5 million decrease in broker commissions due to lower freight rates driven by a decline in the drybulk market.

Vessel operating expenses

Vessel operating expenses for the three months ended September 30, 2023 were $28.8 million compared to $33.1 million for the comparable quarter of 2022. Vessel operating expenses decreased $4.3 million primarily due to a $2.6 million decrease in repair costs, a $0.8 million decrease in lube costs driven by lower purchase volume and a $0.5 million decrease in the cost of stores and spares driven by lower purchases.

Vessel operating expenses for the nine months ended September 30, 2023 were $91.1 million compared to $88.2 million for the nine months ended September 30, 2022. Vessel operating expenses increased $2.9 million primarily due to a $3.2 million increase in crewing costs driven by higher compensation and increased crew changes as a result of crewing manager transitions and a $1.4 million increase in costs driven by certain repairs and discretionary spending on upgrades to six vessels, including newly acquired ships, partially offset by a $1.3 million decrease in lube costs driven by lower purchase volume and a $0.4 million decrease in the cost of stores and spares driven by lower purchases.

Adjusted vessel operating expenses(2), which excludes one-time, non-recurring expenses related to vessel acquisitions, charges relating to a change in the crewing manager on some of the Company’s vessels and discretionary hull and hold upgrades for the three months ended September 30, 2023 were $28.5 million compared to $31.7 million for the comparable quarter in 2022. Adjusted vessel operating expenses decreased $3.2 million primarily due to a $1.5 million decrease in repair costs, a $0.8 million decrease in lube costs driven by lower purchase volume and a $0.5 million decrease in the cost of stores and spares driven by lower purchases. Average daily adjusted vessel operating expenses(1) (“Adjusted DVOE”) for the three months ended September 30, 2023 were $5,922 compared to $6,566 for the comparable quarter in 2022.

Adjusted vessel operating expenses(2), which excludes one-time, non-recurring expenses related to vessel acquisitions, charges relating to a change in the crewing manager on some of the Company’s vessels and discretionary hull and hold upgrades for the nine months ended September 30, 2023 were $87.5 million compared to $86.4 million for the nine months ended September 30, 2022. Adjusted vessel operating expenses increased $1.1 million primarily due to a $2.6 million increase in crewing costs driven by higher compensation, a $1.3 million increase in repair costs, partially offset by a $1.6 million decrease in lube costs driven by lower purchase volume and a $0.4 million decrease in the cost of stores and spares driven by lower purchases. Adjusted DVOE for the nine months ended September 30, 2023 were $6,068 compared to $5,991 for the nine months ended September 30, 2022.

2 This is a non-GAAP financial measure. A reconciliation of GAAP to non-GAAP financial measures has been provided in the financial tables included in this press release. An explanation of this measure and how it is calculated is also included below under the heading “Supplemental Information – Non-GAAP Financial Measures.”

Charter hire expenses

Charter hire expenses for the three months ended September 30, 2023 were $6.9 million compared to $19.8 million for the comparable quarter of 2022. Charter hire expenses decreased $12.9 million primarily due to decreases in both charter hire rates as a result of a decline in the drybulk market and chartered-in days.

Charter hire expenses for the nine months ended September 30, 2023 were $31.0 million compared to $63.8 million for the nine months ended September 30, 2022. Charter hire expenses decreased $32.8 million primarily due to decreases in both charter hire rates as a result of a decline in the drybulk market and chartered-in days.

Chartered-in days, which is the aggregate number of days in a period during which the Company chartered-in vessels, for the three months ended September 30, 2023 and 2022 were 589 and 1,000, respectively. Chartered-in days for the nine months ended September 30, 2023 and 2022 were 2,315 and 3,102, respectively.

Depreciation and amortization

Depreciation and amortization for the three months ended September 30, 2023 was $15.5 million compared to $15.4 million for the comparable quarter of 2022. Depreciation and amortization increased $0.1 million primarily due to a $0.8 million increase in depreciation from the net impact of vessels acquired and sold during the respective periods and a $0.1 million increase in deferred drydocking cost amortization due to higher drydocking expenditures, partially offset by $0.9 million decrease in depreciation due to a change in our estimated vessel scrap value from $300 per lwt to $400 per lwt, effective January 1, 2023.

Depreciation and amortization for the nine months ended September 30, 2023 was $45.0 million compared to $45.2 million for the nine months ended September 30, 2022. Depreciation and amortization decreased $0.2 million primarily due to a $2.9 million decrease in depreciation due to a change in our estimated vessel scrap value from $300 per lwt to $400 per lwt, effective January 1, 2023, partially offset by a $1.6 million increase in depreciation from the net impact of vessels acquired and sold during the respective periods, a $0.7 million increase in deferred drydocking cost amortization due to higher drydocking expenditures and a $0.3 million increase in depreciation from an increase in installed vessel improvements.

General and administrative expenses 

General and administrative expenses for the three months ended September 30, 2023 were $10.7 million compared to $9.7 million for the comparable quarter of 2022. Excluding stock-based compensation expense of $1.7 million and $1.4 million for the three months ended September 30, 2023 and 2022, respectively, general and administrative expenses for the three months ended September 30, 2023 were $9.0 million compared to $8.2 million for the comparable quarter of 2022. General and administrative expenses increased $1.0 million primarily due to a $0.6 million increase in professional fees and a $0.2 million increase in stock-based compensation expense.

General and administrative expenses for the nine months ended September 30, 2023 were $32.9 million compared to $29.6 million for the nine months ended September 30, 2022. Excluding stock-based compensation expense of $5.7 million and $4.5 million for the nine months ended September 30, 2023 and 2022, respectively, general and administrative expenses for the nine months ended September 30, 2023 were $27.2 million compared to $25.1 million for the nine months ended September 30, 2022. General and administrative expenses increased $3.3 million primarily due to a $1.1 million increase in stock-based compensation expense, a $1.1 million increase in employee-related costs and other small increases across professional fees, corporate travel and office expenses.

Other operating expense

Other operating expense for the three months ended September 30, 2023 and 2022 was $0.7 million and $2.5 million, respectively. Other operating expense for the three months ended September 30, 2023 was primarily comprised of costs related to a 2021 U.S. government investigation into an allegation that one of our vessels may have improperly disposed of ballast water that entered the engine room bilges during a repair. Other operating expense for the three months ended September 30, 2022 was primarily comprised of costs associated with a corporate transaction that did not materialize.

Other operating expense for each of the nine months ended September 30, 2023 and 2022 was $0.9 million and $2.6 million, respectively. Other operating expense for the nine months ended September 30, 2023 was primarily comprised of costs related to a 2021 U.S. government investigation into an allegation that one of our vessels may have improperly disposed of ballast water that entered the engine room bilges during a repair. Other operating expense for the nine months ended September 30, 2022 was primarily comprised of costs associated with a corporate transaction that did not materialize.

Gain on sale of vessels

For the three months ended September 30, 2023, the Company recorded a gain on the sale of the vessel Sankaty Eagle of $4.9 million. For the three months ended September 30, 2022, the Company recorded a gain on the sale of the vessel Cardinal of $9.3 million.

For the nine months ended September 30, 2023, the Company recorded a gain on the sale of the vessels Jaeger, Montauk Eagle, Newport Eagle and Sankaty Eagle of $19.7 million. For the nine months ended September 30, 2022, the Company recorded a gain on the sale of the vessel Cardinal of $9.3 million.

Interest expense

Interest expense for the three months ended September 30, 2023 and 2022 was $7.7 million and $4.2 million, respectively. Interest expense increased $3.5 million due to the impact of increased amounts outstanding under the Global Ultraco Debt Facility and higher interest rates.

Interest expense for the nine months ended September 30, 2023 and 2022 was $16.0 million and $13.0 million, respectively. Interest expense increased $3.0 million primarily due to the impact of increased amounts outstanding under the Global Ultraco Debt Facility and higher interest rates.

Interest income

Interest income for the three months ended September 30, 2023 and 2022 was $1.5 million and $0.9 million, respectively. Interest income increased primarily due to higher interest rates on the Company’s cash balances.

Interest income for the nine months ended September 30, 2023 and 2022 was $5.1 million and $1.1 million, respectively. Interest income increased primarily due to higher interest rates on the Company’s cash balances.

Realized and unrealized loss/(gain) on derivative instruments, net

Realized and unrealized loss/(gain) on derivative instruments, net for the three months ended September 30, 2023 was a loss of $0.1 million compared to a gain of $11.3 million for the comparable quarter of 2022. The $11.4 million decrease was due to market movements as well as lower FFA and bunker swap activity.

Realized and unrealized loss/(gain) on derivative instruments, net for the nine months ended September 30, 2023 was a gain of $2.3 million compared to a gain of $13.3 million for the nine months ended September 30, 2022. The $11.0 million decrease was due to market movements as well as lower FFA and bunker swap activity.

A summary of outstanding FFAs as of September 30, 2023 is as follows:

FFA Period Average FFA
Contract Price
 Number of
Days Hedged
Quarter ending December 31, 2023 – Buy Positions $14,196   (345)
Quarter ending December 31, 2023 – Sell Positions $12,922   1,380 

Liquidity and Capital Resources

  Nine Months Ended
($ in thousands) September 30,
2023
 September 30,
2022
Net cash provided by operating activities $35,965  $242,491 
Net cash (used in)/provided by investing activities  (27,831)  4,090 
Net cash used in financing activities  (81,434)  (135,198)
Net (decrease)/increase in cash, cash equivalents and restricted cash  (73,300)  111,383 
Cash, cash equivalents and restricted cash at beginning of period  189,754   86,222 
Cash, cash equivalents and restricted cash at end of period $116,454  $197,605 
         

Net cash provided by operating activities for the nine months ended September 30, 2023 was $36.0 million, compared to $242.5 million for the nine months ended September 30, 2022. The decrease is primarily due to a decrease in net income driven by lower freight rates.

Net cash used in investing activities for the nine months ended September 30, 2023 was $27.8 million, compared to net cash provided by investing activities of $4.1 million for the nine months ended September 30, 2022. During the nine months ended September 30, 2023, the Company paid (i) $81.8 million to purchase three vessels and other vessel improvements, (ii) $2.1 million to purchase BWTS and (iii) $0.7 million to purchase other fixed assets. These uses of cash were partially offset by $56.6 million in net proceeds from the sale of four vessels. During the nine months ended September 30, 2022, the Company received net proceeds of $14.9 million from the sale of one vessel and paid (i) $5.7 million to purchase BWTS, (ii) $4.1 million as an advance for the purchase of a vessel, (iii) $0.8 million to purchase vessel improvements and (iv) $0.3 million to purchase other fixed assets.

Net cash used in financing activities for the nine months ended September 30, 2023 was $81.4 million, compared to $135.2 million for the nine months ended September 30, 2022. During the nine months ended September 30, 2023, the Company (i) paid $222.7 million to repurchase Common Stock, inclusive of fees, (ii) repaid $37.4 million of term loan under the Global Ultraco Debt Facility, (iii) paid $15.8 million in dividends and (iv) paid $2.0 million for taxes related to net share settlement of equity awards. These uses of cash were partially offset by (i) $123.4 million of proceeds, net of debt issuance costs, from the Revolving Facility under the Global Ultraco Debt Facility and (ii) $73.1 million of proceeds, net of debt issuance costs, from the Term Facility under the Global Ultraco Debt Facility. During the nine months ended September 30, 2022, the Company (i) paid $81.6 million in dividends, (ii) repaid $37.4 million of term loan under the Global Ultraco Debt Facility, (iii) paid $14.2 million to repurchase $10.0 million in aggregate principal amount of Convertible Bond Debt, and (iv) paid $2.4 million for taxes related to net share settlement of equity awards.

As of September 30, 2023, cash and cash equivalents including noncurrent restricted cash was $116.5 million compared to $189.8 million as of December 31, 2022.

A summary of the Company’s debt as of September 30, 2023 and December 31, 2022 is as follows:

  September 30, 2023 December 31, 2022
($ in thousands) Principal
Amount
Outstanding
 Debt
Discounts and
Debt Issuance
Costs
 Carrying
Value
 Principal
Amount
Outstanding
 Debt
Discounts and
Debt Issuance
Costs
 Carrying
Value
Convertible Bond Debt $104,119  $(328) $103,791  $104,119  $(620) $103,499 
Global Ultraco Debt Facility – Term Facility  275,400   (5,778)  269,622   237,750   (6,767)  230,983 
Global Ultraco Debt Facility – Revolving Facility  125,000   (2,941)  122,059          
Total debt  504,519   (9,047)  495,472   341,869   (7,387)  334,482 
Less: Current portion – Convertible Bond Debt  (104,119)  328   (103,791)         
Less: Current portion – Global Ultraco Debt Facility  (49,800)     (49,800)  (49,800)     (49,800)
Total long-term debt $350,600  $(8,719) $341,881  $292,069  $(7,387) $284,682 
(1)As of September 30, 2023 and December 31, 2022, the undrawn revolving facility under the Global Ultraco Debt Facility was $55 million and $100 million, respectively.

As of September 30, 2023, the effective conversion price of the Convertible Bond Debt equals $31.70 per share of Common Stock. If the market value of the Company’s Common Stock remains above this price, we would expect the holders of the Convertible Bond Debt to elect conversion prior to maturity. Upon conversion of the remaining Convertible Bond Debt, the Company will pay or deliver, as the case may be, either cash, shares of Common Stock or a combination of cash and shares of Common Stock, at the Company’s election, to the holder (subject to shareholder approval requirements in accordance with the indenture that governs the Convertible Bond Debt).

The Company continuously evaluates potential transactions that it expects to be accretive to earnings, enhance shareholder value or are in the best interests of the Company, including without limitation, business combinations, the acquisition of vessels or related businesses, repayment or refinancing of existing debt, the issuance of new securities, share and debt repurchases or other transactions.

Capital Expenditures and Drydocking 

Our capital expenditures primarily relate to the purchase of vessels as well as regularly scheduled drydocking and other vessel improvements, which are expected to enhance their revenue earning capabilities, efficiency and/or safety and to comply with international shipping standards and environmental laws and regulations. Certain vessel improvement costs and costs incurred in connection with drydocking are necessary to comply with international shipping standards and environmental laws and regulations, while others are discretionary in nature and evaluated on a business case-by-case basis.

During the fourth quarter of 2022, the Company entered into a memorandum of agreement to acquire a high-specification 2015-built Ultramax bulkcarrier for total consideration of $24.3 million. The vessel was delivered to the Company during the first quarter of 2023.

On January 30, 2023, the Company entered into a memorandum of agreement to acquire a high-specification 2020-built scrubber-fitted Ultramax bulkcarrier for total consideration of $30.1 million. The vessel was delivered to the Company during the second quarter of 2023.

On February 28, 2023, the Company entered into a memorandum of agreement to acquire a high-specification 2020-built scrubber-fitted Ultramax bulkcarrier for total consideration of $30.1 million. The vessel was delivered to the Company during the second quarter of 2023.

Although the Company has some flexibility regarding the timing of vessel drydockings, the timing of costs are relatively predictable. In accordance with statutory requirements, we expect vessels less than 15 years old to be drydocked every 60 months and vessels older than 15 years to be drydocked every 30 months. We intend to fund drydocking costs with cash from operations, cash on hand or with amounts available under the Global Ultraco Debt Facility. In addition, drydocking typically requires us to reposition vessels from a discharge port to shipyard facilities, which will reduce our owned available days and revenues during that period.

Drydocking costs incurred are deferred and amortized through depreciation and amortization on the condensed consolidated statements of operations on a straight-line basis over the period through the date the next drydocking is required to become due. During the nine months ended September 30, 2023, five of our vessels completed drydock and we incurred $10.6 million for drydocking costs. During the nine months ended September 30, 2022, eight of our vessels completed drydock and we incurred $18.5 million for drydocking costs.

Vessel improvements generally include systems and equipment intended to enhance a vessel’s efficiency and revenue earning capability. We intend to fund these costs through cash from operations, cash on hand or amounts available under the Global Ultraco Debt Facility.

The following table provides certain information about the estimated costs for anticipated vessel drydockings and improvements in the next four quarters, along with the anticipated off-hire days:

  Projected Costs (1) ($ in millions)
Quarters Ending Off-hire Days(2) Drydocks Vessel
Improvements
(3)
December 31, 2023 224 $4.1 $1.8
March 31, 2024 232 $4.7 $0.8
June 30, 2024 143 $2.0 $0.4
September 30, 2024 165 $2.4 $
(1)We intend to fund these costs with cash from operations, cash on hand or with amounts available under the Global Ultraco Debt Facility.
(2)Actual duration of off-hire days will vary based on the age and condition of the vessel, yard schedules and other factors. Projected off-hire days includes an allowance for unforeseen events.
(3)Projected costs for vessel improvements are primarily comprised of costs for ballast water treatment systems (“BWTS”).


SUMMARY CONSOLIDATED FINANCIAL AND OTHER DATA

The following table summarizes the Company’s selected condensed consolidated financial statements and other data for the periods indicated below.

 
 CONDENSED CONSOLIDATED STATEMENTS OF OPERATIONS (Unaudited)
(in thousands, except share and per share data)
 
  Three Months Ended Nine Months Ended
  September 30,
2023
 September 30,
2022
 September 30,
2023
 September 30,
2022
Revenues, net $82,606  $185,313  $289,210  $568,406 
         
Voyage expenses  23,791   40,792   82,737   120,710 
Vessel operating expenses  28,822   33,091   91,077   88,213 
Charter hire expenses  6,868   19,772   31,014   63,768 
Depreciation and amortization  15,472   15,407   45,035   45,241 
General and administrative expenses  10,652   9,666   32,871   29,611 
Impairment of operating lease right-of-use assets        722    
Other operating expense  677   2,469   860   2,643 
Gain on sale of vessels  (4,855)  (9,336)  (19,731)  (9,336)
Total operating expenses, net  81,427   111,861   264,585   340,850 
         
Operating income  1,179   73,452   24,625   227,556 
         
Interest expense  7,714   4,236   16,005   13,021 
Interest income  (1,488)  (881)  (5,139)  (1,100)
Realized and unrealized loss/(gain) on derivative instruments, net  104   (11,293)  (2,318)  (13,281)
Loss on debt extinguishment     4,173      4,173 
Total other expense/(income), net  6,330   (3,765)  8,548   2,813 
Net (loss)/income $(5,151) $77,217  $16,077  $224,743 
         
Weighted average shares outstanding:        
Basic  9,313,051   12,993,450   11,686,433   12,985,329 
Diluted  9,313,051   16,201,852   15,057,652   16,219,264 
         
Per share amounts:        
Basic net (loss)/income $(0.55) $5.94  $1.38  $17.31 
Diluted net (loss)/income $(0.55) $4.77  $1.36  $13.86 
 
CONDENSED CONSOLIDATED BALANCE SHEETS (Unaudited)
(in thousands, except share data and par values)
 
  September 30,
2023
 December 31,
2022
ASSETS:    
Current assets:    
Cash and cash equivalents $113,879  $187,155 
Accounts receivable, net of a reserve of $2,933 and $3,169, respectively  24,594   32,311 
Prepaid expenses  5,832   4,531 
Inventories  26,881   28,081 
Collateral on derivatives  4,380   909 
Fair value of derivative assets – current  8,653   8,479 
Other current assets  652   558 
Total current assets  184,871   262,024 
Noncurrent assets:    
Vessels and vessel improvements, at cost, net of accumulated depreciation of $289,819 and $261,725, respectively  914,108   891,877 
Advances for vessel purchases     3,638 
Advances for BWTS and other assets  1,984   2,722 
Deferred drydock costs, net  37,756   42,849 
Other fixed assets, net of accumulated depreciation of $1,324 and $1,623, respectively  952   310 
Operating lease right-of-use assets  10,892   23,006 
Restricted cash – noncurrent  2,575   2,599 
Fair value of derivative assets – noncurrent  5,435   8,184 
Total noncurrent assets  973,702   975,185 
Total assets $1,158,573  $1,237,209 
LIABILITIES & STOCKHOLDERS’ EQUITY:    
Current liabilities:    
Accounts payable $20,938  $20,129 
Accrued interest  2,092   3,061 
Other accrued liabilities  19,198   24,097 
Fair value of derivative liabilities – current  585   163 
Current portion of operating lease liabilities  10,109   22,045 
Unearned charter hire revenue  8,201   9,670 
Current portion of long-term debt – Global Ultraco Debt Facility  49,800   49,800 
Current portion of long-term debt – Convertible Bond Debt, net of debt discount and debt issuance costs  103,791    
Total current liabilities  214,714   128,965 
Noncurrent liabilities:    
Long-term debt – Global Ultraco Debt Facility, net of debt discount and debt issuance costs  341,881   181,183 
Convertible Bond Debt, net of debt discount and debt issuance costs     103,499 
Fair value of derivative liabilities – noncurrent  444    
Noncurrent portion of operating lease liabilities  2,766   3,173 
Other noncurrent accrued liabilities  696   1,208 
Total noncurrent liabilities  345,787   289,063 
Total liabilities  560,501   418,028 
     
Commitments and contingencies    
     
Stockholders’ equity:    
Preferred stock, $0.01 par value, 25,000,000 shares authorized, none issued as of September 30, 2023 and December 31, 2022      
Common stock, $0.01 par value, 700,000,000 shares authorized, 9,319,177 and 13,003,702 shares issued and outstanding as of September 30, 2023 and December 31, 2022, respectively  93   130 
Additional paid-in capital  746,898   966,058 
Accumulated deficit  (162,418)  (163,556)
Accumulated other comprehensive income  13,499   16,549 
Total stockholders’ equity  598,072   819,181 
Total liabilities and stockholders’ equity $1,158,573  $1,237,209 
 
CONDENSED CONSOLIDATED STATEMENTS OF CASH FLOWS (Unaudited)
(in thousands)
 
  Nine Months Ended
  September 30,
2023
 September 30,
2022
Cash flows from operating activities:    
Net income $16,077  $224,743 
Adjustments to reconcile net income to net cash provided by operating activities:    
Depreciation  34,577   35,513 
Noncash operating lease expense  17,890   21,083 
Amortization of deferred drydocking costs  10,458   9,728 
Amortization of debt discount and debt issuance costs  1,958   1,627 
Loss on debt extinguishment     4,173 
Impairment of operating lease right-of-use assets  722    
Gain on sale of vessels  (19,731)  (9,336)
Unrealized loss/(gain) on derivative instruments, net  437   (8,517)
Stock-based compensation expense  5,680   4,542 
Drydocking expenditures  (10,562)  (18,527)
Changes in operating assets and liabilities:    
Accounts payable  1,381   650 
Accounts receivable  7,707   (5,098)
Accrued interest  (969)  (1,241)
Inventories  1,199   (8,622)
Operating lease liabilities current and noncurrent  (19,570)  (21,076)
Collateral on derivatives  (3,471)  13,881 
Fair value of derivatives, other current and noncurrent assets  (141)  (183)
Other accrued liabilities  (4,907)  (2,332)
Prepaid expenses  (1,301)  (1,223)
Unearned charter hire revenue  (1,469)  2,706 
Net cash provided by operating activities  35,965   242,491 
     
Cash flows from investing activities:    
Purchase of vessels and vessel improvements  (81,802)  (781)
Advances for vessel purchases     (4,125)
Purchase of BWTS  (2,142)  (5,695)
Proceeds from hull and machinery insurance claims  174    
Net proceeds from sale of vessels  56,609   14,944 
Purchase of other fixed assets  (670)  (253)
Net cash (used in)/provided by investing activities  (27,831)  4,090 
     
Cash flows from financing activities:    
Proceeds from Revolving Facility, net of debt issuance costs – Global Ultraco Debt Facility  123,361    
Proceeds from Term Facility, net of debt issuance costs – Global Ultraco Debt Facility  73,125    
Repayment of Term Facility – Global Ultraco Debt Facility  (37,350)  (37,350)
Repurchase of Common Stock and associated fees – related party  (222,688)   
Repurchase of Convertible Bond Debt     (14,188)
Dividends paid  (15,790)  (81,577)
Debt issuance costs paid to lenders – Original Global Ultraco Debt Facility     (18)
Cash paid for taxes related to net share settlement of equity awards  (1,989)  (2,351)
Other financing costs paid  (103)   
Cash received from exercise of stock options     85 
Proceeds from equity offerings, net of issuance costs     201 
Net cash used in financing activities  (81,434)  (135,198)
Net (decrease)/increase in cash, cash equivalents and restricted cash  (73,300)  111,383 
Cash, cash equivalents and restricted cash at beginning of period  189,754   86,222 
Cash, cash equivalents and restricted cash at end of period $116,454  $197,605 
     
Cash paid for interest $22,064  $12,861 
         

Supplemental Information – Non-GAAP Financial Measures

This release includes various financial measures that are non-GAAP financial measures as defined under the rules of the Securities and Exchange Commission (“SEC”). We believe these measures provide important supplemental information to investors to use in evaluating ongoing operating results. We use these measures, together with accounting principles generally accepted in the United States (“GAAP” or “U.S. GAAP”) measures, for internal managerial purposes and as a means to evaluate period-to-period comparisons. However, we do not, and you should not, rely on non-GAAP financial measures alone as measures of our performance. We believe that non-GAAP financial measures reflect an additional way of viewing aspects of our operations, that when taken together with GAAP results and the reconciliations to corresponding GAAP financial measures that we also provide and provide a more complete understanding of factors and trends affecting our business. We strongly encourage you to review all of our financial statements and publicly-filed reports in their entirety and to not solely rely on any single non-GAAP financial measure.

Because non-GAAP financial measures are not standardized, it may not be possible to compare these financial measures with other companies’ non-GAAP financial measures, even if they have similar names.

Non-GAAP Financial Measures

Adjusted net (loss)/income and Basic and Diluted adjusted net (loss)/income per share

Adjusted net (loss)/income and Basic and Diluted adjusted net (loss)/income per share represent Net (loss)/income and Basic and Diluted net (loss)/income per share, respectively, as adjusted to exclude unrealized gains and losses on FFAs and bunker swaps, gains and losses on debt extinguishment, and impairment of operating lease right-of-use assets. The Company utilizes derivative instruments such as FFAs and bunker swaps to partially hedge against its underlying long physical position in ships (as represented by owned and third-party chartered-in vessels). As the Company does not apply hedge accounting to these derivative instruments, unrealized mark-to-market gains and losses on forward hedge positions impact current quarter results, causing timing mismatches in the Condensed Consolidated Statements of Operations. Additionally, we believe that gains and losses on debt extinguishment and impairment of operating lease right-of-use assets are not representative of our normal business operations. We believe that Adjusted net (loss)/income and Adjusted net (loss)/income per share are more useful to analysts and investors in comparing the results of operations and operational trends between periods and relative to other peer companies in our industry. Our Adjusted net (loss)/income should not be considered an alternative to net income/(loss), operating income/(loss), cash flows provided by/(used in) operating activities or any other measure of financial performance or liquidity presented in accordance with U.S. GAAP. As noted above, our Adjusted net (loss)/income and Adjusted net (loss)/income per share may not be comparable to similarly titled measures of another company because all companies may not calculate Adjusted net (loss)/income or Adjusted net (loss)/income per share in the same manner.

The following table presents the reconciliation of our Net (loss)/income to Adjusted net (loss)/income:

 
Reconciliation of GAAP Net (loss)/income to Adjusted net (loss)/income
(in thousands, except share and per share data)
 
  Three Months Ended Nine Months Ended
  September 30,
2023
 September 30,
2022
 September 30,
2023
 September 30,
2022
Net (loss)/income $(5,151) $77,217  $16,077 $224,743 
Adjustments to reconcile net (loss)/income to adjusted net (loss)/income:        
Unrealized loss/(gain) on FFAs and bunker swaps, net  2,222   (7,124)  437  (8,517)
Impairment of operating lease right-of-use assets        722   
Loss on debt extinguishment     4,173     4,173 
Adjusted net (loss)/income $(2,929) $74,266  $17,236 $220,399 
         
Weighted average shares outstanding:        
Basic  9,313,051   12,993,450   11,686,433  12,985,329 
Diluted (1)  9,313,051   16,201,852   15,057,652  16,219,264 
         
Per share amounts:        
Basic adjusted net (loss)/income $(0.31) $5.72  $1.47 $16.97 
Diluted adjusted net (loss)/income $(0.31) $4.58  $1.44 $13.59 
(1)Diluted weighted average shares outstanding for the three and nine months ended September 30, 2023 and 2022 includes dilutive potential common shares related to the Convertible Bond Debt based on the if-converted method and potential common shares related to stock awards and options based on the treasury stock method, unless to do so would have been anti-dilutive to Diluted adjusted net (loss)/income per share.


EBITDA and Adjusted EBITDA

We define EBITDA as Net (loss)/income under GAAP adjusted for interest, income taxes and depreciation and amortization.

Adjusted EBITDA is a non-GAAP financial measure that is used as a supplemental financial measure by our management and by external users of our financial statements, such as investors, commercial banks and others, to assess our operating performance as compared to that of other peer companies in our industry, without regard to financing methods, capital structure or historical costs basis. Our Adjusted EBITDA should not be considered an alternative to net income/(loss), operating income/(loss), cash flows provided by/(used in) operating activities or any other measure of financial performance or liquidity presented in accordance with U.S. GAAP. Our Adjusted EBITDA may not be comparable to similarly titled measures of another company because all companies may not calculate Adjusted EBITDA in the same manner. Adjusted EBITDA represents EBITDA adjusted to exclude certain non-cash, one-time and other items that the Company believes are not indicative of the ongoing performance of its core operations such as vessel impairment, gains and losses on sale of vessels, impairment of operating lease right-of-use assets, unrealized gains and losses on FFAs and bunker swaps, gains and losses on debt extinguishment and stock-based compensation expense.

The following table presents a reconciliation of our Net (loss)/income to EBITDA and Adjusted EBITDA:

 
Reconciliation of GAAP Net (loss)/income to EBITDA and Adjusted EBITDA
(in thousands)
 
  Three Months Ended Nine Months Ended
  September 30,
2023
 September 30,
2022
 September 30,
2023
 September 30,
2022
Net (loss)/income $(5,151) $77,217  $16,077  $224,743 
Adjustments to reconcile net (loss)/income to EBITDA:        
Interest expense  7,714   4,236   16,005   13,021 
Interest income  (1,488)  (881)  (5,139)  (1,100)
Income taxes            
EBIT  1,075   80,572   26,943   236,664 
Depreciation and amortization  15,472   15,407   45,035   45,241 
EBITDA  16,547   95,979   71,978   281,905 
Non-cash, one-time and other adjustments to EBITDA(1)  (963)  (10,838)  (12,892)  (9,138)
Adjusted EBITDA $15,584  $85,141  $59,086  $272,767 
(1)One-time and other adjustments to EBITDA for the three and nine months ended September 30, 2023 and 2022 includes gains on sale of vessels, net unrealized losses/(gains) on FFAs and bunker swaps, impairment of operating lease right-of-use assets, loss on debt extinguishment and stock-based compensation expense.


TCE revenue and TCE

Time charter equivalent revenue (“TCE revenue”) and time charter equivalent (“TCE”) are non-GAAP financial measures that are commonly used in the shipping industry primarily to compare daily earnings generated by vessels on time charters with daily earnings generated by vessels on voyage charters, because charter hire rates for vessels on voyage charters are generally not expressed in per-day amounts while charter hire rates for vessels on time charters generally are expressed in such amounts. The Company defines TCE revenue as revenues, net less voyage expenses and charter hire expenses, adjusted for realized gains and losses on FFAs and bunker swaps and defines TCE as TCE revenue divided by the number of owned available days. Owned available days is the number of our ownership days less the aggregate number of days that our vessels are off-hire due to vessel familiarization upon acquisition, repairs, vessel upgrades or special surveys. The shipping industry uses available days to measure the number of days in a period during which vessels should be capable of generating revenues. TCE provides additional meaningful information in conjunction with Revenues, net, the most directly comparable GAAP measure, because it assists Company management in making decisions regarding the deployment and use of its vessels and in evaluating their performance. Our TCE revenue and TCE should not be considered alternatives to net income/(loss), operating income/(loss), cash flows provided by/(used in) operating activities or any other measure of financial performance or liquidity presented in accordance with U.S. GAAP. Our TCE revenue and TCE may not be comparable to similarly titled measures of another company because all companies may not calculate TCE revenue and TCE in the same manner.

The following table presents the reconciliation of our Revenues, net to TCE:

 
Reconciliation of Revenues, net to TCE
(in thousands, except for Owned available days and TCE)
 
  Three Months Ended Nine Months Ended
  September 30,
2023
 September 30,
2022
 September 30,
2023
 September 30,
2022
Revenues, net $82,606  $185,313  $289,210  $568,406 
Less:        
Voyage expenses  (23,791)  (40,792)  (82,737)  (120,710)
Charter hire expenses  (6,868)  (19,772)  (31,014)  (63,768)
Realized gain on FFAs and bunker swaps, net  2,118   4,169   2,755   4,764 
TCE revenue $54,065  $128,918  $178,214  $388,692 
         
Owned available days  4,708   4,588   13,791   13,599 
TCE $11,482  $28,099  $12,922  $28,582 


Adjusted vessel operating expenses and Adjusted DVOE

Adjusted vessel operating expenses and Adjusted DVOE are non-GAAP financial measures that are used as supplemental financial measures by our management and by external users of our financial statements to assess our operating performance as compared to that of other peer companies in our industry. The Company defines Adjusted vessel operating expenses as vessel operating expenses presented in accordance with U.S. GAAP, adjusted to exclude one-time, non-recurring expenses related to vessel acquisitions, charges relating to a change in the crewing manager on some of our vessels and discretionary spending associated with hull and hold upgrades and defines Adjusted DVOE as Adjusted vessel operating expenses divided by the number of ownership days. Ownership days is the aggregate number of days in a period during which each vessel in our fleet has been owned by us. Adjusted vessel operating expenses and Adjusted DVOE provide additional meaningful information in conjunction with Vessel operating expenses, the most directly comparable GAAP measure. Our Adjusted vessel operating expenses and Adjusted DVOE should not be considered alternatives to net income/(loss), operating income/(loss), cash flows provided by/(used in) operating activities or any other measure of financial performance or liquidity presented in accordance with U.S. GAAP. Our Adjusted vessel operating expenses and Adjusted DVOE may not be comparable to similarly titled measures of another company because all companies may not calculate Adjusted vessel operating expenses and Adjusted DVOE in the same manner.

The following table presents the reconciliation of our Vessel operating expenses to Adjusted vessel operating expenses and Adjusted DVOE:

 
Reconciliation of GAAP Vessel operating expenses to Adjusted vessel operating expenses and Adjusted DVOE
(in thousands, except for Ownership days and Adjusted DVOE data)
 
  Three Months Ended Nine Months Ended
  September 30,
2023
 September 30,
2022
 September 30,
2023
 September 30,
2022
Vessel operating expenses $28,822  $33,091  $91,077  $88,213 
Less:        
Adjustments to vessel operating expenses(1):  (347)  (1,371)  (3,548)  (1,796)
Adjusted vessel operating expenses $28,475  $31,720  $87,529  $86,417 
         
Ownership days  4,808   4,831   14,425   14,424 
Adjusted DVOE $5,922  $6,566  $6,068  $5,991 
(1)Adjustments to vessel operating expenses includes one-time, non-recurring expenses related to vessel acquisitions, charges relating to a change in the crewing manager on some of our vessels and discretionary spending associated with hull and hold upgrades.


Glossary of Terms

Chartered-in days: We define chartered-in days as the aggregate number of days in a period during which we charter-in vessels under operating leases. The Company charters-in vessels on a long-term and short-term basis.

Owned available days: We define owned available days as the number of ownership days less the aggregate number of days that our owned vessels are off-hire due to vessel familiarization upon acquisition, repairs, vessel upgrades or special surveys and other reasons which prevent the vessel from performing under a charter party in a period. The shipping industry uses owned available days to measure the number of days in a period during which owned vessels should be capable of generating revenues.

Ownership days: We define ownership days as the aggregate number of days in a period during which each vessel in our fleet has been owned by us. Ownership days are an indicator of the size of our fleet over a period and affect both the amount of revenues and the amount of expenses that we record during a period.

Definitions of Capitalized Terms

Convertible Bond Debt: Convertible Bond Debt refers to 5.0% Convertible Senior Notes due 2024 issued by the Company on July 29, 2019 that will mature on August 1, 2024.

Global Ultraco Debt Facility: Global Ultraco Debt Facility refers to the senior secured credit facility entered into by Eagle Bulk Ultraco LLC (“Eagle Ultraco”), a wholly-owned subsidiary of the Company, along with certain of its vessel-owning subsidiaries as guarantors, with the lenders party thereto (the “Lenders”), Credit Agricole Corporate and Investment Bank (“Credit Agricole”) as security trustee, structurer, sustainability coordinator and facility agent. The Global Ultraco Debt Facility provides for an aggregate principal amount of $485.3 million, which consists of (i) a term loan facility in an aggregate principal amount of $300.3 million (the “Term Facility”) and (ii) a revolving credit facility in an aggregate principal amount of $185.0 million (the “Revolving Facility”). The Global Ultraco Debt Facility is secured by 52 of the Company’s vessels. As of September 30, 2023, $54.6 million remains undrawn under the Revolving Facility.

Conference Call Information 

As previously announced, members of Eagle’s senior management team will host a teleconference and webcast at 8:00 a.m. ET on Friday, November 3, 2023, to discuss the third quarter results.

A live webcast of the call will be available on the Investor Relations page of the Company’s website at ir.eagleships.com. To access the call by phone, please register at https://register.vevent.com/register/BIee839edd63884046b37812fb660d9ebb and you will be provided with dial-in details. A replay of the webcast will be available on the Investor Relations page of the Company’s website.

About Eagle Bulk Shipping Inc.

The Company is a U.S.-based, fully integrated shipowner-operator, providing global transportation solutions to a diverse group of customers including miners, producers, traders and end users. Headquartered in Stamford, Connecticut, with offices in Singapore and Copenhagen, Eagle focuses exclusively on the versatile midsize drybulk vessel segment and owns one of the largest fleets of Supramax/Ultramax vessels in the world. The Company performs all management services in-house (strategic, commercial, operational, technical, and administrative) and employs an active management approach to fleet trading with the objective of optimizing revenue performance and maximizing earnings on a risk-managed basis. For further information, please visit our website: www.eagleships.com.

Website Information

We intend to use our website, www.eagleships.com, as a means of disclosing material non-public information and for complying with our disclosure obligations under Regulation FD. Such disclosures will be included in our website’s Investor Relations section. Accordingly, investors should monitor the Investor Relations portion of our website, in addition to following our press releases, filings with the SEC, public conference calls, and webcasts. To subscribe to our e-mail alert service, please click the “Investor Alerts” link in the Investor Relations section of our website and submit your email address. The information contained in, or that may be accessed through, our website is not incorporated by reference into or a part of this document or any other report or document we file with or furnish to the SEC, and any references to our website are intended to be inactive textual references only.

Disclaimer: Forward-Looking Statements

Matters discussed in this release may constitute forward-looking statements that may be deemed to be “forward-looking statements” within the meaning of Section 27A of the Securities Act of 1933, as amended, Section 21E of the Securities Exchange Act of 1934, as amended, and the Private Securities Litigation Reform Act of 1995, and are intended to be covered by the safe harbor provided for under these sections. These statements may include words such as “believe,” “estimate,” “project,” “intend,” “expect,” “plan,” “anticipate,” and similar expressions in connection with any discussion of the timing or nature of future operating or financial performance or other events. Forward-looking statements in this release reflect management’s current expectations and observations with respect to future events and financial performance. Where we express an expectation or belief as to future events or results, including future plans with respect to financial performance, the payment of dividends and/or repurchase of shares, or future actions of holders of the Convertible Bond Debt, including whether or not to elect to convert any portion of the Convertible Bond Debt prior to its maturity date, such expectation or belief is expressed in good faith and believed to have a reasonable basis. However, our forward-looking statements are subject to risks, uncertainties, and other factors, which could cause actual results to differ materially from future results expressed, projected, or implied by those forward-looking statements.

Where we express an expectation or belief as to future events or results, such expectation or belief is expressed in good faith and believed to have a reasonable basis. However, our forward-looking statements are subject to risks, uncertainties, and other factors, which could cause actual results to differ materially from future results expressed, projected or implied by those forward-looking statements. The principal factors that affect our financial position, results of operations and cash flows include market freight rates, which fluctuate based on various economic and market conditions, periods of charter hire, vessel operating expenses and voyage costs, which are incurred primarily in U.S. dollars, depreciation expenses, which are a function of the purchase price of our vessels and our vessels’ estimated useful lives and scrap value, general and administrative expenses, and financing costs related to our indebtedness. The accuracy of the Company’s assumptions, expectations, beliefs and projections depends on events or conditions that change over time and are thus susceptible to change based on actual experience, new developments and known and unknown risks. The Company gives no assurance that the forward-looking statements will prove to be correct, does not undertake any duty to update them and disclaims any intent or obligation to update publicly any forward-looking statements, whether as a result of new information, future events or otherwise, except as may be required under applicable securities laws. Our actual results may differ materially from those anticipated in these forward-looking statements as a result of certain factors which could include the following: (i) volatility of freight rates driven by changes in demand for seaborne transportation of drybulk commodities and in supply of drybulk shipping capacity; (ii) changes in drybulk carrier capacity driven by levels of newbuilding orders, scrapping rates or fleet utilization; (iii) changes in rules and regulations applicable to the drybulk industry, including, without limitation, regulations of the International Maritime Organization and the European Union (the “EU”), requirements of the Environmental Protection Agency and other governmental and quasi-governmental agencies; (iv) changes in U.S., United Kingdom, United Nations and EU economic sanctions and trade embargo laws and regulations as well as equivalent economic sanctions laws of other relevant jurisdictions; (v) actions taken by regulatory authorities including, without limitation, the U.S. Treasury Department’s Office of Foreign Assets Control (“OFAC”); (vi) changes in the typical seasonal variations in drybulk freight rates; (vii) changes in national and international economic and political conditions including, without limitation, the current conflicts between Russia and Ukraine and Israel and Hamas, the current economic and political environment in China and the environment in historically high-risk geographic areas such as the South China Sea, the Indian Ocean, the Gulf of Guinea and the Gulf of Aden; (viii) changes in the condition of the Company’s vessels or applicable maintenance or regulatory standards (which may affect, among other things, our anticipated drydocking costs); (ix) the duration and impact of the novel coronavirus (“COVID-19”) pandemic and measures implemented by governments of various countries in response to the COVID-19 pandemic; (x) volatility of the cost of fuel; (xi) volatility of costs of labor and materials needed to operate our business due to inflation; (xii) any legal proceedings which we may be involved from time to time; and (xiii) other factors listed from time to time in our filings with the Securities and Exchange Commission (the “SEC”).

We have based these statements on assumptions and analyses formed by applying our experience and perception of historical trends, current conditions, expected future developments and other factors we believe are appropriate in the circumstances. The Company’s future results may be impacted by adverse economic conditions, such as inflation, deflation, or lack of liquidity in the capital markets, that may negatively affect it or parties with whom it does business. Should one or more of the foregoing risks or uncertainties materialize in a way that negatively impacts the Company, or should the Company’s underlying assumptions prove incorrect, the Company’s actual results may vary materially from those anticipated in its forward-looking statements, and its business, financial condition and results of operations could be materially and adversely affected. Risks and uncertainties are further described in our Annual Report on Form 10-K for the year ended December 31, 2022, as filed with the SEC on March 10, 2023, as updated by those risks described in Part II, Item 1A of our Quarterly Report on Form 10-Q for the three months ended June 30, 2023, filed with the SEC on August 4, 2023.

CONTACT

Company Contact:
Constantine Tsoutsoplides
Chief Financial Officer
Eagle Bulk Shipping Inc.
Tel. +1 203-276-8100
Email: investor@eagleships.com

Source: Eagle Bulk Shipping Inc.