Mark Reichman, Managing Director, Equity Research Analyst, Natural Resources, Noble Capital Markets, Inc.
Refer to the full report for the price target, fundamental analysis, and rating.
A Major Expansion and Upgrading of Mineral Resources. First Phosphate released the results of its updated Mineral Resource Estimate (MRE) for the Begin-Lamarche project in Saguenay-Lac-Saint Jean, Quebec, Canada. The updated MRE reflects the success of the company’s 2025 to 2026 drilling campaign, resulting in a 378% increase in indicated resources compared to the previous estimate completed two years ago. The significant upgrade is important because it advances a significant portion of the resource into the indicated and measured categories, which are required to move the project toward a feasibility study targeted for December 2026.
Longer Potential Mine Life. The ability to upgrade existing resources and classify newly discovered extensions directly into the indicated category demonstrates the strong continuity, consistency, and quality of the deposit. The increased tonnage is also expected to support a longer potential mine life, while the deposit remains open at depth, providing additional exploration upside and long-term growth potential.
Equity Research is available at no cost to Registered users of Channelchek. Not a Member? Click ‘Join’ to join the Channelchek Community. There is no cost to register, and we never collect credit card information.
This Research is provided by Noble Capital Markets, Inc., a FINRA and S.E.C. registered broker-dealer (B/D).
*Analyst certification and important disclosures included in the full report. NOTE: investment decisions should not be based upon the content of this research summary. Proper due diligence is required before making any investment decision.
Small caps are back in front. The Russell 2000 climbed 1.70% Tuesday, outpacing the Nasdaq’s 1.16% gain, the S&P 500’s 0.73% advance, and the Dow’s modest 0.17% move, as markets returned from the Memorial Day holiday weekend and immediately pushed toward record territory. The outperformance did not happen in a vacuum. It happened despite fresh escalations in both the Iran conflict and the war in Ukraine, two headlines that would have rattled markets badly just a few months ago.
The fact that investors are actively choosing to ignore those risks and rotate into the smallest, most domestically exposed names in the market says something worth paying attention to.
Going into Memorial Day, the narrative around small caps had been running dark. The Russell 2000 spent three consecutive weeks underperforming large cap indices as Treasury yields hit 19-year highs, traders priced in a near 50% probability of Fed rate hikes by year-end, and consumer sentiment fell to an all-time record low. Small caps carry disproportionately more variable-rate debt and have less balance sheet flexibility to absorb a prolonged higher-rate environment, which meant they bore the brunt of that anxiety more than any other segment of the market.
Tuesday’s session is the first indication that the selling pressure may have been overdone.
To understand why today matters, the short-term volatility needs to be placed inside the larger story building all year. The Russell 2000 entered 2026 trading at a 31% discount to the S&P 500 on a forward price-to-earnings basis, a valuation gap that had reached its widest level in over 25 years. In January, the index staged a historic 15-session winning streak against the S&P 500, the longest period of small cap dominance since May 1996, as institutional capital began rotating out of overextended large cap technology and into domestic-focused companies.
That rotation stalled in March and April as the Iran conflict sent oil surging, Treasury yields spiked, and rate cut expectations evaporated. But the fundamental case never went away. Russell 2000 companies generate approximately 80% of their revenue domestically, making them direct beneficiaries of the onshoring trend and fiscal provisions in the One Big Beautiful Bill Act. Consensus earnings growth estimates for the Russell 2000 sit at 44.9% year over year for Q1, the highest forward bar since mid-2025. The fundamentals have not deteriorated. The sentiment did.
Whether today represents the start of a sustained rotation or a post-holiday bounce will be answered in the sessions ahead. If the 30-year yield retreats from its 5.12% recent peak and rate hike probabilities fade, the conditions for a durable small cap rally fall into place. If yields hold and Fed Chair Kevin Warsh signals a hawkish June, today’s move fades just as quickly.
The underlying case remains intact. The Russell 2000 does not need perfection to move higher. It needs the rate picture to stop getting worse. Today, at least, that is exactly what the market decided to believe.
BATAVIA, N.Y.–(BUSINESS WIRE)– Graham Corporation (NYSE: GHM), a global leader in the design and manufacture of mission critical fluid, power, heat transfer, vacuum and advanced mixing technologies for the Defense, Energy & Process, and Space industries, announced that it will release its fourth quarter and fiscal year 2026 financial results before financial markets open on Monday, June 8, 2026.
The Company will host a conference call and webcast to review its financial and operating results, strategy, and outlook. A question-and-answer session will follow.
Fourth Quarter Fiscal Year 2026 Financial Results Conference Call
Monday, June 8, 2026 11:00 a.m. Eastern Time Phone: (201) 689-8560 Internet webcast link and accompanying slide presentation: ir.grahamcorp.com
A telephonic replay will be available from 3:00 p.m. ET on the day of the teleconference through Monday, June 15, 2026. To listen to the archived call, dial (412) 317-6671 and enter conference ID number 13760742 or access the webcast replay via the Company’s website at ir.grahamcorp.com, where a transcript will also be posted once available.
ABOUT GRAHAM CORPORATION Graham is a global leader in the design and manufacture of mission critical fluid, power, heat transfer, vacuum, and advanced mixing technologies for the Defense, Energy & Process, and Space industries. Graham Corporation and its family of global brands are built upon world-renowned engineering expertise, proprietary technologies, as well as its responsive and flexible service and the unsurpassed quality customers have come to expect from the Company’s products and systems. Graham Corporation routinely posts news and other important information on its website, grahamcorp.com, where additional information on Graham Corporation and its businesses can be found.
Novel, potent pan-viral inhibitors targeting the viral replication complex are under development for the treatment of hantavirus, bunyavirus and influenza
Hantavirus and bunyavirus infections represent significant unmet medical needs, contribute to ongoing global outbreaks and have no approved treatments or vaccines
BOTHELL, Wash., May 26, 2026 (GLOBE NEWSWIRE) — Cocrystal Pharma, Inc. (Nasdaq: COCP) (“Cocrystal” or the “Company”) announces that its novel direct-acting antivirals demonstrate pan-viral activity against multiple viruses, including hantavirus, bunyavirus and influenza. These antiviral molecules target a highly conserved region of the viral replication enzyme, specifically the L-protein of Andes hantavirus, which is essential for viral replication and transcription. In vitro potency data show superior activity (IC50 <50 nM) against hantaan virus, which is closely related to the Andes hantavirus strain associated with recent outbreaks.
“We are thoughtfully leveraging our expertise in viral replication enzymes and structure-based drug discovery to develop the next generation of pan-viral replication inhibitors. Our first pan-viral protease inhibitor, CDI-988, recently advanced to a Phase 1b norovirus challenge study in the United States. Our research efforts have expanded to novel pan-viral replication inhibitors with the goal of developing a novel pan-viral lead molecule for multiple viral diseases caused by hantaviruses, bunyaviruses and influenza viruses,” said Sam Lee, Ph.D., President and co-CEO of Cocrystal Pharma. “We are encouraged by our initial in vitro potency data against hantavirus and plan to evaluate in vitro antiviral activity against the Andes hantavirus replication enzyme. We look forward to exploring collaborations and partnerships to address these urgent unmet needs.”
The Andes hantavirus was recently responsible for a deadly outbreak on a cruise ship, infecting up to 11 passengers and crew, resulting in three deaths. Hantaviruses are primarily transmitted by rodents, although human-to-human transmission can occur through prolonged close contact. Andes hantavirus, a member of the genus Hantavirus, is endemic in Argentina and Chile and causes hantavirus cardiopulmonary syndrome (HCPS), which is associated with a case fatality rate of up to 50%. Currently, there are no approved antivirals or vaccines for Andes hantavirus or other hantaviruses.
About Cocrystal Pharma’s Structure-Based Drug Discovery Platform
Cocrystal is leveraging its structure‑based drug discovery platform technology to design next‑generation antiviral candidates that precisely target viral replication mechanisms. By binding to highly conserved regions of viral enzymes, the Company’s compounds aim to maintain potency against mutating strains while minimizing off‑target effects, offering potentially safer, broad‑spectrum antiviral solutions. This approach streamlines candidate identification and optimization, enabling more rapid progression of promising therapies with robust resistance and safety profiles.
The Company’s platform provides a three-dimensional structure of inhibitor complexes at near-atomic resolution, providing immediate insight to guide Structure Activity Relationships. This helps identify novel binding sites and enables a rapid turnaround of structural information through highly automated X-ray data processing and refinement. The goal of this technology is to facilitate the development of novel broad-spectrum antivirals for the treatment of acute, chronic and potentially pandemic viral diseases.
About Cocrystal Pharma, Inc.
Cocrystal Pharma, Inc. is a clinical-stage biotechnology company discovering and developing novel antiviral therapeutics that target the replication process of noroviruses, influenza viruses, coronaviruses (including SARS-CoV-2) and hepatitis C viruses. Cocrystal employs unique structure-based technologies and Nobel Prize-winning expertise to create viable antiviral drugs. For further information about Cocrystal, please visit www.cocrystalpharma.com.
Cautionary Note Regarding Forward-Looking Statements This press release contains forward-looking statements within the meaning of the Private Securities Litigation Reform Act of 1995, including statements regarding the Company’s research and development of pan-viral replication inhibitors and exploration of collaborations and partnerships with respect thereto. The words “believe,” “may,” “estimate,” “continue,” “anticipate,” “intend,” “should,” “plan,” “could,” “target,” “potential,” “is likely,” “will,” “expect” and similar expressions, as they relate to us, are intended to identify forward-looking statements. We have based these forward-looking statements largely on our current expectations and projections about future events. Some or all of the events anticipated by these forward-looking statements may not occur. Important factors that could cause actual results to differ from those in the forward-looking statements include, but are not limited to, the risks and uncertainties arising from inflation, affordability, the possibility of a recession, increases or other developments with respect to interest rates, uncertainty surrounding the impacts arising from imposed and threatened tariffs and developments with respect thereto, and wars and geopolitical conflicts including those in Ukraine and with Iran on our Company, our collaboration partners, and on the U.S. and global economies, including manufacturing and research delays arising from raw materials and labor shortages, supply chain disruptions and other business interruptions including any adverse impacts on our ability to obtain raw materials and test animals as well as similar problems with our vendors our and our collaboration partners’ technology and software performing as expected, financial difficulties experienced by certain partners, risks arising from the research into a related virus was not done in animals and was necessarily early stage, the results of future preclinical and clinical trials, general risks arising from clinical trials, receipt of regulatory approvals, regulatory changes and potential litigation challenging initiatives and actions taken by the Trump Administration which could, among other things, result in delays in regulatory approvals or limit access to federal funding for our programs, development of effective treatments and/or vaccines by competitors, including as part of the programs financed by the U.S. government, potential mutations in a virus we are targeting which may result in variants that are resistant to a product candidate we develop, and our liquidity. Further information on our risk factors is contained in our filings with the SEC, including the “Risk Factors” in Item 1A of our Annual Report on Form 10-K for the year ended December 31, 2025. Any forward-looking statement made by us herein speaks only as of the date on which it is made. Factors or events that could cause our actual results to differ may emerge from time to time, and it is not possible for us to predict all of them. We undertake no obligation to publicly update any forward-looking statement, whether as a result of new information, future developments or otherwise, except as may be required by law.
Investor Contact: Alliance Advisors IR Bruce Voss [email protected] 310-691-7104
Saguenay, Quebec–(Newsfile Corp. – May 26, 2026) – First Phosphate Corp (CSE: PHOS) (OTCQX: FRSPF) (OTCQX ADR: FPHOY) (FSE: KD0) (“First Phosphate” or the “Company”) is pleased to announce the results of its updated Mineral Resource Estimate (“MRE”) for its Bégin-Lamarche project in Saguenay-Lac-Saint-Jean, Québec, Canada. The updated MRE includes results from the 2025-2026 drilling program described in the Company’s press release dated April 27, 2026.
The updated MRE includes a 378% increase in Indicated Mineral Resources over the Company’s Initial MRE dated September 9, 2024.
Measured pit-constrained Mineral Resource: 6.2 Mt @ 7.70% P2O5 (phosphate).
Indicated pit-constrained Mineral Resource: 198.5 Mt @ 6.00% P2O5.
Inferred pit-constrained Mineral Resource: 89.5 Mt @ 6.16% P2O5.
The Deposit remains open at depth.
Metallurgical test work indicates an anticipated apatite concentrate grade of 40.4% P2O5 at an 88% process recovery rate, with very low levels of potentially deleterious elements, and has been qualified for production of battery-grade phosphoric acid for lithium iron phosphate (“LFP”) battery with a conversion ratio of 91.1%.
The Deposit is located next to existing road and hydroelectric infrastructure and at only 70 km driving distance from the deep-sea Port of Saguenay.
The Deposit benefits from definitive, long-term, partially prepaid offtake from an existing, creditworthy partner.
Apatite (phosphorus, phosphate) is listed on the critical minerals lists of Québec, Canada, the United States and the European Union.
“We are pleased with the results of our 2025-2026 drilling exploration program and the quantity and quality upgrade provided to our Mineral Resources,” says First Phosphate CEO, John Passalacqua. “We are now able to continue to move the project forward with great confidence in our Mineral Resources.”
The updated MRE, with an effective date of May 1, 2026, was carried out by Mr. Antoine Yassa, P.Geo., of P&E Mining Consultants Inc., who is an Independent Qualified Person within the meaning of Canadian Securities Administrators’ National Instrument 43-101: Standards of Disclosure for Mineral Projects (“NI 43-101”).
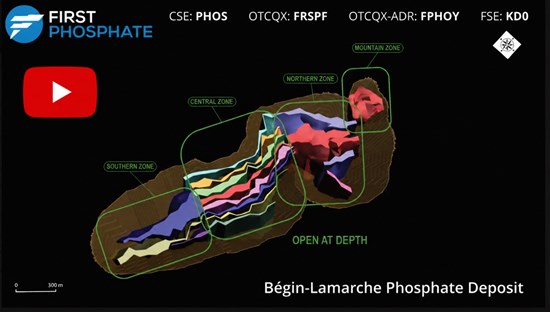
The Bégin-Lamarche Phosphate Deposit contains a significant phosphate Mineral Resource that is associated with well-defined oxide-apatite peridotite (OAP) intrusions within the large Lac-Saint-Jean anorthosite suite (LSJAS). The LSJAS is the largest phosphate-mineralized anorthosite worldwide. The phosphate Deposit is comprised of four mineralized zones which are continuous, only separated by faults within the Deposit and extend over a length of 2,750 m (Figure 1). The Mountain Zone is a single phosphate-bearing mass having a diameter of up to 200 m and a length of 250 m. The Northern zone is comprised of four phosphate layers ranging from 30 m to 200 m in thickness and a length of 625 m. The Central Zone bears eight phosphate layers, one of them having up to 50 m in thickness and extending to 900 m. The Southern Zone bears three phosphate layers, one of them having up to 125 m in thickness and extending to 725 m.
Figure 1 – The Bégin-Lamarche Deposit Updated Optimized Pit Shell
The Bégin-Lamarche Deposit mineralized wireframes boundaries were determined from lithology, structure, and grade boundary interpretation based on visual inspection of drill hole cross-sections. Four mineralized wireframe zones were developed and referred to as the Mountain, Northern, Central and Southern Zones. The mineralized wireframes were constructed on 50 m spaced vertical cross-sections, with on-screen digitized polylines on drill hole cross-sections in GEMS™. The mineralized wireframe outlines were influenced by the selection of mineralized material above 2.5% P2O5 that demonstrated a lithological and structural zonal continuity along strike and down dip. In some cases, mineralization <2.5% P2O5 was included for the purpose of maintaining mineralized zone continuity. The minimum constrained width for mineralized wireframe interpretation was 3 m of drill core length.
The Bégin-Lamarche Mineral Resource Estimate is based on 276 drill holes totalling 68,345 m. The database contained 20,682 analyses for percentage of P2O5. The Mineral Resource Estimate is presented in Table 1.
Table 1 Pit-Constrained Mineral Resource Estimate(1-4) at 2.5% P2O5 Cut-Off
Classification
Zone
Tonnes (M)
P2O5 (%)
P2O5 (Mt)
Measured
Mountain
6.2
7.70
0.47
Total
6.2
7.7
0.47
Indicated
Mountain
5.3
8.45
0.45
Northern
78.3
6.69
5.24
Central
71.0
5.50
3.91
Southern
43.9
5.26
2.31
Total
198.5
6.00
11.91
Measured & Indicated
Mountain
11.5
8.04
0.92
Northern
78.3
6.69
5.24
Central
71.0
5.50
3.91
Southern
43.9
5.26
2.31
Total
204.7
6.05
12.38
Inferred
Mountain
0.5
9.09
0.04
Northern
30.7
7.33
2.25
Central
31.8
5.67
1.80
Southern
26.5
5.32
1.41
Total
89.5
6.16
5.50
Note: P2O5 = phosphorus pentoxide.
1. Mineral Resources, which are not Mineral Reserves, do not have demonstrated economic viability.
2. The estimate of Mineral Resources may be materially affected by environmental, permitting, legal, title, taxation, socio-political, marketing, or other relevant issues.
3. The Inferred Mineral Resource in this estimate has a lower level of confidence than that applied to an Indicated Mineral Resource and must not be converted to a Mineral Reserve. The Company expects that the majority of the Inferred Mineral Resource may be upgraded to an Indicated Mineral Resource with continued exploration.
4. The Mineral Resources in this press release were estimated using the Canadian Institute of Mining, Metallurgy and Petroleum (CIM), CIM Standards on Mineral Resources and Reserves, Definitions (2014) and Best Practices Guidelines (2019) prepared by the CIM Standing Committee on Reserve Definitions and adopted by the CIM Council.
The Bégin-Lamarche Mineral Resource Estimate was derived from applying a 2.5% P2O5 cut-off value to the pit-constrained block model and reporting the resulting tonnes and grades for potentially mineable areas. The following parameters were used to calculate the cut-off value that determines the open pit potentially economic portion of the constrained mineralization (Table 2).
The P2O5 cut-off value is calculated with parameters below:
Mining Cost: C$2.75/t (mineralized material and waste)
Pit Slopes: 45°
Accordingly, the P2O5 cut-off of potential open pit mining is calculated to be = 2.5%.
The optimized pit-constrained Mineral Resource Estimate is moderately sensitive to the selection of reporting P2O5 cut-off values, as demonstrated in Table 2.
Table 2 Pit-Constrained Mineral Resource Estimate Sensitivity to P2O5 Cut-Off
Class
Cut-off
Tonnes
P2O5
P2O5
P2O5 %
(M)
(%)
(Mt)
Measured
5.0
4.9
8.67
0.4
4.5
5.2
8.43
0.4
4.0
5.5
8.22
0.5
3.5
5.8
8.02
0.5
3.0
6.0
7.84
0.5
2.5
6.2
7.70
0.5
2.0
6.3
7.57
0.5
Indicated
5.0
119.0
7.41
8.8
4.5
138.0
7.05
9.7
4.0
156.8
6.71
10.5
3.5
172.9
6.44
11.1
3.0
186.7
6.20
11.6
2.5
198.5
6.00
11.9
2.0
207.6
5.83
12.1
Inferred
5.0
55.5
7.49
4.2
4.5
65.0
7.09
4.6
4.0
73.6
6.75
5.0
3.5
80.9
6.49
5.2
3.0
86.0
6.29
5.4
2.5
89.5
6.16
5.5
2.0
92.0
6.05
5.6
Metallurgical Testwork has been successfully conducted by SGS at their Québec City facility with additional support by SGS Lakefield Ontario. Recent test results have confirmed that an apatite concentrate can be obtained analyzing 40.4% P2O5 and at 88% recovery.
First Phosphate’s Bégin-Lamarche Deposit is located approximately 50 km driving distance north of the City of Saguenay, Québec’s sixth-largest city, which hosts daily flights to Montréal, a skilled industrial workforce, strong local infrastructure, and which is 30 km driving distance from the deep-sea Port of Saguenay.
The geological and drilling work was planned, carried out and supervised by Laurentia Exploration Inc. The drill core was logged at Lamarche near the Deposit and at Laurentia Exploration’s offices. The drill core was sawed and sampled at Laurentia Exploration’s offices in Jonquière.
Qualified Persons
The scientific and technical disclosure for First Phosphate included in this News Release have been reviewed and approved by Steeve Lavoie, P.Geo. Mr. Lavoie is Chief Geologist of the Company and a Qualified Person under National Instrument 43-101 Standards of Disclosure of Mineral Projects (“NI 43-101”).
The Qualified Person independent of the issuer, responsible for estimating the Mineral Resources of the Begin-Lamarche Property, within the meaning of NI 43-101, is Mr. Antoine Yassa, P.Geo., of the firm P&E Mining Consultants Inc. Mr. Yassa has read and approved the scientific and technical information in this press release for accuracy and compliance with NI 43-101.
P&E Mining Consultants Inc., an associate group of 20 geological and mine engineering professionals established in 2004, provides geological and mine engineering consulting reports, Mineral Resource and Mineral Reserve Estimates, NI 43-101 Technical Reports, Preliminary Economic Assessments, Pre-Feasibility and Feasibility Studies.
Laurentia Exploration inc. is a firm of consulting geologists based in Jonquière, Saguenay Lac-St-Jean. It has 80 employees, mainly geology professionals who are members in good standing of a professional order. The firm was founded in 2017 and carries out projects throughout Québec and Ontario.
About First Phosphate Corp.
First Phosphate (CSE: PHOS) (OTCQX: FRSPF) (OTCQX ADR: FPHOY) (FSE: KD0) is a mineral exploration and development and clean technology company dedicated to building and reshoring a vertically integrated mine-to-market supply chain for the production of LFP batteries in North America. Target markets include energy storage, data centers, robotics, mobility, and national security.
First Phosphate’s flagship Bégin-Lamarche property, located in Saguenay-Lac-Saint-Jean, Québec, Canada, represents a rare North American igneous phosphate resource producing high-purity phosphate characterized by very low levels of impurities.
Forward-Looking Information and Cautionary StatementThis news release contains certain statements and information that may be considered “forward-looking statements” and “forward looking information” within the meaning of applicable securities laws. In some cases, but not necessarily in all cases, forward-looking statements and forward-looking information can be identified by the use of forward-looking terminology such as “plans”, “targets”, “expects” or “does not expect”, “is expected”, “an opportunity exists”, “is positioned”, “estimates”, “intends”, “assumes”, “anticipates” or “does not anticipate” or “believes”, or variations of such words and phrases or statements that certain actions, events or results “may”, “could”, “would”, “might”, “will” or “will be taken”, “occur” or “be achieved” and other similar expressions. In addition, statements in this news release that are not historical facts are forward looking statements, including, among other things: the Company’s planned exploration and production activities; the properties and composition of any extracted phosphate; and the calculation of mineral resources at the project and the possibility of eventual economic extraction of minerals from the project. Although the Company believes the expectations expressed in such forward-looking statements are based on reasonable assumptions, such statements are not guarantees of future performance and actual results or developments may differ materially from those forward-looking statements. Factors that could cause actual results to differ materially from those in forward-looking statements include development and exploration successes, continued availability of capital and financing, and general economic, market or business conditions. These statements are based on a number of assumptions including, among other things: that engineering and construction timetables and capital costs for the Company’s, exploration, development and expansion projects are correctly estimated and not affected by unforeseen circumstances; the ability to obtain financing for its proposed operations on acceptable terms; no material deterioration in general business and economic conditions; no material delays in obtaining permits and other approvals; no significant disruptions affecting the activities of the Company or its ability to access required project equipment and services, and operating supplies in sufficient quantities and on a timely basis; inflation and prices for Company project inputs being approximately consistent with anticipated levels; the ability to complete the exploration and development programs consistent with the Company’s expectations; commodity price expectations including assumptions for P2O5; the Company’s relationship with local municipalities and First Nations remaining consistent with the Company’s expectations; the Company’s relationship with other third-party partners and suppliers remaining consistent with the Company’s expectations; and government relations and actions being consistent with Company expectations. Investors are cautioned that any such statements are not guarantees of future performance and actual results or developments may differ materially from those projected in the forward-looking statements. Accordingly, readers should not place undue reliance on the forward-looking information contained in this press release. The Company does not assume any obligation to update or revise its forward-looking statements, whether because of new information, future events or otherwise, except as required by applicable law. All forward-looking
Company Aligns Resources with Programs Demonstrating Strong Clinical, Regulatory, and Market Momentum
ATLANTA, GA — May 26, 2026 — GeoVax Labs, Inc. (Nasdaq: GOVX), a clinical-stage biotechnology company developing immunotherapies and vaccines, today announced a strategic prioritization of its development portfolio to concentrate resources on its lead programs, GEO-MVA and Gedeptin®, reflecting increasing clinical, regulatory, and market alignment across these programs. As part of this decision, the Company has elected to discontinue active development activities related to its GEO-CM04S1 COVID-19 vaccine candidate. This decision was not related to any safety concerns with the vaccine but reflects the continued evolution and contraction of the global COVID-19 vaccine market, and GeoVax’s focus on programs with clearer regulatory pathways, stronger demand visibility, and more immediate commercialization potential. GeoVax emphasized that portfolio prioritization is a standard and essential practice within the biotechnology industry, enabling companies to align resources with the highest-value opportunities as market conditions and scientific landscapes evolve.
“GeoVax is at an important inflection point, and this decision reflects a deliberate and disciplined focus on the programs we believe can deliver the greatest near-term and long-term value,” said David Dodd, Chairman and Chief Executive Officer of GeoVax. “As GEO-MVA advances toward clinical validation and potential commercialization, and as Gedeptin gains relevance within emerging immuno-oncology treatment paradigms, we are aligning our resources to support focused execution against these high-potential opportunities.”
GEO-MVA: Expedited Pathway and Near-Term Commercial Opportunity
GEO-MVA, GeoVax’s Modified Vaccinia Ankara (MVA) vaccine candidate targeting mpox and smallpox, is advancing under an expedited regulatory pathway supported by European Medicines Agency (EMA) scientific advice. This approach enables potential approval based on a single pivotal immunobridging study demonstrating non-inferiority to an approved MVA vaccine – significantly accelerating development timelines and reducing clinical risk.
The program has clinical-grade material manufactured and released in preparation for the planned Phase 3 immunobridging study. Following successful completion, GEO-MVA is expected to advance toward regulatory submission and potential commercialization within a streamlined timeframe, including potential Emergency Use Licensing.
GeoVax has initiated outreach with global procurement and preparedness stakeholders – including government agencies, international organizations, and biodefense programs – supporting potential vaccine supply agreements aligned with national stockpiling and outbreak response needs. These activities position GEO-MVA to serve as a critical additional supplier of MVA-vaccine supporting supply-chain resilience and biodefense preparedness.
Gedeptin®: Aligned with Emerging Immuno-Oncology Treatment Paradigm
Gedeptin®, GeoVax’s gene-directed enzyme prodrug therapy (GDEPT) platform, is being advanced in alignment with a rapidly evolving oncology landscape, highlighted by the landmark KEYNOTE-689 Phase 3 trial demonstrating improved event-free survival with neoadjuvant checkpoint inhibitor therapy in resectable head and neck cancers.
GeoVax’s planned Phase 2 study (AdPNP-203) will evaluate Gedeptin in combination with pembrolizumab and fludarabine in a neoadjuvant setting, with the objective of enhancing tumor immune visibility and improving clinical outcomes.
Gedeptin’s tumor-targeting mechanism is designed to significantly damage or destroy treated lesions through the localized, in situ generation of a potent chemotherapeutic agent. In addition, Gedeptin appears to sensitize tumors to checkpoint inhibitors, likely through the exposure and release of neoantigens from treated lesions, thereby enhancing responses in both treated and untreated lesions. This mechanism may expand response rates and improve durability of outcomes in patients who derive limited benefit from checkpoint inhibition alone. These developments underscore the growing relevance of Gedeptin within this evolving treatment paradigm and support GeoVax’s decision to prioritize its advancement within the Company’s portfolio.
“This is a strategic step forward for GeoVax,” Dodd added. “By concentrating our efforts on GEO-MVA and maintaining our oncology innovation with Gedeptin, we believe we are positioning the Company for a more focused, execution-driven path toward late-stage development, commercialization and long-term value creation”.
About GeoVax
GeoVax Labs, Inc. is a clinical-stage biotechnology company focused on the development of vaccines and immunotherapies addressing high-consequence infectious diseases and solid tumor cancers. GeoVax’s priority program is GEO-MVA, a Modified Vaccinia Ankara (MVA)–based vaccine targeting mpox and smallpox. The program is advancing under an expedited regulatory pathway, with plans to initiate a pivotal Phase 3 clinical trial in the second half of 2026, to address critical global needs for expanded orthopoxvirus vaccine supply and biodefense preparedness. In oncology, GeoVax is developing Gedeptin®, a gene-directed enzyme prodrug therapy (GDEPT) designed to enhance immune checkpoint inhibitor activity. Gedeptin has completed a multicenter Phase 1/2 clinical trial in advanced head and neck cancer and is being advanced into combination strategies, including planned neoadjuvant and first-line settings. GeoVax maintains a global intellectual property portfolio supporting its infectious disease and oncology programs and continues to evaluate strategic partnerships and funding opportunities aligned with its development priorities. For more information, visit www.geovax.com.
Forward-Looking Statements
This release contains forward-looking statements regarding GeoVax’s business plans. The words “believe,” “look forward to,” “may,” “estimate,” “continue,” “anticipate,” “intend,” “should,” “plan,” “could,” “target,” “potential,” “is likely,” “will,” “expect” and similar expressions, as they relate to us, are intended to identify forward-looking statements. We have based these forward-looking statements largely on our current expectations and projections about future events and financial trends that we believe may affect our financial condition, results of operations, business strategy and financial needs. Actual results may differ materially from those included in these statements due to a variety of factors, including whether: GeoVax is able to obtain acceptable results from ongoing or future clinical trials of its investigational products, GeoVax’s immuno-oncology products and preventative vaccines can provoke the desired responses, and those products or vaccines can be used effectively, GeoVax’s viral vector technology adequately amplifies immune responses to cancer antigens, GeoVax can develop and manufacture its immuno-oncology products and preventative vaccines with the desired characteristics in a timely manner, GeoVax’s immuno-oncology products and preventative vaccines will be safe for human use, GeoVax’s vaccines will effectively prevent targeted infections in humans, GeoVax’s immuno-oncology products and preventative vaccines will receive regulatory approvals necessary to be licensed and marketed, GeoVax raises required capital to complete development, there is development of competitive products that may be more effective or easier to use than GeoVax’s products, GeoVax will be able to enter into favorable manufacturing and distribution agreements, and other factors, over which GeoVax has no control.
Further information on our risk factors is contained in our periodic reports on Form 10-Q and Form 10-K that we have filed and will file with the SEC. Any forward-looking statement made by us herein speaks only as of the date on which it is made. Factors or events that could cause our actual results to differ may emerge from time to time, and it is not possible for us to predict all of them. We undertake no obligation to publicly update any forward-looking statement, whether as a result of new information, future developments or otherwise, except as may be required by law.
Real-world analysis of three years of closed claims data from Symphony Health focused on the third year of the study (2023-2024), comprised of more than 261,000 U.S. adults with fibromyalgia
Data underscore high comorbidity burden, multimodal treatment approach, and extensive healthcare resource utilization (HCRU) among patients with fibromyalgia
Tonix commercially launched TONMYA® in November 2025, the first new fibromyalgia drug for adults in the U.S. approved in over 15 years
BERKELEY HEIGHTS, N.J., May 26, 2026 (GLOBE NEWSWIRE) — Tonix Pharmaceuticals Holding Corp. (Nasdaq: TNXP) (“Tonix” or the “Company”), a fully integrated, commercial biotechnology company, presented data from a real-world claims analysis characterizing U.S. adults with fibromyalgia in a poster at ISPOR 2026, the Professional Society for Health Economics and Outcomes Research’s annual meeting, held May 17-20, 2026, in Philadelphia, Pennsylvania.
“Fibromyalgia is a chronic pain disorder characterized by widespread musculoskeletal pain, fatigue, sleep disturbance, cognitive dysfunction, and somatic symptoms, leading to substantial management challenges,”1-4 said Seth Lederman, M.D., President and Chief Executive Officer of Tonix Pharmaceuticals. “More than 10 million adults in the U.S. suffer from fibromyalgia. In response to fibromyalgia’s complex and persistent symptoms, and extensive comorbidities, fibromyalgia patients face rotating treatment approaches, and high HCRU. These findings highlight the need for comprehensive disease management and more effective therapeutic interventions to reduce the clinical and economic burden of fibromyalgia. Tonix is focused on the commercial launch of TONMYA, a first-in-class, first-line, non-opioid analgesic medicine designed for daily bedtime administration and long-term use.”
Data presented at ISPOR 2026 represent a retrospective, multi-year, multi-cohort study using the Symphony Health closed claims database, encompassing administrative medical and pharmacy claims collected between April 2021 and April 2024. The study’s objective was to evaluate real-world characteristics, including demographics, comorbidities, and HCRU among adults diagnosed with fibromyalgia (ICD-10-CM diagnosis code M79.7). The Year 3 cohort (April 2023 to March 2024) included 261,776 adult patients, with a median age of 53 years. Most patients were female (92.1%). Patients were White non-Hispanic (49.6%), Hispanic (22.4%), Other (19.6%), and Black (8.3%).
Comorbidity burden was high, with 93.2% of patients having at least one fibromyalgia-related comorbidity, most commonly anxiety/depression (63.9%), dorsalgia/back pain (56.5%), hypertensive diseases (51.4%), and joint pain (48.4%). Among the 90.3% of patients with at least one co-existing condition (or comorbidity), 36.2% had four or more, and subgroups including Black/Brown women, women on opioids, women with gut health issues, and older women with sleep issues all carried higher rates of comorbidity than the overall cohort. Among insured patients (n=92,157), HCRU was extensive, and inpatient services represented the largest component of healthcare costs at $29,896 per patient annually, followed by pharmacy ($9,453) and outpatient ($6,196) costs, demonstrating the large burden on commercial and public healthcare programs. Antidepressants were the most frequently used medication class (48.2%), followed by NSAID analgesics (43.4%), anticonvulsants (41.6%), gastric acid secretion reducers (41.5%), skeletal muscle relaxants (40.7%), and opioid analgesics (39.4%). The medication use reflects reliance on multimodal pharmacologic strategies to manage fibromyalgia-related symptoms in routine clinical practice.
A copy of the Company’s poster presentation, “Characterizing Patients with Fibromyalgia: A U.S. Real-World Claims Analysis,” is available under the Scientific Presentations tab on the Tonix website at https://www.tonixpharma.com/scientific-presentations/.
About Fibromyalgia
Fibromyalgia is a chronic pain disorder that is understood to result from amplified sensory and pain signaling within the central nervous system. Fibromyalgia afflicts more than 10 million adults in the U.S., approximately 90% of whom are women. Symptoms of fibromyalgia include chronic widespread pain, nonrestorative sleep, fatigue, and morning stiffness. Other associated symptoms include cognitive dysfunction and mood disturbances, including anxiety and depression. Individuals suffering from fibromyalgia struggle with their daily activities, have impaired quality of life, and frequently are disabled. Physicians and patients report common dissatisfaction with currently marketed products.
About TONMYA® (cyclobenzaprine HCl sublingual tablets)
TONMYA (cyclobenzaprine HCl sublingual tablets) is a patented sublingual tablet formulation of cyclobenzaprine hydrochloride which provides rapid transmucosal absorption and reduced production of a long half-life active metabolite, norcyclobenzaprine, due to bypass of first-pass hepatic metabolism. As a multifunctional agent with potent binding and antagonist activities at the 5-HT2A serotonergic, α1-adrenergic, H1-histaminergic, and M1-muscarinic receptors, TONMYA was approved on August 15, 2025, by the FDA for the treatment of fibromyalgia in adults. TONMYA is the first new prescription medicine approved for fibromyalgia in more than 15 years. TONMYA was investigated as TNX-102 SL. TNX-102 SL is also being developed to treat acute stress disorder (ASD)/acute stress reaction (ASR), and major depressive disorder (MDD). The United States Patent and Trademark Office (USPTO) issued United States Patent No. 9636408 in May 2017, Patent No. 9956188 in May 2018, Patent No. 10117936 in November 2018, Patent No. 10,357,465 in July 2019, and Patent No. 10736859 in August 2020. The Protectic™ protective eutectic and Angstro-Technology™ formulation claimed in the patent are important elements of Tonix’s proprietary TONMYA composition. These patents are expected to provide TONMYA with U.S. market exclusivity until 2034/2035.
Citations
1. Bilge U, et al. Cardiovasc Dis. 2018;155:30–5. 2. Choy EH, Mease PJ. Rheum Dis Clin North Am. 2009;35(2):329–37. 3. Rivera FA, et al. Front Med (Lausanne). 2023;10:1301944. 4. Winslow BT, et al. Am Fam Physician. 2023;107(2):137–44.
Tonix Pharmaceuticals Holding Corp.
Tonix Pharmaceuticals* is a fully integrated, commercial-stage biotechnology company focused on central nervous system (CNS) disorders, infectious diseases, immunology conditions, and rare diseases where there exists high unmet medical need. TONMYA® (cyclobenzaprine HCl sublingual tablets 2.8mg), the Company’s flagship internally conceived and developed medicine, is the first new treatment for fibromyalgia in more than 15 years. Tonix’s CNS commercial infrastructure supports its marketed products, including its acute migraine products, Zembrace® SymTouch® (sumatriptan injection 3 mg) and Tosymra® (sumatriptan nasal spray 10 mg). Tonix is extending the science behind TONMYA in Phase 2 clinical studies to evaluate its potential in major depressive disorder and acute stress disorder/acute stress reaction. Tonix is also advancing a pipeline of infectious disease programs, including monoclonal antibody TNX-4800 (anti-OspA mAb) for Lyme disease prevention in the U.S. and TNX-801 (horsepox, live virus vaccine), a vaccine in development for the prevention of mpox and smallpox. Within immunology, Tonix is developing TNX-1500 (anti-CD40L mAb), a third-generation CD40 ligand inhibitor for the prevention of kidney transplant rejection. Finally, the Company’s rare disease portfolio includes TNX-2900, which is Phase 2 ready for the treatment of Prader-Willi syndrome. To learn more, visit www.tonixpharma.com.
*Tonix’s product development candidates are investigational new drugs or biologics; their efficacy and safety have not been established and have not been approved for any indication.
Zembrace SymTouch and Tosymra are registered trademarks of Tonix Medicines. TONMYA is a registered trademark of Tonix Pharma Limited. All other marks are property of their respective owners.
Forward Looking Statements
Certain statements in this press release are forward-looking within the meaning of the Private Securities Litigation Reform Act of 1995 including those relating to the completion of the offering, the satisfaction of customary closing conditions, the intended use of proceeds from the offering and other statements that are predictive in nature. These statements may be identified by the use of forward-looking words such as “anticipate,” “believe,” “forecast,” “estimate,” “expect,” and “intend,” among others. There are a number of factors that could cause actual events to differ materially from those indicated by such forward-looking statements. These factors include, but are not limited to, risks related to the failure to successfully launch and commercialize TONMYA® and any of our approved products; risks related to the failure to obtain FDA clearances or approvals and noncompliance with FDA regulations; risks related to the timing and progress of clinical development of our product candidates; our need for additional financing; uncertainties of patent protection and litigation; uncertainties of government or third party payor reimbursement; limited research and development efforts and dependence upon third parties; and substantial competition. As with any pharmaceutical under development, there are significant risks in the development, regulatory approval and commercialization of new products. Tonix does not undertake an obligation to update or revise any forward-looking statement. Investors should read the risk factors set in the Company’s Annual Report on Form 10-K for the year ended December 31, 2025, as filed with the SEC on March 12, 2026, and periodic reports filed with the SEC on or after the date thereof. Tonix does not undertake an obligation to update or revise any forward-looking statement. All of Tonix’s forward-looking statements are expressly qualified by all such risk factors and other cautionary statements. The information set forth herein speaks only as of the date thereof.
INDICATION TONMYA is indicated for the treatment of fibromyalgia in adults.
CONTRAINDICATIONS TONMYA is contraindicated:
In patients with hypersensitivity to cyclobenzaprine or any inactive ingredient in TONMYA. Hypersensitivity reactions may manifest as an anaphylactic reaction, urticaria, facial and/or tongue swelling, or pruritus. Discontinue TONMYA if a hypersensitivity reaction is suspected. With concomitant use of monoamine oxidase (MAO) inhibitors or within 14 days after discontinuation of an MAO inhibitor. Hyperpyretic crisis seizures and deaths have occurred in patients who received cyclobenzaprine (or structurally similar tricyclic antidepressants) concomitantly with MAO inhibitors drugs.
During the acute recovery phase of myocardial infarction, and in patients with arrhythmias, heart block or conduction disturbances, or congestive heart failure. In patients with hyperthyroidism.
WARNINGS AND PRECAUTIONS Embryofetal toxicity: Based on animal data, TONMYA may cause neural tube defects when used two weeks prior to conception and during the first trimester of pregnancy. Advise females of reproductive potential of the potential risk and to use effective contraception during treatment and for two weeks after the final dose. Perform a pregnancy test prior to initiation of treatment with TONMYA to exclude use of TONMYA during the first trimester of pregnancy.
Serotonin syndrome: Concomitant use of TONMYA with selective serotonin reuptake inhibitors (SSRIs), serotonin norepinephrine reuptake inhibitors (SNRIs), tricyclic antidepressants, tramadol, bupropion, meperidine, verapamil, or MAO inhibitors increases the risk of serotonin syndrome, a potentially life-threatening condition. Serotonin syndrome symptoms may include mental status changes, autonomic instability, neuromuscular abnormalities, and/or gastrointestinal symptoms. Treatment with TONMYA and any concomitant serotonergic agent should be discontinued immediately if serotonin syndrome symptoms occur and supportive symptomatic treatment should be initiated. If concomitant treatment with TONMYA and other serotonergic drugs is clinically warranted, careful observation is advised, particularly during treatment initiation or dosage increases.
Tricyclic antidepressant-like adverse reactions: Cyclobenzaprine is structurally related to TCAs. TCAs have been reported to produce arrhythmias, sinus tachycardia, prolongation of the conduction time leading to myocardial infarction and stroke. If clinically significant central nervous system (CNS) symptoms develop, consider discontinuation of TONMYA. Caution should be used when TCAs are given to patients with a history of seizure disorder, because TCAs may lower the seizure threshold. Patients with a history of seizures should be monitored during TCA use to identify recurrence of seizures or an increase in the frequency of seizures.
Atropine-like effects: Use with caution in patients with a history of urinary retention, angle-closure glaucoma, increased intraocular pressure, and in patients taking anticholinergic drugs.
CNS depression and risk of operating a motor vehicle or hazardous machinery: TONMYA monotherapy may cause CNS depression. Concomitant use of TONMYA with alcohol, barbiturates, or other CNS depressants may increase the risk of CNS depression. Advise patients not to operate a motor vehicle or dangerous machinery until they are reasonably certain that TONMYA therapy will not adversely affect their ability to engage in such activities. Oral mucosal adverse reactions: In clinical studies with TONMYA, oral mucosal adverse reactions occurred more frequently in patients treated with TONMYA compared to placebo. Advise patients to moisten the mouth with sips of water before administration of TONMYA to reduce the risk of oral sensory changes (hypoesthesia). Consider discontinuation of TONMYA if severe reactions occur.
ADVERSE REACTIONS The most common adverse reactions (incidence ≥2% and at a higher incidence in TONMYA-treated patients compared to placebo-treated patients) were oral hypoesthesia, oral discomfort, abnormal product taste, somnolence, oral paresthesia, oral pain, fatigue, dry mouth, and aphthous ulcer.
DRUG INTERACTIONS MAO inhibitors: Life-threatening interactions may occur. Other serotonergic drugs: Serotonin syndrome has been reported. CNS depressants: CNS depressant effects of alcohol, barbiturates, and other CNS depressants may be enhanced.
Tramadol: Seizure risk may be enhanced. Guanethidine or other similar acting drugs: The antihypertensive action of these drugs may be blocked.
USE IN SPECIFIC POPULATIONS Pregnancy: Based on animal data, TONMYA may cause fetal harm when administered to a pregnant woman. The limited amount of available observational data on oral cyclobenzaprine use in pregnancy is of insufficient quality to inform a TONMYA-associated risk of major birth defects, miscarriage, or adverse maternal or fetal outcomes. Advise pregnant women about the potential risk to the fetus with maternal exposure to TONMYA and to avoid use of TONMYA two weeks prior to conception and through the first trimester of pregnancy. Report pregnancies to the Tonix Medicines, Inc., adverse-event reporting line at 1-888-869-7633 (1-888-TNXPMED).
Lactation: A small number of published cases report the transfer of cyclobenzaprine into human milk in low amounts, but these data cannot be confirmed. There are no data on the effects of cyclobenzaprine on a breastfed infant, or the effects on milk production. The developmental and health benefits of breastfeeding should be considered along with the mother’s clinical need for TONMYA and any potential adverse effects on the breastfed child from TONMYA or from the underlying maternal condition.
Pediatric use: The safety and effectiveness of TONMYA have not been established. Geriatric patients: Of the total number of TONMYA-treated patients in the clinical trials in adult patients with fibromyalgia, none were 65 years of age and older. Clinical trials of TONMYA did not include sufficient numbers of patients 65 years of age and older to determine whether they respond differently from younger adult patients.
Hepatic impairment: The recommended dosage of TONMYA in patients with mild hepatic impairment (HI) (Child Pugh A) is 2.8 mg once daily at bedtime, lower than the recommended dosage in patients with normal hepatic function. The use of TONMYA is not recommended in patients with moderate HI (Child Pugh B) or severe HI (Child Pugh C). Cyclobenzaprine exposure (AUC) was increased in patients with mild HI and moderate HI compared to subjects with normal hepatic function, which may increase the risk of TONMYA-associated adverse reactions.
Please see additional safety information in the full Prescribing Information. To report suspected adverse reactions, contact Tonix Medicines, Inc. at 1-888-869-7633, or the FDA at 1-800-FDA-1088 or www.fda.gov/medwatch.
Micron Technology (Nasdaq: MU) surged more than 12% Tuesday to trade near $850, extending what has already been one of the most remarkable runs in the semiconductor sector over the past twelve months. The catalyst was a Wall Street price target revision that set a new high-water mark for analyst expectations on the stock — but the move reflects something larger than a single upgrade. It reflects a growing conviction that artificial intelligence has fundamentally and permanently changed how memory markets work.
The numbers behind that conviction are not abstract. Micron’s most recent quarter posted revenue of $13.64 billion, up 57% year over year, with non-GAAP earnings per share of $4.78 and well above the $3.94 consensus estimate. Its Cloud Memory Business Unit nearly doubled to $5.28 billion in a single quarter at 66% gross margins. Forward guidance calls for $18.7 billion in revenue next quarter with non-GAAP EPS of $8.42. These are numbers that reflect the hyperscaler AI buildout running directly through Micron’s high-bandwidth memory franchise at full speed.
Why This Cycle Feels Different
Memory semiconductors have historically been among the most volatile in the chip sector — prone to sharp boom-bust swings driven by oversupply, inventory corrections, and demand unpredictability. Those cycles made memory stocks notoriously difficult to value and kept multiples compressed even during periods of strong earnings. What’s changing now is the nature of demand itself.
AI data centers consume high-bandwidth memory at a scale and consistency that prior computing architectures never required. Unlike consumer electronics demand which is seasonal, discretionary, and cyclical, hyperscaler AI infrastructure spending is driven by multi-year capital commitments from companies like Amazon, Microsoft, Google, and Meta that are building capacity they believe they will need for decades. That shift is beginning to generate long-term supply agreements that lock in pricing and demand visibility, smoothing the earnings volatility that historically made memory stocks difficult to hold through a full cycle.
If that structural change holds, the entire framework for valuing memory companies changes with it, and Micron, as the dominant US-based producer, is the most direct expression of that thesis.
The Domestic Manufacturing Milestone
Layered underneath Tuesday’s move is a separate development that adds industrial and political weight to the story. On Friday, Micron’s Manassas, Virginia facility began producing 1-alpha DRAM, the most advanced memory chip ever manufactured on US soil. The milestone arrives as Washington continues to prioritize domestic semiconductor production under the CHIPS Act framework, and as AI supply chains face increasing scrutiny around geographic concentration. Micron now holds onshore capacity, active government support, and an accelerating demand environment simultaneously, a combination that rarely aligns this cleanly.
MU stock has now run approximately eightfold over the past year, outperforming the S&P 500, the VanEck Semiconductor ETF, and the iShares Semiconductor ETF by a wide margin.
The Broader Semiconductor Read
For investors tracking smaller names in the semiconductor space, the Micron move carries a direct implication. If AI has structurally improved the durability and predictability of memory market earnings, the same logic begins to apply to smaller companies serving adjacent segments, specialty DRAM providers, DDR5 component manufacturers, advanced packaging companies, and AI-optimized storage technology players. AMD climbed more than 5% Tuesday on the same AI semiconductor sentiment wave, confirming this is a sector rerating rather than a single-stock event.
The memory supercycle has a new price tag. The market is just beginning to figure out what that means for everything downstream.
Michael Kupinski, Director of Research, Equity Research Analyst, Digital, Media & Technology , Noble Capital Markets, Inc.
Jacob Mutchler, Research Associate, Noble Capital Markets, Inc.
Refer to the full report for the price target, fundamental analysis, and rating.
Sale viewed favorably. The sale of the Public Transit business is expected to significantly narrow Conduent’s global operating footprint and streamline operations, while also exiting a capital-intensive business that required ongoing investments in hardware, infrastructure, and implementation. We believe the transaction should improve operational focus and support management’s strategy to prioritize higher-margin, technology-enabled service offerings.
Estimate revisions affect revenue, not adj. EBITDA. Despite likely downward revisions to revenue guidance following the divestiture, we do not anticipate a meaningful change to EBITDA guidance and believe the transaction improves overall business quality by increasing focus on higher-margin, technology-enabled service offerings. We have adjusted our 2026 and 2027 revenue expectations in light of the prospective sale.
Equity Research is available at no cost to Registered users of Channelchek. Not a Member? Click ‘Join’ to join the Channelchek Community. There is no cost to register, and we never collect credit card information.
This Company Sponsored Research is provided by Noble Capital Markets, Inc., a FINRA and S.E.C. registered broker-dealer (B/D).
*Analyst certification and important disclosures included in the full report. NOTE: investment decisions should not be based upon the content of this research summary. Proper due diligence is required before making any investment decision.
Mark Reichman, Managing Director, Equity Research Analyst, Natural Resources, Noble Capital Markets, Inc.
Refer to the full report for the price target, fundamental analysis, and rating.
First quarter financial results. Euroseas Ltd. reported solid first-quarter 2026 financial performance supported by elevated charter rates, full fleet utilization, and disciplined cost management. Although net revenues declined slightly to $55.8 million from $56.3 million in the prior year period due to a smaller average fleet size, adjusted EBITDA increased to $40.9 million from $37.1 million, and adjusted earnings per share rose to $4.70 from $3.76. The Company also maintained a strong balance sheet with substantial liquidity, moderate leverage, and approximately $650 million in contracted revenue backlog, providing significant visibility into future cash flow generation.
Outlook remains favorable. In our view, the outlook for the feeder and intermediate containership segments remains favorable through the remainder of 2026 based on constrained vessel supply, high fleet utilization, and ongoing supply chain disruptions. However, growing macro and geopolitical risks, including slowing global growth, evolving trade policies, and Middle East tensions, could temper containerized trade growth in 2027. Euroseas’ strong charter coverage of 92.4% in 2026, 75.9% in 2027, and 43.1% in 2028 is expected to insulate the company from any volatility in the market.
Equity Research is available at no cost to Registered users of Channelchek. Not a Member? Click ‘Join’ to join the Channelchek Community. There is no cost to register, and we never collect credit card information.
This Research is provided by Noble Capital Markets, Inc., a FINRA and S.E.C. registered broker-dealer (B/D).
*Analyst certification and important disclosures included in the full report. NOTE: investment decisions should not be based upon the content of this research summary. Proper due diligence is required before making any investment decision.
Mark Reichman, Managing Director, Equity Research Analyst, Natural Resources, Noble Capital Markets, Inc.
Refer to the full report for the price target, fundamental analysis, and rating.
1Q 2026 Financial Results. EuroDry Ltd. reported an improvement in 1Q 2026 financial performance compared to the prior year period, driven primarily by stronger dry bulk charter markets and improved fleet utilization. Total net revenues increased 38.9% year-over-year to $12.8 million, while average time charter equivalent rates more than doubled to $14,416 per day from $7,167 per day during the prior year period. Adjusted net income attributable to controlling shareholders amounted to $330.8 thousand, or $0.12 per share, compared to a net loss of $5.7 million, or $(2.07) per share, in the prior year period. Adjusted EBITDA increased to $4.9 million compared to a loss of $1.0 million during the prior year period, reflecting strong operating leverage as freight rates recovered.
Strong Operational Quarter. Fleet utilization improved to 99.7%, with commercial utilization at 100%, reflecting minimal downtime and effective charter execution. Vessel operating expenses declined year-over-year due to a smaller average fleet size, while daily operating costs remained stable despite inflation. Meanwhile, dry bulk market conditions strengthened in April and May 2026, with one-year Ultramax and Kamsarmax charter rates nearing or surpassing $20,000 per day, supporting improved earnings prospects for the coming quarters.
Equity Research is available at no cost to Registered users of Channelchek. Not a Member? Click ‘Join’ to join the Channelchek Community. There is no cost to register, and we never collect credit card information.
This Research is provided by Noble Capital Markets, Inc., a FINRA and S.E.C. registered broker-dealer (B/D).
*Analyst certification and important disclosures included in the full report. NOTE: investment decisions should not be based upon the content of this research summary. Proper due diligence is required before making any investment decision.
Americans hitting the road this Memorial Day weekend are paying the highest prices at the pump in nearly four years and the bill is coming due for small and microcap companies across the consumer economy whether they are behind the wheel or not.
The national average for a gallon of regular gasoline reached $4.56 on Thursday according to AAA, up more than $1.38 from this time last year and more than 50% since the US and Israel launched strikes on Iran on February 28. Every single US state has now crossed the $4 threshold. Seven states are posting averages above $5, with California topping the national rankings at $6.16 per gallon. The last time Memorial Day fuel costs were this elevated was 2022, in the wake of Russia’s full-scale invasion of Ukraine, when the national average peaked at $4.61.
The summer outlook is not encouraging. GasBuddy projects the national average will run at approximately $4.80 per gallon across the full summer driving season from Memorial Day through Labor Day and warns prices could test the all-time record of $5.02 per gallon if the Strait of Hormuz remains effectively closed deep into the season. GasBuddy’s head of petroleum analysis attributes more than 90% of the year-over-year gap at the pump directly to the Iran conflict and the resulting disruption to the strait, which normally handles roughly one-fifth of global oil supply and has now been compromised for twelve consecutive weeks.
Record Travel, Real Costs
The timing could not be more pointed. AAA projects a record 45 million Americans will travel at least 50 miles this Memorial Day weekend, up from 44.8 million in 2025 and nearly 5% above pre-pandemic 2019 levels. Of those travelers, 87% will be driving. Gasoline demand ticked higher last week to 8.76 million barrels per day even as total domestic supply fell to 214.2 million barrels and production slipped to 9.3 million barrels per day. Demand rising into a tightening supply picture is not a recipe for relief at the pump.
The Small Cap Exposure
For investors in the sub-$2 billion market cap space, this is not an abstract macro story, it is an active margin event playing out across multiple sectors simultaneously. Regional trucking companies, last-mile delivery operators, and logistics providers are absorbing diesel costs that have risen sharply alongside gasoline, with limited ability to push surcharges through in a competitive environment. Consumer-facing small caps in food service, casual dining, and retail are getting squeezed from two directions: higher distribution and operating costs on one side, and a consumer with less disposable income after filling the tank on the other.
Travel-adjacent small caps, regional hospitality operators, independent hotel brands, and leisure-focused consumer companies face a more nuanced picture. Record travel volumes represent a genuine demand tailwind, but margin pressure from elevated fuel and labor costs can quickly offset volume gains for operators without significant pricing power.
The companies best positioned on the other side of this trade remain domestic energy producers. With WTI holding above $100 and summer demand accelerating into a supply-constrained market, independent oil and gas operators in the small cap space continue to benefit from a price environment that shows no structural signs of easing before fall.
The pump price this weekend is $4.56. If the Strait of Hormuz stays closed, it may look cheap by August.