Indo-Pacific revenue growth of 27% y/y driven by increased demand
Book-to-bill of 1.2x in the quarter and total backlog of $12.5 billion as of December 31, 2024
Record net income of $25.0 million; Adjusted net income1 of $42.7 million, up 10% y/y
Grew adjusted EBITDA1 $4.1 million y/y to $86.2 million, with a margin of 7.4%
Diluted EPS of $0.78; Adjusted diluted EPS1 of $1.33, up 9% y/y
Strong year-to-date cash flow from operations of $254 million
Achieved net debt reduction of $210 million and 2.6x net leverage ratio1
RESTON, Va., Feb. 24, 2025 /PRNewswire/ — V2X, Inc. (NYSE: VVX) announced fourth quarter and full-year 2024 financial results.
“Our growth momentum continued into the fourth quarter with revenue increasing 11% year-over-year, driven by solid growth in all geographies and underscored by 27% growth in the Indo-Pacific region, as the DoD continues to focus on enhancing readiness and deterrence,” said Jeremy Wensinger, President and Chief Executive Officer. “The combination of our unique mission insight, comprehensive full lifecycle capabilities, and 80-year reputation as a trusted partner is yielding results through expansion in key theaters, exceptional financial performance, and recent awards, which achieved a book-to-bill of 1.2x. The leading indicators in our business remain strong with a $12.5 billion backlog, limited recompetes, and a robust pipeline of new opportunities.”
Mr. Wensinger continued, “Looking ahead, we are excited about the future. We believe our track record of enhancing outcomes and increasing value for customers through innovation, modernization, and improved operational performance can enable the DoD to solve its very real challenge of having to be prepared for today while planning for the threats of tomorrow.”
Mr. Wensinger concluded, “I’d like to recognize the 16,000 plus V2X employees for all their contributions and performance throughout the year and in particular during the fourth quarter. We thank you for all you have done and continue to do for our nation and our company.”
Fourth Quarter 2024 Results
“V2X reported record revenue of $1.16 billion in the quarter, which represents 11% year-over-year growth,” said Shawn Mural, Senior Vice President and Chief Financial Officer. “We closed the year with strong performance across all financial metrics, driven by double digit topline growth and excellent cash generation.”
“For the quarter, the Company reported operating income of $51.6 million and adjusted operating income1 of $80.6 million. V2X delivered record adjusted EBITDA1 of $86.2 million, with a margin of 7.4%. Fourth quarter GAAP diluted EPS was $0.78. Adjusted diluted EPS1 for the quarter increased 9% year-over-year to $1.33.”
“Fourth quarter net cash provided by operating activities was $223.1 million. Adjusted net cash provided by operating activities1 increased 122% year-over-year to $168.2 million.”
“Our continued focus on cash generation and debt reduction yielded notable results with net debt improving $210 million dollars year-over-year. At the end of the fourth quarter, net debt for V2X was $874 million. Our commitment to achieve a net leverage ratio at or below 3.0x was a company-wide priority. I’m pleased to report that we demonstrated excellent performance on this front, delivering a net leverage ratio1 of 2.6x at the end of the fourth quarter, which represents a 0.7x improvement year-over-year.”
“Total backlog as of December 31, 2024, was $12.5 billion. Funded backlog was $2.3 billion. Book-to-bill in the quarter was approximately 1.2x.”
Full-Year 2024 Results
“Full-year revenue was $4.32 billion, up 9% year-over-year. The Company reported full-year operating income of $159.2 million and adjusted operating income1 of $286.2 million. Full-year adjusted EBITDA1 was $310.2 million with a margin of 7.2%. Full-year GAAP diluted EPS was $1.08. Adjusted diluted EPS1 for 2024 was $4.34, increasing 16% year-over-year. On a year-to-date basis, net cash provided by operating activities was $254.2 million. Adjusted net cash provided by operating activities1 was $161.0 million.”
2025 Guidance
Mr. Mural concluded, “The trends in our business remain positive and we believe our strategy to deliver full lifecycle solutions that increase efficiency, reduce costs, modernize capabilities, improve readiness, and strengthen national security provides substantial opportunities for future growth and value creation. For 2025 we are setting the mid-point of our guidance for revenue and Adjusted EBITDA1 at $4.44 billion and $313 million, respectively. This assumes revenue and adjusted EBITDA to be weighted more heavily in the second half of the year. Revenue guidance at the mid-point assumes approximately 4% contribution from recompetes.”
Guidance for 2025 is as follows:
$ millions, except for per share amounts
2025 Guidance
2025 Mid-Point
Revenue
$4,375
$4,500
$4,438
Adjusted EBITDA1
$305
$320
$313
Adjusted Diluted Earnings Per Share1
$4.45
$4.85
$4.65
Adjusted Net Cash Provided by Operating Activities1
$150
$170
$160
The Company is not providing a quantitative reconciliation with respect to the foregoing forward-looking non-GAAP measures in reliance on the “unreasonable efforts” exception set forth in SEC rules because certain financial information, the probable significance of which cannot be determined, is not available and cannot be reasonably estimated. For example, unusual, one-time, non-ordinary, or non-recurring costs, which relate to M&A, integration and related activities cannot be reasonably estimated. Forward-looking statements are based upon current expectations and are subject to factors that could cause actual results to differ materially from those suggested here, including those factors set forth in the Safe Harbor Statement below.
Fourth Quarter Conference Call
Management will conduct a conference call with analysts and investors at 4:30 p.m. ET on Monday, February 24, 2025. U.S.-based participants may dial in to the conference call at 877-300-8521, while international participants may dial 412-317-6026. A live webcast of the conference call as well as an accompanying slide presentation will be available here: https://app.webinar.net/W6kmnm4z8V9
A replay of the conference call will be posted on the V2X website shortly after completion of the call and will be available for one year. A telephonic replay will also be available through March 10, 2025, at 844-512-2921 (domestic) or 412-317-6671 (international) with passcode 10195666.
Presentation slides that will be used in conjunction with the conference call will also be made available online in advance on the “investors” section of the company’s website at https://gov2x.com. V2X recognizes its website as a key channel of distribution to reach public investors and as a means of disclosing material non-public information to comply with its obligations under the U.S. Securities and Exchange Commission (“SEC”) Regulation FD.
1
See “Key Performance Indicators and Non-GAAP Financial Measures” for descriptions and reconciliations.
About V2X V2X builds innovative solutions that integrate physical and digital environments by aligning people, actions, and technology. V2X is embedded in all elements of a critical mission’s lifecycle to enhance readiness, optimize resource management, and boost security. The company provides innovation spanning national security, defense, civilian, and international markets. With a global team of approximately 16,000 professionals, V2X enables mission success by injecting AI and machine learning capabilities to meet today’s toughest challenges across all operational domains.
Safe Harbor Statement Safe Harbor Statement under the Private Securities Litigation Reform Act of 1995 (the “Act”): Certain material presented herein includes forward-looking statements intended to qualify for the safe harbor from liability established by the Act. These forward-looking statements include, but are not limited to, all the statements and items listed under “2025 Guidance” above and other assumptions contained therein for purposes of such guidance, other statements about our 2025 performance outlook, revenue, contract opportunities, and any discussion of future operating or financial performance.
Forward-looking statements generally can be identified by the use of forward-looking terminology such as “may,” “will,” “expect,” “intend,” “estimate,” “anticipate,” “believe,” “could,” “potential,” “continue” or similar terminology. These statements are based on the beliefs and assumptions of the management of the Company based on information currently available to management. Forward-looking statements in this press release, include, but are not limited to our future performance and capabilities; our expectations regarding the pipeline of new opportunities; our belief in our ability to achieve budget efficiencies; future net leverage ratio; and our belief in our ability to achieve our total year guidance.
These forward-looking statements are not guarantees of future performance, conditions, or results, and involve a number of known and unknown risks, uncertainties, assumptions, and other important factors, many of which are outside our management’s control, which could cause actual results to differ materially from the results discussed in the forward-looking statements. In addition, forward-looking statements are subject to certain risks and uncertainties that could cause actual results to differ materially from the Company’s historical experience and our present expectations or projections. For a discussion of some of the risks and uncertainties that could cause actual results to differ from such forward-looking statements, see the risks and other factors detailed from time to time in our Annual Report on Form 10-K, Quarterly Reports on Form 10-Q, and other filings with the SEC.
We undertake no obligation to update any forward-looking statements, whether as a result of new information, future events or otherwise, except as required by law.
Key Points: – Eli Lilly (LLY) is acquiring Organovo’s (ONVO) FXR program, including lead drug candidate FXR314, for further development. – Organovo will receive an upfront payment along with milestone-based regulatory and commercial payouts. – ONVO stock surged over 200% following the announcement.
In a significant move for the biotechnology sector, Organovo Holdings, Inc. (Nasdaq: ONVO) announced the sale of its FXR program, including its lead candidate FXR314, to pharmaceutical giant Eli Lilly and Company (NYSE: LLY). The acquisition, disclosed on Tuesday, marks a pivotal moment for Organovo as it aligns its proprietary 3D human tissue technology with a global leader in drug development.
The FXR program, focused on inflammatory bowel disease (IBD), is a major step toward advancing novel treatment approaches. Organovo’s Executive Chairman, Keith Murphy, expressed confidence in Lilly’s ability to further develop FXR314, highlighting the company’s world-class expertise and commitment to patient care.
Under the agreement, Organovo will receive an upfront cash payment, with additional milestone payments contingent on regulatory approvals and commercial success. While the specific financial terms remain undisclosed, the market’s response has been overwhelmingly positive.
Following the announcement, ONVO shares skyrocketed by over 200%, reflecting investor optimism about the deal’s potential impact. Lilly’s stock also saw a modest gain of 2.32% as the acquisition strengthens its pipeline in the IBD treatment space.
For Organovo, this transaction reinforces its ability to leverage its cutting-edge 3D tissue technology for drug development partnerships. The company, known for pioneering bioprinting innovations, has been positioning itself as a key player in personalized medicine and regenerative therapies.
For Eli Lilly, the acquisition aligns with its broader strategy of expanding its immunology portfolio. FXR314’s development complements Lilly’s existing research efforts in inflammatory diseases, further cementing its position as a leader in next-generation therapeutics.
With FXR314 now under Lilly’s stewardship, the biotech industry will closely monitor its progression into Phase 2 trials. If successful, the drug could represent a breakthrough in IBD treatment, addressing a significant unmet medical need.
As Organovo pivots towards future innovation, and Lilly integrates this promising asset into its pipeline, investors and analysts alike will be watching closely to gauge the long-term benefits of this high-profile acquisition.
SKYX Advanced and Smart Plug & Play Technologies to be utilized in Cavco’s High-End Premium Manufactured Homes at the World Largest Builders’ Show IBS
Since its Inception Cavco Homes is Estimated to Have Sold Nearly 1 Million Homes and Close to 20,000 Homes Annually During the Past Years
As SKYX Continues to Increase its U.S. and Canada Market Penetration, its Technologies will be Used in Cavco’s High-End Homes including the New Leading Premium Homes Skye View and Bungalow Models, in Show Village during the International Builders’ Show in Las Vegas February 25-27, 2025
MIAMI, Feb. 24, 2025 (GLOBE NEWSWIRE) — SKYX Platforms Corp. (NASDAQ: SKYX) (d/b/a SKYX Technologies) (the “Company” or “SKYX”), a highly disruptive advanced and smart home platform technology company for homes and buildings, with more than 97 issued and pending patents globally and over 60 lighting and home décor websites, announces it will collaborate with Cavco Industries, Inc., a U.S. leading prefabricated home manufacturer to utilize SKYX’s advanced and smart plug & play technologies in Cavco’s premium prefabricated homes during the International Builders’ Show (IBS). SKYX’s technologies will be used in Cavco’s high-end homes, including their new leading premium homes Skye View and Bungalow models, in Show Village during the International Builders’ Show place in Las Vegas from February 25-27, 2025.
SKYX’s advance and smart plug & play platform technologies makes homes and buildings become advanced, safe, and smart instantly while significantly saving time and cost as well as adding substantial value to developers and homeowners.
Cavco is a leading U.S. manufacturer of prefabricated homes. As a publicly traded company, it ranks among the largest producers of manufactured and modular homes in the nation, renowned for its high-quality, premium designs. Cavco specializes in designing and producing factory-built housing products, which are distributed through an extensive network of independent and company-owned retailers. Since its inception, it is estimated that Cavco has sold nearly one million homes, with recent annual sales approaching 20,000 units.
Tim Gage, National Vice President of Cavco’s Park Models, and Specialty Homes said, “We are excited to utilize SKYX’s game-changing safe plug and play technology in our Cavco Park Model prefabricated homes at the IBS Pro Builder Show Village. We welcome people to visit our premium homes including our Skye View and Bungalow models to see how we utilize SKYX’s technologies. I strongly believe that the SKYX technology can become the standard for new construction, as it provides, safety, time saving, and smart capabilities, while advancing and adding significant value to our homes.”
Rani Kohen, Founder/Inventor and Executive Chairman, of SKYX Platforms, said, “We are truly excited to collaborate with a U.S. leading premium prefabricated home manufacturer such as Cavco during the world’s largest building show, IBS. This is another step toward our goal of making homes and buildings become advanced, safe, and smart as the new standard. We look forward to continuing to demonstrate our advanced smart platform technology’s ability to make homes and buildings become smarter and safer instantly, while significantly advancing buildings and saving time and costs for developers.”
About SKYX Platforms Corp.
As electricity is a standard in every home and building, our mission is to make homes and buildings become safe-advanced and smart as the new standard. SKYX has a series of highly disruptive advanced-safe-smart platform technologies, with over 97 U.S. and global patents and patent pending applications. Additionally, the Company owns over 60 lighting and home decor websites for both retail and commercial segments. Our technologies place an emphasis on high quality and ease of use, while significantly enhancing both safety and lifestyle in homes and buildings. We believe that our products are a necessity in every room in both homes and other buildings in the U.S. and globally. For more information, please visit our website at https://skyplug.com/ or follow us on LinkedIn.
Forward-Looking Statements Certain statements made in this press release are not based on historical facts, but are forward-looking statements. These statements can be identified by the use of forward-looking terminology such as “aim,” “anticipate,” “believe,” “can,” “could,” “continue,” “estimate,” “expect,” “evaluate,” “forecast,” “guidance,” “intend,” “likely,” “may,” “might,” “objective,” “ongoing,” “outlook,” “plan,” “potential,” “predict,” “probable,” “project,” “seek,” “should,” “target” “view,” “will,” or “would,” or the negative thereof or other variations thereon or comparable terminology, although not all forward-looking statements contain these words. These statements reflect the Company’s reasonable judgment with respect to future events and are subject to risks, uncertainties and other factors, many of which have outcomes difficult to predict and may be outside our control, that could cause actual results or outcomes to differ materially from those in the forward-looking statements. Such risks and uncertainties include statements relating to the Company’s ability to successfully launch, commercialize, develop additional features and achieve market acceptance of its products and technologies and integrate its products and technologies with third-party platforms or technologies; the Company’s efforts and ability to drive the adoption of its products and technologies as a standard feature, including their use in homes, hotels, offices and cruise ships; the Company’s ability to capture market share; the Company’s estimates of its potential addressable market and demand for its products and technologies; the Company’s ability to raise additional capital to support its operations as needed, which may not be available on acceptable terms or at all; the Company’s ability to continue as a going concern; the Company’s ability to execute on any sales and licensing or other strategic opportunities; the possibility that any of the Company’s products will become National Electrical Code (NEC)-code or otherwise code mandatory in any jurisdiction, or that any of the Company’s current or future products or technologies will be adopted by any state, country, or municipality, within any specific timeframe or at all; risks arising from mergers, acquisitions, joint ventures and other collaborations; the Company’s ability to attract and retain key executives and qualified personnel; guidance provided by management, which may differ from the Company’s actual operating results; the potential impact of unstable market and economic conditions on the Company’s business, financial condition, and stock price; and other risks and uncertainties described in the Company’s filings with the Securities and Exchange Commission, including its periodic reports on Form 10-K and Form 10-Q. There can be no assurance as to any of the foregoing matters. Any forward-looking statement speaks only as of the date of this press release, and the Company undertakes no obligation to update or revise any forward-looking statements, whether as a result of new information, future events or otherwise, except as required by U.S. federal securities laws.
Recent Studies Support Diversified Vaccine Strategies, Aligning with GeoVax’s MVA-Based GEO-CM04S1 for Enhanced Protection, Particularly for Immunocompromised Populations
ATLANTA, GA, February 24, 2025 – GeoVax Labs, Inc. (Nasdaq: GOVX), a clinical-stage biotechnology company specializing in immunotherapies and vaccines, today reaffirms the critical role that mRNA vaccines have played in combating the COVID-19 pandemic and highlights the growing recognition of the need for complementary vaccine platforms, particularly for immunocompromised patients and those requiring broader, more durable immunity.
The rapid development and deployment of mRNA vaccines were pivotal in mitigating the initial impact of the pandemic, offering a timely and effective response. However, the scientific literature continues to underscore the importance of a diversified vaccine strategy directed towards enhanced durability and expanded protection against variants for populations that may not mount a sufficiently strong immune response to a single vaccine platform. GeoVax’s Modified Vaccinia Ankara (MVA)-based vaccine candidates, such as GEO-CM04S1 (COVID-19), may complement other existing vaccine platforms by addressing specific challenges.
Building a More Resilient Vaccine Landscape
Recent scholarly analyses, including research from leading experts(1) and a strategic review by the Biomedical Advanced Research and Development Authority (BARDA)(2), stress the importance of broadening vaccine portfolios beyond mRNA. These publications highlight areas where alternative vaccine platforms, such as viral-vector and live-attenuated vaccines, may provide advantages in durability, cellular immunity, and accessibility.
GeoVax’s MVA-based vaccines may offer an alternative approach, by utilizing a well-established vaccine vector, particularly in high-risk populations. Unlike current mRNA COVID-19 vaccines, GEO-CM04S1 expresses both the Spike (S) and Nucleocapsid (N) antigens, to elicit a broader immune response. This enhanced immunogenicity may be especially valuable for immunocompromised individuals, including transplant recipients and cancer patients, who often exhibit suboptimal responses to mRNA vaccines.
GeoVax’s MVA-based COVID-19 vaccine can serve as an important addition to the global immunization strategy by offering:
Enhanced Immune Response: The inclusion of both Spike and Nucleocapsid antigens in GEO-CM04S1 is intended to elicit a more comprehensive immune response, potentially reducing the need for frequent boosters.
Durability and Broader Variant Protection: Studies suggest measures of T-cell responses induced by GEO-CM04S1 elicit protection against emerging variants, minimizing the need for frequent reformulation.
Better Suitability for Immunocompromised Populations: Clinical trials demonstrate that GEO-CM04S1 elicits robust T-cell responses in patients unable to generate adequate antibody responses to conventional (spike-only) COVID-19 vaccines. This is critical for individuals with immune systems compromised by disease (eg cancers, genetic defects) or immunosuppressive therapies.
Scalability and Global Accessibility: GeoVax is further addressing vaccine availability with plans to transition manufacturing to a Next-Generation MVA manufacturing platform, with the potential for improved production efficiency and reduced costs, facilitating global distribution.
A Proven Technology with a Strong Safety Record
MVA was originally developed as a safer smallpox vaccine. MVA-based vaccines have been safely administered for decades. MVA’s extensive track record aligns with the U.S. Department of Health and Human Services’ (HHS) emphasis on vaccine safety, durability, and transparency. The well-documented safety and efficacy of MVA-based vaccines positions them as an important complement to existing mRNA-based approaches.
Government and Industry Support for Diversified Vaccine Strategies
Under BARDA’s $5 billion Project NextGen initiative, GeoVax was awarded a contract to conduct a 10,000-participant Phase 2b clinical trial evaluating an Omicron-updated version of GEO-CM04S1 in a comparison format against an approved mRNA COVID-19 vaccine. This study aims to validate the value of multi-antigen MVA-based COVID-19 vaccines in long-term pandemic preparedness and protection against future health threats.
Positioning for the Future of Vaccine Innovation
“The success of mRNA vaccines in responding to COVID-19 has been remarkable, but the evolving nature of infectious diseases calls for a diversified, complementary approach to immunization,” said David Dodd, Chairman & CEO of GeoVax. “Our MVA-based vaccines offer enhanced protection for those who need it most, including immunocompromised patients and populations requiring longer-lasting immunity. We are committed to advancing vaccine innovation in collaboration with public and private stakeholders.”
As the industry moves towards a more integrated and diversified vaccine ecosystem, GeoVax’s MVA-based vaccines should provide a scalable, durable, and globally accessible solution that enhances the existing landscape, ensuring broader protection for all populations.
References:
Plotkin, S. A., Robinson, J. M., Fitchett, J. R. A., & Gershburg, E. (2024). Vaccine development should be polytheistic, not monotheistic. Clinical Infectious Diseases, 79(6), 1518–1520. https://doi.org/10.1093/cid/ciae460
Parish, L. A., Rele, S., Hofmeyer, K. A., Luck, B. B., & Wolfe, D. N. (2025). Strategic and technical considerations in manufacturing viral vector vaccines for the Biomedical Advanced Research and Development Authority threats. Vaccines, 13(73). https://doi.org/10.3390/vaccines13010073
About GeoVax
GeoVax Labs, Inc. is a clinical-stage biotechnology company developing novel vaccines for many of the world’s most threatening infectious diseases and therapies for solid tumor cancers. The company’s lead clinical program is GEO-CM04S1, a next-generation COVID-19 vaccine for which GeoVax was recently awarded a BARDA-funded contract to sponsor a 10,000-participant Phase 2b clinical trial to evaluate the efficacy of GEO-CM04S1 versus an approved COVID-19 vaccine. In addition, GEO-CM04S1 is currently in three Phase 2 clinical trials, being evaluated as (1) a primary vaccine for immunocompromised patients such as those suffering from hematologic cancers and other patient populations for whom the current authorized COVID-19 vaccines are insufficient, (2) a booster vaccine in patients with chronic lymphocytic leukemia (CLL) and (3) a more robust, durable COVID-19 booster among healthy patients who previously received the mRNA vaccines. In oncology the lead clinical program is evaluating a novel oncolytic solid tumor gene-directed therapy, Gedeptin®, having recently completed a multicenter Phase 1/2 clinical trial for advanced head and neck cancers. A Phase 2 clinical trial in first recurrent head and neck cancer, evaluating Gedeptin® combined with an immune checkpoint inhibitor is planned. GeoVax has a strong IP portfolio in support of its technologies and product candidates, holding worldwide rights for its technologies and products. The Company has a leadership team who have driven significant value creation across multiple life science companies over the past several decades. For more information about the current status of our clinical trials and other updates, visit our website: www.geovax.com.
Forward-Looking Statements
This release contains forward-looking statements regarding GeoVax’s business plans. The words “believe,” “look forward to,” “may,” “estimate,” “continue,” “anticipate,” “intend,” “should,” “plan,” “could,” “target,” “potential,” “is likely,” “will,” “expect” and similar expressions, as they relate to us, are intended to identify forward-looking statements. We have based these forward-looking statements largely on our current expectations and projections about future events and financial trends that we believe may affect our financial condition, results of operations, business strategy and financial needs. Actual results may differ materially from those included in these statements due to a variety of factors, including whether: GeoVax is able to obtain acceptable results from ongoing or future clinical trials of its investigational products, GeoVax’s immuno-oncology products and preventative vaccines can provoke the desired responses, and those products or vaccines can be used effectively, GeoVax’s viral vector technology adequately amplifies immune responses to cancer antigens, GeoVax can develop and manufacture its immuno-oncology products and preventative vaccines with the desired characteristics in a timely manner, GeoVax’s immuno-oncology products and preventative vaccines will be safe for human use, GeoVax’s vaccines will effectively prevent targeted infections in humans, GeoVax’s immuno-oncology products and preventative vaccines will receive regulatory approvals necessary to be licensed and marketed, GeoVax raises required capital to complete development, there is development of competitive products that may be more effective or easier to use than GeoVax’s products, GeoVax will be able to enter into favorable manufacturing and distribution agreements, and other factors, over which GeoVax has no control.
Further information on our risk factors is contained in our periodic reports on Form 10-Q and Form 10-K that we have filed and will file with the SEC. Any forward-looking statement made by us herein speaks only as of the date on which it is made. Factors or events that could cause our actual results to differ may emerge from time to time, and it is not possible for us to predict all of them. We undertake no obligation to publicly update any forward-looking statement, whether as a result of new information, future developments or otherwise, except as may be required by law.
ATHENS, Greece, Feb. 24, 2025 (GLOBE NEWSWIRE) — EuroDry Ltd. (NASDAQ: EDRY, the “Company” or “EuroDry”), an owner and operator of drybulk vessels and provider of seaborne transportation for drybulk cargoes, announced today its results for the three and twelve-month periods ended December 31, 2024.
Fourth Quarter 2024 Highlights:
Total net revenues of $14.5 million.
Net loss attributable to controlling shareholders, of $3.3 million or $1.20 loss per share basic and diluted.
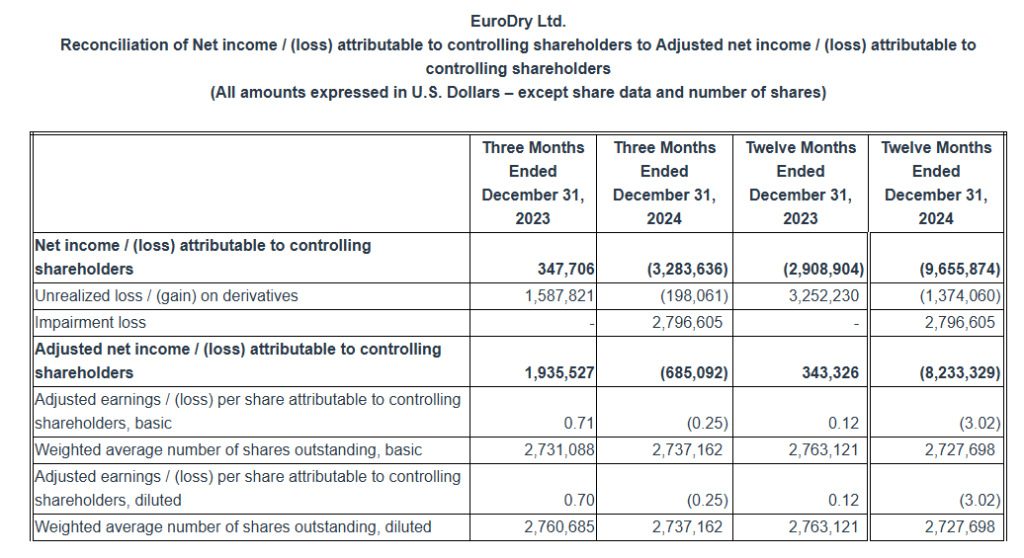
Adjusted net loss1 attributable to controlling shareholders, for the quarter of $0.7 million, or, $0.25 per share basic and diluted which excludes among other items an impairment charge of $2.8 million on one of our vessels.
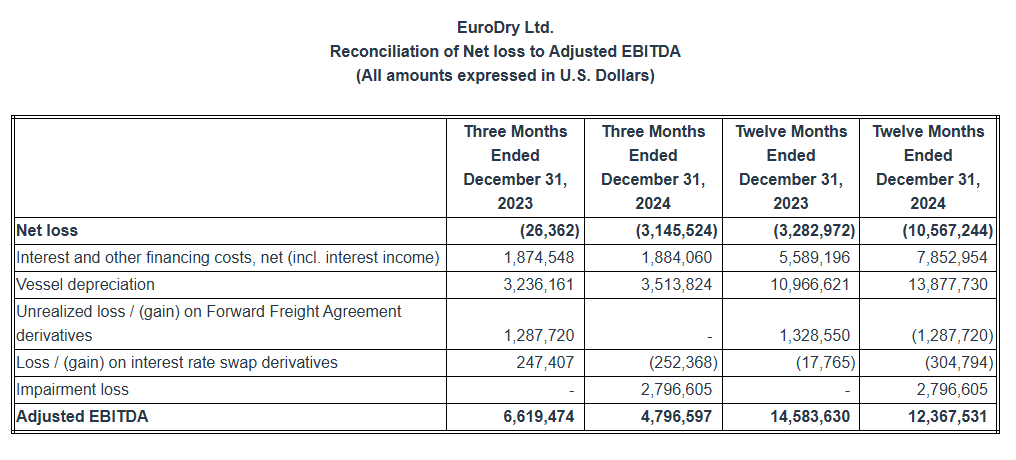
Adjusted EBITDA1 was $4.8 million.
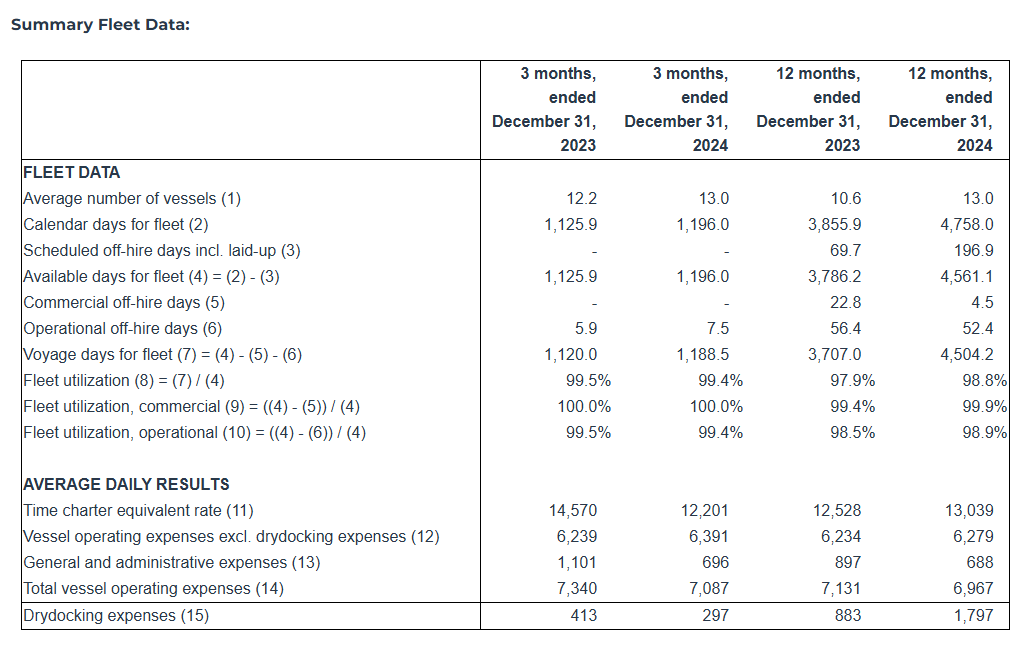
An average of 13.0 vessels were owned and operated during the fourth quarter of 2024 earning an average time charter equivalent rate of $12,201 per day.
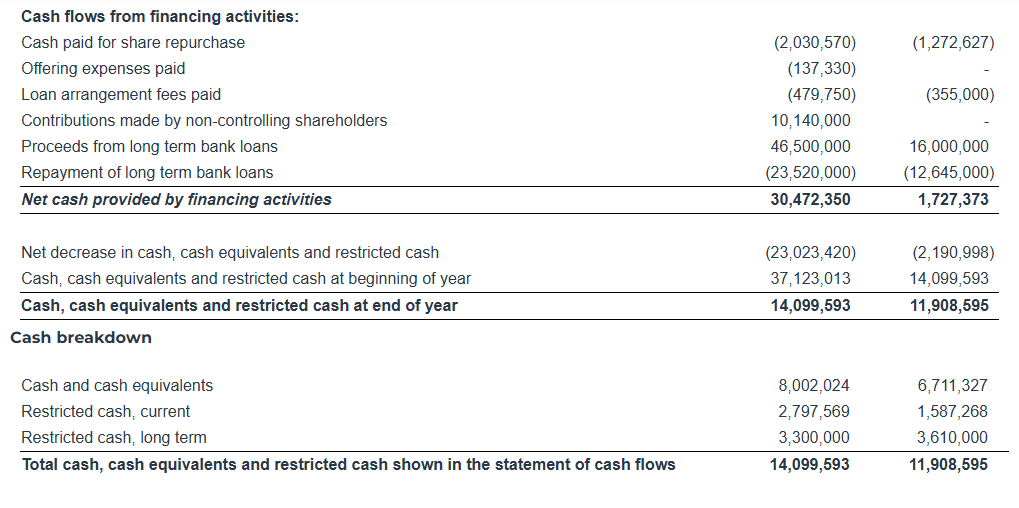
To date, about $5.3 million has been used to repurchase 334,674 shares of the Company, under our share repurchase plan of up to $10 million, announced in August 2022.
Recent developments:
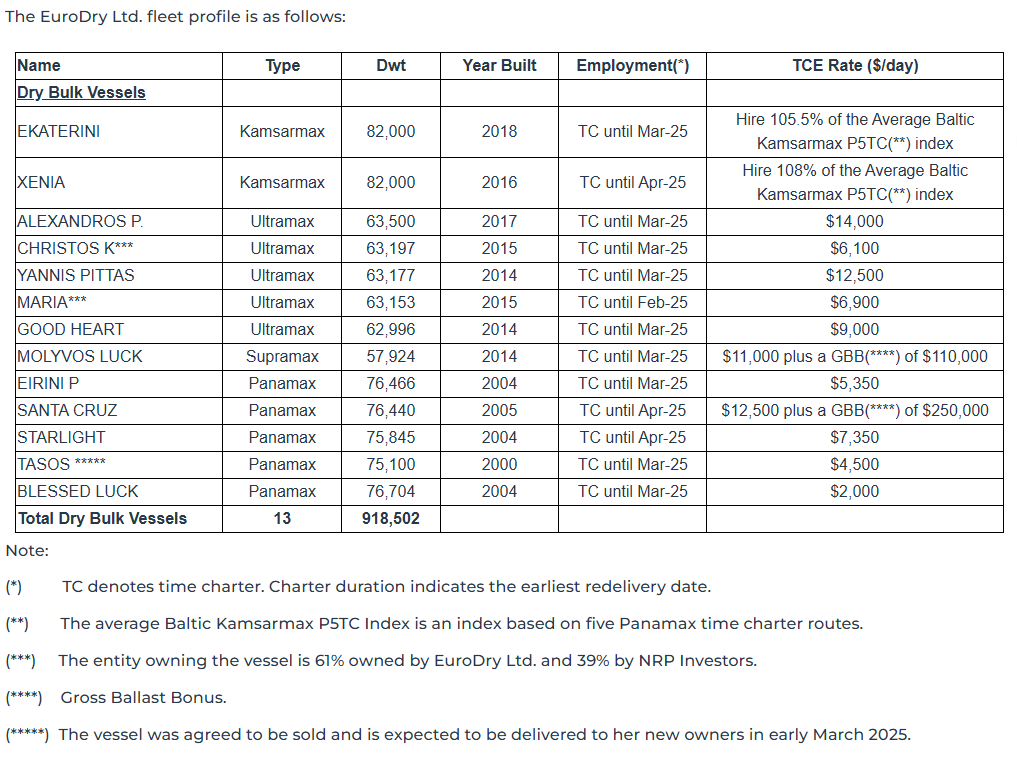
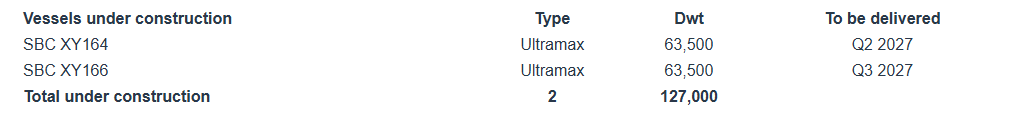
In November 2024, the Company signed two contracts with Nantong Xiangyu Shipbuilding for the construction of two 63,500 DWT ultramax bulk carriers. Both vessels are geared, eco, and are built to EEDI phase 3 design standard. The two newbuildings are scheduled to be delivered during the second and third quarters of 2027. The total consideration for the two newbuilding contracts is approximately $71.8 million and will be financed with a combination of debt and equity.
The Company on January 29, 2025, signed an agreement to sell M/V Tasos, a 75,100 dwt drybulk vessel, built in 2000, for demolition, for approximately $5 million. The vessel is expected to be delivered to its buyers, an unaffiliated third party, until early-March 2025, upon completion of her present charter. As a result of the vessel sale, we expect to record a gain of approximately $2.1million.
Full Year 2024 Highlights:
Total net revenues of $61.1 million.
Net loss attributable to controlling shareholders, of $9.7 million, or $3.54 loss per share basic and diluted.
Adjusted net loss1 attributable to controlling shareholders, for the period was $8.2 million or $3.02 adjusted loss per share basic and diluted.
Adjusted EBITDA1 was $12.4 million.
An average of 13.0 vessels were owned and operated during the twelve months of 2024 earning an average time charter equivalent rate of $13,039 per day.
Aristides Pittas, Chairman and CEO of EuroDry commented: “During the last couple of months of 2024 and during January and February of 2025, the drybulk market dropped to rates not seen since the early days of the COVID pandemic and touched decade-long lows last seen in 2016. It appears that a combination of low trade volumes due to low demand from China combined with a record low percentage of the fleet tied up in ports more than counterbalanced the low fleet growth during the period. There is some expectation, though, that the various stimuli packages released by the Chinese government during the fourth quarter of 2024 would start showing results in the near future; such stimuli combined with the typical seasonal recovery of the drybulk markets during the second quarter could lead to a noticeable recovery of the charter rates as already indicated by the forward (“FFA”) market.
“The low market of the fourth quarter was reflected in our results for the period although our vessels achieved better charters than market averages indicate. And while the low market of January and February 2025 will affect our first quarter results, we expect a recovery of the market in March and during the second quarter of 2025 to return us to profitability as our fleet is positioned to take full advantage of it having passed most drydockings in 2024. At the same time, as prices for vessels have also weakened, we are diligent in searching for potential investment opportunities; and to help finance such opportunities should they arise, we have committed to sell our eldest vessel M/V Tasos, as we recently announced.”
Tasos Aslidis, Chief Financial Officer of EuroDry commented: “In the fourth quarter of 2024 the Company operated an average of 13.0 vessels, versus 12.2 vessels during the same period last year. Our net revenues decreased to $14.5 million in the fourth quarter of 2024 compared to $15.9 million during the same period of last year. Our vessels earned in the fourth quarter of 2024 approximately 16.3% lower time charter equivalent rates compared to the corresponding period of 2023. At the same time, total daily vessel operating expenses, including management fees, general and administrative expenses but excluding drydocking costs, during the fourth quarter of 2024, averaged $7,087 per vessel per day, as compared to $7,340 for the same period of last year and $6,967 per vessel per day for the year 2024 as compared to $7,131 per vessel per day for the same period of 2023. The decreased total vessel operating expenses in the recent periods are attributable to the significantly lower daily general and administrative expenses. General and administrative expenses for the same period of 2023 included additional costs incurred in relation to the formation of a partnership with a number of investors represented by NRP Project Finance AS (“NRP Investors”) regarding the ownership of the entities owning M/V Christos K and M/V Maria (the “Partnership”).
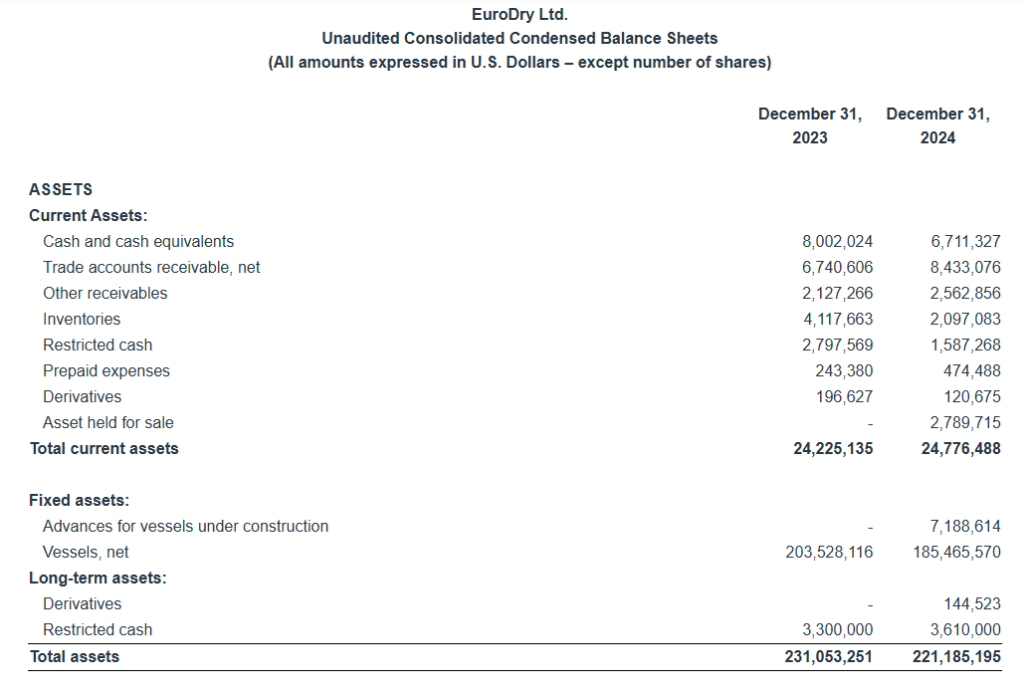
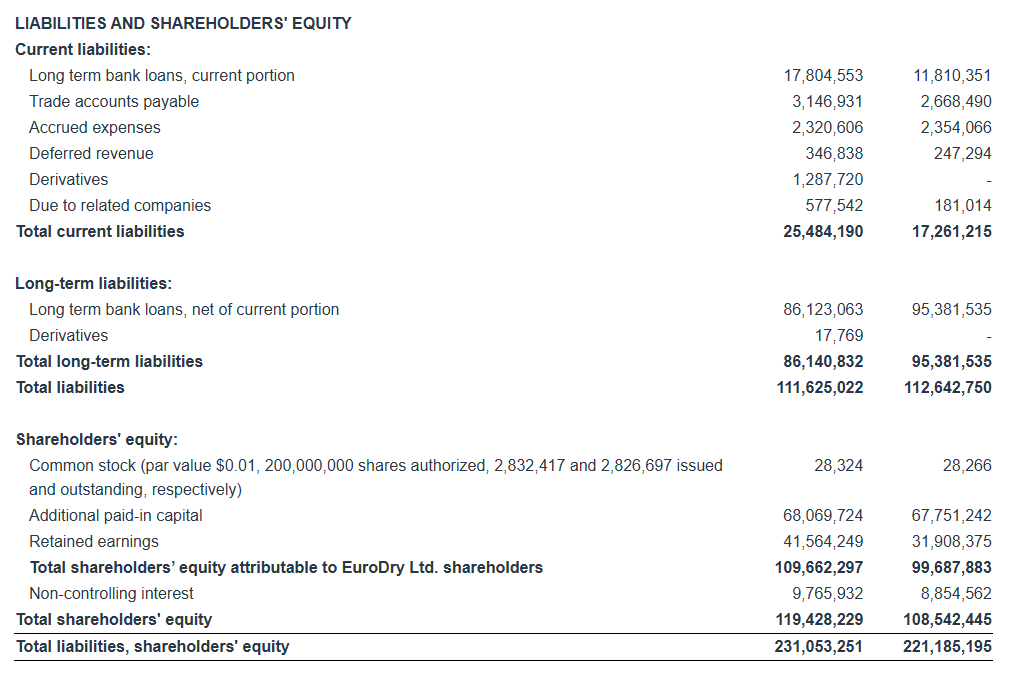
“Adjusted EBITDA during the fourth quarter of 2024 was $4.8 million versus $6.6 million in the fourth quarter of last year, and $12.4 million versus $14.6 million for the respective twelve-month periods of 2024 and 2023, respectively. As of December 31, 2024, our outstanding debt (excluding the unamortized loan fees) was $108.2 million versus unrestricted and restricted cash of $11.9 million. As of the same date, our scheduled debt repayments over the next 12 months amounted to about $12.1 million (excluding the unamortized loan fees).”
Fourth Quarter 2024 Results: For the fourth quarter of 2024, the Company reported total net revenues of $14.5 million representing a 8.8% decrease over total net revenues of $15.9 million during the fourth quarter of 2023. This was the result of the lower time charter rates our vessels earned in the fourth quarter of 2024, partly offset by the higher average number of vessels operated compared to the same period of 2023. On average, 13.0 vessels were owned and operated during the fourth quarter of 2024 earning an average time charter equivalent rate of $12,201 per day compared to 12.2 vessels in the same period of 2023 earning on average $14,570 per day.
For the fourth quarter of 2024, voyage expenses, net amounted to $0.9 million and mainly relate to vessels repositioning between charters and expenses during operational off-hire time. For the same period of 2023 voyage expenses net amounted to $0.6 million.
Vessel operating expenses were $6.6 million for the fourth quarter of 2024 as compared to $6.1 million for the same period of 2023. The increase is mainly attributable to the increased number of vessels operating in the fourth quarter of 2024 compared to the corresponding period in 2023.
Depreciation expense for the fourth quarter of 2024 amounted to $3.5 million, as compared to $3.2 million for the same period of 2023. This increase is again due to the higher number of vessels operating in the fourth quarter of 2024 as compared to the same period of 2023.
General and administrative expenses for the fourth quarter of 2024 were $0.8 million compared to $1.2 million of the fourth quarter of 2023. The decrease is mainly attributable to an additional cost of $0.44 million that was incurred during the last quarter of 2023 in relation to the formation of the Partnership.
Related party management fees for the fourth quarter of 2024 increased to $1.1 million from $1.0 million for the same period of 2023 as a result of an adjustment for inflation in the daily vessel management fee, effective from January 1, 2024, increasing the daily vessel management fee from 775 Euros to 810 Euros, as well as the increased number of vessels operating in the fourth quarter of 2024 compared to the corresponding period in 2023, partly offset by the favorable movement of the euro/dollar exchange rate.
During the fourth quarter of 2024 and 2023, none of our vessels underwent drydocking. The total cost for the fourth quarter of 2024 and 2023 of $0.4 million and $0.5 million, respectively, relates to drydocking expenses incurred in relation to upcoming drydockings.
In the fourth quarter of 2024 the Company recorded an impairment charge of $2.8 million. The impairment was booked to reduce the carrying amount of a drybulk vessel (M/V “Santa Cruz”) to its estimated market value, since based on the Company’s impairment test results it was determined that its carrying amount was not recoverable. No such cost existed in the fourth quarter of 2023.
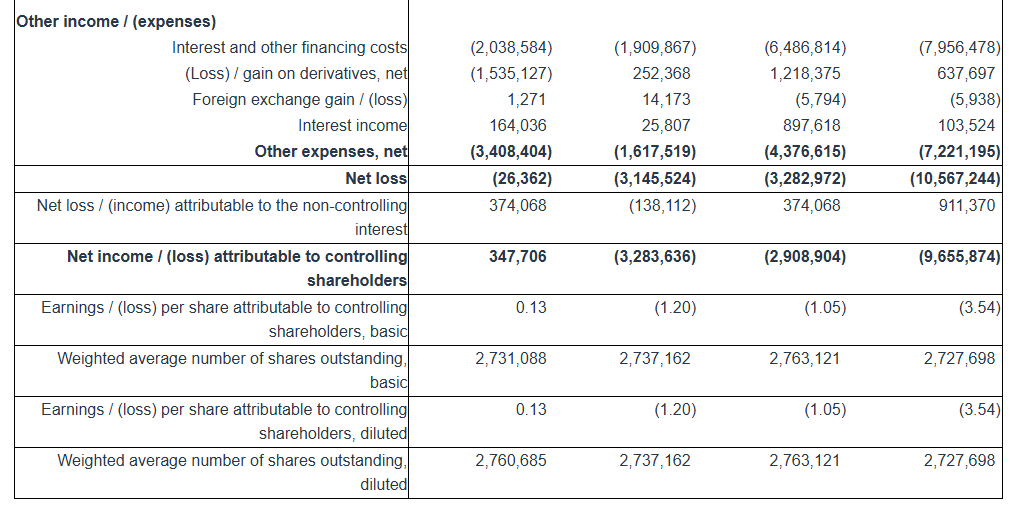
Interest and other financing costs for the fourth quarter of 2024 decreased to $1.9 million as compared to $2.0 million for the same period of 2023. Interest expense during the fourth quarter of 2024 was slightly lower mainly due to the slightly decreased benchmark rates of our loans, partly offset by the increased average debt during the period as compared to the same period of last year.
For the three months ended December 31, 2024, the Company recognized a gain on an interest rate swap of $0.25 million, as compared to a loss on an interest rate swap of $0.25 million and a loss on forward freight agreement (“FFA”) contracts of $1.3 million for the same period of 2023.
Interest income for the fourth quarter of 2024 amounted to $0.03 million compared to $0.16 million for the same period of 2023. The decrease in interest income is attributable to lower cash balances maintained during the fourth quarter of 2024 compared to the corresponding period in 2023.
The Company reported a net loss for the period of $3.1 million and a net loss attributable to controlling shareholders for the period of $3.3 million, as compared to a net loss of $0.03 million and a net income attributable to controlling shareholders of $0.3 million for the same period of 2023. The net income attributable to the non-controlling interest of $0.1 million in the fourth quarter of 2024 represents the income attributable to the 39% ownership of the Partnership.
Adjusted EBITDA for the fourth quarter of 2024 was $4.8 million compared to $6.6 million achieved during the fourth quarter of 2023.
Basic and diluted loss per share attributable to controlling shareholders for the fourth quarter of 2024 was $1.20 calculated on 2,737,162 basic and diluted weighted average number of shares outstanding, compared to earnings per share of $0.13, calculated on 2,731,088 basic and 2,760,685 diluted weighted average number of shares outstanding for the fourth quarter of 2023.
Excluding the effect on the net loss attributable to controlling shareholders for the quarter of the unrealized loss / (gain) on derivatives and the impairment loss on a vessel, the adjusted loss per share attributable to controlling shareholders for the quarter ended December 31, 2024 would have been $0.25 basic and diluted, compared to adjusted earnings of $0.71 and $0.70 per share basic and diluted, respectively, for the quarter ended December 31, 2023. Usually, security analysts do not include the above items in their published estimates of earnings per share.
Full Year 2024 Results: For the full year of 2024, the Company reported total net revenues of $61.1 million representing a 28.3% increase over total net revenues of $47.6 million during the twelve months of 2023, as a result of the increased number of vessels operated during the year and the slightly higher time charter equivalent rates earned by our vessels in the twelve months of 2024 compared to the same period of 2023. On average, 13.0 vessels were owned and operated during the twelve months of 2024 earning an average time charter equivalent rate of $13,039 per day compared to 10.6 vessels in the same period of 2023 earning on average $12,528 per day.
For the twelve months of 2024, voyage expenses, net, were $6.1 million and mainly relate to vessels repositioning between charters and expenses during operational off-hire time. For the same period of 2023, voyage expenses, net, were $4.0 million and mainly relate to expenses incurred by one of our vessels while employed under a voyage charter, vessels repositioning between charters and expenses during the detention of one of our vessels in Corpus Christi.
Vessel operating expenses were $25.7 million for the twelve months of 2024 as compared to $20.8 million for the same period of 2023. The increase is mainly attributable to the increased number of vessels operating in 2024 compared to the corresponding period in 2023.
Depreciation expense for the year 2024 was $13.9 million compared to $11.0 million during the same period of 2023, again, mainly due to the higher number of vessels operating in the same period.
Related party management fees for the year of 2024 were increased to $4.2 million from $3.3 million for the same period of 2023 as a result of an adjustment for inflation in the daily vessel management fee, effective from January 1, 2024, increasing the daily vessel management fee from 775 Euros to 810 Euros and the increased number of vessels operated.
General and administrative expenses during the twelve months of 2024 were $3.3 million compared to $3.5 million during the same period in 2023. The decrease is attributable to an additional cost of $0.44 million that was incurred during the last quarter of 2023 in relation to the formation of the Partnership, partly offset by the increased cost of our stock incentive plan in 2024.
During the twelve months of 2023, we recorded a provision of $0.5 million for anticipated costs related to the detention of one of our vessels in Corpus Christi presented as other operating loss.
In 2023, we wrote-off certain trade receivables by recording a bad debt expense of $0.1 million. In 2024, we had no bad debt expense.
In the twelve months of 2024, seven of our vessels completed their special survey with drydocking for a total cost of $8.5 million. In the twelve months of 2023, three of our vessels completed their special or intermediate survey with drydocking and one vessel passed her intermediate survey in water (in lieu of drydock), for a total cost of $3.4 million.
Interest and other financing costs for the twelve months of 2024 amounted to $8.0 million compared to $6.5 million for the same period of 2023. Interest expense for the twelve months of 2024 was higher due to the increased average debt as compared to the same period of last year.
For the twelve months ended December 31, 2024, the Company recognized a $0.1 million unrealized gain and a $0.2 million realized gain on one interest rate swap, as well as a 1.3 million unrealized gain and a $1.0 million realized loss on FFA contracts as compared to a $1.9 million unrealized loss and a $1.9 million realized gain on interest rate swaps, as well as a 1.3 million unrealized loss and a $2.5 million realized gain on FFA contracts for the same period of 2023.
Interest income for 2024 amounted to $0.1 million compared to $0.9 million interest income for the same period of 2023. The decrease of interest income is attributable to lower cash balances maintained during the twelve months of 2024 compared to the corresponding period in 2023.
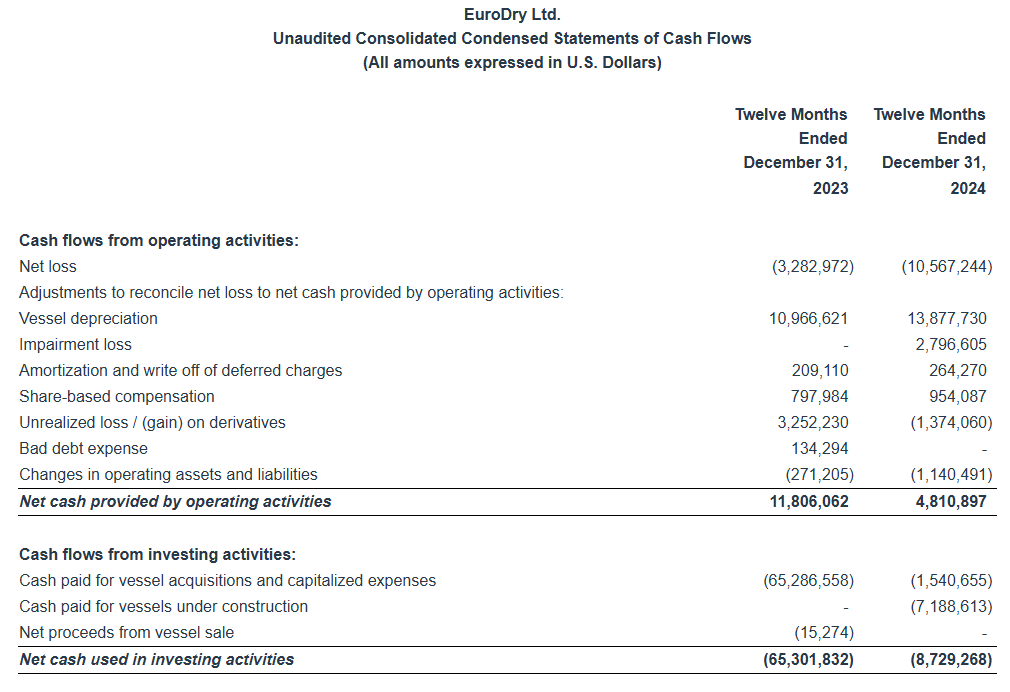
The Company reported a net loss for the period of $10.6 million and a net loss attributable to controlling shareholders of $9.7 million, as compared to a net loss of $3.3 million and a net loss attributable to controlling shareholders of $2.9 million, for the same period of 2023. The net loss attributable to the non-controlling interest of $0.9 million in 2024 represents the loss attributable to the 39% ownership of the Partnership.
Adjusted EBITDA for the twelve months of 2024 was $12.4 million compared to $14.6 million achieved during the twelve months of 2023.
Basic and diluted loss per share attributable to controlling shareholders for the twelve months of 2024 was $3.54, calculated on 2,727,698 basic and diluted weighted average number of shares outstanding, compared to basic and diluted loss per share attributable to controlling shareholders for the twelve months of 2023 of $1.05, calculated on 2,763,121 basic and diluted weighted average number of shares outstanding.
Excluding the effect on the net loss attributable to controlling shareholders for the year of the unrealized loss / (gain) on derivatives and the impairment loss on a vessel, the adjusted loss per share attributable to controlling shareholders for the year ended December 31, 2024 would have been $3.02 basic and diluted, compared to adjusted earnings per share of $0.12 basic and diluted for the same period of 2023. As previously mentioned, usually, security analysts do not include the above items in their published estimates of earnings per share.
(1) Average number of vessels is the number of vessels that constituted the Company’s fleet for the relevant period, as measured by the sum of the number of calendar days each vessel was a part of the Company’s fleet during the period divided by the number of calendar days in that period.
(2) Calendar days. We define calendar days as the total number of days in a period during which each vessel in our fleet was owned by us including off-hire days associated with major repairs, drydockings or special or intermediate surveys or days of vessels in lay-up. Calendar days are an indicator of the size of our fleet over a period and affect both the amount of revenues and the amount of expenses that we record during that period.
(3) The scheduled off-hire days including vessels laid-up are days associated with scheduled repairs, drydockings or special or intermediate surveys or days of vessels in lay-up.
(4) Available days. We define available days as the total number of Calendar days in a period net of scheduled off-hire days incl. laid up. We use available days to measure the number of days in a period during which vessels were available to generate revenues.
(5) Commercial off-hire days. We define commercial off-hire days as days a vessel is idle without employment.
(6) Operational off-hire days. We define operational off-hire days as days associated with unscheduled repairs or other off-hire time related to the operation of the vessels.
(7) Voyage days. We define voyage days as the total number of days in a period during which each vessel in our fleet was in our possession net of commercial and operational off-hire days. We use voyage days to measure the number of days in a period during which vessels actually generate revenues or are sailing for repositioning purposes.
(8) Fleet utilization. We calculate fleet utilization by dividing the number of our voyage days during a period by the number of our available days during that period. We use fleet utilization to measure a company’s efficiency in finding suitable employment for its vessels and minimizing the amount of days that its vessels are off-hire for reasons such as unscheduled repairs or days waiting to find employment.
(9) Fleet utilization, commercial. We calculate commercial fleet utilization by dividing our available days net of commercial off-hire days during a period by our available days during that period.
(10) Fleet utilization, operational. We calculate operational fleet utilization by dividing our available days net of operational off-hire days during a period by our available days during that period.
(11) Time charter equivalent rate, or TCE, is a measure of the average daily net revenue performance of our vessels. Our method of calculating TCE is determined by dividing time charter revenue and voyage charter revenue net of voyage expenses by voyage days for the relevant time period. Voyage expenses primarily consist of port, canal and fuel costs that are unique to a particular voyage, which would otherwise be paid by the charterer under a time charter contract, or are related to repositioning the vessel for the next charter. TCE provides additional meaningful information in conjunction with time charter revenue and voyage charter revenue, the most directly comparable GAAP measure, because it assists our management in making decisions regarding the deployment and use of our vessels and because we believe that it provides useful information to investors regarding our financial performance. TCE is a standard shipping industry performance measure used primarily to compare period-to-period changes in a shipping company’s performance despite changes in the mix of charter types (i.e., spot voyage charters, time charters, pool agreements and bareboat charters) under which the vessels may be employed between the periods. Our definition of TCE may not be comparable to that used by other companies in the shipping industry.
(12) We calculate daily vessel operating expenses, which include crew costs, provisions, deck and engine stores, lubricating oil, insurance, maintenance and repairs and related party management fees by dividing vessel operating expenses and related party management fees by fleet calendar days for the relevant time period. Drydocking expenses are reported separately.
(13) Daily general and administrative expenses are calculated by us by dividing general and administrative expenses by fleet calendar days for the relevant time period.
(14) Total vessel operating expenses, or TVOE, is a measure of our total expenses associated with operating our vessels. We compute TVOE as the sum of vessel operating expenses, related party management fees and general and administrative expenses; drydocking expenses are not included. Daily TVOE is calculated by dividing TVOE by fleet calendar days for the relevant time period.
(15) Daily drydocking expenses are calculated by us by dividing drydocking expenses by the fleet calendar days for the relevant period. Drydocking expenses include expenses during drydockings that would have been capitalized and amortized under the deferral method. Drydocking expenses could vary substantially from period to period depending on how many vessels underwent drydocking during the period. The Company expenses drydocking expenses as incurred.
Conference Call and Webcast: Today, February 24, 2025 at 9:00 a.m. Eastern Time, the Company’s management will host a conference call and webcast to discuss the results.
Conference Call details: Participants should dial into the call 10 minutes before the scheduled time using the following numbers: 877 405 1226 (US Toll-Free Dial In) or +1 201 689 7823 (US and Standard International Dial In). Please quote “EuroDry” to the operator and/or conference ID 13751962. Click here for additional participant International Toll -Free access numbers.
Alternatively, participants can register for the call using the call me option for a faster connection to join the conference call. You can enter your phone number and let the system call you right away. Click here for the call me option.
Audio webcast – Slides Presentation: There will be a live and then archived webcast of the conference call and accompanying slides, available on the Company’s website. To listen to the archived audio file, visit our website http://www.eurodry.gr and click on Company Presentations under our Investor Relations page. Participants to the live webcast should register on the website approximately 10 minutes prior to the start of the webcast.
The slide presentation for the fourth quarter ended December 31, 2024, will also be available in PDF format 10 minutes prior to the conference call and webcast, accessible on the company’s website (www.eurodry.gr) on the webcast page. Participants to the webcast can download the PDF presentation.
Adjusted EBITDA Reconciliation: EuroDry Ltd. considers Adjusted EBITDA to represent net loss before interest and other financing costs, income taxes, depreciation, unrealized loss / (gain) on Forward Freight Agreement derivatives (“FFAs”), loss / (gain) on interest rate swap derivatives and impairment loss. Adjusted EBITDA does not represent and should not be considered as an alternative to net loss, as determined by United States generally accepted accounting principles, or GAAP. Adjusted EBITDA is included herein because it is a basis upon which the Company assesses its financial performance because the Company believes that this non-GAAP financial measure assists our management and investors by increasing the comparability of our performance from period to period by excluding the potentially disparate effects between periods of, financial costs, unrealized loss / (gain) on FFAs, loss / (gain) on interest rate swap derivatives, depreciation and impairment loss. The Company’s definition of Adjusted EBITDA may not be the same as that used by other companies in the shipping or other industries.
Adjusted net income / (loss) attributable to controlling shareholders and Adjusted earnings / (loss) per share attributable to controlling shareholders Reconciliation:
EuroDry Ltd. considers Adjusted net income / (loss) attributable to controlling shareholders, to represent net income / (loss) before unrealized loss / (gain) on derivatives, which includes FFAs and interest rate swaps, and impairment loss. Adjusted net income / (loss) attributable to controlling shareholders and Adjusted earnings / (loss) per share attributable to common shareholders are included herein because we believe they assist our management and investors by increasing the comparability of the Company’s fundamental performance from period to period by excluding the potentially disparate effects between periods of the aforementioned items , which may significantly affect results of operations between periods. Adjusted net income / (loss) attributable to controlling shareholders and Adjusted earnings / (loss) per share attributable to common shareholders do not represent and should not be considered as an alternative to net income / (loss) attributable to controlling shareholders or earnings / (loss) per share attributable to common shareholders, as determined by GAAP. The Company’s definition of Adjusted net income / (loss) attributable to controlling shareholders and Adjusted earnings / (loss) per share attributable to common shareholders may not be the same as that used by other companies in the shipping or other industries. Adjusted net income / (loss) attributable to controlling shareholders and Adjusted earnings / (loss) per share attributable to common shareholders are not adjusted for all non-cash income and expense items that are reflected in our statement of cash flows.
About EuroDry Ltd. EuroDry Ltd. was formed on January 8, 2018 under the laws of the Republic of the Marshall Islands to consolidate the drybulk fleet of Euroseas Ltd into a separate listed public company. EuroDry was spun-off from Euroseas Ltd on May 30, 2018; it trades on the NASDAQ Capital Market under the ticker EDRY.
EuroDry operates in the dry cargo, drybulk shipping market. EuroDry’s operations are managed by Eurobulk Ltd., an ISO 9001:2008 and ISO 14001:2004 certified affiliated ship management company and Eurobulk (Far East) Ltd. Inc., which are responsible for the day-to-day commercial and technical management and operations of the vessels. EuroDry employs its vessels on spot and period charters and under pool agreements.
The Company has a fleet of 13 vessels, including 5 Panamax drybulk carriers, 5 Ultramax drybulk carriers, 2 Kamsarmax drybulk carriers and 1 Supramax drybulk carrier. EuroDry’s 13 drybulk carriers have a total cargo capacity of 918,502 dwt. After the delivery of two Ultramax vessels in 2027 and the completion of the sale of one Panamax vessel, the Company’s fleet will consist of 14 vessels with a total carrying capacity of 970,402 dwt.
Forward Looking Statement This press release contains forward-looking statements (as defined in Section 27A of the Securities Act of 1933, as amended, and Section 21E of the Securities Exchange Act of 1934, as amended) concerning future events and the Company’s growth strategy and measures to implement such strategy; including expected vessel acquisitions and entering into further time charters. Words such as “expects,” “intends,” “plans,” “believes,” “anticipates,” “hopes,” “estimates,” and variations of such words and similar expressions are intended to identify forward-looking statements. Although the Company believes that the expectations reflected in such forward-looking statements are reasonable, no assurance can be given that such expectations will prove to have been correct. These statements involve known and unknown risks and are based upon a number of assumptions and estimates that are inherently subject to significant uncertainties and contingencies, many of which are beyond the control of the Company. Actual results may differ materially from those expressed or implied by such forward-looking statements. Factors that could cause actual results to differ materially include, but are not limited to changes in the demand for dry bulk vessels, competitive factors in the market in which the Company operates; risks associated with operations outside the United States; and other factors listed from time to time in the Company’s filings with the Securities and Exchange Commission. The Company expressly disclaims any obligations or undertaking to release publicly any updates or revisions to any forward-looking statements contained herein to reflect any change in the Company’s expectations with respect thereto or any change in events, conditions or circumstances on which any statement is based.
Nicolas Bornozis Markella Kara Capital Link, Inc. 230 Park Avenue, Suite 1540 New York, NY10169 Tel. (212) 661-7566 E-mail: eurodry@capitallink.com
__________________ 1Adjusted EBITDA, Adjusted net income / (loss) attributable to controlling shareholders and Adjusted earnings / (loss) per share are not recognized measurements under US GAAP (GAAP) and should not be used in isolation or as a substitute for EuroDry’s financial results presented in accordance with GAAP. Refer to a subsequent section of the Press Release for the definitions and reconciliation of these measurements to the most directly comparable financial measures calculated and presented in accordance with GAAP.
Key Points: – Hackers stole $1.5 billion from Bybit, marking the largest crypto exchange hack in history. – The Lazarus Group, a North Korean state-backed hacking collective, has been linked to the attack. – Bybit secured a bridge loan to cover losses and reassure customers, but market confidence remains shaken.
A catastrophic security breach has sent shockwaves through the cryptocurrency sector as Bybit, one of the world’s leading digital asset exchanges, lost $1.5 billion in a sophisticated attack. This unprecedented theft surpasses previous major incidents, including the 2021 Poly Network breach ($610 million) and the 2022 Binance exploit ($570 million). Most alarming to security experts is that attackers successfully compromised Bybit’s cold storage system—offline wallets widely considered the most secure method for safeguarding digital assets.
Attack Details and Attribution
Blockchain analytics firms Elliptic and Arkham Intelligence have tracked the stolen funds across multiple blockchain networks as attackers rapidly dispersed and liquidated assets through various platforms. Investigators have attributed the attack to North Korea’s Lazarus Group, a state-sponsored cybercrime collective responsible for stealing billions from financial institutions and cryptocurrency organizations to fund government operations.
The associated addresses have been flagged across all major blockchain monitoring systems. However, the Lazarus Group’s sophisticated laundering techniques utilizing decentralized protocols and mixing services make complete fund recovery highly challenging.
Market Impact and Bybit’s Response
The security breach triggered immediate mass withdrawals from Bybit as users feared potential insolvency risks. CEO Ben Zhou moved quickly to stabilize the situation, assuring users that all withdrawals would continue to process normally. The exchange secured emergency funding from strategic partners to cover potential losses.
Despite these assurances, investor confidence has been severely impacted. Many institutional and retail traders are reassessing their exposure to centralized exchanges, with increasing interest in self-custody solutions and decentralized finance alternatives that minimize counterparty risk.
The incident has attracted heightened regulatory attention, with financial authorities in multiple jurisdictions signaling intentions to impose stricter security requirements and oversight on cryptocurrency exchanges. Industry analysis projects this could accelerate adoption of decentralized exchanges (DEXs), which operate without central custodians and provide users direct control over their assets.
Ethereum Market Dynamics
In an unexpected development, Ethereum markets showed remarkable resilience following the hack. On-chain data revealed significant ETH purchases from Bybit’s treasury addresses, fueling speculation about strategic accumulation during market uncertainty. This activity aligns with institutional behavior from traditional finance giants like BlackRock and Fidelity, which have steadily increased Ethereum holdings throughout recent market cycles.
Layer-2 scaling networks built on Ethereum—including Arbitrum, Optimism, and Celestia—have maintained strong adoption metrics despite the broader market turbulence, suggesting investor confidence in Ethereum’s ecosystem remains intact despite security concerns at centralized exchanges.
Future Security Implications
The Bybit breach represents a watershed moment for cryptocurrency security practices. The successful compromise of cold storage systems—previously considered nearly impenetrable—forces a fundamental reassessment of digital asset protection strategies across the industry.
Expanded implementation of multi-signature authentication requirements, real-time anomaly detection systems, and insurance solutions designed specifically for cryptocurrency theft are becoming industry priorities. Several leading exchanges have already announced enhanced security measures in response to the incident.
Traditional cold storage alone is no longer sufficient protection against sophisticated threat actors. The industry must evolve toward comprehensive security frameworks that combine technical controls with governance safeguards.
As regulatory frameworks evolve and security standards mature, investors should anticipate a period of adjustment across cryptocurrency markets. Whether this incident ultimately drives adoption toward decentralized platforms or strengthens security at centralized exchanges, the fundamental importance of robust security practices has never been more evident in digital asset investing.
February 24, 2025 – Vancouver, Canada – Century Lithium Corp. (TSXV:LCE) (OTCQX: CYDVF) (Frankfurt: C1Z) (“Century Lithium” or “the Company”) is pleased to announce that the Company has completed its initial internal, non-independent review, optimization work, and studies (“Optimization Study”) related to the estimated capital (“CAPEX”) described in the NI 43-101 Technical Report on the Feasibility Study of the Clayton Valley Lithium Project (now known as Angel Island), Nevada, USA, dated April 29, 2024 (“Feasibility Study”). The Optimization Study identified potential cost reductions of up to 25% of CAPEX on its initial Phase 1 CAPEX of $1.581 billion.
Optimization Study highlights leading to the CAPEX reductions:
Reduced capital costs through changes in flow sheet, equipment selection and updated vendor quotes in the processing areas of filtration, Direct Lithium Extraction (“DLE”) and the chlor-alkali plant
Internal evaluation of the estimated engineering and construction plans to identify areas of overlap and locations within the plan where modifications of site facilities and elimination of redundancies and inefficiencies can streamline the process from mining to the planned on-site production of battery-grade lithium carbonate (“Li2CO3”)
Reductions in the estimated cost for on-site services resulting from the changes in processing
Reduction in estimated indirect costs for contingency and EPCM calculated in the Feasibility Study as a percentage of direct costs as a result of the cost reductions set out above
“We are very pleased with the outcome of the Optimization Study. These results, if confirmed by an updated Feasibility Study, will have a significant impact on the economics of Angel Island,” said Century Lithium President and CEO, Bill Willoughby. “The Company is also in the process of outlining new initiatives at Angel Island that will further unlock value for our shareholders and place Angel Island in the forefront of lithium resources under development in North America.”
“Lithium remains critical for Western independence in its energy transformation, underpinning the long-term fundamentals of the industry despite current depressed prices. We believe that with these improved economics and its advanced stage of development Angel Island has now become a key asset in the broader United States’ lithium strategy.”
Century Lithium will initiate work on an Updated Feasibility Study for Angel Island to confirm the results of the Optimization Study to the required level. Century Lithium believes that the optimizations to Angel Island’s mine plan and processing, and the sale of surplus sodium hydroxide generated in the production process, will lead to competitive estimated capital and operating costs.
Qualified Person
Todd Fayram, MMSA-QP and Senior Vice President, Metallurgy of Century Lithium is the qualified person as defined by National Instrument 43-101 and has approved the technical information in this release.
ABOUT CENTURY LITHIUM CORP.
Century Lithium Corp. is an advanced stage lithium company, focused on developing its wholly owned Angel Island project in Esmeralda County, Nevada, which hosts one of the largest sedimentary lithium deposits in the United States. The Company has utilized its patent-pending process for chloride leaching combined with Direct Lithium Extraction to make battery-grade lithium carbonate product samples from Angel Island’s lithium-bearing claystone on-site at its Demonstration Plant in Amargosa Valley, Nevada.
Angel Island is one of the few advanced lithium projects in development in the United States to provide an end-to-end process to produce battery-grade lithium carbonate for the growing electric vehicle and battery storage market. Angel Island is currently in the permitting stage for a three-phase feasibility-level production plan expected to yield an estimated life-of-mine average of 34,000 tonnes per year of lithium carbonate over a 40-year mine-life, with one of the lowest estimated operating costs for lithium projects in North America.
Century Lithium trades on both the TSX Venture Exchange under the symbol “LCE” and the OTCQX under the symbol “CYDVF”; and on the Frankfurt Stock Exchange under the symbol “C1Z”.
NEITHER THE TSX VENTURE EXCHANGE NOR ITS REGULATION SERVICES PROVIDER ACCEPTS RESPONSIBILITY FOR THE ADEQUACY OR ACCURACY OF THE CONTENT OF THIS NEWS RELEASE.
This release contains certain forward-looking statements within the meaning of applicable Canadian securities legislation. In certain cases, forward-looking statements can be identified by the use of words such as “plans”, “expects” or “does not anticipate”, or “believes”, or variations of such words and phrases or statements that certain actions, events or results “may”, “could”, “would”, “might” or “will be taken”, “occur” or “be achieved” and similar expressions suggesting future outcomes or statements regarding an outlook.
Forward-looking statements relate to any matters that are not historical facts and statements of our beliefs, intentions and expectations about developments, results and events which will or may occur in the future, without limitation, statements with respect to the potential development and value of the Project and benefits associated therewith, statements with respect to the expected project economics for the Project, such as estimates of life of mine, lithium prices, production and recoveries, capital and operating costs, IRR, NPV and cash flows, any projections outlined in the Feasibility Study in respect of the Project, the permitting status of the Project and the Company’s future development plans.
These and other forward-looking statements and information are subject to various known and unknown risks and uncertainties, many of which are beyond the ability of the Company to control or predict, that may cause their actual results, performance or achievements to be materially different from those expressed or implied thereby, and are developed based on assumptions about such risks, uncertainties and other factors set out herein.These risks include those described under the heading “Risk Factors” in the Company’s most recent annual information form and its other public filings, copies of which can be under the Company’s profile at www.sedarplus.com. The Company expressly disclaims any obligation to update-forward-looking information except as required by applicable law. No forward-looking statement can be guaranteed, and actual future results may vary materially. Accordingly, readers are advised not to place reliance on forward-looking statements or information. Furthermore, Mineral Resources that are not Mineral Reserves do not have demonstrated economic viability.
Michael Kupinski, Director of Research, Equity Research Analyst, Digital, Media & Technology , Noble Capital Markets, Inc.
Jacob Mutchler, Research Associate, Noble Capital Markets, Inc.
Refer to the full report for the price target, fundamental analysis, and rating.
Special dividend. On Friday, February 21, the company announced that its board of directors approved a nonrecurring special cash dividend of $3.31 per share. The sizeable cash dividend, payable on March 11 to shareholders of record on March 3, represented a yield of roughly 20% at the time of announcement. Furthermore, the cash dividend totals roughly $60 million and will be funded entirely through the company’s healthy cash position.
Delivering value. In our view, the special cash dividend is illustrative of the Board of Directors’ confidence in the company’s long-term outlook, strong financial position, and commitment to deliver value to shareholders. Notably, we believe the company will be able to pay out the sizeable dividend without compromising its strategic growth initiatives in player retention and quality of gameplay.
Equity Research is available at no cost to Registered users of Channelchek. Not a Member? Click ‘Join’ to join the Channelchek Community. There is no cost to register, and we never collect credit card information.
This Company Sponsored Research is provided by Noble Capital Markets, Inc., a FINRA and S.E.C. registered broker-dealer (B/D).
*Analyst certification and important disclosures included in the full report. NOTE: investment decisions should not be based upon the content of this research summary. Proper due diligence is required before making any investment decision.
Codere Online refers, collectively, to Codere Online Luxembourg, S.A. and its subsidiaries. Codere Online launched in 2014 as part of the renowned casino operator Codere Group. Codere Online offers online sports betting and online casino through its state-of-the art website and mobile application. Codere currently operates in its core markets of Spain, Italy, Mexico, Colombia, Panama and the City of Buenos Aires (Argentina). Codere Online’s online business is complemented by Codere Group’s physical presence throughout Latin America, forming the foundation of the leading omnichannel gaming and casino presence in the region.
Michael Kupinski, Director of Research, Equity Research Analyst, Digital, Media & Technology , Noble Capital Markets, Inc.
Jacob Mutchler, Research Associate, Noble Capital Markets, Inc.
Refer to the full report for the price target, fundamental analysis, and rating.
Currency exchange impact. Q4 revenue of €52.6 million was roughly in line with our estimate of €55.0 million in spite of currency headwinds. Adj. EBITDA of €1.9 million was better than our estimate of €1.5 million. Notably, revenues would have been stronger if not for the depreciation of the Mexican Peso, down roughly 13.5% against the Euro. On a constant currency basis, revenue was up a strong 15% compared to reported growth of 5%.
Significant market opportunity. There appears to be a very large market opportunity for the company in Latin America, with Latin American markets expected to grow a strong 33% plus Compound Annual Revenue Growth Rate. In our view, the company likely will take a disciplined approach to entering new markets by seeking partners. We believe that such a strategy could allow the company to accelerate revenue growth while allowing adj. EBITDA growth.
Equity Research is available at no cost to Registered users of Channelchek. Not a Member? Click ‘Join’ to join the Channelchek Community. There is no cost to register, and we never collect credit card information.
This Company Sponsored Research is provided by Noble Capital Markets, Inc., a FINRA and S.E.C. registered broker-dealer (B/D).
*Analyst certification and important disclosures included in the full report. NOTE: investment decisions should not be based upon the content of this research summary. Proper due diligence is required before making any investment decision.
ACCO Brands Corporation is one of the world’s largest designers, marketers and manufacturers of branded academic, consumer and business products. Our widely recognized brands include AT-A-GLANCE®, Esselte®, Five Star®, GBC®, Kensington®, Leitz®, Mead®, PowerA®, Quartet®, Rapid®, Rexel®, Swingline®, Tilibra®, and many others. Our products are sold in more than 100 countries around the world. More information about ACCO Brands, the Home of Great Brands Built by Great People, can be found at www.accobrands.com.
Joe Gomes, CFA, Managing Director, Equity Research Analyst, Generalist , Noble Capital Markets, Inc.
Joshua Zoepfel, Research Associate, Noble Capital Markets, Inc.
Refer to the full report for the price target, fundamental analysis, and rating.
An Overreaction. ACCO shares fell over 17% Friday, hitting a new 52-week low, on 4.5x normal daily volume. We believe the move to be misguided and not reflective of ongoing opportunities for the Company. We would reiterate, excluding unexpectedly negative forex, that ACCO’s 4Q24 results were in line with expectations.
Go Forward. While the operating environment remains challenging, there are green shoots of opportunity for the Company, such as the renewed back to office movement. Management is placing a primary focus on improving sales trends through a number of efforts, which, when combined with cost reduction efforts, places ACCO in position to generate substantial returns once the top line improves.
Equity Research is available at no cost to Registered users of Channelchek. Not a Member? Click ‘Join’ to join the Channelchek Community. There is no cost to register, and we never collect credit card information.
This Company Sponsored Research is provided by Noble Capital Markets, Inc., a FINRA and S.E.C. registered broker-dealer (B/D).
*Analyst certification and important disclosures included in the full report. NOTE: investment decisions should not be based upon the content of this research summary. Proper due diligence is required before making any investment decision.
Key Points: – $500B U.S. investment includes Houston AI server factory opening 2026. – 20,000 new jobs focused on R&D, engineering, and AI development. – Announcement follows Trump meeting amid renewed
Apple has unveiled ambitious plans to inject $500 billion into the U.S. economy over the next four years, with a significant focus on artificial intelligence infrastructure. The technology giant announced Monday that it will partner with manufacturers to build a 250,000-square-foot AI server facility in Houston, Texas, dedicated to producing hardware for Apple Intelligence, the company’s AI personal assistant that powers iPhones, iPads, and Mac computers.
This massive investment comes at a pivotal moment for Apple as it navigates growing tensions between the U.S. and China. The announcement follows a recent meeting between Apple CEO Tim Cook and President Donald Trump, who has reintroduced tariffs on Chinese imports. With Apple historically dependent on Chinese manufacturing for its devices, this U.S.-focused investment signals a strategic pivot in its production approach.
“We are bullish on the future of American innovation, and we’re proud to build on our long-standing U.S. investments with this $500 billion commitment to our country’s future,” said Apple CEO Tim Cook in the announcement.
The Houston facility, expected to begin operations in 2026, represents just one component of Apple’s comprehensive investment strategy. The company plans to hire approximately 20,000 new employees across the United States, with positions concentrated in research and development, silicon engineering, software development, and artificial intelligence.
Apple’s investment will extend beyond direct manufacturing to include doubling its U.S. Advanced Manufacturing Fund to $10 billion, establishing a new manufacturing academy in Michigan, and expanding R&D investments in cutting-edge fields like silicon engineering. The company also emphasized its content production for Apple TV+, which currently spans 20 states.
This investment announcement arrives as Apple accelerates its push into artificial intelligence with Apple Intelligence, its AI assistant unveiled earlier this year. The Texas server facility suggests Apple is building infrastructure to support more advanced AI capabilities while keeping sensitive data processing within U.S. borders—a growing concern for tech companies handling vast amounts of user information.
Apple highlighted its substantial economic contribution to the United States, noting it has paid more than $75 billion in U.S. taxes over the past five years, including $19 billion in 2024 alone, positioning itself as one of the nation’s largest corporate taxpayers.
The investment plan represents Apple’s response to mounting pressure from the Trump administration regarding U.S. manufacturing. Earlier this month, President Trump signed an order imposing additional 10% tariffs on Chinese goods, supplementing existing tariffs of up to 25% established during his first term. These trade policies have created significant challenges for companies like Apple that rely heavily on global supply chains centered in Asia.
By committing to this historic U.S. investment, Apple appears to be strategically addressing political pressures while simultaneously building the infrastructure needed to support its AI-driven future. The company’s decision to focus on AI server manufacturing also indicates its long-term commitment to developing proprietary AI solutions rather than solely relying on third-party providers like Google or OpenAI.
Industry analysts view this investment as a significant move that could inspire other tech giants to increase their U.S. manufacturing presence. The Houston facility in particular represents a strategic choice, capitalizing on Texas’s growing reputation as a technology hub outside of traditional centers like California and New York.
As competition in AI technology intensifies among major tech companies, Apple’s substantial investment in domestic AI infrastructure suggests the company is positioning itself for a future where AI capabilities become an increasingly critical differentiator in consumer technology products.
Key Points: – The Dow fell 805 points, with a two-day loss exceeding 1,200 points, while the S&P 500 and Nasdaq also declined. – Economic data signaled weaker consumer sentiment, a slowing housing market, and increased inflation concerns. – Investors moved toward safer assets, boosting bonds and defensive stocks, while major indexes fell below key technical levels.
Stocks sold off on Friday as new U.S. economic data raised investor concerns over slowing growth and persistent inflation. The Dow Jones Industrial Average tumbled 805 points, or 1.8%, bringing its two-day losses to more than 1,200 points. The S&P 500 fell 1.6%, while the Nasdaq Composite dropped over 2% as investors moved away from equities in search of safer assets.
United Health led the Dow’s decline, plunging 7% following a Wall Street Journal report that the insurer is under investigation by the Justice Department. The stock was on track for its worst day since March 2020. Meanwhile, broader economic indicators pointed to growing uncertainty. The University of Michigan consumer sentiment index fell to 64.7 in January, a sharper decline than expected, reflecting rising inflation concerns. Additionally, the 5-year inflation outlook in the survey hit 3.5%, its highest level since 1995.
Housing market data also contributed to the negative sentiment, with existing home sales dropping more than anticipated to 4.08 million units. The U.S. services purchasing managers index (PMI) also showed signs of weakness, slipping into contraction territory for February. These factors compounded fears that economic conditions may not be as strong as previously believed.
Investors sought refuge in traditionally defensive assets. The benchmark 10-year Treasury note yield declined by 8 basis points to 4.418%, boosting bond prices. The Japanese yen also strengthened against the U.S. dollar. Defensive stocks, including Procter & Gamble, General Mills, Kraft Heinz, and Mondelez, posted gains as investors shifted toward more stable sectors.
Market weakness extended across the week, with the S&P 500 down about 1%, the Dow shedding 2%, and the Nasdaq losing 1.6%. Several factors weighed on stocks, including Walmart’s weaker-than-expected earnings guidance, which sent its stock down 3% on Friday and more than 9% for the week. Inflation concerns and losses in Palantir further pressured the market.
Technical indicators added to the cautious outlook. The Dow and Nasdaq both fell below their 50-day moving averages in afternoon trading. The Dow, down 1.8%, slipped under its 50-day average of 43,695.91 for the first time since Jan. 21, while the Nasdaq, down 2%, dropped below 19,686.10, marking its first break of that level since Feb. 12.
As investors brace for more potential volatility, the focus remains on upcoming economic data and policy developments. With inflationary pressures persisting and uncertainty surrounding future policy decisions, the market’s direction remains uncertain heading into next week.
ORLANDO, Fla., Feb. 21, 2025 (GLOBE NEWSWIRE) — Nutriband Inc. (NASDAQ: NTRB) (NASDAQ:NTRBW), a developer of transdermal pharmaceutical products, today announced that it received the Certificate of Registration from the United States Patent and Trademark Office (USPTO) on Feb 18, 2025, for trademark registration Number 7,692,920, covering the mark “Nutriband™.” The Trademark registration covers Goods/Services: Class: 042 Product research and development, scientific research and development; biochemical research and development; pharmaceutical research and development.
The Nutriband™ trademark is integral to the commercialization of the Company’s platform technology AVERSA which can be incorporated into transdermal patches to prevent the abuse, diversion, misuse, and accidental exposure of drugs with abuse potential. Nutriband’s lead product under development is AVERSA™ Fentanyl, an abuse deterrent fentanyl transdermal system.
Nutriband, in partnership with Kindeva Drug Delivery, is progressing towards completing the scale-up of the commercial manufacturing process for AVERSA™ Fentanyl, the first product under the AVERSA Platform that the company intends to submit for FDA approval.
According to a market analysis report by Health Advances, AVERSA™ Fentanyl has the potential to reach peak annual U.S. sales of $80 million to $200 million. This reflects the significant impact that AVERSA™ technology could have on the market for abuse deterrent pharmaceutical products.
About AVERSA™ Technology
Nutriband’s AVERSA™ abuse deterrent transdermal technology is designed to incorporate aversive agents into transdermal patches, deterring abuse by making the experience unpleasant. This technology is especially significant for drugs like fentanyl, which have a high potential for abuse. AVERSA™ aims to ensure that these essential medications remain accessible to patients who need them while enhancing their safety profiles. The AVERSA™ technology is supported by a robust intellectual property portfolio, with patents granted in the United States and several other countries including Europe, Japan, Korea, Russia, Canada, Mexico, and Australia.
About Nutriband Inc.
Nutriband Inc. is primarily engaged in developing a portfolio of transdermal pharmaceutical products. The Company’s lead product in development is an abuse deterrent fentanyl patch that incorporates AVERSA™ technology. This technology can be integrated into any transdermal patch to prevent the abuse, misuse, diversion, and accidental exposure of drugs with abuse potential.
The Company’s website is www.nutriband.com. Any material contained in or derived from the Company’s websites, or any other website is not part of this press release.
Forward-Looking Statements
Certain statements contained in this press release, including, without limitation, statements containing the words ‘’believes,” “anticipates,” “expects” and words of similar import, constitute “forward-looking statements” within the meaning of the Private Securities Litigation Reform Act of 1995. Such forward-looking statements involve both known and unknown risks and uncertainties. The Company’s actual results may differ materially from those anticipated in its forward-looking statements as a result of a number of factors, including those including the Company’s ability to develop its proposed abuse deterrent fentanyl transdermal system and other proposed products, its ability to obtain patent protection for its abuse technology, its ability to obtain the necessary financing to develop products and conduct the necessary clinical testing, its ability to obtain Federal Food and Drug Administration approval to market any product it may develop in the United States and to obtain any other regulatory approval necessary to market any product in other countries, including countries in Europe, its ability to market any product it may develop, its ability to create, sustain, manage or forecast its growth; its ability to attract and retain key personnel; changes in the Company’s business strategy or development plans; competition; business disruptions; adverse publicity and international, national and local general economic and market conditions and risks generally associated with an undercapitalized developing company, as well as the risks contained under “Risk Factors” and “Management’s Discussion and Analysis of Financial Condition and Results of Operations” in the Company’s Form S-1, Form 10-K for the year ended January 31, 2024 and Forms 10-Q, and the Company’s other filings with the Securities and Exchange Commission. Except as required by applicable law, we undertake no obligation to revise or update any forward-looking statements to reflect any event or circumstance that may arise after the date hereof.
For more information, contact:
Nutriband Inc. Phone: 407-377-6695 Email: info@nutriband.com