Release – Alvopetro Announces Q3 2023 Financial Results and an Operational Update

Research News and Market Data on ALVOF

Nov 08, 2023

CALGARY, AB, Nov. 8, 2023 /CNW/ – Alvopetro Energy Ltd. (TSXV: ALV) (OTCQX: ALVOF) is pleased to announce financial results for the three and nine months ended September 30, 2023 and an operational update.  

All references herein to $ refer to United States dollars, unless otherwise stated and all tabular amounts are in thousands of United States dollars, except as otherwise noted.

President & CEO, Corey C. Ruttan commented:

“While sales volumes were lower in Q3 2023 due to temporary reductions in demand, we were still able to generate record operating netbacks of $70.34/boe and $9.6 million of funds flow from operations. Our production rates in October increased back up to 1,839 boepd. Capital expenditures in Q3 were focused on drilling our 183-A3 well, the first fit-for-purpose development well on our Murucututu natural gas field. The initial results from drilling are promising and we look forward to completing the well and bringing it on production later in the year.”

Operational Update

We completed drilling the 183-A3 well on our 100% owned Murucututu natural gas field in October. The well was drilled to a total measured depth of 3,540 metres and, based on open-hole logs, the well encountered potential net natural gas pay in both the Caruaçu Member of the Maracangalha Formation and the Gomo Member of the Candeias Formation, with an aggregate 127.7 metres total vertical depth of potential natural gas pay, using a 6% porosity cut-off, 50% Vshale cut-off and 50% water saturation cutoff. Subject to equipment availability and regulatory approvals, we expect to commence completion operations on the well later this month. The well will then be put on production directly into the adjacent field production facility.

October sales volumes increased to 1,839 boepd, an 8% increase from Q3 2023. October sales included natural gas sales of 10.6 MMcfpd, associated natural gas liquids sales from condensate of 67 bopd and oil sales of 8 bopd, based on field estimates.

In October we completed the BL-06 well on our Bom Lugar field and brought the well on production. October production volumes are expected to be sold in November. Based on field production data, the well is currently producing at an average of 14 bopd.

Financial and Operating Highlights – Third Quarter of 2023

  • With reduced offtake from Bahiagás during the quarter following reductions in end user consumption, our average daily sales decreased to 1,696 boepd (-14% from Q2 2023 and -36% from Q3 2022).
  • Our average realized natural gas price increased to $13.06/Mcf, a 17% increase from Q3 2022 with the 3% increase in our contracted natural gas price, enhanced sales tax credits available in 2023 and a 7% appreciation in the average BRL to USD in Q3 2023 compared to Q3 2022. With the higher natural gas price, our overall realized price per boe increased to $78.90 (+15% from Q3 2022 and +2% from Q2 2023).
  • Our natural gas, condensate and oil revenue was $12.3 million in Q3 2023, a decrease of $4.4 million (-26%) compared to Q3 2022 and a decrease of $1.6 million (-12%) compared to Q2 2023.
  • Our operating netback improved to $70.34 per boe (+$10.51 per boe from Q3 2022 and +$0.73 per boe from Q2 2023) with higher realized sales prices, partially offset by the impact of fixed operating costs with lower sales volumes.
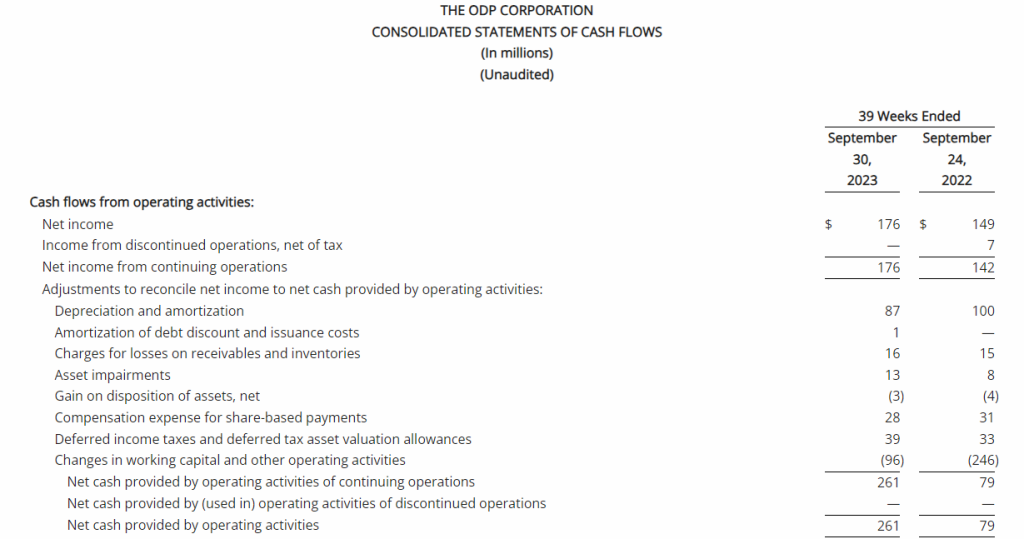
  • We generated funds flows from operations of $9.6 million ($0.26 per basic and $0.25 per diluted share), a decrease of $3.7 million compared to Q3 2022 and $1.4 million compared to Q2 2023.
  • We reported net income of $5.8 million in Q3 2023, a decrease of $3.0 million (-34%) compared to Q3 2022 and $4.0 million (-41%) compared to Q2 2023.
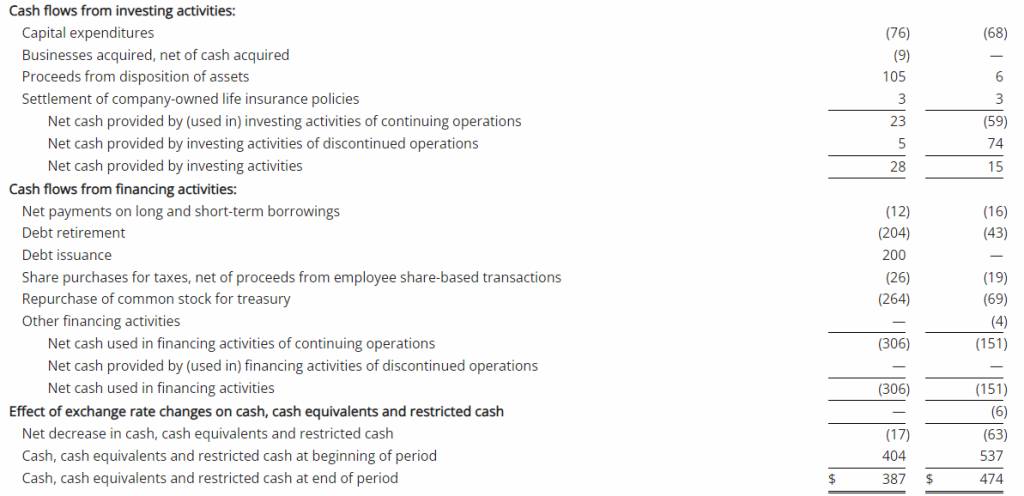
  • Capital expenditures totaled $10.7 million, including drilling costs for the 183-A3 well on our Murucututu natural gas field, drilling and completion costs for the BL-06 well on our Bom Lugar field, and long-lead purchases for future capital projects.
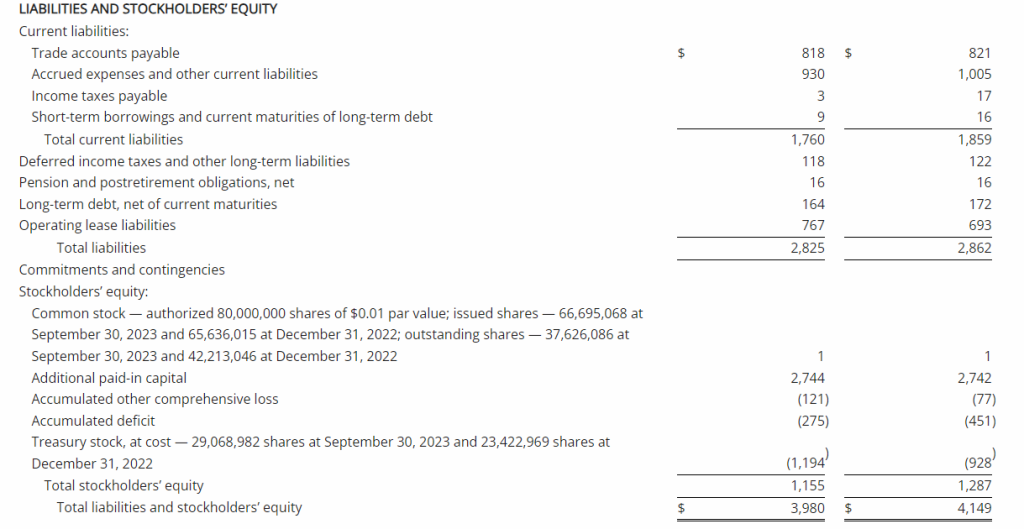
  • Our working capital surplus was $11.4 million as of September 30, 2023, decreasing $6.7 million from June 30, 2023 and $3.3 million from December 31, 2022.

The following table provides a summary of Alvopetro’s financial and operating results for three and nine months ended September 30, 2023 and September 30, 2022. The consolidated financial statements with the Management’s Discussion and Analysis (“MD&A”) are available on our website at www.alvopetro.com and will be available on the SEDAR+ website at www.sedarplus.ca.

As at and Three Months Ended September 30,As at and Nine Months Ended September 30,
20232022Change (%)20232022Change (%)
Financial
($000s, except where noted)
Natural gas, oil and condensate sales12,31316,672(26)44,38746,431(4)
Net income5,8198,795(34)27,87326,5415
      Per share – basic ($)(1)0.160.26(38)0.750.78(4)
      Per share – diluted ($)(1)0.150.24(38)0.740.723
Cash flows from operating activities12,46913,838(10)39,79835,16813
      Per share – basic ($)(1)0.340.40(15)1.071.034
      Per share – diluted ($)(1)0.330.37(11)1.050.969
Funds flow from operations (2)9,61813,348(28)35,63736,686(3)
      Per share – basic ($)(1)0.260.39(33)0.961.08(11)
      Per share – diluted ($)(1)0.250.36(31)0.941.00(6)
Dividends declared5,1222,8967715,3358,34084
Per share(1)0.140.08750.420.2475
Capital expenditures10,7038,7132322,51518,85119
Cash and cash equivalents22,77917,3803122,77917,38031
Net working capital surplus(2)11,39212,225(7)11,39212,225(7)
Weighted average shares outstanding
      Basic (000s)(1)37,13834,434837,08634,1079
      Diluted (000s)(1)37,86836,939337,74836,6933
Operations
Natural gas, NGLs and crude oil sales:
Natural gas (Mcfpd), by field:
      Caburé (Mcfpd)8,94915,139(41)11,75714,344(18)
      Murucututu (Mcfpd)726467
      Total natural gas (Mcfpd)9,67515,139(36)12,22414,344(15)
      NGLs – condensate (bopd)81117(31)101104(3)
      Oil (bopd)325046(33)
      Total (boepd)1,6962,642(36)2,1422,501(14)
Average realized prices(2):
      Natural gas ($/Mcf)13.0611.181712.5711.0314
      NGLs – condensate ($/bbl)89.43101.57(12)85.31109.38(22)
      Oil ($/bbl)73.0880.92(10)69.1883.59(17)
      Total ($/boe)78.9068.591575.9068.0012
Operating netback ($/boe)(2)
      Realized sales price78.9068.591575.9068.0012
      Royalties(2.04)(5.42)(62)(2.14)(5.05)(58)
      Production expenses(6.52)(3.34)95(5.22)(3.77)38
      Operating netback70.3459.831868.5459.1816
Operating netback margin(2)89 %87 %290 %87 %3
Notes:
(1)Per share amounts are based on weighted average shares outstanding other than dividends per share, which is based on the number of common shares outstanding at each dividend record date. The weighted average number of diluted common shares outstanding in the computation of funds flow from operations and cash flows from operating activities per share is the same as for net income per share.
(2)See “Non-GAAP and Other Financial Measures” section within this news release.

Q3 2023 Results Webcast

Alvopetro will host a live webcast to discuss our Q3 2023 financial results at 9:00 am Mountain time on Thursday November 9, 2023. Details for joining the event are as follows:

Date: November 9, 2023Time: 9:00 AM Mountain/11:00 AM EasternLink: https://us06web.zoom.us/j/85946332872Dial-in numbers: https://us06web.zoom.us/u/kcmVqG8cd9Webinar ID: 859 4633 2872

The webcast will include a question and answer period. Online participants will be able to ask questions through the Zoom portal. Dial-in participants can email questions directly to socialmedia@alvopetro.com.

Long-term Incentive Compensation Grants

In connection with our long-term incentive compensation program, Alvopetro’s Board of Directors (the “Board”) has approved the annual rolling grants to officers, directors and certain employees under Alvopetro’s Omnibus Incentive Plan. A total of 638,000 stock options, 107,000 restricted share units (“RSUs”) and 31,000 deferred share units (“DSUs”) were approved by the Board and are expected to be granted on November 17, 2023. Of the total grants, 271,000 stock options, 70,000 RSUs and 31,000 DSUs will be granted to directors and officers. Each stock option, RSU and DSU entitles the holder to purchase one common share. Each stock option granted will have an exercise price based on the volume weighted average trading price of Alvopetro’s shares on the TSX Venture Exchange for the five (5) consecutive trading days up to and including November 17, 2023. All stock options granted expire five (5) years from the date of the grant. All RSUs and DSUs granted expire ten (10) years from the date of the grant.

Corporate Presentation

Alvopetro’s updated corporate presentation is available on our website at:http://www.alvopetro.com/corporate-presentation

Social Media

Follow Alvopetro on our social media channels at the following links:

Twitter – https://twitter.com/AlvopetroEnergyInstagram – https://www.instagram.com/alvopetro/LinkedIn – https://www.linkedin.com/company/alvopetro-energy-ltd

Alvopetro Energy Ltd.’s vision is to become a leading independent upstream and midstream operator in Brazil. Our strategy is to unlock the on-shore natural gas potential in the state of Bahia in Brazil, building off the development of our Caburé and Murucututu natural gas fields and our strategic midstream infrastructure.

Neither the TSX Venture Exchange nor its Regulation Services Provider (as that term is defined in the policies of the TSX Venture Exchange) accepts responsibility for the adequacy or accuracy of this news release.

Abbreviations:

$000s                     =             thousands of U.S. dollars
bbls                         =             barrels
boepd                   =             barrels of oil equivalent (“boe”) per day
bopd                       =             barrels of oil and/or natural gas liquids (condensate) per day
BRL                         =             Brazilian Real
Mcf                         =             thousand cubic feet
Mcfpd                   =             thousand cubic feet per day
MMcf                     =             million cubic feet
MMcfpd                 =             million cubic feet per day
NGLs                       =             natural gas liquids
Q2 2023               =             three months ended June 30, 2023
Q3 2022               =             three months ended September 30, 2022
Q3 2023               =             three months ended September 30, 2023
USD                         =             United States dollars

Non-GAAP and Other Financial Measures

This news release contains references to various non-GAAP financial measures, non-GAAP ratios, capital management measures and supplementary financial measures as such terms are defined in National Instrument 52-112 Non-GAAP and Other Financial Measures Disclosure. Such measures are not recognized measures under GAAP and do not have a standardized meaning prescribed by IFRS and might not be comparable to similar financial measures disclosed by other issuers. While these measures may be common in the oil and gas industry, the Company’s use of these terms may not be comparable to similarly defined measures presented by other companies. The non-GAAP and other financial measures referred to in this report should not be considered an alternative to, or more meaningful than measures prescribed by IFRS and they are not meant to enhance the Company’s reported financial performance or position. These are complementary measures that are used by management in assessing the Company’s financial performance, efficiency and liquidity and they may be used by investors or other users of this document for the same purpose. Below is a description of the non-GAAP financial measures, non-GAAP ratios, capital management measures and supplementary financial measures used in this news release. For more information with respect to financial measures which have not been defined by GAAP, including reconciliations to the closest comparable GAAP measure, see the “Non-GAAP Measures and Other Financial Measures” section of the Company’s MD&A which may be accessed through the SEDAR+ website at www.sedarplus.ca.

Non-GAAP Financial Measures

Operating netback

Operating netback is calculated as natural gas, oil and condensate revenues less royalties and production expenses. This calculation is provided in the “Operating Netback” section of the Company’s MD&A using our IFRS measures. The Company’s MD&A may be accessed through the SEDAR+ website at www.sedarplus.ca. Operating netback is a common metric used in the oil and gas industry used to demonstrate profitability from operations.

Non-GAAP Financial Ratios

Operating netback per boe

Operating netback is calculated on a per unit basis, which is per barrel of oil equivalent (“boe”). It is a common non-GAAP measure used in the oil and gas industry and management believes this measurement assists in evaluating the operating performance of the Company. It is a measure of the economic quality of the Company’s producing assets and is useful for evaluating variable costs as it provides a reliable measure regardless of fluctuations in production. Alvopetro calculated operating netback per boe as operating netback divided by total sales volumes (barrels of oil equivalent). This calculation is provided in the “Operating Netback” section of the Company’s MD&A using our IFRS measures. The Company’s MD&A may be accessed through the SEDAR+ website at www.sedarplus.ca. Operating netback is a common metric used in the oil and gas industry used to demonstrate profitability from operations on a per unit basis (boe).

Operating netback margin

Operating netback margin is calculated as operating netback per boe divided by the realized sales price per boe. Operating netback margin is a measure of the profitability per boe relative to natural gas, oil and condensate sales revenues per boe and is calculated as follows:

Three Months Ended September 30,Nine Months Ended September 30,
2023202220232022
Operating netback – $ per boe70.3459.8368.5459.18
Average realized price – $ per boe78.9068.5975.9068.00
Operating netback margin89 %87 %90 %87 %

Funds Flow from Operations Per Share

Funds flow from operations per share is a non-GAAP ratio that includes all cash generated from operating activities and is calculated before changes in non-cash working capital, divided by the weighted the weighted average shares outstanding for the respective period. For the periods reported in this news release the cash flows from operating activities per share and funds flow from operations per share is as follows:

Three Months EndedSeptember 30,Nine Months Ended September 30,
$ per share2023202220232022
Per basic share:
Cash flows from operating activities0.340.401.071.03
Funds flow from operations0.260.390.961.08
Per diluted share:
Cash flows from operating activities0.330.371.050.96
Funds flow from operations0.250.360.941.00

Capital Management Measures

Funds Flow from Operations 

Funds flow from operations is a non-GAAP capital management measure that includes all cash generated from operating activities and is calculated before changes in non-cash working capital. The most comparable GAAP measure to funds flow from operations is cash flows from operating activities. Management considers funds flow from operations important as it helps evaluate financial performance and demonstrates the Company’s ability to generate sufficient cash to fund future growth opportunities. Funds flow from operations should not be considered an alternative to, or more meaningful than, cash flows from operating activities however management finds that the impact of working capital items on the cash flows reduces the comparability of the metric from period to period. A reconciliation of funds flow from operations to cash flows from operating activities is as follows:

Three Months Ended September 30,Nine Months Ended September 30,
2023202220232022
Cash flows from operating activities12,46913,83839,79835,168
(Deduct) add back changes in non-cash working capital(2,851)(490)(4,161)1,518
Funds flow from operations9,61813,34835,63736,686

Net Working Capital

Net working capital is computed as current assets less current liabilities. Net working capital is a measure of liquidity, is used to evaluate financial resources, and is calculated as follows: 

As at September 30,
20232022
Total current assets27,35424,545
Total current liabilities(15,962)(12,320)
Net working capital11,39212,225

Supplementary Financial Measures

Average realized natural gas price – $/Mcf” is comprised of natural gas sales as determined in accordance with IFRS, divided by the Company’s natural gas sales volumes.

Average realized NGL – condensate price – $/bbl” is comprised of condensate sales as determined in accordance with IFRS, divided by the Company’s NGL sales volumes from condensate.

Average realized oil price – $/bbl” is comprised of oil sales as determined in accordance with IFRS, divided by the Company’s oil sales volumes.

Average realized price – $/boe” is comprised of natural gas, condensate and oil sales as determined in accordance with IFRS, divided by the Company’s total natural gas, NGL and oil sales volumes (barrels of oil equivalent).

Dividends per share” is comprised of dividends declared, as determined in accordance with IFRS, divided by the number of shares outstanding at the dividend record date.

Royalties per boe” is comprised of royalties, as determined in accordance with IFRS, divided by the total natural gas, NGL and oil sales volumes (barrels of oil equivalent).

Production expenses per boe” is comprised of production expenses, as determined in accordance with IFRS, divided by the total natural gas, NGL and oil sales volumes (barrels of oil equivalent).

BOE Disclosure

The term barrels of oil equivalent (“boe”) may be misleading, particularly if used in isolation. A boe conversion ratio of six thousand cubic feet per barrel (6 Mcf/bbl) of natural gas to barrels of oil equivalence is based on an energy equivalency conversion method primarily applicable at the burner tip and does not represent a value equivalency at the wellhead. All boe conversions in this news release are derived from converting gas to oil in the ratio mix of six thousand cubic feet of gas to one barrel of oil.

Testing and Well Results

Data obtained from the 183-A3 well identified in this press release, including hydrocarbon shows, open-hole logging, net pay and porosities should be considered to be preliminary until testing, detailed analysis and interpretation has been completed. Hydrocarbon shows can be seen during the drilling of a well in numerous circumstances and do not necessarily indicate a commercial discovery or the presence of commercial hydrocarbons in a well. There is no representation by Alvopetro that the data relating to the 183-A3 well contained in this press release is necessarily indicative of long-term performance or ultimate recovery. The reader is cautioned not to unduly rely on such data as such data may not be indicative of future performance of the well or of expected production or operational results for Alvopetro in the future.

Forward-Looking Statements and Cautionary Language

This news release contains forward-looking information within the meaning of applicable securities laws. The use of any of the words “will”, “expect”, “intend” and other similar words or expressions are intended to identify forward-looking information. Forward‐looking statements involve significant risks and uncertainties, should not be read as guarantees of future performance or results, and will not necessarily be accurate indications of whether or not such results will be achieved. A number of factors could cause actual results to vary significantly from the expectations discussed in the forward-looking statements. These forward-looking statements reflect current assumptions and expectations regarding future events. Accordingly, when relying on forward-looking statements to make decisions, Alvopetro cautions readers not to place undue reliance on these statements, as forward-looking statements involve significant risks and uncertainties. More particularly and without limitation, this news release contains forward-looking statements concerning potential net natural gas pay in the 183-A3 well, the timing of competion of the 183-A3 well, anticipated timing of commencing production from the 183-A3 well, expectations regarding future development plans for the Murucututu natural gas field , plans relating to the Company’s operational activities, proposed exploration development activities and the timing for such activities, exploration and development prospects of Alvopetro, capital spending levels, future capital and operating costs, future production and sales volumes, production allocations from the Caburé natural gas field, the expected natural gas price, gas sales and gas deliveries under Alvopetro’s long-term gas sales agreement, anticipated timing for upcoming drilling and testing of other wells, projected financial results, the expected timing and outcomes of certain of Alvopetro’s testing activities, and sources and availability of capital. Forward-looking statements are necessarily based upon assumptions and judgments with respect to the future including, but not limited to, expectations and assumptions concerning the timing of regulatory licenses and approvals, equipment availability, the success of future drilling, completion, testing, recompletion and development activities and the timing of such activities, the performance of producing wells and reservoirs, well development and operating performance, expectations regarding Alvopetro’s working interest and the outcome of any redeterminations, environmental regulation, including regulation relating to hydraulic fracturing and stimulation, the ability to monetize hydrocarbons discovered, the outlook for commodity markets and ability to access capital markets, foreign exchange rates, general economic and business conditions, forecasted demand for oil and natural gas, the impact of global pandemics, weather and access to drilling locations, the availability and cost of labour and services, the regulatory and legal environment and other risks associated with oil and gas operations. The reader is cautioned that assumptions used in the preparation of such information, although considered reasonable at the time of preparation, may prove to be incorrect.  Actual results achieved during the forecast period will vary from the information provided herein as a result of numerous known and unknown risks and uncertainties and other factors. In addition, the declaration, timing, amount and payment of future dividends remain at the discretion of the Board of Directors. Although we believe that the expectations and assumptions on which the forward-looking statements are based are reasonable, undue reliance should not be placed on the forward-looking statements because we can give no assurance that they will prove to be correct. Since forward looking statements address future events and conditions, by their very nature they involve inherent risks and uncertainties. Actual results could differ materially from those currently anticipated due to a number of factors and risks. These include, but are not limited to, risks associated with the oil and gas industry in general (e.g., operational risks in development, exploration and production; delays or changes in plans with respect to exploration or development projects or capital expenditures; the uncertainty of reserve estimates; the uncertainty of estimates and projections relating to production, costs and expenses, reliance on industry partners, availability of equipment and personnel, uncertainty surrounding timing for drilling and completion activities resulting from weather and other factors, changes in applicable regulatory regimes and health, safety and environmental risks), commodity price and foreign exchange rate fluctuations, market uncertainty associated with financial institution instability, and general economic conditions. The reader is cautioned that assumptions used in the preparation of such information, although considered reasonable at the time of preparation, may prove to be incorrect. Although Alvopetro believes that the expectations and assumptions on which such forward-looking information is based are reasonable, undue reliance should not be placed on the forward-looking information because Alvopetro can give no assurance that it will prove to be correct. Readers are cautioned that the foregoing list of factors is not exhaustive. Additional information on factors that could affect the operations or financial results of Alvopetro are included in our annual information form which may be accessed on Alvopetro’s SEDAR+ profile at www.sedarplus.ca. The forward-looking information contained in this news release is made as of the date hereof and Alvopetro undertakes no obligation to update publicly or revise any forward-looking information, whether as a result of new information, future events or otherwise, unless so required by applicable securities laws.

SOURCE Alvopetro Energy Ltd.

Release – Largo Reports Third Quarter 2023 Financial Results; Announces First Commercial Shipment of Ilmenite as By-Product of its Vanadium Operations in Brazil and Validation of its 6 MWh Vanadium Redox Flow Battery to Operate on Test Conditions in Spain

Research News and Market Data on LGO

November 8, 2023

Download(opens in new window)

All amounts expressed are in U.S. dollars, denominated by “$”

TORONTO–(BUSINESS WIRE)– Largo Inc. (“Largo” or the “Company“) (TSX: LGO) (NASDAQ: LGO) today announces its third quarter 2023 financial results.

Largo Reports Third Quarter 2023 Financial Results; Announces First Commercial Shipment of Ilmenite as By-Product of its Vanadium Operations in Brazil (Photo: Business Wire)

Q3 2023 and Other Highlights

  • Revenues of $44.0 million vs. revenues of $54.3 million in Q3 2022; Decline driven by lower vanadium prices and lower vanadium sales volumes; Revenues per lb sold3 of V2O5 equivalent of $8.34 vs. $8.80 in Q3 2022
  • Operating costs of $42.5 million vs. $45.6 million in Q3 2022; Cash operating costs excluding royalties1 per pound sold of $5.44 vs. 4.86 per lb sold in Q3 2022
  • Net loss of $11.9 million vs. net loss of $2.6 million in Q3 2022; Basic loss per share of $0.19 vs. basic loss per share of $0.04 in Q3 2022
  • Cash used before working capital items of $4.4 million vs. cash provided before working capital items of $4.3 million in Q3 2022
  • Cash balance of $39.5 million, net working capital surplus of $91.0 million and debt of $65.0 million exiting Q3 2023
  • V2O5 equivalent sales of 2,385 tonnes (inclusive of 256 tonnes of purchased material) vs. 2,796 tonnes (inclusive of 351 tonnes of purchased material) sold in Q3 2022
  • Production of 2,163 tonnes (4.8 million lbs1) of V2O5 vs. 2.906 tonnes in Q3 2022
  • Largo Clean Energy’s (“LCE”) 6 megawatt-hour (“MWh”) vanadium redox flow battery (“VRFB”) deployment for Enel Green Power España (“EGPE”) was validated to operate on test conditions according to EGPE specifications and LCE test procedures in October
  • The Company successfully commissioned and is in the process of ramping up production of its new ilmenite concentrate plant with initial production of 350 tonnes in August and 700 tonnes in September; The first commercial shipment of ilmenite is in progress and should contribute to the Company’s revenues in Q4 2023 as a by-product of its vanadium operations
  • Q3 2023 results conference call: Thursday, November 9th at 1:00 p.m. ET

Vanadium Market Update2

  • The average benchmark price per lb of V2O5 in Europe was $8.03, a 2.5% decrease from the average of $8.23 seen in Q3 2022
  • Vanadium spot demand was soft in Q3 2023, primarily due to adverse conditions in the Chinese and European steel industries. However, strong demand growth from the aerospace and energy storage sectors continued

Daniel Tellechea, Director and Interim CEO of Largo commented: “Q3 2023 was a challenging quarter for Largo, primarily due to the tragic accident that occurred at the Company’s chemical plant in July as well as technical delays in commissioning our new crushing plant. The accident at the chemical plant resulted in a capacity bottleneck in the evaporator section of the plant, which resulted in lower overall production rates of vanadium in July and August. In early September, our operating team recommissioned the evaporator circuit, which is now operating at its original capacity. A delay in ramp up of the new magnetic separation crushing plant also temporarily impacted vanadium production in Q3 2023. The new crushing plant was designed to offset the impact of lower mined vanadium grades, as per the Company’s mine plan. The operating team is in the process of resolving these issues, and we are pleased to report that the crushing plant exceeded 1,000 tonnes of contained V2O5 in October, despite additional crushing plant improvements scheduled to be implemented in November and December.”

He continued: “It is our priority to continue to optimize our operations, reduce costs, and achieve production and sales targets safely. In light of this, we maintain our guidance for 2023. Additionally, further measures are being implemented to improve the organization’s performance, including optimizing operational efficiencies through the implementation of the new crushing system, concentrating on increasing production of high purity vanadium, restructuring equipment maintenance processes to further reduce costs, and ramping up ilmenite production starting in the fourth quarter of 2023 to diversify revenues. We are beginning to see a notable reduction in key consumable costs, such as sodium carbonate, as well as ongoing overhead cost reductions through a reduction of the number of contractors at the mine through efficiency improvement programs and further reductions in the headcount at LCE. The Company considers these ongoing initiatives to be a vitally important measures to counter the current decrease in vanadium prices.”

He concluded: “During this past year, we have also made several significant investments that are necessary for the sustainability of our operations in a lower vanadium price environment. Among these investments are an increased waste rock pre-stripping and aggressive infill drilling program to optimize production in the years to come. Our team has successfully built and commissioned an ilmenite plant to diversify future revenues as a by-product of the vanadium mine, built a new magnetic separation crushing plant for the purpose of mining lower-grade material without reducing production levels, and delivered the Company’s first vanadium battery to EGPE, our European energy storage customer. A substantial investment has been made in LCE, which is not yet generating significant revenues, but continues to consume cash. With our current strategic review process in place, Largo expects to optimize the value proposition of LCE and participate in one of the most significant macrotrends, the clean energy transition with vanadium as a critical material. With these investments, we believe that Largo is on the path to a brighter future.”

Financial and Operating Results – Highlights

(thousands of U.S. dollars, except as otherwise stated)Three months endedNine months ended
Sept. 30, 2023Sept. 30, 2022Sept. 30, 2023Sept. 30, 2022
Revenues43,98354,258154,514181,750
Operating costs(42,580)(45,602)(131,540)(125,264)
Net income (loss)(11,884)(2,601)(19,057)13,410
Basic earnings (loss) per share(0.19)(0.04)(0.30)0.21
Cash (used) provided before working capital items(4,360)4,3287,63135,479
Cash operating costs excl. royalties3 ($/lb)5.444.865.254.37
Cash39,57262,71339,57262,713
Debt65,00015,00065,00015,000
Total mined – dry basis (tonnes)6,406,6264,178,18511,373,6837,780,061
Total ore mined (tonnes)447,165351,4501,279,0241,033,375
Effective grade4 of ore milled (%)0.941.281.041.32
V2O5 equivalent produced (tonnes)2,1632,9066,9138,432

Q3 2023 Notes

  • The decrease in operating costs in Q3 2023 is largely attributable to lower overall sales in the period, which includes a reduction in the sale of purchased products and lower royalties due to lower sales.
  • V2O5 equivalent production of 2,163 tonnes in Q3 2023 decreased from 2,639 tonnes produced in Q2 2023. Production in July 2023 was 644 tonnes, with 775 tonnes produced in August and 744 tonnes produced in September, for a total of 2,163 tonnes of V2O5 equivalent produced. July and August production were negatively impacted as a result of the chemical plant operating at limited capacity due to the accident in the evaporation section of the plant in July 2023. In addition, September production was negatively impacted by low availability of the crushing circuit, combined with the planned lower vanadium grade of ore mined. V2O5 production in October continued to improve with 866 tonnes produced.
  • The Company is actively working to achieve higher levels of operational stability to better manage its costs which have increased due in part to lower grades of ore mined as compared with prior quarters. The lower grade of ore mined in Q3 2023 was according to plan, representing a 27% decrease year-over-year. The Company is actively working towards increasing the availability of its new crushing system to offset lowers grades of ore mined and reach production of 1,000 tonnes of V2O5 per month in future months.
  • Total mined (dry basis) of 6.4 million tonnes increased by 53% and total ore mined of 447,165 tonnes was 27% higher than Q3 2022, respectively. Increased mining rates and higher mining costs impacted the Company’s financial performance in Q3 2023.
  • As part of its ongoing mitigation efforts, the Company is focused on reducing its fixed cost structure through contract renegotiations and an optimization of key operational areas, including mining, maintenance, equipment rental and consumables.
  • The commissioning and ramp up of the ilmenite plant commenced in Q3 2023 with production of 350 tonnes in August and 700 tonnes in September. The Company expects the ramp up to conclude in Q2 2024 with revenue expectations in Q4 2023.
  • Exploration and evaluation costs of $2.3 million increased by $1.8 million from Q3 2022. This was driven by infill drilling and geological model work at the Maracás Menchen Mine and diamond drilling at Campo Alegre de Lourdes to support the maintenance of the Company’s mineral rights. During Q3 2023, the Company completed approximately 9,100 metres of diamond drilling in the near mine deep drilling and exploration program. In the nine months ended September 30, 2023, approximately 19,100 metres of diamond drillholes have been completed in Campo Alegre de Lourdes and Maracas targets. A re-assay program began in Q2 2023 to perform chemical analysis on previously interpreted results. The focus of this program is to increase measured and indicated resources. Approximately 5,000 samples were prepared and sent to the external laboratory for analysis in Q3 2023.

The information provided within this release should be read in conjunction with Largo’s unaudited condensed interim consolidated financial statements for the three and nine months ended September 30, 2023 and 2022 and its management’s discussion and analysis (“MD&A”) for the three and nine months ended September 30, 2023 which are available on our website at www.largoinc.com or on the Company’s respective profiles at www.sedarplus.com and www.sec.gov.

About Largo

Largo is a globally recognized vanadium company known for its high-quality VPURE™ and VPURE+™ products, sourced from its Maracás Menchen Mine in Brazil. The Company is currently focused on implementing an ilmenite concentrate plant and is undertaking a strategic evaluation of its U.S.-based clean energy business, including its advanced VCHARGE vanadium battery technology to maximize the value of the organization. Largo’s strategic business plan centers on maintaining its position as a leading vanadium supplier with a growth strategy to support a low-carbon future.

Largo’s common shares trade on the Nasdaq Stock Market and on the Toronto Stock Exchange under the symbol “LGO”. For more information on the Company, please visit www.largoinc.com.

Cautionary Statement Regarding Forward-looking Information:

This press release contains “forward-looking information” and “forward-looking statements” within the meaning of applicable Canadian and United States securities legislation. Forward-looking information in this press release includes, but is not limited to, statements with respect to the timing and amount of estimated future production and sales; the future price of commodities; costs of future activities and operations, including, without limitation, achieving operational stability and managing unit costs; and the expected completion of the ilmenite plan ramp up in Q4 2023.

The following are some of the assumptions upon which forward-looking information is based: that general business and economic conditions will not change in a material adverse manner; demand for, and stable or improving price of V2O5, other vanadium products, ilmenite and titanium dioxide pigment; receipt of regulatory and governmental approvals, permits and renewals in a timely manner; that the Company will not experience any material accident, labour dispute or failure of plant or equipment or other material disruption in the Company’s operations at the Maracás Menchen Mine or relating to Largo Clean Energy; the availability of financing for operations and development; the availability of funding for future capital expenditures; the ability to replace current funding on terms satisfactory to the Company; the ability to mitigate the impact of heavy rainfall; the reliability of production, including, without limitation, access to massive ore, the Company’s ability to procure equipment, services and operating supplies in sufficient quantities and on a timely basis; that the estimates of the resources and reserves at the Maracás Menchen Mine are within reasonable bounds of accuracy (including with respect to size, grade and recovery and the operational and price assumptions on which such estimates are based); the accuracy of the Company’s mine plan at the Maracás Menchen Mine, the competitiveness of the Company’s vanadium redox flow battery (“VRFB“) technology; the ability to obtain funding through government grants and awards for the Green Energy sector, the accuracy of cost estimates and assumptions on future variations of VCHARGE battery system design, that the Company’s current plans for ilmenite and VRFBs can be achieved; the Company’s “two-pillar” business strategy will be successful; the Company’s sales and trading arrangements will not be affected by the evolving sanctions against Russia; and the Company’s ability to attract and retain skilled personnel and directors; the ability of management to execute strategic goals.

Forward-looking statements can be identified by the use of forward-looking terminology such as “plans”, “expects” or “does not expect”, “is expected”, “budget”, “scheduled”, “estimates”, “forecasts”, “intends”, “anticipates” or “does not anticipate”, or “believes”, or variations of such words and phrases or statements that certain actions, events or results “may”, “could”, “would”, “might” or “will be taken”, “occur” or “be achieved”. All information contained in this news release, other than statements of current and historical fact, is forward looking information. Forward-looking statements are subject to known and unknown risks, uncertainties and other factors that may cause the actual results, level of activity, performance or achievements of Largo to be materially different from those expressed or implied by such forward-looking statements, including but not limited to those risks described in the annual information form of Largo and in its public documents filed on www.sedarplus.ca and available on www.sec.gov from time to time. Forward-looking statements are based on the opinions and estimates of management as of the date such statements are made. Although management of Largo has attempted to identify important factors that could cause actual results to differ materially from those contained in forward-looking statements, there may be other factors that cause results not to be as anticipated, estimated or intended. There can be no assurance that such statements will prove to be accurate, as actual results and future events could differ materially from those anticipated in such statements. Accordingly, readers should not place undue reliance on forward-looking statements. Largo does not undertake to update any forward-looking statements, except in accordance with applicable securities laws. Readers should also review the risks and uncertainties sections of Largo’s annual and interim MD&A which also apply.

Trademarks are owned by Largo Inc.

Non-GAAP5 Measures

The Company uses certain non-GAAP measures in this press release, which are described in the following section. Non-GAAP financial measures and non-GAAP ratios are not standardized financial measures under IFRS, the Company’s GAAP, and might not be comparable to similar financial measures disclosed by other issuers. These measures are intended to provide additional information and should not be considered in isolation or as a substitute for measures of performance prepared in accordance with IFRS.

Revenues Per Pound

This press release refers to revenues per pound sold, a non-GAAP performance measure that is used to provide investors with information about a key measure used by management to monitor performance of the Company.

This measure, along with cash operating costs and total cash costs, is considered to be one of the key indicators of the Company’s ability to generate operating earnings and cash flow from its Maracás Menchen Mine and sales activities. This revenues per pound measure does not have any standardized meaning prescribed by IFRS and differs from measures determined in accordance with IFRS. This measure is intended to provide additional information and should not be considered in isolation or as a substitute for measures of performance prepared in accordance with IFRS. This measure is not necessarily indicative of net earnings or cash flow from operating activities as determined under IFRS.

The following table provides a reconciliation of this measure per pound sold to revenues as per the Q3 2022 unaudited condensed interim consolidated financial statements.

  Three months ended Nine months ended
  September 30, 2023 September 30, 2022 September 30, 2023 September 30, 2022
Revenues – V2O5 produced1 $25,268 $30,831 $90,352 $98,621
V2O5 sold – produced (000s lb)  3,017  3,745  9,898  10,824
V2O5 revenues per pound of V2O5 sold – produced ($/lb) $8.38 $8.23 $9.13 $9.11
         
Revenues – V2O5 purchased1 $2,066 $1,655 $7,531 $3,184
V2O5 sold – purchased (000s lb)  309  207  1,014  339
V2O5 revenues per pound of V2O5 sold – purchased ($/lb) $6.69 $8.00 $7,43 $9.39
         
Revenues – V2O51 $27,334 $32,486 $97,883 $101,805
V2O5 sold (000s lb)  3,326  3,952  10,912  11,163
V2O5 revenues per pound of V2O5 sold ($/lb) $8.22 $8.22 $8.97 $9.12
         
Revenues – V2O3 produced1 $3,734 $3,798 $7,575 $3,798
V2O3 sold – produced (000s lb)  308  308  619  308
V2O3 revenues per pound of V2O3 sold – produced ($/lb) $12.12 $12.33 $12.24 $12.33
         
Revenues – V2O3 purchased1 $ $482 $1,155 $482
V2O3 sold – purchased (000s lb)    43  88  43
V2O3 revenues per pound of V2O3 sold – purchased ($/lb) $ $11.21 $13.13 $11.21
         
Revenues – V2O31 $3,734 $4,280 $8,730 $4,280
V2O3 sold (000s lb)  308  350  707  350
V2O3 revenues per pound of V2O3 sold ($/lb) $12.12 $12.23 $12.35 $12.23
         
Revenues – FeV produced1 $11,750 $12,756 $46,408 $54,667
FeV sold – produced (000s kg)  444  394  1,591  1,576
FeV revenues per kg of FeV sold – produced ($/kg) $26.46 $32.38 $29.17 $34.69
         
Revenues – FeV purchased1 $1,058 $4,736 $1,386 $20,998
FeV sold – purchased (000s kg)  39  159  50  516
FeV revenues per kg of FeV sold – purchased ($/kg) $27.13 $29.79 $27.72 $40.69
         
Revenues – FeV1 $12,808 $17,492 $47,794 $75,665
FeV sold (000s kg)  483  553  1,641  2,092
FeV revenues per kg of FeV sold ($/kg) $26.52 $31.63 $29,12 $36.17
         
         
Revenues1 $43,876 $54,258 $154,407 $181,750
V2O5 equivalent sold (000s lb)  5,259  6,164  17,177  18,340
Revenues per pound sold ($/lb) $8.34 $8.80 $8.99 $9.91
1. As per note 18 of the Company’s Q3 2023 unaudited condensed interim consolidated financial statements.

Cash Operating Costs Per Pound

The Company’s MD&A refers to cash operating costs per pound and cash operating costs excluding royalties per pound, which are non-GAAP ratios based on cash operating costs and cash operating costs excluding royalties, which are non-GAAP financial measures, in order to provide investors with information about a key measure used by management to monitor performance. This information is used to assess how well the Maracás Menchen Mine is performing compared to plan and prior periods, and also to assess its overall effectiveness and efficiency.

Cash operating costs includes mine site operating costs such as mining costs, plant and maintenance costs, sustainability costs, mine and plant administration costs, royalties and sales, general and administrative costs (all for the Mine properties segment), but excludes depreciation and amortization, share-based payments, foreign exchange gains or losses, commissions, reclamation, capital expenditures and exploration and evaluation costs. Operating costs not attributable to the Mine properties segment are also excluded, including conversion costs, product acquisition costs, distribution costs and inventory write-downs.

Cash operating costs excluding royalties is calculated as cash operating costs less royalties. Cash operating costs per pound and cash operating costs excluding royalties per pound are obtained by dividing cash operating costs and cash operating costs excluding royalties, respectively, by the pounds of vanadium equivalent sold that were produced by the Maracás Menchen Mine. Cash operating costs, cash operating costs excluding royalties, cash operating costs per pound and cash operating costs excluding royalties per pound, along with revenues, are considered to be key indicators of the Company’s ability to generate operating earnings and cash flow from its Maracás Menchen Mine. These measures differ from measures determined in accordance with IFRS, and are not necessarily indicative of net earnings or cash flow from operating activities as determined under IFRS.

The following table provides a reconciliation of cash operating costs and cash operating costs excluding royalties, cash operating costs per pound and cash operating costs excluding royalties per pound for the Maracás Menchen Mine to operating costs as per the Q3 2023 unaudited condensed interim consolidated financial statements.

  Three months ended Nine months ended
  September 30, 2023 September 30, 2022 September 30, 2023 September 30, 2022
Operating costsi $42,580  $45,602  $131,540  $125,264 
Professional, consulting and management feesii  747   1,181   2,215   3,784 
Other general and administrative expensesiii  408   383   1,032   859 
Less: iron ore costsi  (145)  (200)  (638)  (637)
Less: conversion costsi  (1,413)  (1,655)  (5,551)  (5,839)
Less: product acquisition costsi  (5,449)  (7,248)  (13,380)  (20,651)
Less: distribution costsi  (2,202)  (2,581)  (6,174)  (6,887)
Less: inventory write-downiv  (978)  (1,655)  (1,661)  (1,655)
Less: depreciation and amortization expensei  (6,003)  (5,111)  (19,456)  (14,923)
Cash operating costs  27,545   28,716   87,927   79,315 
Less: royalties1  (2,024)  (2,497)  (6,919)  (8,264)
Cash operating costs excluding royalties  25,521   26,219   81,008   71,050 
Produced V2O5 sold (000s lb)  4,693   5,390   15,434   16,272 
Cash operating costs per pound ($/lb) $5.87  $5.33  $5.70  $4.87 
Cash operating costs excluding royalties per pound ($/lb) $5.44  $4.86  $5.25  $4.37 
i. As per note 19 of the Company’s Q3 2023 unaudited condensed interim consolidated financial statements.
ii. As per the Mine properties segment in note 15 of the Company’s Q3 2023 unaudited condensed interim consolidated financial statements.
iii. As per the Mine properties segment in note 15 of the Company’s Q3 2023 unaudited condensed interim consolidated financial statements less the increase in legal provisions of $0.4 million (Q3 2023) and $0.8 million (nine months ended September 30, 2023) as noted in the “other general and administrative expenses” section on page 6 of the Company’s Q3 2023 management discussion and analysis.
iv. As per notes 5 and 19 of the Company’s Q3 2023 unaudited condensed interim consolidated financial statements for purchased finished products.

____________________________
1 Conversion of tonnes to pounds, 1 tonne = 2,204.62 pounds or lbs.
2 Fastmarkets Metal Bulletin.
3 The cash operating costs excluding royalties and revenues per pound per pound sold are reported on a non-GAAP basis. Refer to the “Non-GAAP Measures” section of this press release. Revenues per pound sold are calculated based on the quantity of V2O5 sold during the stated period.
4 Effective grade represents the percentage of magnetic material mined multiplied by the percentage of V2O5 in the magnetic concentrate
5 GAAP – Generally Accepted Accounting Principles

Investor Relations
Alex Guthrie
Senior Manager, External Relations
+1.416.861.9778
aguthrie@largoinc.com

Source: Largo Inc.

Release – GeoVax Reports Third Quarter 2023 Financial Results and Provides Business Update

Research News and Market Data on GOVX


  • Last updated: 08 November 2023 21:03
  • Created: 08 November 2023 15:32
  • Hits: 505

Significant Progress towards data milestones in Phase 2 Program of GEO-CM04S1, Next-generation COVID-19 vaccine

Gedeptin® clinical data from Phase 1/2 study presented at AACR-AHNS Head and Neck Cancer Conference showing safe administration and tumor reduction

Multi-Product License Secured for ProBioGen’s AGE1.CR.pIX® suspension cell line to enhance manufacturing capabilities of MVA-based vaccine portfolio

Company to host conference call and webcast today at 4:30 p.m. ET

ATLANTA, GA, November 8, 2023 – GeoVax Labs, Inc. (Nasdaq: GOVX), a biotechnology company developing immunotherapies and vaccines against cancers and infectious diseases, today announced financial results for the third quarter ended September 30, 2023 and provided a business update.

“We are thrilled to see material advancements across all aspects of our business. Through the third quarter, we are delivering on our promise to bring transformative change to the treatment of COVID-19 by completing enrollment in our healthy volunteer Phase 2 clinical trial evaluating GEO-CM04S1 as a potentially more robust, more durable booster vaccine. In addition, with two additional Phase 2 trials ongoing in immunocompromised population, and recent publication of positive safety and potent immunogenicity data in this population, we have strengthened our conviction in the potential of our next-generation COVID-19 vaccine (GEO-CM04S1) for immunocompromised patients. We believe the need for new treatment options for immunocompromised patients in the fight against COVID-19 is significant, particularly as we begin to enter the winter surges of this diseases, where these patients will be left most vulnerable,” said David Dodd, Chief Executive Officer of GeoVax.

“We are preparing to announce initial data readouts from two of our Phase 2 GEO-CM04S1 trials as well as updates from our Gedeptin® clinical trial against head and neck cancer in the coming months. Earlier this summer, we were delighted to present clinical data which revealed the safe and feasible administration of Gedeptin®. We believe the Gedeptin mechanism of action to be solid tumor agnostic, and therefore offers the potential as a therapeutic option for multiple cancer types and positions the product for long-term growth. The third quarter of 2023 also saw new patents issued for our Ebola, Marburg, Malaria, and HIV vaccines, demonstrating the strength of our team’s ability to execute on our broader strategy. In addition, we advanced our manufacturing process through the signing of a landmark multi-product commercial license agreement with ProBioGen for the use of their AGE1.CR.PIX®suspension cell line. We believe that these catalysts altogether will have a profound impact on patients in need and all our stakeholders.”

Recent Business Achievements

GEO-CM04S1

  • Enrollment completed for Phase 2 clinical trial evaluating GEO-CM04S1 as a booster for healthy patients who have previously received the Pfizer or Moderna mRNA vaccine in September of 2023. An initial data readout is expected soon.
  • GEO-CM04S1 demonstrated potent antibody and cellular immunity in immunocompromised patients in a recent publication in the journal, Vaccines, in August 2023. GeoVax’s Phase 2 clinical trial evaluated the safety and immunogenicity of GEO-CM04S1, compared to either the Pfizer/BioNTech or Moderna mRNA-based vaccine in patients who have previously received an allogeneic hematopoietic cell transplant, an autologous hematopoietic cell transplant or CAR-T cell therapy. Most promising in the results published was the demonstration of the potential of GEO-CM04S1 as a variant agnostic COVID-19 vaccine, providing potent immunity from the Wuhan through Delta and Omicron strains.
    • In October 2023, GeoVax commenced the planned site expansion for this trial to accelerate patient enrollment. In addition to study enrollments completed at the City of Hope Medical Center (Duarte, California), the trial is now open at Wake Forest Baptist Medical Center (Winston Salem, North Carolina), the University of Massachusetts Medical Center (Worcester, Massachusetts), and Fred Hutchinson Cancer Center (Seattle, Washington).
  • Commenced investigator-initiated randomized observer-blinded Phase 2 clinical trial of COVID-19 boosters with GEO-CM04S1 or Pfizer-BioNTech bivalent vaccines in patients with chronic lymphocytic leukemia (CLL) in July of 2023. The trial is rapidly enrolling patients and progressing towards an interim data review. 
  • Presented data for GEO-CM02 at the Keystone Symposia Conference in an abstract titled, MVA-vector multi-antigen COVID-19 vaccines induce protective immunity against SARS-CoV-2 variants spanning Alpha to Omicron in preclinical animal models in September of 2023The data revealed that the GEO-CM02 vaccine induced immune responses that were efficacious against the original Wuhan strain and Omicron variants with a single dose. This effort expands upon GeoVax’s hypothesis that vaccines designed to induce both antibodies and T-cell responses to multiple viral structural proteins can address the issue of viral variation and escape from the immune system without the need for repeated seasonal adjustments.

Gedeptin®

  • Gedeptin® clinical data presented at the AACR-AHNS Head and Neck Cancer Conference in an abstract titled, Phase 1/2 study of Ad/PNB with Fludarabine for the Treatment of Head and Neck Squamous Cell Carcinoma (HNSCC) in July 2023The FDA-funded study revealed that the administration of Gedeptin® is safe and feasible.

Advanced Vaccine Manufacturing Process

  • GeoVax and ProBioGen announced the signing of a landmark multi-product commercial license agreement for ProBioGen’s groundbreaking AGE1.CR.PIX® suspension cell line in September 2023. The agreement enhances the manufacturing capabilities of GeoVax’s entire Modified Vaccinia Ankara (MVA)-based vaccine portfolio with respect to both scale and flexibility. This follows the May 2023 agreement with Advanced Bioscience Laboratories, Inc. (ABL) to support current Good Manufacturing Practices (cGMP) production of the Company’s vaccine candidates. These agreements move the Company toward fully implementing a continuous cell line manufacturing system that will provide lower-cost, scalable versatility for our entire MVA-based vaccine portfolio.

Intellectual Property Developments

  • GeoVax recently secured multiple positive patent decisions covering notice of allowances for Ebola, Marburg, Malaria and HIV vaccines.
    • GeoVax announced that the U.S. Patent and Trademark Office has issued a Notice of Allowance for Patent Application No. 17/584,231 titled patent titled “Replication Deficient Modified Vaccina Ankara (MVA) Expressing Marburg Virus Glycoprotein (GP) and Matrix Protein (VP40).”
    • GeoVax announced that the U.S Patent and Trademark Office has issued a Notice of Allowance for Patent Application No. 17/409,574 titled “Multivalent HIV Vaccine Boost Compositions and Methods of Use.”
    • GeoVax announced that the U.S. Patent and Trademark Office has issued a Notice of Allowance for Patent Application No. 17/726,254 titled “Compositions and Methods for Generating an Immune Response to Treat or Prevent Malaria.”
    • GeoVax announced that the U.S. Patent and Trademark Office has issued Patent No. 11,701,418 B2 to GeoVax, pursuant to the Company’s patent application No. 15/543,139 titled “Replication-Deficient Modified Vaccinia Ankara (MVA) and Matrix Protein (VP40).”

Upcoming Events

  • GeoVax will participate in upcoming conferences and industry events:
    • Vaccines Summit 2023, November 13-15, 2023, Boston, MA
    • World Vaccine Congress, West Coast, November 27-30, 2023, Santa Clara, CA
    • NobleCon19, December 3-5, Boca Raton, FL
    • Emerging Growth Conference, December 6-7, Virtual

Third Quarter 2023 Financial Results

Net Loss: Net loss for the three months ended September 30, 2023, was $8,408,818 ($0.32 per share) as compared to $3,968,102 ($0.17 per share) for the comparable period in 2022. For the nine months ended September 30, 2023, the Company’s net loss was $18,374,354 ($0.69 per share) as compared to a net loss of $8,637,316 ($0.63 per share) in 2022.

R&D Expenses: Research and development expenses were $6,947,979 and $14,486,896 for the three-month and nine-month periods ended September 30, 2023, compared to $2,721,196 and $5,358,917 for the comparable periods in 2022, with the increase primarily due to the cost of conducting clinical trials for GEO-CM04S1 and Gedeptin, costs of manufacturing materials for use in our clinical trials, additional personnel costs, technology license fees, costs of preclinical research activities and a generally higher level of activity.

G&A Expenses: General and administrative expenses were $1,651,775 and $4,562,293 for the three-month and nine-month periods ended September 30, 2023, compared to $1,249,337 and $3,363,672 for the comparable periods in 2022, with the increase primarily due to higher personnel costs, investor relations consulting costs, patent costs and other expenses supportive of a higher level of activity.

Cash Position: GeoVax reported cash balances of $12,687,041 at September 30, 2023, as compared to $27,612,732 at December 31, 2023.

Further information is included in the Company’s Quarterly Report on Form 10-Q filed with the Securities and Exchange Commission.

Conference Call Details

Management will host a conference call scheduled to begin at 4:30 p.m. ET today, November 8, 2023, to review financial results and provide an update on corporate developments. A question-and-answer session will follow management’s formal remarks.

Domestic: +1-800-715-9871

International: +1-646-307-1963

Conference ID: 7519986

Webcast: https://edge.media-server.com/mmc/p/r4i9d5j7

A webcast replay of the call will be available for three months via the same link as the live webcast approximately two hours after the end of the call.

About GeoVax

GeoVax Labs, Inc. is a clinical-stage biotechnology company developing novel therapies and vaccines for solid tumor cancers and many of the world’s most threatening infectious diseases. The company’s lead program in oncology is a novel oncolytic solid tumor gene-directed therapy, Gedeptin®, presently in a multicenter Phase 1/2 clinical trial for advanced head and neck cancers. GeoVax’s lead infectious disease candidate is GEO-CM04S1, a next-generation COVID-19 vaccine targeting high-risk immunocompromised patient populations. Currently in three Phase 2 clinical trials, GEO-CM04S1 is being evaluated as a primary vaccine for immunocompromised patients such as those suffering from hematologic cancers and other patient populations for whom the current authorized COVID-19 vaccines are insufficient, and as a booster vaccine in patients with chronic lymphocytic leukemia (CLL). In addition, GEO-CM04S1 is in a Phase 2 clinical trial evaluating the vaccine as a more robust, durable COVID-19 booster among healthy patients who previously received the mRNA vaccines. GeoVax has a leadership team who have driven significant value creation across multiple life science companies over the past several decades. For more information, visit our website: www.geovax.com.

Forward-Looking Statements

This release contains forward-looking statements regarding GeoVax’s business plans. The words “believe,” “look forward to,” “may,” “estimate,” “continue,” “anticipate,” “intend,” “should,” “plan,” “could,” “target,” “potential,” “is likely,” “will,” “expect” and similar expressions, as they relate to us, are intended to identify forward-looking statements. We have based these forward-looking statements largely on our current expectations and projections about future events and financial trends that we believe may affect our financial condition, results of operations, business strategy and financial needs. Actual results may differ materially from those included in these statements due to a variety of factors, including whether: GeoVax is able to obtain acceptable results from ongoing or future clinical trials of its investigational products, GeoVax’s immuno-oncology products and preventative vaccines can provoke the desired responses, and those products or vaccines can be used effectively, GeoVax’s viral vector technology adequately amplifies immune responses to cancer antigens, GeoVax can develop and manufacture its immuno-oncology products and preventative vaccines with the desired characteristics in a timely manner, GeoVax’s immuno-oncology products and preventative vaccines will be safe for human use, GeoVax’s vaccines will effectively prevent targeted infections in humans, GeoVax’s immuno-oncology products and preventative vaccines will receive regulatory approvals necessary to be licensed and marketed, GeoVax raises required capital to complete development, there is development of competitive products that may be more effective or easier to use than GeoVax’s products, GeoVax will be able to enter into favorable manufacturing and distribution agreements, and other factors, over which GeoVax has no control.

Further information on our risk factors is contained in our periodic reports on Form 10-Q and Form 10-K that we have filed and will file with the SEC. Any forward-looking statement made by us herein speaks only as of the date on which it is made. Factors or events that could cause our actual results to differ may emerge from time to time, and it is not possible for us to predict all of them. We undertake no obligation to publicly update any forward-looking statement, whether as a result of new information, future developments or otherwise, except as may be required by law. 

Company Contact:        Investor Relations Contact:        Media Contact:
info@geovax.com paige.kelly@sternir.com sr@roberts-communications.com
678-384-7220 212-698-8699 202-779-0929

Gray Television (GTN) – A Return On Its Hidden Value May Become Visible


Thursday, November 09, 2023

Gray Television is a multimedia company headquartered in Atlanta, Georgia. We are the nation’s largest owner of top-rated local television stations and digital assets in the United States. Our television stations serve 113 television markets that collectively reach approximately 36 percent of US television households. This portfolio includes 80 markets with the top-rated television station and 100 markets with the first and/or second highest rated television station. We also own video program companies Raycom Sports, Tupelo Honey, PowerNation Studios and Third Rail Studios.

Michael Kupinski, Director of Research, Equity Research Analyst, Digital, Media & Technology , Noble Capital Markets, Inc.

Jacob Mutchler, Research Associate, Noble Capital Markets, Inc.

Refer to the full report for the price target, fundamental analysis, and rating.

Solid Q3 results. The company reported Q3 revenue of $803 million, edging our estimate of $786 million by 2.2%. Notably, Adj. EBITDA in the quarter was a strong $210 million, handily surpassing our estimate of $179 million by 17.3%. Illustrated in Figure #1 Q3 Results. The quarter was driven by better than expected, high margin, political revenue and lower than expected corporate expenses. Importantly, political revenue in Q3 was $26 million, which beat our estimate of $15 million by 73%.

2024 outlook. In our view, the company stands to benefit from several favorable factors in the coming year. Notably, management increased political revenue guidance from $60 million to $80 million for full year 2023, which may indicate a strong election cycle in 2024. Additionally, the company has a history of surpassing expectations. Thus, we believe there could be positive upside in our 2024 estimates.


Get the Full Report

Equity Research is available at no cost to Registered users of Channelchek. Not a Member? Click ‘Join’ to join the Channelchek Community. There is no cost to register, and we never collect credit card information.

This Research is provided by Noble Capital Markets, Inc., a FINRA and S.E.C. registered broker-dealer (B/D).

*Analyst certification and important disclosures included in the full report. NOTE: investment decisions should not be based upon the content of this research summary. Proper due diligence is required before making any investment decision. 

Largo Inc. (LGO) – September-quarter results remain depressed but trends are starting to improve


Thursday, November 09, 2023

Largo has a long and successful history as one of the world’s preferred vanadium companies through the supply of its VPURE™ and VPURE+™ products, which are sourced from one of the world’s highest-grade vanadium deposits at the Company’s Maracás Menchen Mine in Brazil. Aiming to enhance value creation at Largo, the Company is in the process of implementing a titanium dioxide pigment plant using feedstock sourced from its existing operations in addition to advancing its U.S.-based clean energy division with its VCHARGE vanadium batteries. Largo’s VCHARGE vanadium batteries contain a variety of innovations, enabling an efficient, safe and ESG-aligned long duration solution that is fully recyclable at the end of its 25+ year lifespan. Producing some of the world’s highest quality vanadium, Largo’s strategic business plan is based on two pillars: 1.) leading vanadium supplier with an outlined growth plan and 2.) U.S.-based energy storage business support a low carbon future.

Michael Heim, Senior Vice President, Equity Research Analyst, Energy & Transportation, Noble Capital Markets, Inc.

Refer to the full report for the price target, fundamental analysis, and rating.

Volumes are down due to an accident and technical delays. However, management reports improved October results. Vanadium prices remain an issue, but the decline shows signs of abating. Management reports that input costs such as sodium carbonate are beginning to ease and that the company is actively working to lower costs at the mine and at Largo Clean Energy (LCE). 

Financial results remain depressed. The company has made several investments to improve operations including completing an infill drilling program. Completion of Largo’s Ilmenite plant and an initial shipment should not only improve profitability but also diversify sales. The company’s cash position remains adequate at $39.6 million to fund future operations. We would note that Largo’s debt position increased by $50 million year over year but was unchanged from June 30, 2023 levels.


Get the Full Report

Equity Research is available at no cost to Registered users of Channelchek. Not a Member? Click ‘Join’ to join the Channelchek Community. There is no cost to register, and we never collect credit card information.

This Company Sponsored Research is provided by Noble Capital Markets, Inc., a FINRA and S.E.C. registered broker-dealer (B/D).

*Analyst certification and important disclosures included in the full report. NOTE: investment decisions should not be based upon the content of this research summary. Proper due diligence is required before making any investment decision. 

GeoVax Labs, Inc. (GOVX) – 3Q23 Quarterly Report Includes 2024 Milestones


Thursday, November 09, 2023

GeoVax Labs, Inc. is a clinical-stage biotechnology company developing novel therapies and vaccines for solid tumor cancers and many of the world’s most threatening infectious diseases. The company’s lead program in oncology is a novel oncolytic solid tumor gene-directed therapy, Gedeptin®, presently in a multicenter Phase 1/2 clinical trial for advanced head and neck cancers. GeoVax’s lead infectious disease candidate is GEO-CM04S1, a next-generation COVID-19 vaccine targeting high-risk immunocompromised patient populations. Currently in three Phase 2 clinical trials, GEO-CM04S1 is being evaluated as a primary vaccine for immunocompromised patients such as those suffering from hematologic cancers and other patient populations for whom the current authorized COVID-19 vaccines are insufficient, and as a booster vaccine in patients with chronic lymphocytic leukemia (CLL). In addition, GEO-CM04S1 is in a Phase 2 clinical trial evaluating the vaccine as a more robust, durable COVID-19 booster among healthy patients who previously received the mRNA vaccines. GeoVax has a leadership team who have driven significant value creation across multiple life science companies over the past several decades.

Robert LeBoyer, Senior Vice President, Equity Research Analyst, Biotechnology, Noble Capital Markets, Inc.

Refer to the full report for the price target, fundamental analysis, and rating.

GeoVax Announces 2024 Milestones and 3Q23 Financial Results. GeoVax reported a 3Q23 loss of $8.4 million or $(0.32) per share. The company reviewed the progress made during the quarter, including completion of enrollment for the Phase 2 trial testing CM04S1 as a booster in healthy patients, presentation of data from the Phase 1/2 data for Gedeptin showing safety and tumor reduction, and addition of 3 new clinical sites for the Phase 2 trial for CM04S1 in immunocompromised patients.

CM04S1 Has Made Progress In Three Trials. Enrollment has been completed in the Phase 2 trial testing CM04S1 as a booster for healthy patients that had received the Pfizer or Moderna mRNA vaccines. An announcement of the top-line data is expected shortly. As discussed in our Research Note on September 25, a publication of data from the Phase 2 trial in immuno-compromised patients showed both humoral and cellular immune responses in patients that have difficulty responding to vaccination. Three new clinical sites were also added to the trial. An Investigator Initiated Trial (IIT) in chronic lymphocytic leukemia (CLL) is expected to announce interim data in the coming months. 


Get the Full Report

Equity Research is available at no cost to Registered users of Channelchek. Not a Member? Click ‘Join’ to join the Channelchek Community. There is no cost to register, and we never collect credit card information.

This Company Sponsored Research is provided by Noble Capital Markets, Inc., a FINRA and S.E.C. registered broker-dealer (B/D).

*Analyst certification and important disclosures included in the full report. NOTE: investment decisions should not be based upon the content of this research summary. Proper due diligence is required before making any investment decision. 

EuroDry (EDRY) – September-quarter results


Thursday, November 09, 2023

EuroDry Ltd. was formed on January 8, 2018 under the laws of the Republic of the Marshall Islands to consolidate the drybulk fleet of Euroseas Ltd. into a separate listed public company. EuroDry was spun-off from Euroseas Ltd. on May 30, 2018; it trades on the NASDAQ Capital Market under the ticker EDRY. EuroDry operates in the dry cargo, drybulk shipping market. EuroDry’s operations are managed by Eurobulk Ltd., an ISO 9001:2008 and ISO 14001:2004 certified affiliated ship management company and Eurobulk (Far East) Ltd. Inc., which are responsible for the day- to-day commercial and technical management and operations of the vessels. EuroDry employs its vessels on spot and period charters and under pool agreements.

Michael Heim, Senior Vice President, Equity Research Analyst, Energy & Transportation, Noble Capital Markets, Inc.

Refer to the full report for the price target, fundamental analysis, and rating.

Shipping rates weren’t as bad as expected. The average TCE rate for the 2023-3Q was $12,126 down 37% but better than our forecast. Operating costs declined relative to last year with the sale of an older vessel. Costs will rise in future quarters with the addition of three ships. Financing costs rose due to higher interest rates. The company will add $30 million in debt as part of the ship acquisition, financing and additional $18 million from cash on hand. With shipping rates above expectations and operating costs below expectations, EBITDA and earnings surpassed our estimates.

What’s did we learn this quarter: EuroDry repurchased approximately 52,000 shares during the quarter at an an average price of $14.43. Several ships were rechartered at favorable rates, most notably the Alexadros P ($24,500 for the December quarter versus $9,450 in the September quarter). Management believes its recent partnership arrangement establishes the company as an investment partner amongst private investors. The implication is that future such arrangements are likely. Management estimates a net asset value of $51.47, significantly above the current stock price of approximately $15 per share. The company will continue replacing older vessels with new vessels. It would like to see the market improve over the next few years before selling older vessels.


Get the Full Report

Equity Research is available at no cost to Registered users of Channelchek. Not a Member? Click ‘Join’ to join the Channelchek Community. There is no cost to register, and we never collect credit card information.

This Research is provided by Noble Capital Markets, Inc., a FINRA and S.E.C. registered broker-dealer (B/D).

*Analyst certification and important disclosures included in the full report. NOTE: investment decisions should not be based upon the content of this research summary. Proper due diligence is required before making any investment decision. 

CoreCivic, Inc. (CXW) – Post Call Commentary – Improving Environment


Thursday, November 09, 2023

CoreCivic is a diversified, government-solutions company with the scale and experience needed to solve tough government challenges in flexible, cost-effective ways. We provide a broad range of solutions to government partners that serve the public good through high-quality corrections and detention management, a network of residential and non-residential alternatives to incarceration to help address America’s recidivism crisis, and government real estate solutions. We are the nation’s largest owner of partnership correctional, detention and residential reentry facilities, and believe we are the largest private owner of real estate used by government agencies in the United States. We have been a flexible and dependable partner for government for nearly 40 years. Our employees are driven by a deep sense of service, high standards of professionalism and a responsibility to help government better the public good. Learn more at www.corecivic.com.

Joe Gomes, Managing Director, Equity Research Analyst, Generalist , Noble Capital Markets, Inc.

Joshua Zoepfel, Research Associate, Noble Capital Markets, Inc.

Refer to the full report for the price target, fundamental analysis, and rating.

ICE Pops Still Increasing. ICE detainee population grew to 36,845 at the end of the Federal government fiscal year, up from 35,289 in the prior week and press reports indicate the current population is closer to 40,000. CoreCivic ICE pops grew from 8,200 at the end of July, to 8,900 at the end of August, to 10,300 at the end of September and were up to 11,800 on Monday.

Positive Impact. The increasing ICE populations, if maintained, will benefit operating results to a greater extent in 4Q than they did in 3Q as many of CoreCivic’s ICE facilities reached the minimum guarantee level by the end of the third quarter. This should result in greater revenue and margin dollar growth for the Safety segment in 4Q23.


Get the Full Report

Equity Research is available at no cost to Registered users of Channelchek. Not a Member? Click ‘Join’ to join the Channelchek Community. There is no cost to register, and we never collect credit card information.

This Company Sponsored Research is provided by Noble Capital Markets, Inc., a FINRA and S.E.C. registered broker-dealer (B/D).

*Analyst certification and important disclosures included in the full report. NOTE: investment decisions should not be based upon the content of this research summary. Proper due diligence is required before making any investment decision. 

Alvopetro Energy (ALVOF) – Results near expectations with volumes preannounced and pricing set


Thursday, November 09, 2023

Alvopetro Energy Ltd.’s vision is to become a leading independent upstream and midstream operator in Brazil. Our strategy is to unlock the on-shore natural gas potential in the state of Bahia in Brazil, building off the development of our Caburé natural gas field and our strategic midstream infrastructure.

Michael Heim, Senior Vice President, Equity Research Analyst, Energy & Transportation, Noble Capital Markets, Inc.

Refer to the full report for the price target, fundamental analysis, and rating.

Alvopetro reported 2023-3Q net income of $5.8 million or $0.15 per diluted share. Results were slightly below our projections for net income of $6.3 million, or $0.17 per share. Sales were $12.3 million versus our $11.8 million estimate. With sales volume preannounced on a monthly basis and natural gas prices (95% of sales) preset by Alvopetro’s Gas Sales Agreement, there is little variance to expectations.

Production costs per unit rose explaining the slightly lower-than-expected results. Production expenses per barrel of oil equivalent (BOE) produced were $6.52 versus $3.34 last year and $5.77 last quarter. We attribute the rise to lower production volume and do not view it as an area of concern. Operating netbacks (realized prices less royalties and production costs) were $70.34 per BOE up from $59.83 last year and $67.46 last quarter. Higher netbacks reflect a natural gas price reset in February and August that increased pricing as well as a decrease in royalty costs.


Get the Full Report

Equity Research is available at no cost to Registered users of Channelchek. Not a Member? Click ‘Join’ to join the Channelchek Community. There is no cost to register, and we never collect credit card information.

This Company Sponsored Research is provided by Noble Capital Markets, Inc., a FINRA and S.E.C. registered broker-dealer (B/D).

*Analyst certification and important disclosures included in the full report. NOTE: investment decisions should not be based upon the content of this research summary. Proper due diligence is required before making any investment decision. 

Virgin Galactic Stock Up 30% on Cost Cutting Initiative

Shares of Virgin Galactic Holdings Inc. (SPCE) surged over 30% on Thursday after the company unveiled plans to reduce costs and temporarily pause spaceflight operations. The stock jumped from $1.56 to over $2 as investors reacted positively to Virgin Galactic’s aim to conserve cash while developing its next generation of spaceships.

Virgin Galactic announced it will wind down flights of its existing VSS Unity spacecraft in mid-2024. The company will then focus resources on finalizing assembly of its new Delta class spaceship line.

The Delta class ships represent the future of Virgin Galactic’s space tourism business. Pausing VSS Unity flights will allow engineers to concentrate on getting the Delta fleet ready to fly tourists on suborbital trips to the edge of space.

Cutting Costs to Fund New Spaceships

To finance the spaceship transition, Virgin Galactic is cutting costs substantially. This week the company laid off around 18% of its workforce, about 185 employees. The reductions will generate $25 million in annual cost savings.

The job cuts come as Virgin looks to trim expenses and streamline operations during the fleet transition. Management aims to direct as much capital as possible toward completing work on the Delta class vessels.

Virgin Galactic also announced it will reduce the flight rate of its current VSS Unity ship. Since June, VSS Unity has been flying commercial tourist missions roughly once per month. Going forward it will shift to quarterly flights before fully standing down in 2024.

Fewer VSS Unity flights will conserve rocket fuel and other operating costs. These savings can be redirected to accelerate progress on the new generation Delta ships.

VSS Unity Flights Winding Down

VSS Unity began commercial service in July 2021 and has completed five revenue-generating passenger flights so far. It will continue making quarterly trips to the fringes of space until its retirement in mid-2024.

So far this year VSS Unity flew its first fully private astronaut mission in June. This was followed by its first Italian researcher flight in September. Both missions generated crucial revenue for Virgin Galactic.

But VSS Unity is only capable of flying four passengers to space on each trip. The Delta class spacecraft will increase that capacity to six passengers. This 50% bump is critical to ramping up Virgin’s space tourism business.

The company is aiming to begin Delta test flights from its New Mexico spaceport in 2025. With a smoother flight profile and more spacious cabin, the Delta promises a superior overall experience compared to VSS Unity.

Stock Surges on Cash Conservation Plan

Virgin Galactic’s shares have suffered in 2022, falling over 50% year-to-date before Thursday’s 30% pop. The market responded favorably to management’s decisive actions to reinforce its financial position.

The workforce reductions and spaceflight pause will slow Virgin’s cash burn rate while buying time to ready the Delta fleet. With its existing cash balance, the company has ample runway to execute the transition.

Pausing VSS Unity flights will allow Virgin to upgrade ground infrastructure at its spaceport to support Delta operations. By winding down one program and preparing for the next, Virgin Galactic hopes to hit the ground running once the Delta ships are flight ready.

If executed successfully, the cost cutting and spaceflight hiatus could put Virgin in position to ramp up flights profitably after the Delta class ships come online. With improved ships unlocking expanded market opportunities, Virgin Galactic aims to soar both literally and financially over the long term.

Apollo Medical Scales Medicaid Presence with Purchase of CFC

Healthcare investor favorite Apollo Medical Holdings (NASDAQ: AMEH) is expanding its presence in value-based care arrangements through the acquisition of Community Family Care (CFC), a large independent physician association based in Los Angeles. The all-cash deal worth up to $202 million reflects ApolloMed’s strategy of targeting risk-bearing providers as a high-growth segment of the health biotech sector.

CFC manages care for over 200,000 members via its network of more than 350 primary care physicians and 500 specialists. The group has a strong presence in Medicaid, with a Restricted Knox Keene (RKK) license enabling it to take on full risk for this population in California. CFC also serves Medicare and commercial members under value-based contracts that incentivize providers to control costs and improve health outcomes.

For ApolloMed, acquiring CFC significantly boosts its portfolio of managed lives, particularly under global capitation arrangements that cover total cost of care. Additionally, CFC’s long track record of profitability in Medicaid provides ApolloMed with demonstrated capabilities to take on risk successfully in a population that is often challenging for providers.

The deal exemplifies a unique competitive edge for ApolloMed – its end-to-end platform spanning technology, management services, and risk contracting. CFC has utilized ApolloMed’s care enablement tools since 2020, allowing it to perform well under value-based care. Now, full acquisition enables tight integration and aligned incentives as CFC transitions to an ApolloMed care partner responsible for total cost and outcomes.

For 2023, CFC is expected to generate $190 million in revenue with $25 million in adjusted EBITDA, an impressive 13% margin for a risk-bearing provider group. ApolloMed has agreed to an acquisition price of up to $202 million, including $152 million in cash, $20 million in ApolloMed stock, and $30 million in potential milestone payments. The deal is anticipated to close in Q1 2024 after clearing regulatory reviews.

Rapid Growth in Value-Based Care

The acquisition comes at a time of rapid expansion in value-based care, where providers take on financial accountability for cost and quality of healthcare for a population of patients. Government and commercial payers are pushing providers into these arrangements to incentivize focus on preventative care and eliminating wasteful spending.

Analysts size the global market for value-based care at $3.1 billion by 2030, reflecting a blistering compound annual growth rate of 21.7% from 2022. In the United States, value-based care penetration is expected to reach 65% of healthcare payments by 2025.

ApolloMed is positioned at the forefront of this transformation with its integrated platform and focus on enabling providers, such as CFC, to take on risk successfully. The CFC deal adds a sizable value-based care presence to ApolloMed’s portfolio, demonstrating the appetite to aggressively scale its model with like-minded partners.

Targeting High-Growth Segments

The CFC acquisition also highlights ApolloMed’s focus on areas of healthcare with strong secular tailwinds: government programs and risk-based arrangements.

Medicaid represents a massive $650 billion total addressable market, and ApolloMed is specifically targeting expansion in California, which has among the most progressive Medicaid programs in supporting coordinated care models. CFC’s strong capabilities in the Medicaid population will be a key strategic asset.

Likewise, ApolloMed’s thesis of investing behind risk-bearing providers is underscored by CFC’s demonstrated ability to generate double-digit margins while managing patients under capitated contracts. As fee-for-service reimbursement models decline, providers capable of taking on risk will be increasingly valuable.

Wall Street’s View

ApolloMed has been a darling of growth investors, with shares up 270% over the past five years. Revenue and EBITDA have compounded annually at 50% and 90%, respectively, as the company scales its platform.

The market continues to reward this rapid expansion, with ApolloMed trading at a premium valuation of 50x P/E. Bulls believe the company’s strategy and competitive moats position it for continued acceleration as value-based care proliferates.

Meanwhile, bears argue that ApolloMed’s nosebleed valuation leaves little room for error. There are also concerns around rising fragmentation in California’s Medicaid market challenging operators.

However, with impressive unit economics and strong execution thus far, ApolloMed has many convinced it can maintain momentum. The CFC deal offers further validation of the company’s model and market opportunity. Investors will be watching closely for successful integration and financial accretion.

If ApolloMed can effectively leverage CFC to penetrate Medicaid and value-based arrangements more deeply, the deal may be looked back upon as an inflection point in the company’s growth story. At minimum, it provides another data point for ApolloMed’s ability to execute on acquisitions rapidly expanding its national footprint – a core piece of the bull thesis.

BigBear.ai Makes Bold Move to Lead Vision AI Industry with Acquisition of Pangiam

BigBear.ai, a provider of AI-powered business intelligence solutions, has announced the acquisition of Pangiam, a leader in facial recognition and biometrics, for approximately $70 million in an all-stock deal. The acquisition represents a major strategic move by BigBear.ai to expand its capabilities and leadership in vision artificial intelligence (AI).

Vision AI refers to AI systems that can perceive, understand and interact with the visual world. It includes capabilities like image and video analysis, facial recognition, and other computer vision applications. Vision AI is considered one of the most promising and rapidly growing AI segments.

With the acquisition, BigBear.ai makes a big bet on vision AI and aims to create one of the industry’s most comprehensive vision AI portfolios. Pangiam’s facial recognition and biometrics technologies will complement BigBear.ai’s existing computer vision capabilities.

Major Boost to Government Business

A key rationale and benefit of the deal is expanding BigBear.ai’s business with U.S. government defense and intelligence agencies. The company currently serves 20 government customers with its predictive analytics solutions. Adding Pangiam’s technology and expertise will open significant new opportunities.

Pangiam brings an impressive customer base that includes the Department of Homeland Security, U.S. Customs and Border Protection, and major international airports. Its vision AI analytics help these customers streamline operations and enhance security.

According to Mandy Long, BigBear.ai CEO, the combined entity will be able to “pursue larger customer opportunities” in the government sector. Leveraging Pangiam’s portfolio is expected to result in larger contracts for expanded vision AI services.

CombiningComplementary Vision AI Technologies

Technologically, the acquisition enables BigBear.ai to provide comprehensive vision AI solutions. Pangiam’s strength lies in near-field applications like facial recognition and biometrics. BigBear.ai has capabilities in far-field vision AI that analyzes wider environments.

Together, the combined portfolio covers the full spectrum of vision AI’s possibilities. BigBear.ai notes this full stack capability will be unique in the industry, giving the company an edge over other players.

The vision AI integration also unlocks new potential for BigBear.ai’s existing government customers. Its current predictive analytics solutions can be augmented with Pangiam’s facial recognition and biometrics tools. This builds on the company’s strategy to cross-sell new capabilities to established customers.

Long describes the alignment of Pangiam and BigBear.ai’s vision AI prowess as a key factor that will “vault solutions currently available in market.” The combined innovation assets create opportunities to push vision AI technology forward and build next-generation solutions.

Fast-Growing Market Opportunities

The acquisition comes as vision AI represents a $20 billion market opportunity predicted to grow at over 20% CAGR through 2030. It is one of the most dynamic segments within the booming AI industry.

With Pangiam under its wing, BigBear.ai is making a major play for leadership in this high-potential space. The new capabilities and customer reach significantly expand its addressable market in areas like government, airports, identity verification, and border security.

BigBear.ai also gains vital talent and IP to enhance its vision AI research and development efforts. This will help fuel its ability to bring new innovations to customers seeking advanced vision AI systems.

In a statement, BigBear.ai CEO Mandy Long called the merger a “holy grail” deal that delivers full spectrum vision AI capabilities spanning near and far field environments. It positions the newly combined company to capitalize on surging market demand from government and commercial sectors.

The proposed $70 million acquisition shows BigBear.ai is putting its money where its mouth is in terms of dominating the up-and-coming vision AI arena. With Pangiam’s tech and talent on board, BigBear.ai aims to aggressively pursue larger opportunities and cement its status as an industry frontrunner.

Release – The ODP Corporation Announces Third Quarter 2023 Results

Research News and Market Data on ODP

PDF Version

Low-Cost Business Model and Disciplined Capital Allocation Drive Solid Operating Performance and Strong EPS Growth

Third Quarter Revenue of $2 Billion with GAAP EPS of $1.79; Adjusted EPS of $1.88

GAAP Operating Income of $91 Million; GAAP Net Income of $70 Million; Adjusted EBITDA of $125 Million

Repurchased $32 Million of Shares in the Third Quarter of 2023

Updates Full-Year 2023 Guidance

BOCA RATON, Fla.–(BUSINESS WIRE)–Nov. 8, 2023– The ODP Corporation (“ODP,” or the “Company”) (NASDAQ:ODP), a leading provider of products, services, and technology solutions to businesses and consumers, today announced results for the third quarter ended September 30, 2023.

Consolidated (in millions, except per share amounts)3Q233Q22YTD23YTD22
Selected GAAP and Non-GAAP measures:    
Sales$2,009$2,172$6,025$6,385
Sales change from prior year period(8)% (6)% 
Operating income$91$84$232$188
Adjusted operating income (1)$95$95$247$238
Net income from continuing operations$70$67$176$142
Diluted earnings per share from continuing operations$1.79$1.36$4.38$2.84
Adjusted net income from continuing operations (1)$73$73$187$177
Adjusted earnings per share from continuing operations (fully diluted) (1)$1.88$1.48$4.66$3.54
Adjusted EBITDA (1)$125$131$342$347
Operating Cash Flow from continuing operations$112$163$261$79
Free Cash Flow (2)$86$138$183$11
Adjusted Free Cash Flow (3)$89$160$192$54

Third Quarter 2023 Summary(1)(2)(3)

  • Total reported sales of $2.0 billion, down 8% versus the prior year, primarily due to lower sales in its Office Depot consumer division, largely driven by 71 fewer retail locations in service compared to the prior year, as well as lower retail and online consumer traffic and transactions
  • GAAP operating income of $91 million and net income from continuing operations of $70 million, or $1.79 per diluted share, versus $84 million and $67 million, respectively, or $1.36 per diluted share, in the prior year
  • Adjusted operating income of $95 million, flat compared to the third quarter of 2022; adjusted EBITDA of $125 million, compared to $131 million in the third quarter of 2022
  • Adjusted net income from continuing operations of $73 million, or adjusted diluted earnings per share from continuing operations of $1.88, versus $73 million or $1.48, respectively, in the prior year
  • Operating cash flow from continuing operations of $112 million and adjusted free cash flow of $89 million, versus $163 million and $160 million, respectively, in the prior year
  • Repurchased 659 thousand shares at a cost of $32 million in the third quarter of 2023
  • $1.2 billion of total available liquidity including $384 million in cash and cash equivalents at quarter end

“I am extremely impressed seeing the day-to-day commitment and exceptional execution from our team as I fulfill Chief Executive Officer Gerry Smith’s responsibilities while he is on medical leave,” said Joseph Vassalluzzo, ODP’s chairman of the board. “In the quarter, our team delivered strong operating income and earnings per share results against a challenging economic backdrop, reflecting our unwavering commitment to operational excellence and to our low-cost business model approach.

“We continue to make progress across our four business units as we execute our three horizons strategy. This included expanding margins at ODP Business Solutions, new product testing and category expansion at Office Depot, securing new third-party customers at Veyer while remaining on track to more than double third-party EBITDA this year, and enhancing our platform and customer engagement at Varis.

“Our shareholder value creation formula, which integrates operational excellence with a shareholder-focused capital allocation plan, including the repurchase of approximately $32 million of shares during the quarter, contributed to a meaningful year-over-year increase in adjusted earnings per share for the third quarter and revised upward EPS guidance for the full year,” Vassalluzzo added.

“As we look ahead, we anticipate the macroeconomic environment to remain challenging throughout the remainder of the year. However, we are confident in our position of strength and will continue to focus on driving value for shareholders through our low-cost business model, leveraging our multiple routes to market, and continuing with our disciplined capital allocation,” Vassalluzzo concluded.

Consolidated Results

Reported (GAAP) Results

Total reported sales for the third quarter of 2023 were $2 billion, a decrease of 8% compared with the same period last year. This was driven primarily by lower sales in its consumer division, Office Depot, primarily due to 71 fewer stores in service compared to last year related to planned store closures, as well as lower retail and online consumer traffic. Sales at ODP Business Solutions Division were down slightly compared to last year, largely driven by slower return to office trends and lower sales of technology products. Meanwhile, Veyer provided strong logistics support for the ODP Business Solutions and Office Depot Divisions, and continued to capture additional demand for its supply chain and procurement solutions among other third-party customers.

The Company reported operating income of $91 million in the third quarter of 2023, up 8% compared to operating income of $84 million in the prior year period. Operating results in the third quarter of 2023 included $4 million of charges. These charges consisted primarily of $3 million associated with non-cash asset impairments largely related to the operating lease right-of-use (ROU) assets associated with the Company’s retail store locations. Net income from continuing operations was $70 million, or $1.79 per diluted share in the third quarter of 2023, up from $67 million, or $1.36 per diluted share in the third quarter of 2022.

Adjusted (non-GAAP) Results(1)

Adjusted results for the third quarter of 2023 exclude charges and credits totaling $4 million as described above and the associated tax impacts.

  • Third quarter of 2023 adjusted EBITDA was $125 million compared to $131 million in the prior year period. This included depreciation and amortization of $28 million and $32 million in the third quarters of 2023 and 2022, respectively
  • Third quarter of 2023 adjusted operating income was $95 million, flat compared to the third quarter of 2022
  • Third quarter of 2023 adjusted net income from continuing operations was $73 million, or $1.88 per diluted share, compared to $73 million, or $1.48 per diluted share, in the third quarter of 2022, an increase of 27% on a per share basis

Division Results

ODP Business Solutions Division

Leading B2B distribution solutions provider serving small, medium and enterprise level companies with an annual trailing-twelve-month revenue in excess of $4 billion

  • Reported sales were $1.0 billion in the third quarter of 2023, down approximately 3% compared to the same period last year primarily related to lower sales of technology products and weaker macroeconomic conditions
  • Stronger sales in cleaning and breakroom supplies were more than offset by lower sales of technology and core supplies
  • Total adjacency category sales, including cleaning and breakroom, furniture, technology, and copy and print, were 44% of total ODP Business Solutions’ sales
  • Continued strong pipeline and net new business customer additions
  • Operating income was $56 million in the third quarter of 2023, up 17% over the same period last year, related primarily to higher gross margins. As a percentage of sales, operating income margin was 6%, up 90 basis points compared to the same period last year

Office Depot Division

Leading provider of retail consumer and small business products and services distributed via Office Depot and OfficeMax retail locations and an award-winning eCommerce presence

  • Reported sales were $1.0 billion in the third quarter of 2023, down 12% compared to the prior year period partially due to 71 fewer retail outlets in service associated with planned store closures, as well as lower demand relative to last year in certain product categories, softer back-to-school seasonal demand, and lower online sales. The Company closed 14 retail stores in the quarter and had 938 stores at quarter end. Sales were down approximately 6% on a comparable store basis
  • Stronger sales of copy and print services were more than offset by lower sales in supplies, technology, and other categories
  • Store and online traffic were lower year over year due to a greater percentage of customers having returned to the office post pandemic, as well as weaker macroeconomic activity
  • Operating income was $66 million in the third quarter of 2023, compared to operating income of $83 million during the same period last year, driven primarily by the flow through impact from lower sales. As a percentage of sales, operating income was 7%, flat compared to the same period last year.

Veyer Division

Veyer is a supply chain, distribution, procurement and global sourcing operation with over 35 years of experience and proven leadership, supporting Office Depot and ODP Business Solutions, as well as third-party customers. Veyer’s assets and capabilities include 8 million square feet of infrastructure through a nationwide network of distribution centers, cross-docks, and other facilities throughout the United States; a global sourcing presence in Asia; a large private fleet of vehicles; and next-day delivery to 98.5% of US population

  • In the third quarter of 2023, Veyer provided strong support for its internal customers, ODP Business Solutions and Office Depot, as well as for its third-party customers, generating sales of $1.3 billion
  • Operating income was $10 million in the third quarter of 2023, up from $9 million in the prior year period related to the favorable impacts of higher sales to external third parties and lower product costing
  • In the quarter relative to last year, sales and EBITDA generated from third party customers was up 57% and 119% respectively, resulting in sales of approximately $11 million and EBITDA of $3 million in the quarter

Varis Division

Varis is a tech-enabled B2B indirect procurement marketplace launched in the fourth quarter of 2022, which provides buyers and suppliers a seamless way to transact through the platform’s consumer-like buying experience and advanced spend management tools

  • Successfully launched the platform in the fourth quarter of 2022; adding and on-boarding new customers, incorporating feedback, and adding new features and capabilities to the platform
  • Varis generated revenues in the third quarter of 2023 of $2 million, flat compared to the third quarter of 2022
  • Operating loss was $17 million, flat compared to the third quarter of 2022, as the division continued to enhance its platform and onboard new customers

Share Repurchases

The Company continued to execute under its previously announced $1 billion share repurchase authorization, available through year-end 2025. During the third quarter of 2023, the Company repurchased 659 thousand shares at a cost of $32 million. Since the inception of the authorization beginning in November 2022, the Company has repurchased 9 million shares for approximately $420 million.

The number of shares to be repurchased in the future and the timing of such transactions will depend on a variety of factors, including market conditions, regulatory requirements, and other corporate considerations. The current authorization could be suspended or discontinued at any time as determined by the Board of Directors.

Balance Sheet and Cash Flow

As of September 30, 2023, ODP had total available liquidity of approximately $1.2 billion, consisting of $384 million in cash and cash equivalents and $771 million of available credit under the Third Amended Credit Agreement. Total debt was $173 million.

For the third quarter of 2023, cash generated by operating activities of continuing operations was $112 million, which included $3 million in restructuring and other spend, compared to cash provided by operating activities of continuing operations of $163 million in the third quarter of the prior year, which included $22 million in restructuring and other spend. The year-over-year change in operating cash flow is largely related to the timing of certain working capital items.

Capital expenditures in the third quarter of 2023 and 2022 were $25 million, reflecting continued growth investments in the Company’s digital transformation, distribution network, and eCommerce capabilities. Adjusted Free Cash Flow(3) was $89 million in the third quarter of 2023, compared to $160 million in the prior year period.

“I would like to recognize our entire team for their commitment and dedication in managing inventory and working capital, which has resulted in another quarter of strong cash flow generation,” said Anthony Scaglione, executive vice president and chief financial officer of The ODP Corporation. “As we work to close out the year, we maintain our disciplined approach, focusing on managing costs, maximizing cash flow, and executing our capital allocation plan,” Scaglione added.

Updated 2023 Expectations

“Our team’s unwavering commitment to delivering value is evident in our compelling customer proposition, strong free cash flow generation, and strategic capital allocation for the benefit of our shareholders,” highlighted Vassalluzzo. “While we acknowledge the influence of the challenging macroeconomic environment on consumer and business activity, we remain steadfast in our dedication to driving long-term value within our business through effective execution of our three horizons strategy.”

The Company’s full year guidance for 2023 included in this release includes non-GAAP measures, such as Adjusted EBITDA, Adjusted Operating Income, Adjusted Earnings per Share and Adjusted Free Cash Flow. These measures exclude charges or credits not indicative of core operations, which may include but not be limited to merger integration expenses, restructuring charges, acquisition-related costs, executive transition costs, asset impairments and other significant items that currently cannot be predicted without unreasonable efforts. The exact amount of these charges or credits are not currently determinable but may be significant. Accordingly, the Company is unable to provide equivalent GAAP measures or reconciliations from GAAP to non-GAAP for these financial measures without unreasonable effort.

The Company is updating its full year guidance for 2023 as follows:

 Previous 2023 GuidanceUpdated 2023 Guidance
SalesApproximately $8 billionRevised to $7.8 – $7.9 billion
Adjusted EBITDA$400 – $430 millionAffirmed
Adjusted Operating Income$270 – $300 millionRevised to $280 – $310 million
Adjusted Earnings per Share(*)$5.00 – $5.30 per shareRevised to $5.30 – $5.60 per share
Adjusted Free Cash Flow(**)$200 – $230 millionAffirmed
Capital Expenditures$100 – $120 millionAffirmed
*Adjusted Earnings per Share (EPS) guidance for 2023 includes tax benefits related to R&D and employee-related tax credits and includes expected impact from share repurchases 
  
**Adjusted Free Cash Flow is defined as cash flows from operating activities less capital expenditures excluding cash charges associated with the Company’s Maximize B2B Restructuring and expenses incurred in connection with our previously planned separation of the consumer business and re-alignment 

“Our year-to-date performance speaks to the resilience of our team and the strength of our low-cost business model and capital allocation approach,” said Scaglione. “While the weaker macroeconomic conditions have impacted the level of consumer and business activity creating top-line headwinds, our continued focus on operational excellence has us well positioned to continue driving strong operating results as we close out the year. Our updated guidance assumes a consistent overall macroeconomic environment and reflects our year-to-date revenue trends, while increasing our outlook for adjusted operating income and adjusted EPS.

Our increased adjusted EPS outlook also assumes a lower full-year effective tax rate driven by the execution of certain tax credits, lower than anticipated interest expense associated with projected intra-quarter ABL borrowings, and the impact from our continued share buyback activity,” Scaglione added.

The ODP Corporation will webcast a call with financial analysts and investors on November 8, 2023, at 9:00 am Eastern Time, which will be accessible to the media and the general public. To listen to the conference call via webcast, please visit The ODP Corporation’s Investor Relations website at investor.theodpcorp.com. A replay of the webcast will be available approximately two hours following the event.

(1)As presented throughout this release, adjusted results represent non-GAAP financial measures and exclude charges or credits not indicative of core operations and the tax effect of these items, which may include but not be limited to merger integration, restructuring, acquisition costs, and asset impairments. Reconciliations from GAAP to non-GAAP financial measures can be found in this release as well as on the Company’s Investor Relations website at investor.theodpcorp.com.
(2)As used in this release, Free Cash Flow is defined as cash flows from operating activities less capital expenditures. Free Cash Flow is a non-GAAP financial measure and reconciliations from GAAP financial measures can be found in this release as well as on the Company’s Investor Relations website at investor.theodpcorp.com.
(3)As used in this release, Adjusted Free Cash Flow is defined as Free Cash Flow excluding cash charges associated with the Company’s Maximize B2B Restructuring, and expenses incurred in connection with our previously planned separation of the consumer business and re-alignment. Adjusted Free Cash Flow is a non-GAAP financial measure and reconciliations from GAAP financial measures can be found in this release as well as on the Company’s Investor Relations website at investor.theodpcorp.com.

About The ODP Corporation

The ODP Corporation (NASDAQ:ODP) is a leading provider of products, services, and technology solutions through an integrated business-to-business (B2B) distribution platform and omni-channel presence, which includes supply chain and distribution operations, dedicated sales professionals, a B2B digital procurement solution, online presence, and a network of Office Depot and OfficeMax retail stores. Through its operating companies ODP Business Solutions, LLC; Office Depot, LLC; Veyer, LLC; and Varis, Inc, The ODP Corporation empowers every business, professional, and consumer to achieve more every day. For more information, visit theodpcorp.com.

ODP and ODP Business Solutions are trademarks of ODP Business Solutions, LLC. Office Depot is a trademark of The Office Club, LLC. OfficeMax is a trademark of OMX, Inc. Veyer is a trademark of Veyer, LLC. Varis is a trademark of Varis, Inc. Grand&Toy is a trademark of Grand & Toy, LLC in Canada. ©2023 Office Depot, LLC. All rights reserved. Any other product or company names mentioned herein are the trademarks of their respective owners.

FORWARD LOOKING STATEMENTS

This communication may contain forward-looking statements within the meaning of the Private Securities Litigation Reform Act of 1995. These statements or disclosures may discuss goals, intentions and expectations as to future trends, plans, events, results of operations, cash flow or financial condition, the potential impacts on our business due to the unknown severity and duration of the COVID-19 pandemic, or state other information relating to, among other things, the Company, based on current beliefs and assumptions made by, and information currently available to, management. Forward-looking statements generally will be accompanied by words such as “anticipate,” “believe,” “plan,” “could,” “estimate,” “expect,” “forecast,” “guidance,” “expectations”, “outlook,” “intend,” “may,” “possible,” “potential,” “predict,” “project,” “propose” or other similar words, phrases or expressions, or other variations of such words. These forward-looking statements are subject to various risks and uncertainties, many of which are outside of the Company’s control. There can be no assurances that the Company will realize these expectations or that these beliefs will prove correct, and therefore investors and stakeholders should not place undue reliance on such statements.

Factors that could cause actual results to differ materially from those in the forward-looking statements include, among other things, highly competitive office products market and failure to differentiate the Company from other office supply resellers or respond to decline in general office supplies sales or to shifting consumer demands; competitive pressures on the Company’s sales and pricing; the risk that the Company is unable to transform the business into a service-driven, B2B platform that such a strategy will not result in the benefits anticipated; the risk that the Company will not be able to achieve the expected benefits of its strategic plans, including its strategic shift to maintain all of its businesses under common ownership; the risk that the Company may not be able to realize the anticipated benefits of acquisitions due to unforeseen liabilities, future capital expenditures, expenses, indebtedness and the unanticipated loss of key customers or the inability to achieve expected revenues, synergies, cost savings or financial performance; the risk that the Company is unable to successfully maintain a relevant omni-channel experience for its customers; the risk that the Company is unable to execute the Maximize B2B Restructuring Plan successfully or that such plan will not result in the benefits anticipated; failure to effectively manage the Company’s real estate portfolio; loss of business with government entities, purchasing consortiums, and sole- or limited-source distribution arrangements; failure to attract and retain qualified personnel, including employees in stores, service centers, distribution centers, field and corporate offices and executive management, and the inability to keep supply of skills and resources in balance with customer demand; failure to execute effective advertising efforts and maintain the Company’s reputation and brand at a high level; disruptions in computer systems, including delivery of technology services; breach of information technology systems affecting reputation, business partner and customer relationships and operations and resulting in high costs and lost revenue; unanticipated downturns in business relationships with customers or terms with the suppliers, third-party vendors and business partners; disruption of global sourcing activities, evolving foreign trade policy (including tariffs imposed on certain foreign made goods); exclusive Office Depot branded products are subject to additional product, supply chain and legal risks; product safety and quality concerns of manufacturers’ branded products and services and Office Depot private branded products; covenants in the credit facility; general disruption in the credit markets; incurrence of significant impairment charges; retained responsibility for liabilities of acquired companies; fluctuation in quarterly operating results due to seasonality of the Company’s business; changes in tax laws in jurisdictions where the Company operates; increases in wage and benefit costs and changes in labor regulations; changes in the regulatory environment, legal compliance risks and violations of the U.S. Foreign Corrupt Practices Act and other worldwide anti-bribery laws; volatility in the Company’s common stock price; changes in or the elimination of the payment of cash dividends on Company common stock; macroeconomic conditions such as higher interest rates and future declines in business or consumer spending; increases in fuel and other commodity prices and the cost of material, energy and other production costs, or unexpected costs that cannot be recouped in product pricing; unexpected claims, charges, litigation, dispute resolutions or settlement expenses; catastrophic events, including the impact of weather events on the Company’s business; the discouragement of lawsuits by shareholders against the Company and its directors and officers as a result of the exclusive forum selection of the Court of Chancery, the federal district court for the District of Delaware or other Delaware state courts by the Company as the sole and exclusive forum for such lawsuits; and the impact of the COVID-19 pandemic on the Company’s business. The foregoing list of factors is not exhaustive. Investors and shareholders should carefully consider the foregoing factors and the other risks and uncertainties described in the Company’s Annual Reports on Form 10-K, Quarterly Reports on Form 10-Q, and Current Reports on Form 8-K filed with the U.S. Securities and Exchange Commission. The Company does not assume any obligation to update or revise any forward-looking statements.

Tim Perrott
Investor Relations
561-438-4629
Tim.Perrott@theodpcorp.com

Source: The ODP Corporation