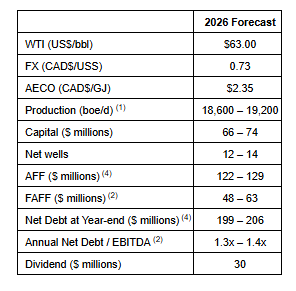
CALGARY AB, Feb. 24, 2026 /CNW/ – InPlay Oil Corp. (TSX: IPO) (OTCQX: IPOOF) (“InPlay” or the “Company”) announces that its Board of Directors have approved a capital program of $66 – $74 million for 2026.
InPlay had a stellar 2025 with an accretive and transformational acquisition in our core area and a very successful drilling program. Throughout 2025, InPlay delivered improved capital efficiencies through the successful application of enhanced drilling and completion techniques, driving production results that exceeded internally modelled type curves while achieving well costs below budget. InPlay’s improved capital efficiencies allowed the Company to increase its production guidance three times during 2025 with reduced capital spending.
InPlay’s 2026 capital budget reflects a disciplined and capital efficient program focused on strong production growth, maximizing Free Adjusted Funds Flow (“FAFF”)(2) and debt reduction. The Company plans to drill 12 – 14 net horizontal Cardium wells during 2026, with the majority of capital directed toward its Cardium-focused light oil assets in Pembina. InPlay’s 2026 capital budget reflects the improved capital efficiencies realized in 2025.
Key highlights of the 2026 capital program include:
Production Growth:
Forecasted average annual production of 18,600 – 19,200 boe/d(1) (60% – 62% light oil and NGLs), an 11% increase (based on mid-point) compared to estimated 2025, driven by:
Low corporate base decline rate of 22% due to the favorable decline profile;
Strong corporate netbacks driven by high oil and liquids weighting; and
Enhanced capital efficiencies from high graded drilling inventory.
FAFF Generation and Dividend Sustainability:
AFF(2) of $122 – $129 million;
FAFF of $48 – $63 million equating to a 11% – 15% FAFF Yield(3). FAFF exceeds the base annual dividend of $30 million (based on the current monthly dividend rate of $0.09/share or $1.08/share annualized) insulating the Company in the event of commodity price fluctuations.
InPlay’s dividend represents a dividend yield of approximately 7.0% at the current share price.
Debt Reduction:
Excess FAFF(3) is planned to be used to reduce debt;
Year-end Net Debt(2) of $199 – $206 million.
InPlay currently has forecasted commodity pricing similar to peers who have previously released 2026 guidance. To mitigate downside risk, InPlay has implemented a comprehensive hedging program providing protection against current market volatility. Details of the Company’s current hedges are provided in the “Hedging Summary” section of the Reader Advisories.
The table below outlines InPlay’s 2026 guidance:
In the first quarter of 2026, the Company plans to have its most active capital spend quarter of the year with five (5.0 net) horizontal wells being drilled. To date, InPlay has drilled and recently completed a two (2.0 net) ERH well-pad which have recently come on production. InPlay has also started drilling operations on a three (3.0 net) ERH well-pad which is expected to come on-line at the end of March. The majority of the capital spend on the remaining 7 – 9 net horizontal wells planned for the year is expected to occur in the second half of 2026.
InPlay continues to closely monitor global trade, geopolitical and commodity dynamics, proactively evaluating capital plans in response to pricing volatility, inflationary cost pressures, and other factors affecting the business. The Company will remain flexible and make decisions based on our core strategy of disciplined capital allocation, maintaining financial strength to ensure the long term sustainability of our strategy and return to shareholder program. Should commodity prices improve and stabilize, the Company will remain disciplined and flexible, with the ability to swiftly adjust its capital activity to align with evolving market conditions.
2025 Update
The Company is finalizing its results for 2025 and expects to achieve production of approximately 17,000 boe/d(1) (61% light crude oil and liquids) in line with the mid-point of our last forecast of 16,900 – 17,100 boe/d and 600 boe/d ahead of the mid-point of our original post acquisition forecast of 16,000 – 16,800 boe/d. In comparison to average production of 8,712 boe/d in 2024, production increased by approximately 95% in 2025.
Looking ahead after a transformation year with efficient capital spending, we remain focused on continued profitable development of our high-return asset base and are committed to delivering strong returns to shareholders through 2026 and beyond. On behalf of the management team and Board of Directors, we extend our gratitude to our employees, shareholders and bondholders for their support of the Company and the Canadian oil and gas industry.
NEW YORK–(BUSINESS WIRE)– Perfect Corp. (NYSE: PERF) (“Perfect” or the “Company”), a leading artificial intelligence (“AI”) company offering AI and augmented reality (“AR”) powered solutions to beauty, fashion, photo and video creative industries, today announced its unaudited financial results for the three months and the full year ended December 31, 2025.
Financial Results for the Three Months Ended December 31, 2025
Revenue
Total revenue was $18.1 million for the three months ended December 31, 2025, compared to $15.9 million in the same period of 2024, an increase of 14.2%. The increase was primarily due to strong growth momentum in the revenue of mobile app and web services subscriptions.
AI- and AR- cloud solutions and subscription revenue was $16.4 million for the three months ended December 31, 2025, compared to $15.1 million in the same period of 2024, an increase of 8.7%. The increase was driven by the continued revenue growth of YouCam mobile apps and web services subscriptions, the continued popularity among consumers of Generative AI technologies and AI editing features for photos and videos, and the stable demand for the Company’s online virtual product try-on solutions from brand customers.
Licensing revenue was $0.6 million for the three months ended December 31, 2025, compared to $0.5 million in the same period of 2024, an increase of 8.0%.
Others revenue was $1.2 million for the three months ended December 31, 2025, compared to $0.3 million in the same period of 2024, an increase of 286.1%. The increase was driven by the growth of virtual points purchased and consumed by end users. Virtual points are used for AI-powered services available on YouCam mobile apps and web services.
Gross Profit
Gross profit was $14.6 million for the three months ended December 31, 2025, compared with $11.8 million in the same period of 2024, an increase of 24.1%. Gross margin was 80.5% for the three months ended December 31, 2025, up from 74.1% in the same period of 2024. The increase in gross margin during this quarter was primarily due to the increased operational efficiency resulting from the ongoing realignment of engineering professionals as we continue to transition from customization of software toward more standardized AI solutions for our customer base.
Total Operating Expenses
Total operating expenses were $15.2 million for the three months ended December 31, 2025, compared with $12.2 million in the same period of 2024, an increase of 24.1%. The increase was primarily due to increases in research and development expenses and sales and marketing expenses, which were partially offset by a decrease in general and administrative expenses in the fourth quarter of 2025.
Sales and marketing expenses were $7.7 million for the three months ended December 31, 2025, compared to $6.9 million during the same period of 2024, an increase of 11.4%. This increase was primarily due to an increase in marketing events and advertising expenses related to our mobile apps and web services subscription.
Research and development expenses were $3.9 million for the three months ended December 31, 2025, compared to $2.8 million during the same period of 2024, an increase of 39.6%. The increase was primarily due to an increase in R&D headcount and related personnel costs including those arising from the acquisition of Wannaby Inc. (“Wannaby”), which was completed in January 2025.
General and administrative expenses were $1.5 million for the three months ended December 31, 2025, compared to $1.8 million during the same period of 2024, a decrease of 11.9%. The decrease was primarily due to reduced corporate insurance premium and external professional service fees.
Impairment loss on goodwill was $2.0 million for the three months ended December 31, 2025. No such impairment was recorded in the same period of 2024. This non-cash item increase was primarily due to the recognition of an impairment loss on goodwill arising from the acquisition of Wannaby in January 2025.
Operating Loss
Total operating loss was $0.6 million for the three months ended December 31, 2025, compared with an operating loss of $0.5 million in the same period of 2024, representing an increase of $0.1 million. The increase in operating loss was primarily driven by the recognition of an impairment loss of $2.0 million relating to goodwill arising from the acquisition of Wannaby in 2025.
Net Income
Net income was $0.1 million for the three months ended December 31, 2025, compared to $1.1 million during the same period of 2024, a decrease of 94.2%. The decrease in net income was primarily due to the recognition of an impairment loss of $2.0 million relating to goodwill arising from the acquisition of Wannaby in 2025 and the lower interest income resulting from a decline in interest rates.
Operating Cash Flow
Operating cash flow was $2.6 million for the three months ended December 31, 2025, compared to $3.3 million in the same period of 2024, a decrease of 21.6%.
Financial Results for the Year Ended December 31, 2025
Revenue
Total revenue was $69.2 million for the year ended December 31, 2025, compared to $60.2 million in the same period of 2024, an increase of 14.9%.
AI- and AR- cloud solutions and subscription revenue was $61.1 million for the year ended December 31, 2025, compared to $53.8 million in the same period of 2024, an increase of 13.5%. The increase was driven by the continued revenue growth of YouCam mobile apps and web services subscriptions.
Licensing revenue was $5.3 million for the year ended December 31, 2025, compared to $5.2 million in the same period of 2024, an increase of 1.7%.
Others revenue was $2.8 million for the year ended December 31, 2025, compared to $1.2 million in the same period of 2024, an increase of 133.8%. The increase was primarily driven by the growth of virtual points purchased and consumed by end users. Virtual points are used for AI-powered services available on YouCam mobile apps and web services.
Gross Profit
Gross profit was $53.5 million for the year ended December 31, 2025, compared with $46.9 million in the same period of 2024, an increase of 14.0%. Gross margin was 77.4% for the year ended December 31, 2025, a slight decrease compared to 78.0% in the same period of 2024.
Total Operating Expenses
Total operating expenses were $55.3 million for the year ended December 31, 2025, compared with $50.1 million in the same period of 2024, an increase of 10.3%. The increase was primarily due to increases in research and development expenses and sales and marketing expenses, which were partially offset by a decrease in general and administrative expenses during the same period.
Sales and marketing expenses were $30.8 million for the year ended December 31, 2025, compared to $28.2 million during the same period of 2024, an increase of 9.2%.
Research and development expenses were $15.4 million for the year ended December 31, 2025, compared to $12.0 million during the same period of 2024, an increase of 28.4%.
General and administrative expenses were $7.0 million for the year ended December 31, 2025, compared to $8.5 million during the same period of 2024, a decrease of 17.7%.
Impairment loss on goodwill was $2.0 million for the year ended December 31, 2025. No such impairment was recorded in the same period of 2024. This non-cash item increase was driven by the recognition of an impairment loss on goodwill arising from the acquisition of Wannaby in 2025.
Operating Loss
Total operating loss was $1.7 million for the year ended December 31, 2025, compared with an operating loss of $3.1 million in the same period of 2024, a decrease of $1.4 million. The decrease in operating loss was primarily driven by higher revenue and gross profit, with operating expenses growing at a more moderate pace, which was partially offset by recognition of an impairment loss of $2.0 million on goodwill arising from the acquisition of Wannaby in 2025.
Net Income
Net income was $4.6 million for the year ended December 31, 2025, compared to $5.0 million during the same period of 2024, a decrease of 7.5%.
Operating Cash Flow
Operating cash flow was $13.3 million for the year ended December 31, 2025, compared to $13.0 million in the same period of 2024, an increase of 2.3%. The Company continues to invest in growth while maintaining a healthy cash flow to support business operations underscoring the Company’s operational health and sustainability.
Capital Resource
As of December 31, 2025, the Company’s cash and cash equivalents remained stable at $126.0 million (or $172.4 million when including 6-month time deposits of $36.3 million and US Treasuries of $10.2 million, which are classified as current and non-current financial assets at amortized cost under IFRS, respectively), compared to $127.1 million (or $165.9 million when including time deposits and money market funds) as of December 31, 2024.
Key Business Metrics
The number of active subscribers for the Company’s YouCam mobile apps and web services was 908,000 as of December 31, 2025, compared to over 946,000 as of September 30, 2025, a decrease of 4.0%. This decline was a result of the mobile app subscription plan’s average selling price increase initiative introduced in early 2025, which strategically prioritized higher revenue per user and long-term monetization efficiency over short-term volume growth.
As of December 31, 2025, the Company’s cumulative customer base included 859 brand clients, with over 982,000 digital stock keeping units (“SKUs”) for makeup, haircare, skincare, shoes, bags, eyewear, watches and jewelry products, compared to 842 brand clients and over 953,000 digital SKUs as of September 30, 2025. The number of Key Customers 1 of the Company as of December 31, 2025 was 135 compared to 142 as of September 30, 2025. The decline in the number of Key Customers was primarily due to certain customers being downgraded as a result of lower spending during the period.
____________________
1
“Key Customers” refers to the Company’s brand customers who contributed revenue of more than $50,000 in the trailing 12 months ended on the measurement date.
CEO Remarks and Business Outlook for 2026
Ms. Alice H. Chang, Founder, Chairwoman, and Chief Executive Officer of Perfect Corp., commented, “Perfect Corp. closed 2025 on a strong note, exceeding our full-year guidance and demonstrating the strength of our execution. Our results for the year were driven primarily by continued growth in our B2C mobile apps and web service subscriber base, reflecting strong demand from individual beauty enthusiasts and consumers who value personalization, performance, and the ability to create customized content powered by generative AI. Our sustained focus on AI remains a core driver of innovation across the business, and this momentum positions us well as we enter the next phase of growth, with an increased focus on Agentic AI and API-based solutions.
“We continue to invest in the development of new products and services, including Generative AI beauty solutions, while driving greater operational efficiencies across the organization. This disciplined execution delivered strong revenue growth, a meaningful improvement in company operation, reduction of operating loss, and sustained cash flow generation. As a result, we ended 2025 with a strong cash position, providing the flexibility to invest strategically and support our long-term growth objectives. While the Company reported an operating loss for the period, this was primarily driven by an impairment loss of goodwill charge related to the acquisition of Wannaby. Excluding this non-cash item, the Company would have generated operating income for the fourth quarter and full year of 2025. Perfect Corp. will continue to work toward operating income under IFRS reporting standards in the near term, reflecting the scalability and discipline of its business model. Reaching this milestone would mark a pivotal moment in the Company’s journey, validating years of investment in platform development, AI innovation, and go-to-market execution.
“Our B2C app and web subscription business continues to be the primary driver of growth in 2025, with increases in both revenue per user and user engagement following the price adjustment implemented last year. While subscriber churn was modestly higher, we are seeing an increase in demand for AI-driven image and video editing and creation, reflecting a continued shift toward creativity and personalization powered by AI. Building on this momentum, we plan to introduce additional generative AI capabilities—such as more personalized interactions with our AI Agent and expanded video-mode support—further enhancing the functionality and value of our apps. Our YouCam app suite continues to set the standard for AI-powered creativity and self-expression, offering some of the most popular features in the market, including face reshaping, wrinkle removal, image-to-video, text-to-image, and image-to-image editing and creation. Central to these capabilities is YouCam’s AI Agent, powered by third party large language models (LLMs), which enables users to enhance and edit photos, generate videos, or create AI images simply from a text prompt. Together, these tools deliver a seamless, intelligent, and highly personalized experience that empowers users to express themselves in entirely new ways.
“Perfect’s Beauty AI Agent goes beyond a traditional LLM application by adding a purpose-built intelligence layer on top of the core model. Rather than relying solely on prompt engineering and linear processing, we apply context engineering to modularize inputs, classify intent, and route tasks through parallel sub-agents—resulting in faster response times, higher precision, and reduced hallucination risk. By combining Retrieval-Augmented Generation (RAG) with precision engineering, our agent doesn’t just talk; it can see, score, and recommend with proven accuracy across product virtual try-ons and skin analysis use cases. This architecture positions Perfect Corp. as a Beauty AI infrastructure, delivered through enterprise-grade Widgets, Software Development Kits (SDKs), and Application Programming Interfaces (APIs), and designed with brand safety, governance, and auditability at its core.
“As previously mentioned, our API business is steadily taking shape across multiple growth vectors. Since 2025, Perfect Corp. has built a comprehensive API suite supporting beauty, skin, jewelry, fashion, shoes and apparel industries. Firstly, our agency strategy allows us to act as a force multiplier by embedding our API-driven solutions directly into agency workflows, enabling faster deployment and broader reach. Secondly, we are expanding into new verticals, including the medical and dermatology segments, where our Skin AI technology enhances patient engagement through advanced visualization and personalized experiences. We are also extending our visual commerce capabilities beyond beauty, using virtual try-on to elevate product visualization across categories such as jewelry, shoes, watches, hair, and accessories, further diversifying our addressable market and long-term growth potential.
“Looking ahead to 2026, we see a strong outlook for our B2C apps and web service subscription business, while the B2B enterprise segment is expected to remain more cautious, with limited near-term growth. Against this backdrop, we are continuing our evolution from a tactical service provider to a strategic technology partner, focused on delivering durable, long-term value for our customers. What began as virtual try-on capabilities has expanded into a comprehensive visual commerce enablement platform, powered by Generative AI and an API-first architecture that integrates seamlessly into our partners’ ecosystems. At the same time, we are progressing beyond siloed point solutions toward a unified AI agent capable of operating across multiple roles—delivering a more intelligent, scalable, and impactful omni-solution for both consumers and brands.”
Business Outlook for 2026
Driven by continued revenue growth in both YouCam mobile apps and web service subscriptions, along with sustained demand for our enterprise solutions, the Company expects the full year 2026 total revenue to increase by approximately 10% with a range of plus or minus 2% compared to full year 2025. This forecast is based on the Company’s current assessment of the market and operational conditions, and that these factors are subject to change.
About Perfect Corp.
Founded in 2015, Perfect Corp. is a leading AI company offering self-developed AI- and AR- powered solutions dedicated to transforming the world with digital tech innovations that make your virtual world beautiful. On Perfect’s direct consumer business side, Perfect operates a family of YouCam consumer apps and web-editing services for photo, video and camera users, centered on unleashing creativity with AI-driven features for creation, beautification and enhancement. On Perfect’s enterprise business side, Perfect empowers major beauty, skincare, fashion, jewelry, and watch brands and retailers by supplying them with omnichannel shopping experiences through AR product try-ons and AI-powered skin diagnostics. With cutting-edge technologies such as Generative AI, real-time facial and hand 3D AR rendering and cloud solutions, Perfect enables a personalized, enjoyable, and engaging shopping journey and helps brands elevate customer engagement, increase conversion rates, and propel sales growth. Throughout this journey, Perfect maintains its unwavering commitment to environmental sustainability and fulfilling social responsibilities. For more information, visit https://ir.perfectcorp.com/.
Forward-Looking Statements
This communication contains forward-looking statements within the meaning of Section 27A of the U.S. Securities Act of 1933, as amended, or the Securities Act, and Section 21E of the U.S. Securities Exchange Act of 1934, as amended, or the Exchange Act, that are based on beliefs and assumptions and on information currently available to Perfect. In some cases, you can identify forward-looking statements by the following words: “may,” “will,” “could,” “would,” “should,” “expect,” “intend,” “plan,” “anticipate,” “believe,” “estimate,” “predict,” “project,” “potential,” “continue,” “ongoing,” “target,” “seek” or the negative or plural of these words, or other similar expressions that are predictions or indicate future events or prospects, although not all forward-looking statements contain these words. Any statements that refer to expectations, projections or other characterizations of future events or circumstances, including strategies or plans, are also forward-looking statements. These statements involve risks, uncertainties and other factors that may cause actual results, levels of activity, performance or achievements to be materially different from those expressed or implied by these forward-looking statements. These statements are based on Perfect’s reasonable expectations and beliefs concerning future events and involve risks and uncertainties that may cause actual results to differ materially from current expectations. These factors are difficult to predict accurately and may be beyond Perfect’s control. Forward-looking statements in this communication or elsewhere speak only as of the date made. New uncertainties and risks arise from time to time, and it is impossible for Perfect to predict these events or how they may affect Perfect. In addition, risks and uncertainties are described in Perfect’s filings with the Securities and Exchange Commission. These filings may identify and address other important risks and uncertainties that could cause actual events and results to differ materially from those contained in the forward-looking statements. Perfect cannot assure you that the forward-looking statements in this communication will prove to be accurate. There may be additional risks that Perfect presently does not know or that Perfect currently does not believe are immaterial that could also cause actual results to differ from those contained in the forward-looking statements. In light of the significant uncertainties in these forward-looking statements, you should not regard these statements as a representation or warranty by Perfect, its directors, officers or employees or any other person that Perfect will achieve its objectives and plans in any specified time frame, or at all. Except as required by applicable law, Perfect does not have any duty to, and does not intend to, update or revise the forward-looking statements in this communication or elsewhere after the date of this communication. You should, therefore, not rely on these forward-looking statements as representing the views of Perfect as of any date subsequent to the date of this communication.
STAFFORD, Texas, Feb. 24, 2026 (GLOBE NEWSWIRE) — Greenwich LifeSciences, Inc. (Nasdaq: GLSI) (the “Company”), a clinical-stage biopharmaceutical company focused on its Phase III clinical trial, FLAMINGO-01, which is evaluating Fast Track designated GLSI-100, an immunotherapy to prevent breast cancer recurrences, today announced that two abstracts have been accepted for presentation at the upcoming American Association for Cancer Research (AACR) Annual Meeting 2026, including two corresponding posters.
The AACR 2026 conference will be held from April 17-22, 2026. The AACR plans to publish the abstract titles on March 17, 2026 at 4:30 pm EST, the abstracts on April 17, 2026 at 3:00 pm EST, and the posters on the date of the presentation at the conference.
CEO Snehal Patel commented, “One of these abstracts will be the first abstract co-authored by the Company and the full Steering Committee of FLAMINGO-01.”
About the AACR Annual Meeting 2026
The AACR is the first and largest cancer research organization dedicated to accelerating the conquest of cancer and has more than 61,000 members residing in 143 countries and territories. The AACR Annual Meeting is the focal point of the cancer research community, where scientists, clinicians, other health care professionals, survivors, patients, and advocates gather to share the latest advances in cancer science and medicine. From population science and prevention; to cancer biology, translational, and clinical studies; to survivorship and advocacy; the AACR Annual Meeting highlights the work of the best minds in cancer research from institutions all over the world.
About FLAMINGO-01 Open Label Phase III Data
More than 1,000 patients have been screened with a current screen rate of approximately 600 patients per year. The 250 patient non-HLA-A*02 arm is now fully enrolled, where all patients received GLSI-100, which is 5 times more treated patients and recurrence rate data than the approximately 50 patients treated in the Phase IIb trial. The Primary Immunization Series (PIS), which includes the first 6 GLSI-100 injections over the first 6 months and is required to reach peak protection, is followed by 5 booster injections given every 6 months to prolong the immune response, thereby providing longer-term protection.
In the non-HLA-A*02 arm, a preliminary analysis of recurrence rates after the PIS is completed shows an approximately 80% reduction in recurrence rate.
This observation is trending similarly to the Phase IIb trial results and hazard ratio where HLA-A*02 patients were treated and where breast cancer recurrences were reduced up to 80% compared to a 20-50% reduction in recurrence rate by other approved products.
The immune response at baseline prior to any GLSI-100 treatment, the increasing immune response during the PIS, and the safety profile of non-HLA-A*02 patients is trending similarly to the HLA-A*02 arms of FLAMINGO-01 and to the Phase IIb study.
Analysis of the open label data from FLAMINGO-01 has been conducted in a manner that maintains the study blind. The open label recurrence rate, immune response, and safety data is based on the patients enrolled to date in FLAMINGO-01 and the data provided by the clinical sites so far, which is not completed or fully reviewed, and is thus preliminary. While comparing any preliminary FLAMINGO-01 data to the Phase IIb clinical trial data may be possible, these preliminary results are not a prediction of future results, and the results at the end of the study may differ.
About GLSI-100 Phase IIb Study
In the prospective, randomized, single-blinded, placebo-controlled, multi-center (16 sites led by MD Anderson Cancer Center) Phase IIb clinical trial of HLA-A*02 breast cancer patients, 46 HER2/neu 3+ over-expressor patients were treated with GLSI-100, and 50 placebo patients were treated with GM-CSF alone. After 5 years of follow-up, there was an 80% or greater reduction in cancer recurrences in the HER2/neu 3+ patients who were treated with GLSI-100, followed, and remained disease free over the first 6 months, which we believe is the time required to reach peak immunity and thus maximum efficacy and protection. The Phase IIb results can be summarized as follows:
80% or greater reduction in metastatic breast cancer recurrence rate over 5 years of follow-up with a peak immune response at 6 months and well-tolerated safety profile.
The PIS elicited a potent immune response as measured by local skin tests and immunological assays.
About FLAMINGO-01 and GLSI-100
FLAMINGO-01 (NCT05232916) is a Phase III clinical trial designed to evaluate the safety and efficacy of Fast Track designated GLSI-100 (GP2 + GM-CSF) in HER2 positive breast cancer patients who had residual disease or high-risk pathologic complete response at surgery and who have completed both neoadjuvant and postoperative adjuvant trastuzumab based treatment. The trial is led by Baylor College of Medicine and currently includes US and European clinical sites from university-based hospitals and academic and cooperative networks with plans to open up to 150 sites globally. In the double-blinded arms of the Phase III trial, approximately 500 HLA-A*02 patients are planned to be randomized to GLSI-100 or placebo, and up to 250 patients of other HLA types are planned to be treated with GLSI-100 in a third arm. The trial has been designed to detect a hazard ratio of 0.3 in invasive breast cancer-free survival, where 28 events will be required. An interim analysis for superiority and futility will be conducted when at least half of those events, 14, have occurred. This sample size provides 80% power if the annual rate of events in placebo-treated subjects is 2.4% or greater.
For more information on FLAMINGO-01, please visit the Company’s website here and clinicaltrials.gov here. Contact information and an interactive map of the majority of participating clinical sites can be viewed under the “Contacts and Locations” section. Please note that the interactive map is not viewable on mobile screens. Related questions and participation interest can be emailed to: flamingo-01@greenwichlifesciences.com
About Breast Cancer and HER2/neu Positivity
One in eight U.S. women will develop invasive breast cancer over her lifetime, with approximately 300,000 new breast cancer patients and 4 million breast cancer survivors. HER2 (human epidermal growth factor receptor 2) protein is a cell surface receptor protein that is expressed in a variety of common cancers, including in 75% of breast cancers at low (1+), intermediate (2+), and high (3+ or over-expressor) levels.
About Greenwich LifeSciences, Inc.
Greenwich LifeSciences is a clinical-stage biopharmaceutical company focused on the development of GP2, an immunotherapy to prevent breast cancer recurrences in patients who have previously undergone surgery. GP2 is a 9 amino acid transmembrane peptide of the HER2 protein, a cell surface receptor protein that is expressed in a variety of common cancers, including expression in 75% of breast cancers at low (1+), intermediate (2+), and high (3+ or over-expressor) levels. Greenwich LifeSciences has commenced a Phase III clinical trial, FLAMINGO-01. For more information on Greenwich LifeSciences, please visit the Company’s website at www.greenwichlifesciences.com and follow the Company’s Twitter at https://twitter.com/GreenwichLS.
Forward-Looking Statement Disclaimer
Statements in this press release contain “forward-looking statements” that are subject to substantial risks and uncertainties. All statements, other than statements of historical fact, contained in this press release are forward-looking statements. Forward-looking statements contained in this press release may be identified by the use of words such as “anticipate,” “believe,” “contemplate,” “could,” “estimate,” “expect,” “intend,” “seek,” “may,” “might,” “plan,” “potential,” “predict,” “project,” “target,” “aim,” “should,” “will,” “would,” or the negative of these words or other similar expressions, although not all forward-looking statements contain these words. Forward-looking statements are based on Greenwich LifeSciences Inc.’s current expectations and are subject to inherent uncertainties, risks and assumptions that are difficult to predict, including statements regarding the intended use of net proceeds from the public offering; consequently, actual results may differ materially from those expressed or implied by such forward-looking statements. Further, certain forward-looking statements are based on assumptions as to future events that may not prove to be accurate. These and other risks and uncertainties are described more fully in the section entitled “Risk Factors” in Greenwich LifeSciences’ Annual Report on the most recent Form 10-K for the year ended December 31, 2024, and other periodic reports filed with the Securities and Exchange Commission. Forward-looking statements contained in this announcement are made as of this date, and Greenwich LifeSciences, Inc. undertakes no duty to update such information except as required under applicable law.
Investor & Public Relations Contact for Greenwich LifeSciences Dave Gentry RedChip Companies Inc. Office: 1-800-RED CHIP (733 2447) Email: dave@redchip.com
As European manufacturing and logistics firms solidify their North American foundations, a parallel wave of strategic acquisition is transforming the U.S. service and retail landscape. For the European acquirer, the U.S. “Service Economy” represents more than just a massive consumer base; it is a gateway to specialized talent pools, cutting-edge digital platforms, and a resilient commercial ecosystem that can de-risk a global portfolio.
Navigating this transition from “Industrial Footprint” to “Commercial Dominance” requires a nuanced understanding of the U.S. consumer and the specialized expertise that defines American business services.
Accelerating Market Penetration in U.S. Retail
Acquiring an established U.S. retail asset offers European firms an immediate bridge to a vast and diverse consumer demographic. Rather than attempting the long, capital-intensive process of organic brand building, an acquisition provides instant access to existing customer loyalty and multi-channel distribution networks.
In 2026, the value of these assets is increasingly found in their “Omni-channel” readiness. European buyers are targeting U.S. firms that have successfully integrated physical brick-and-mortar stores with sophisticated e-commerce and mobile app platforms. This dual presence allows European owners to introduce their own innovations into a pre-established American “customer journey,” creating immediate revenue synergies.
Expanding Expertise through Business Services
The U.S. professional services sector—encompassing everything from IT consulting and marketing agencies to HR solutions—offers a deep well of specialized capabilities. For a European company, these acquisitions are less about physical equipment and more about acquiring Intellectual Capital and established client portfolios.
A U.S.-based service arm provides the “local eyes” necessary to interpret complex market shifts in real-time. By integrating these specialized talent pools, European firms can deepen their industry-specific insights, ensuring that their service delivery model is tuned to the unique expectations of American clients.
The Technology Bridge: Harnessing Digital Transformation
The U.S. remains a global leader in the adoption of customer-facing technologies. A primary driver for modern M&A is the desire to “import” U.S. digital capabilities—such as advanced CRM systems, cloud-based logistics solutions, and AI-driven data analytics—back into the European parent organization.
Leveraging these tools allows European acquirers to personalize offerings and refine marketing spend with a level of precision that is often more advanced in the U.S. market. This cross-pollination of digital strategies doesn’t just improve the U.S. subsidiary; it enhances the operational insights of the entire global enterprise.
Securing the Human Element: Talent and Culture
In the service and retail sectors, the “product” is the people. Consequently, securing key management and sales talent is a critical component of the due diligence process. European buyers must evaluate U.S. talent pools not just for technical skill, but for cultural alignment with the parent company’s values. Moreover, European buyers need to conduct thorough due diligence as part of the M&A process to understand the employee culture of the potential U.S. target, the employment practices of the U.S. target, federal and state labor laws, laws and regulations impacting benefits, potential pension plan liabilities and other risks and liabilities inherent in any acquisition of employees. Such deep understanding of U.S. work culture is also critical to avoid the common pitfall of imposing the parent company culture, which can be detrimental to employee morale, increase turnover, and lower productivity.
Initial considerations must include a thorough review of U.S. employment agreements, non-compete clauses, non-solicitation provisions, confidentiality protections, equity incentive plans, severance provisions and other such agreements, which may differ significantly from European standards. Understanding these “at-will” dynamics early ensures that the “Human Capital” of the target remains incentivized and engaged throughout the integration process.
Conclusion: Cultivating New Growth Avenues
Strategic M&A in the U.S. business services and retail sectors is a powerful engine for global expansion. By combining European innovation with American market scale and digital expertise, firms can establish a resilient, customer-centric presence that is built for enduring success.
Having explored the strategic opportunities, we now dive into the “Rulebook.” In our next article, we decode the multi-layered U.S. legal, tax, and regulatory landscape that every European acquirer must master.
ABOUT THE AUTHORS:
Nico Pronk is Managing Partner, CEO, and Head of Investment Banking at Noble Capital Markets. Nico has over 35 years of experience working with IPOs, Secondary Offerings, Private Placements and Mergers and Acquisitions including complex cross-border transactions. During his career he has served as Director or Advisor to numerous privately held and publicly traded companies.
Bruce C. Rosetto is a Senior Partner and Shareholder at Greenberg Traurig LLP and represents private and public companies, private equity funds, hedge funds, investment banks, and entrepreneurial clients in a wide variety of industries. He has broad experience in domestic and international mergers and acquisitions, raising capital, securities work, private placement financings, corporate governance, alternate assets, and projects qualifying for investment under the EB-5 Entrepreneur Investment Visa Program. He also forms private equity funds and family offices and represents affiliated portfolio companies.
Fred Campos is a Managing Director atCBIZ with more than 20 years of experience in accounting and finance and more than 300 executed buy-side and sell-side M&A engagements. Prior to joining CBIZ, Fred founded and led a boutique advisory services firm focused on mergers and acquisitions and exit readiness. Earlier in his career, he was part of the cross-border practice at Ernst & Young (EY) where he assisted EY’s global clients on cross-border deals. Fred also established and led the regional transaction advisory services practice for a global top tier public accounting firm.
Mark Chaves, Managing Director with CBIZ, assists companies with domestic and international tax planning and structuring, mergers and acquisitions, and business reorganizations. Mark has focused his career on working with multinational corporations to manage cross-border direct and indirect tax issues, foreign tax credit and repatriation planning, reorganization of expatriate and inpatriate tax matters, and ASC 740 reporting. Additionally, Mark assists individuals with international estate planning, inbound tax structuring of investments in U.S. real property, and pre-immigration planning as well as with cross-border tax issues and filings for FINCEN compliance.
Matthew (Matt) Podowitz is the founder and Principal Consultant of Pathfinder Advisors LLC, bringing experience on 400+ global M&A engagements to his clients. Matt specializes in the critical operational and technology aspects of M&A transactions, providing due diligence, carve-out, integration, and value creation services. Leveraging his perspective as a dual US/EU citizen, he provides seamless support for cross-border M&A transactions through every step of the transaction lifecycle in both markets. His background includes leadership roles at firms like Ernst & Young, Grant Thornton, and CFGI.
Mark Reichman, Managing Director, Equity Research Analyst, Natural Resources, Noble Capital Markets, Inc.
Hans Baldau, Associate Analyst, Noble Capital Markets, Inc.
Refer to the full report for the price target, fundamental analysis, and rating.
Updated feasibility study. Century released the results of its 2026 NI 43-101 feasibility study for the 100%-owned Angel Island Lithium Project in Esmeralda County, Nevada. The updated study reflects engineering optimization and improvements that materially strengthen the project’s economic profile and highlight Angel Island as one of the most significant and economically robust sedimentary lithium developments in the United States.
Lower initial capital expenditures. Phase I initial capital expenditures are estimated to be $997 million, a significant reduction from the $1.5 billion outlined in the 2024 Study. The updated study streamlines development into a two-phase approach. Phase I contemplates 7,500 tonnes per day (tpd) of mill feed, expanding to 15,000 tpd in Phase II beginning in Year 5. Phase II expansion capital is estimated at $660 million. A previously planned third expansion phase has been eliminated, lowering overall capital requirements. The economic analysis is based on a 40-year production schedule, with planned life-of-mine average production of 26,500 tonnes per annum of battery-grade lithium carbonate.
Equity Research is available at no cost to Registered users of Channelchek. Not a Member? Click ‘Join’ to join the Channelchek Community. There is no cost to register, and we never collect credit card information.
This Company Sponsored Research is provided by Noble Capital Markets, Inc., a FINRA and S.E.C. registered broker-dealer (B/D).
*Analyst certification and important disclosures included in the full report. NOTE: investment decisions should not be based upon the content of this research summary. Proper due diligence is required before making any investment decision.
Great Lakes Dredge & Dock Corporation is the largest provider of dredging services in the United States. In addition, Great Lakes is fully engaged in expanding its core business into the rapidly developing offshore wind energy industry. The Company has a long history of performing significant international projects. The Company employs experienced civil, ocean and mechanical engineering staff in its estimating, production and project management functions. In its over 131-year history, the Company has never failed to complete a marine project. Great Lakes owns and operates the largest and most diverse fleet in the U.S. dredging industry, comprised of approximately 200 specialized vessels. Great Lakes has a disciplined training program for engineers that ensures experienced-based performance as they advance through Company operations. The Company’s Incident-and Injury-Free® (IIF®) safety management program is integrated into all aspects of the Company’s culture. The Company’s commitment to the IIF® culture promotes a work environment where employee safety is paramount.
Joe Gomes, CFA, Managing Director, Equity Research Analyst, Generalist , Noble Capital Markets, Inc.
Refer to the full report for the price target, fundamental analysis, and rating.
Overview. Great Lakes reported solid 4Q25 results in its likely last quarter as a public company. A full quarter of work from the Amelia Island and higher capital and offshore energy revenue drove the results. Offshore energy revenue rose to $24.1 million in the quarter, up from $6.1 million in 3Q25. Higher costs associated with the pending merger and increased incentive compensation impacted operating income, which rose to $32.6 million from $30 million in 4Q24.
4Q25 Results. Revenue was $256.5 million, up from $202.8 million in 4Q24 and above our $220.5 million estimate. Adjusted EBITDA totaled $44 million compared to $40.2 million last year and in-line with our $44.5 million estimate. Adjusted net income was $20.7 million, or $0.30/sh, compared to $19.7 million, or $0.29/sh, last year.
Equity Research is available at no cost to Registered users of Channelchek. Not a Member? Click ‘Join’ to join the Channelchek Community. There is no cost to register, and we never collect credit card information.
This Company Sponsored Research is provided by Noble Capital Markets, Inc., a FINRA and S.E.C. registered broker-dealer (B/D).
*Analyst certification and important disclosures included in the full report. NOTE: investment decisions should not be based upon the content of this research summary. Proper due diligence is required before making any investment decision.
Michael Kupinski, Director of Research, Equity Research Analyst, Digital, Media & Technology , Noble Capital Markets, Inc.
Jacob Mutchler, Research Associate, Noble Capital Markets, Inc.
Refer to the full report for the price target, fundamental analysis, and rating.
Increases its stake in Veloce Media Group. SEGG Media increases its stake from 12.4% to over 51% in Veloce Media Group, a UK-based digital media and gaming company focused on esports, gaming content, and motorsport entertainment, valuing the company at $61 million. Veloce current management is expected to manage the business and the company has nominated Daniel Bailey, co-founder and CEO of Veloce, to the SEGG board.
Could own up to 75%. The purchase was for cash and stock, with the vast majority for stock. The company issued 2.52 million shares in the transaction, valuing the SEGG shares at $10 per share. SEGG extended the offer for a portion of the remaining interest in Veloce it does not own, and, as such, SEGG may control a larger percentage once the transaction is completed within the next few weeks.
Equity Research is available at no cost to Registered users of Channelchek. Not a Member? Click ‘Join’ to join the Channelchek Community. There is no cost to register, and we never collect credit card information.
This Company Sponsored Research is provided by Noble Capital Markets, Inc., a FINRA and S.E.C. registered broker-dealer (B/D).
*Analyst certification and important disclosures included in the full report. NOTE: investment decisions should not be based upon the content of this research summary. Proper due diligence is required before making any investment decision.
Patrick McCann, CFA, Research Analyst, Noble Capital Markets, Inc.
Michael Kupinski, Director of Research, Equity Research Analyst, Digital, Media & Technology , Noble Capital Markets, Inc.
Refer to the full report for the price target, fundamental analysis, and rating.
BTM 1-for-7 reverse stock split. On February 23, 2026, the company’s Class A common stock began trading on a split-adjusted basis on Nasdaq. The action had been previously authorized by shareholders and approved by the Board and did not reflect any change in operating performance or strategy.
No alteration to economic ownership or fundamentals. Every seven shares outstanding were consolidated into one share, with fractional shares cashed out based on the pre-split VWAP. Authorized shares and par value remained unchanged, while public warrants, equity awards, and other convertible securities were adjusted proportionally, including a mechanical increase in the BTMWW warrant exercise price.
Equity Research is available at no cost to Registered users of Channelchek. Not a Member? Click ‘Join’ to join the Channelchek Community. There is no cost to register, and we never collect credit card information.
This Company Sponsored Research is provided by Noble Capital Markets, Inc., a FINRA and S.E.C. registered broker-dealer (B/D).
*Analyst certification and important disclosures included in the full report. NOTE: investment decisions should not be based upon the content of this research summary. Proper due diligence is required before making any investment decision.
CECO Environmental Corp. (Nasdaq: CECO) and Thermon Group Holdings, Inc. (NYSE: THR) have entered into a definitive agreement to combine in a stock and cash transaction valued at approximately $2.2 billion, creating a scaled industrial platform focused on mission-critical environmental and thermal solutions.
The combined company will operate under the CECO Environmental name and continue to be led by CEO Todd Gleason. Upon closing, CECO and Thermon shareholders are expected to own roughly 62.5% and 37.5% of the combined company, respectively.
The transaction adds Thermon’s industrial process heating, heat tracing, and temperature management technologies to CECO’s portfolio of environmental, emissions control, industrial air quality, and water treatment solutions. The result is a broader, more diversified platform serving energy, power generation, industrial, and infrastructure markets.
Thermon brings established capabilities in process heating systems that are widely used in energy infrastructure and industrial facilities. By integrating these technologies, CECO meaningfully expands its exposure to thermal management applications—an area tied to long-term trends such as energy transition, industrial reshoring, infrastructure buildout, and decarbonization initiatives.
Management from both companies emphasized the complementary nature of their offerings. CECO’s existing footprint in emissions control, air quality, and water treatment aligns with Thermon’s temperature management solutions, creating opportunities to serve customers across more components of their industrial systems.
The combined platform is expected to provide customers with integrated solutions designed to protect people, equipment, processes, and the environment—an increasingly important value proposition as regulatory standards tighten globally.
Under the terms of the agreement, Thermon shareholders may elect to receive a mix of cash and CECO stock, all-cash consideration, or all-stock consideration, subject to proration limits. The mixed consideration implies a per-share value of approximately $63.13 based on CECO’s February 23, 2026 closing price, representing a 26.8% premium to Thermon’s closing price the same day.
The companies expect to generate approximately $40 million in annual cost synergies within 36 months following the close of the transaction. In addition to cost efficiencies, the combined company is anticipated to benefit from a more balanced revenue mix, including greater exposure to short-cycle and aftermarket service revenues.
Scale also plays a central role. Larger industrial customers increasingly prefer suppliers capable of delivering comprehensive engineered solutions across multiple technical disciplines. The merger positions CECO to compete for larger, more complex projects while maintaining participation in recurring service and maintenance markets.
The transaction has been unanimously approved by both companies’ boards of directors and is expected to close in mid-2026, subject to customary closing conditions. Jason DeZwirek, Chairman of CECO, and related holders representing approximately 15.2% of CECO’s voting power have agreed to vote in favor of the deal, subject to certain exceptions.
Following completion, CECO’s board will include two members from Thermon’s current board, while executive leadership will remain under Gleason.
If completed, the transaction marks a significant step in CECO’s evolution into a broader industrial technology platform, combining environmental and thermal management capabilities under one publicly traded entity.
Gilead Sciences (Nasdaq: GILD) is doubling down on cell therapy. The Foster City–based biopharma announced it will acquire Arcellx (Nasdaq: ACLX) in a transaction valued at approximately $7.8 billion in equity value, giving Gilead full control of anitocabtagene autoleucel (anito-cel), an investigational BCMA-directed CAR T-cell therapy for multiple myeloma.
Kite, a Gilead company, has partnered with Arcellx since 2022 to co-develop and co-commercialize anito-cel. Under the new agreement, Gilead will acquire all outstanding shares of Arcellx it does not already own for $115 per share in cash, plus one non-transferable contingent value right (CVR) worth $5 per share if cumulative global net sales of anito-cel reach $6.0 billion from launch through year-end 2029.
The $115 cash component represents a 68% premium to Arcellx’s 30-day volume-weighted average share price as of February 20, 2026. Gilead already owns approximately 11.5% of Arcellx’s outstanding common stock. The transaction, approved by both companies’ boards, is expected to close in the second quarter of 2026, subject to customary conditions including the tender of a majority of outstanding shares, regulatory approvals and other standard closing requirements.
If completed, the acquisition would eliminate profit-sharing, milestone payments and royalty obligations tied to the existing collaboration, streamlining economics as Gilead prepares for potential commercialization.
The timing is notable. The U.S. Food and Drug Administration has accepted the Biologics License Application (BLA) for anito-cel as a fourth-line treatment for adult patients with relapsed or refractory multiple myeloma. The application is supported by results from a Phase 1 study and the pivotal Phase 2 iMMagine1 trial. The FDA has set a Prescription Drug User Fee Act (PDUFA) target action date of December 23, 2026.
In clinical studies to date, anito-cel has demonstrated deep and durable responses with a predictable and manageable safety profile, according to company disclosures. Multiple myeloma remains an area of high unmet need, particularly among heavily pretreated patients who often face diminishing responses, increasing toxicity and fewer therapeutic options over time.
Full ownership provides Gilead with greater flexibility to align development strategy, scale manufacturing through Kite, and potentially explore expansion into earlier lines of therapy, subject to clinical outcomes and regulatory review.
Beyond anito-cel, Gilead is also acquiring Arcellx’s D-Domain CAR platform, which has generated proprietary target-binding domains designed to improve specificity and binding affinity. The platform may support future CAR T-cell programs, bispecific constructs and in vivo cell therapy approaches, further strengthening Gilead’s oncology pipeline.
Management indicated that, upon FDA approval of anito-cel, the proposed transaction is expected to be accretive to earnings per share in 2028 and thereafter.
For investors, the acquisition highlights a broader trend in large-cap biotech capital deployment. Established companies are increasingly seeking full ownership of late-stage oncology assets to simplify economics, reduce long-term partnership obligations and consolidate strategic control ahead of potential commercialization milestones.
Cell therapy remains one of the most capital-intensive areas of oncology, requiring specialized manufacturing, logistics and commercial infrastructure. Gilead’s move signals confidence in both the asset and its ability to integrate development and commercialization within its existing cell therapy platform.
The next key inflection point will be the FDA’s review decision later this year, which will shape the commercial trajectory of anito-cel and the long-term impact of the acquisition.
CHICAGO, Feb. 23, 2026 (GLOBE NEWSWIRE) — FreightCar America, Inc. (NASDAQ: RAIL), a diversified manufacturer of railroad freight cars, today announced that it will release its fourth quarter and full year 2025 financial results on Monday, March 9, 2026, after the market close, and host a teleconference to discuss its fourth quarter and full year 2025 results on the following day. Teleconference details are as follows:
Please note that the webcast is listen-only and webcast participants will not be able to participate in the question and answer portion of the conference call. Interested parties are asked to dial in approximately 10 to 15 minutes prior to the start time of the call.
An audio replay of the conference call will be available beginning at 3:00 p.m. (Eastern Time) on Tuesday, March 10, 2026, until 11:59 p.m. (Eastern Time) on Tuesday, March 24, 2026. To access the replay, please dial (844) 512-2921 or (412) 317-6671. The replay passcode is 13758379. An archived version of the webcast will also be available on the FreightCar America Investor Relations website.
About FreightCar America
FreightCar America, headquartered in Chicago, Illinois, is a leading designer, producer and supplier of railroad freight cars, railcar parts and components. We also specialize in railcar repairs, complete railcar rebody services and railcar conversions that repurpose idled rail assets back into revenue service. Since 1901, our customers have trusted us to build quality railcars that are critical to economic growth and instrumental to the North American supply chain. To learn more about FreightCar America, visit www.freightcaramerica.com.
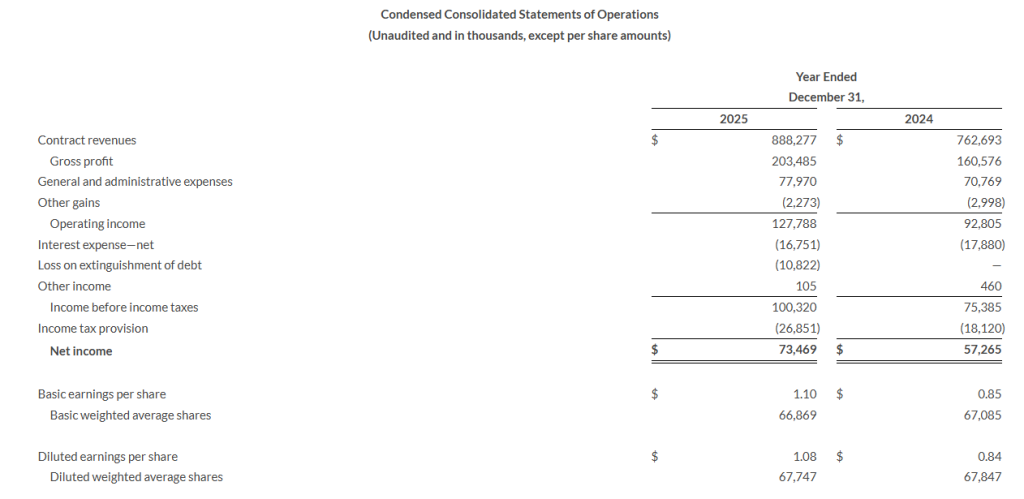
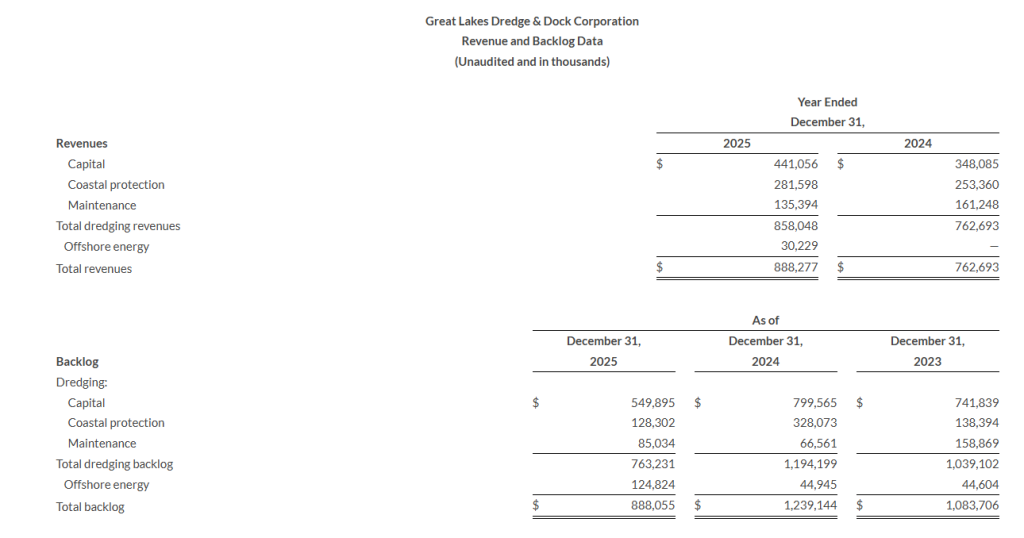
Record full year revenue of $888.3 million Full year net income of $73.5 million (Adjusted net income of $81.6 million) Record full year Adjusted EBITDA of $171.3 million
HOUSTON, Feb. 23, 2026 (GLOBE NEWSWIRE) — Great Lakes Dredge & Dock Corporation (“Great Lakes” or the “Company”) (Nasdaq: GLDD), the largest provider of dredging services in the United States, today reported financial results for the fourth quarter and year ended December 31, 2025 and the signing of two international offshore energy contracts.
Fourth Quarter 2025 Highlights
Revenue was $256.5 million
Total operating income was $32.6 million
Net income was $12.6 million
Adjusted net income was $20.7 million
Adjusted EBITDA was $44.0 million
Full Year 2025 Highlights
Revenue was $888.3 million
Total operating income was $127.8 million
Net income was $73.5 million
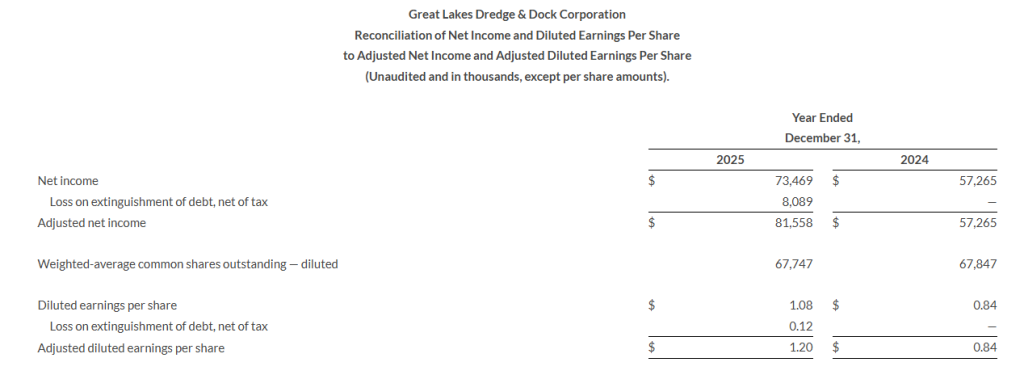
Adjusted net income was $81.6 million
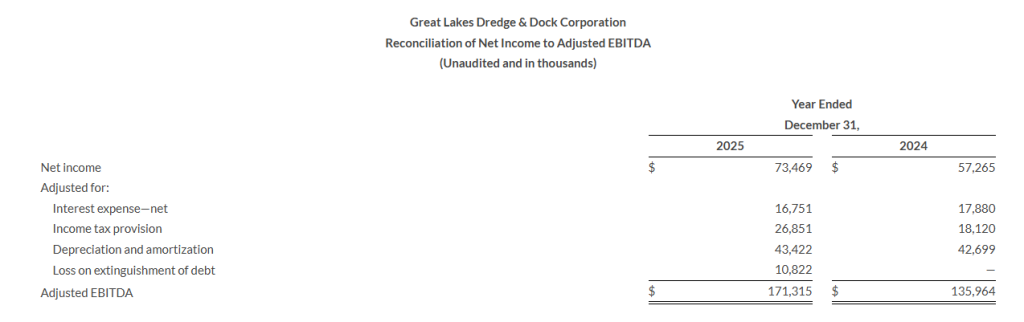
Adjusted EBITDA was $171.3 million
Backlog as of December 31, 2025 was $888.1 million
Previously Announced Saltchuk Transaction
On February 11, 2026, Great Lakes announced that it had entered into a definitive agreement for Saltchuk Resources, Inc. (“Saltchuk”) to acquire the Company. The closing of the transaction will be subject to customary closing conditions, including the expiration of the Hart-Scott-Rodino Act waiting period and the tender of shares representing at least one share more than a majority of Great Lakes’ outstanding shares of common stock, and is expected to close in Q2 2026.
Offshore Energy
Great Lakes entered into two new international offshore energy contracts with a major offshore wind developer. The awarded work will keep the Acadia utilized in Europe for the majority of 2027.
Operational Update
Fourth Quarter 2025
Revenue was $256.5 million, an increase of $53.7 million from the fourth quarter of 2024. The higher revenue in the fourth quarter of 2025 was due primarily to the first full quarter of the Amelia Island working and higher capital and offshore energy revenue as compared to the same period in the fourth quarter last year, partially offset by lower coastal protection and maintenance project revenue.
Gross profit of $53.6 million increased from the fourth quarter of 2024 gross profit of $48.9 million primarily due to improved project performance. Gross profit margin decreased to 20.9% from 24.1% in the fourth quarter of 2024 primarily due to increased drydocking expenses.
Operating income was $32.6 million, increasing from $30.0 million in the prior year’s fourth quarter primarily due to the improved gross profit partially offset by higher general and administrative expenses primarily due to increased incentive compensation and expenses related to the Saltchuk transaction.
Net income was $12.6 million, decreasing from net income of $19.7 million in the prior year fourth quarter. The decrease was primarily driven by an $8.1 million one-time expense, net of tax impact, from the extinguishment of our second lien notes. Excluding this one-time expense, adjusted net income was $20.7 million.
Full Year 2025
Revenue was $888.3 million, an increase of $125.6 million from 2024. The higher revenue in 2025 was due primarily to the delivery of the Amelia Island and higher capital, coastal protection, and offshore energy revenues, partially offset by decrease in maintenance revenue.
Gross profit and gross profit margin of $203.5 million and 22.9%, respectively, increased from full year 2024 gross profit and gross profit margin of $160.6 million and 21.1%, respectively. The increases were driven by higher revenues as well as improved utilization and project performance in the current year.
Operating income for the full year 2025 was $127.8 million, which is a $35.0 million improvement from the prior year. The year-over-year increase is primarily a result of higher gross profit in the current year when compared to prior year, partially offset by higher general and administrative expenses primarily due to increased incentive pay in the current year when compared to prior year.
Net income for the full year 2025 was $73.5 million, which is a $16.2 million improvement compared to $57.3 million for the full year 2024. This increase is primarily driven by improvements to operating income in the current year when compared to prior year, partially offset by an increase in the income tax provision in the current year when compared to prior year as well as by the $8.1 million one-time expense, net of tax impact, from the extinguishment of our second lien notes. Excluding this one-time expense, adjusted net income was $81.6 million.
Balance Sheet, Backlog & Capital Expenditures
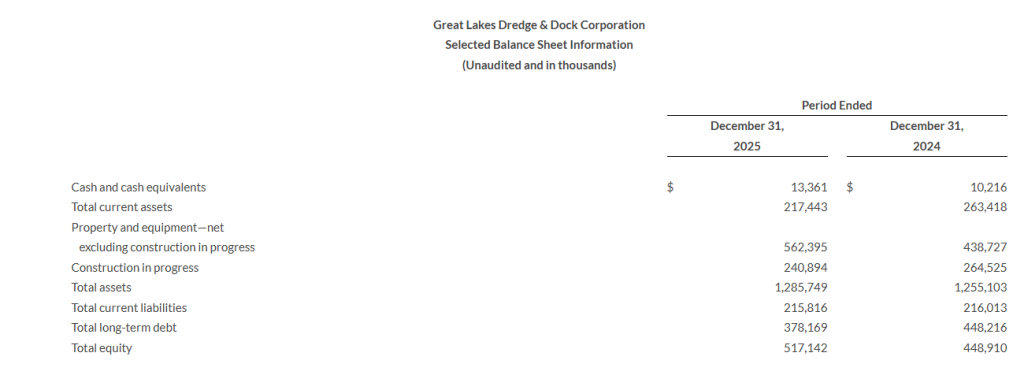
At December 31, 2025, the Company had $13.4 million in cash and cash equivalents, total long-term debt of $378.2 million and liquidity of over $330 million.
At December 31, 2025, the Company had $763.2 million in dredging backlog compared to $1.2 billion at December 31, 2024. Dredging backlog as of December 31, 2025 does not include approximately $200.2 million of awards and options pending.
At December 31, 2025, the Company had $124.8 million in offshore energy backlog compared to $44.9 million at December 31, 2024. Offshore energy backlog does not include approximately $2.9 million of options pending.
Total capital expenditures for the full year 2025 were $143.9 million including $69.1 million for the construction of the Acadia, $32.3 million for the Amelia Island, $13.7 million for support equipment, and $28.8 million for maintenance and growth.
Conference Call Information
As previously communicated, in light of the pending transaction with Saltchuk, Great Lakes will not host a conference call and webcast in conjunction with the quarter and year-end report.
Use of Non-GAAP Measures
Adjusted EBITDA, as provided herein, represents net income from continuing operations, adjusted for net interest expense, income taxes, depreciation and amortization expense, debt extinguishments, accelerated maintenance expense for new international deployments, goodwill or asset impairments and gains on bargain purchase acquisitions. Adjusted EBITDA is not a measure derived in accordance with GAAP. The Company presents Adjusted EBITDA as an additional measure by which to evaluate the Company’s operating trends. The Company believes that Adjusted EBITDA is a measure frequently used to evaluate the performance of companies with substantial leverage and that the Company’s primary stakeholders (i.e., its stockholders, bondholders and banks) use Adjusted EBITDA to evaluate the Company’s period to period performance. Additionally, management believes that Adjusted EBITDA provides a transparent measure of the Company’s recurring operating performance and allows management to readily view operating trends, perform analytical comparisons and identify strategies to improve operating performance. For this reason, the Company uses a measure based upon Adjusted EBITDA to assess performance for purposes of determining compensation under the Company’s incentive plan. Adjusted EBITDA should not be considered an alternative to, or more meaningful than, amounts determined in accordance with GAAP including: (a) net income as an indicator of operating performance or (b) cash flows from operations as a measure of liquidity. As such, the Company’s use of Adjusted EBITDA, instead of a GAAP measure, has limitations as an analytical tool, including the inability to determine profitability or liquidity due to the exclusion of accelerated maintenance expense for new international deployments, goodwill or asset impairments, gains on bargain purchase acquisitions, net interest expense and income tax expense and the associated significant cash requirements and the exclusion of depreciation and amortization, which represent significant and unavoidable operating costs given the level of indebtedness and capital expenditures needed to maintain the Company’s business. For these reasons, the Company uses net income to measure the Company’s operating performance and uses Adjusted EBITDA only as a supplement. Adjusted EBITDA is reconciled to net income in the table of financial results. For further explanation, please refer to the Company’s Securities and Exchange Commission (“SEC”) filings.
Adjusted net income and adjusted diluted earnings per share, as provided herein, represent net income and diluted earnings per share, adjusted for loss on extinguishment of debt. We believe adjusted net income and adjusted diluted earnings per share provide useful information about the Company’s operating performance. We believe excluding the [non-recurring loss on extinguishment of debt] provides investors with an alternative and supplemental understanding of our core business. Adjusted net income and adjusted diluted earnings per share are reconciled to net income and diluted earnings per share in the table of financial results. For further explanation, please refer to the Company’s SEC filings.
The Company
Great Lakes Dredge & Dock Corporation is the largest provider of dredging services in the United States, which is complemented with a long history of performing significant international projects. In addition, Great Lakes is fully engaged in expanding its core business into the offshore energy industry. The Company employs experienced civil, ocean and mechanical engineering staff in its estimating, production and project management functions. In its over 136-year history, the Company has never failed to complete a marine project. Great Lakes owns and operates the largest and most diverse fleet in the U.S. dredging industry, comprised of approximately 200 specialized vessels. Great Lakes has a disciplined training program for engineers that ensures experienced-based performance as they advance through Company operations. The Company’s Incident-and Injury-Free® (IIF®) safety management program is integrated into all aspects of the Company’s culture. The Company’s commitment to the IIF® culture promotes a work environment where employee safety is paramount.
Certain statements in this press release may constitute “forward-looking” statements, as defined in Section 21E of the Securities Exchange Act of 1934 (the “Exchange Act”), the Private Securities Litigation Reform Act of 1995 (the “PSLRA”) or in releases made by SEC, all as may be amended from time to time. Such forward-looking statements involve known and unknown risks, uncertainties and other important factors that could cause the actual results, performance or achievements of Great Lakes and its subsidiaries, or industry results, to differ materially from any future results, performance or achievements expressed or implied by such forward-looking statements. Statements that are not historical fact are forward-looking statements. Forward-looking statements can be identified by, among other things, the use of forward-looking language, such as the words “plan,” “believe,” “expect,” “anticipate,” “intend,” “estimate,” “project,” “may,” “would,” “could,” “should,” “seeks,” “are optimistic,” “commitment to” or “scheduled to,” or other similar words, or the negative of these terms or other variations are being made pursuant to the Exchange Act and the PSLRA with the intention of obtaining of these terms or comparable language, or by discussion of strategy or intentions. These cautionary statements have the benefit of the “safe harbor” provisions of such laws. Great Lakes cautions investors that any forward-looking statements made by Great Lakes are not guarantees or indicative of future performance. Important assumptions and other important factors that could cause actual results to differ materially from those forward-looking statements with respect to Great Lakes include, but are not limited to: failure to satisfy the conditions to the transaction with Saltchuk; uncertainties associated with the transaction with Saltchuk; failure to complete the transaction with Saltchuk within the expected timeframe or at all; provisions in the definitive agreement with Saltchuk limiting our ability to pursue alternatives to the transaction with Saltchuk; restrictions on the conduct of our business under the definitive agreement with Saltchuk; potential lawsuits arising out of the proposed transaction with Saltchuk; stockholders’ inability to benefit from future Company growth if the transaction with Saltchuk is completed; unexpected difficulties related to the transaction with Saltchuk and integration of both companies; a reduction in government funding for dredging and other contracts, or government cancellation of such contracts, or the inability of the Corps to let bids to market; our ability to qualify as an eligible bidder under government contract criteria and to compete successfully against other qualified bidders in order to obtain government dredging and other contracts; the political environment and governmental fiscal and monetary policies; cost over-runs, operating cost inflation and potential claims for liquidated damages, particularly with respect to our fixed price contracts; the timing of our performance on contracts and new contracts being awarded to us; significant liabilities that could be imposed were we to fail to comply with government contracting regulations; project delays related to the increasingly negative impacts of climate change or other unusual, non-historical weather patterns; costs necessary to operate and maintain our existing vessels and the construction of new vessels, including with respect to changes in applicable regulations or standards; equipment or mechanical failures; pandemic, epidemic or outbreak of an infectious disease; disruptions to our supply chain for procurement of new vessel build materials or maintenance on our existing vessels; capital and operational costs due to environmental regulations; market and regulatory responses to climate change, including proposed regulations concerning emissions reporting and future emissions reduction goals; contract penalties for any projects that are completed late; force majeure events, including natural disasters, war and terrorists’ actions; changes in the amount of our estimated backlog; significant negative changes attributable to large, single customer contracts; Our ability to obtain financing for the construction of new vessels; our ability to secure contracts to utilize our new offshore energy vessel; unforeseen delays and cost overruns related to the construction of our new vessels; any failure to comply with the Jones Act provisions on coastwise trade, or if those provisions were modified, repealed or interpreted differently; our ability to comply with anti-discrimination laws, including those pertaining to diversity, equity and inclusion programs; fluctuations in fuel prices, particularly given our dependence on petroleum-based products; impacts of nationwide inflation on procurement of new build and vessel maintenance materials; our ability to obtain bonding or letters of credit and risks associated with draws by the surety on outstanding bonds or calls by the beneficiary on outstanding letters of credit; acquisition integration and consolidation, including transaction expenses, unexpected liabilities and operational challenges and risks; divestitures and discontinued operations, including retained liabilities from businesses that we sell or discontinue; potential penalties and reputational damage as a result of legal and regulatory proceedings; any liabilities imposed on us for the obligations of joint ventures, and similar arrangements and subcontractors; increased costs of certain material used in our operations due to newly imposed tariffs; unionized labor force work stoppages; any liabilities for job-related claims under federal law, which does not provide for the liability limitations typically present under state law; operational hazards, including any liabilities or losses relating to personal or property damage resulting from our operations; our substantial amount of indebtedness, which makes us more vulnerable to adverse economic and competitive conditions; restrictions on the operation of our business imposed by financing terms and covenants; impacts of adverse capital and credit market conditions on our ability to meet liquidity needs and access capital; limitations on our hedging strategy imposed by statutory and regulatory requirements for derivative transactions; foreign exchange risks, in particular, related to the new offshore energy vessel build; losses attributable to our investments in privately financed projects; restrictions on foreign ownership of our common stock; restrictions imposed by Delaware law and our charter on takeover transactions that stockholders may consider to be favorable; restrictions on our ability to declare dividends imposed by our financing agreements or Delaware law; significant fluctuations in the market price of our common stock, which may make it difficult for holders to resell our common stock when they want or at prices that they find attractive; changes in previously recorded net revenue and profit as a result of the significant estimates made in connection with our methods of accounting for recognized revenue; maintaining an adequate level of insurance coverage; our ability to find, attract and retain key personnel and skilled labor; disruptions, failures, data corruption, cyber-based attacks, security breaches, or regulatory non-compliance affecting our information technology and operational technology systems; and failure of our share repurchase program to be fully implemented or enhance long-term shareholder value. For additional information on these and other risks and uncertainties, please see Item 1A. “Risk Factors” of Great Lakes’ Annual Report on our most recent Form 10-K, Item 1A. “Risk Factors” of Great Lakes’ Quarterly Report on Form 10-Q’s and in other securities filings by Great Lakes with the SEC.
Although Great Lakes believes that its plans, intentions and expectations reflected in or suggested by such forward-looking statements are reasonable, actual results could differ materially from a projection or assumption in any forward-looking statements. Great Lakes’ future financial condition and results of operations, as well as any forward-looking statements, are subject to change and inherent risks and uncertainties. The forward-looking statements contained in this press release are made only as of the date hereof and Great Lakes does not have or undertake any obligation to update or revise any forward-looking statements whether as a result of new information, subsequent events or otherwise, unless otherwise required by law.
Additional Information and Where to Find It
The tender offer for the outstanding common stock of the Company has not yet commenced. The communication referenced above are for information purposes only and do not constitute an offer to buy or the solicitation of an offer to sell any securities. The solicitation and the offer to buy shares of Company common stock will be made only pursuant to an offer to purchase and related materials that Saltchuk and its subsidiary (“Sub”) intend to file with the U.S. Securities and Exchange Commission (the “SEC”). If the tender offer is commenced, Saltchuk and Sub will file a Tender Offer Statement on Schedule TO with the SEC, and thereafter the Company will file a Solicitation/Recommendation Statement on Schedule 14D-9 with respect to the tender offer. BEFORE MAKING ANY INVESTMENT DECISION, INVESTORS AND SECURITY HOLDERS OF THE COMPANY ARE URGED TO READ THE TENDER OFFER MATERIALS (INCLUDING AN OFFER TO PURCHASE, A RELATED LETTER OF TRANSMITTAL AND CERTAIN OTHER TENDER OFFER DOCUMENTS), THE SOLICITATION/RECOMMENDATION STATEMENT AND ANY OTHER RELEVANT DOCUMENTS FILED OR TO BE FILED WITH THE SEC CAREFULLY AND IN THEIR ENTIRETY WHEN THEY BECOME AVAILABLE BECAUSE THEY WILL CONTAIN IMPORTANT INFORMATION WHICH SHOULD BE CONSIDERED BEFORE ANY DECISION IS MADE WITH RESPECT TO THE TENDER OFFER. These materials will be sent free of charge to Company stockholders when available, and may also be obtained free of charge by contacting the Company’s Investor Relations Department c/o Eric Birge, Vice President of Investor Relations, Great Lakes Dredge & Dock Corporation, 9811 Katy Freeway, Suite 1200, Houston, Texas, 77024, 313-220-3053 or EMBirge@gldd.com. In addition, all of these materials (and all other tender offer documents filed with the SEC) will be available at no charge from the SEC through its website at www.sec.gov. Copies of the documents filed with the SEC by the Company will also be available free of charge under the “Investors—Financials & Filings—SEC filings” section of the Company’s website at gldd.com.
For further information contact: Eric Birge Vice President of Investor Relations 313-220-3053
Fourth Quarter 2025 Revenues of $345.1 Million Reflect 21.9 Percent Growth and 20.0 Percent Organic Growth Over Fourth Quarter 2024 Revenues of $283.1 Million
Unmanned Systems Fourth Quarter 2025 Revenues of $68.5 Million Reflect 12.1 Percent Organic Growth Over Fourth Quarter 2024 Revenues of $61.1 Million
Kratos Government Solutions Fourth Quarter 2025 Revenues of $276.6 Million Reflect 22.2Percent Organic Growth Over Fourth Quarter 2024 Revenues of $222.0 Million
Fourth Quarter 2025 Consolidated Book to Bill Ratio of 1.3 to 1 and Bookings of $438.3 Million
Full Year 2025 Consolidated Revenues of $1.347 Billion Reflect 16.6 Percent Organic Growth Over Full Year 2024 Consolidated Revenues of $1.136 Billion
Last Twelve Months Ended December 28, 2025, Consolidated Book to Bill Ratio of 1.1 to 1 and Bookings of $1.475 Billion
Fiscal 2026 Base Case Revenue Forecast of $1.595 Billion to $1.675 Billion and Adjusted EBITDA Forecast of $157.0 million to $167.0 million or 9.9% to 10.0% of Revenue, including Recently Closed Nomad Global Communication Solutions Acquisition
SAN DIEGO, Feb. 23, 2026 (GLOBE NEWSWIRE) — Kratos Defense & Security Solutions, Inc. (Nasdaq: KTOS), a Technology, Hardware, Products, System and Software Company addressing the Defense, National Security and Commercial Markets, today reported its fourth quarter 2025 financial results, including Revenues of $345.1 million, Operating Income of $8.2 million, Net Income of $5.9 million, Adjusted EBITDA of $34.1 million and a consolidated book to bill ratio of 1.3 to 1.0.
Fourth quarter 2025 Net Income and Operating Income includes non-cash stock compensation expense of $9.1 million, and Company-funded Research and Development (R&D) expense of $9.8 million, including efforts in our Space, Satellite, Unmanned Systems and Microwave Electronic businesses.
Kratos reported in the fourth quarter 2025 GAAP Net Income of $5.9 million and GAAP Net Income per share of $0.03, compared to GAAP Net Income of $3.9 million and GAAP Net Income per share of $0.03, for the fourth quarter of 2024. Adjusted earnings per share (EPS) were $0.18 for the fourth quarter of 2025, compared to $0.13 for the fourth quarter of 2024.
Fourth quarter 2025 Revenues of $345.1 million increased $62.0 million, reflecting 20.0 percent organic growth from fourth quarter 2024 Revenues of $283.1 million. Organic revenue growth was reported in our Unmanned Systems segment of 12.1 percent and in our KGS segment of 22.2 percent. The most notable growth in our KGS Segment was in our Defense Rocket Systems, Microwave Products, and Space, Training and Cyber businesses, with organic revenue growth rates of 47.4 percent, 32.4 percent and 22.7 percent, respectively, compared to the fourth quarter of 2024.
Fourth quarter 2025 Cash Flow Generated by Operations was $12.1 million, primarily reflecting the working capital requirements related to the 21.9 percent revenue growth impacting our receivables, and also including increases in inventory balances related to ramps in production and investments we are making related to certain development initiatives in our Unmanned Systems (KUS) segment, aggregating approximately $51.8 million in working capital use for these items during the quarter. Free Cash Flow Used in Operations for the fourth quarter of 2025 was $0.1 million after funding of $24.2 million of capital expenditures, and net of $12.0 million of proceeds from the sale of Valkyrie units which were previously built as company owned assets and reflected as capital expenditures and therefore the receipt of these sales is reflected in cash flows from investing activities.
For the fourth quarter of 2025, KUS generated Revenues of $68.5 million, compared to $61.1 million in the fourth quarter of 2024, with the increase primarily driven by Valkyrie related activity. KUS’s Operating Income was $1.9 million in the fourth quarter of 2025, compared to an Operating Loss of $0.7 million in the fourth quarter of 2024. KUS’s Adjusted EBITDA for the fourth quarter of 2025 was $6.4 million, compared to $2.6 million for the fourth quarter of 2024, reflecting the impact of the revenue volume and mix. KUS’s book-to-bill ratio for the fourth quarter of 2025 was 1.9 to 1.0 and 1.2 to 1.0 for the twelve months ended December 28, 2025, with bookings of $127.7 million for the three months ended December 28, 2025, and bookings of $358.6 million for the twelve months ended December 28, 2025. Total backlog for KUS at the end of the fourth quarter of 2025 was $361.7 million, compared to $302.5 million at the end of the third quarter of 2025.
For the fourth quarter of 2025, Kratos’ Government Solutions (KGS) segment Revenues of $276.6 million increased from Revenues of $222.0 million in the fourth quarter of 2024, reflecting a 22.2 percent organic growth rate, excluding the impact of the February 2025 acquisition of certain assets of Norden Millimeter, Inc. The increased Revenues includes organic revenue growth across all KGS businesses, with the most notable growth in our Defense and Rocket Support business, Microwave Products business and in our Space, Training and Cyber businesses with organic revenue growth rates of 47.4 percent, 32.4 percent, and 22.7 percent, respectively, over the fourth quarter of 2024.
KGS reported Operating Income of $17.3 million in the fourth quarter of 2025 compared to $11.0 million in the fourth quarter of 2024, primarily reflecting the mix in revenues and increased volume. Fourth quarter 2025 KGS Adjusted EBITDA was $27.7 million, compared to fourth quarter 2024 KGS Adjusted EBITDA of $22.6 million, primarily reflecting the volume and mix in revenues and resources.
KGS reported a book-to-bill ratio of 1.1 to 1.0 for the fourth quarter of 2025, a book-to-bill ratio of 1.1 to 1.0 for the last twelve months ended December 28, 2025, and bookings of $310.7 million and $1.117 billion for the three and last twelve months ended December 28, 2025, respectively. KGS’s total backlog was $1.212 billion at the end of the fourth quarter of 2025, compared to $1.178 billion at the end of the third quarter of 2025.
Kratos reported consolidated bookings of $438.3 million and a book-to-bill ratio of 1.3 to 1.0 for the fourth quarter of 2025, and consolidated bookings of $1.475 billion and a book-to-bill ratio of 1.1 to 1.0 for the last twelve months ended December 28, 2025. Consolidated backlog was $1.573 billion on December 28, 2025, as compared to $1.480 billion on September 28, 2025. Kratos’ bid and proposal pipeline was $13.7 billion on December 28, 2025, as compared to $13.5 billion at September 28, 2025. Backlog on December 28, 2025, included funded backlog of $1.232 billion and unfunded backlog of $341.4 million.
Full Year 2025 Results
Kratos reported its full year 2025 financial results, including Revenues of $1.347 billion, Operating Income of $25.6 million, Net Income of $22.0 million, Adjusted EBITDA of $119.9 million and a consolidated book to bill ratio of 1.1 to 1.0.
Included in the full year 2025 Net Income and Operating Income is non-cash stock compensation expense of $35.5 million, Company-funded Research and Development (R&D) expense of $40.0 million, including ongoing development efforts in our Space and Satellite Communications business to develop our first to market, virtual, software-based OpenSpace command & control (C2), telemetry tracking & control (TT&C) and other ground system solutions, and ongoing development efforts in our Unmanned Systems and Microwave Products businesses.
Kratos reported full year 2025 GAAP Net Income of $22.0 million and GAAP Net Income per share of $0.13, compared to $16.3 million and GAAP Net per share of $0.11, for the full year 2024. Adjusted earnings per share (EPS) were $0.55 for the full year 2025, compared to $0.49 for the full year 2024.
Full year 2025 Revenues of $1.347 billion increased $210.5 million from 2024, reflecting 18.5 percent growth and 16.6 percent organic growth. Full year 2025 Cash Flow Used in Operations was $42.1 million, reflecting the working capital uses to fund revenue growth resulting primarily in increases in receivables, inventories, prepaid assets and investments in other assets and reduction of deferred revenues or advanced customer payments. Free Cash Flow Used in Operations was $125.4 million after funding $95.3 million of capital expenditures, and net of $12.0 million of proceeds from sale of Valkyrie units which were previously built as company owned assets and reflected as capital expenditures. Full year 2025 capital expenditures were elevated due primarily to the manufacture of the two production lots of Valkyries prior to contract award to meet anticipated customer orders and requirements and due to investments related to the expansion and addition of production facilities.
For full year 2025, KUS generated Revenues of $292.0 million, as compared to $270.5 million in the full year 2024, reflecting 7.9 percent organic growth, primarily reflecting increased Valkyrie and tactical drone activity. KUS’s Operating Income was $2.6 million in full year 2025 compared to $2.9 million in full year 2024. KUS’s Adjusted EBITDA for full year 2025 was $18.1 million, compared to full year 2024 Adjusted EBITDA of $16.3 million, reflecting the increased volume partially offset by increased material and subcontractor costs on multi-year fixed price contracts.
For full year 2025, KGS Revenues of $1.055 billion increased $189.0 million, reflecting 19.3 percent organic growth from Revenues of $865.8 million in full year 2024. The increased Revenues includes organic revenue growth across all of our business units, with the most notable increases in our Defense Rocket Support, Microwave Products, and Space, Training and Cyber businesses, with organic revenue growth rates of 56.3 percent, 17.1 percent and 13.6 percent, respectively.
KGS reported operating income of $60.6 million in full year 2025 compared to $56.6 million in full year 2024, primarily reflecting the increased revenue volume. Full year 2025 KGS Adjusted EBITDA was $101.8 million, compared to full year 2024 KGS Adjusted EBITDA of $89.4 million, primarily reflecting the increased revenue.
Eric DeMarco, Kratos’ President and CEO, said, “We finished 2025 exceeding our financial objectives for the fourth quarter, generating approximately 20 percent Q4 year- over-year organic Revenue growth, generating a 1.3 to 1.0 book to bill ratio on top of this 20 percent organic growth, having a record backlog of $1.573 billion, and a record opportunity pipeline of $13.7 billion, with the opportunity set for Kratos having never been stronger and continuing to increase. Kratos is positioned to achieve our previously communicated 2026 and 2027 financial targets, and similar to 2025, for 2026 we expect our business to accelerate throughout the year, with increasing Revenue volume and Adjusted EBITDA margins, as several new programs, contracts and initiatives begin, ramp and expand.”
Mr. DeMarco continued, “Since our last report, the global National Security opportunity and funding environment for the industry and for Kratos has significantly improved, including the extended U.S. Federal Government shutdown being resolved, the Continuing Resolution being resolved, the 2026 NDAA being signed and the fiscal 2026 Defense Appropriations Bill being signed, bringing the total 2026 National Security related approved spend to approximately $1 trillion. There is a generational recapitalization of the defense industrial base underway due to the geopolitical and related global threat environment, one that we believe that Kratos is uniquely positioned to address. Rapidly manufacturing and delivering affordable military grade hardware, at scale, that must work every time, is hard, and our customers and partners recognize this as one of Kratos’ key differentiators.”
Mr. DeMarcowent on, “We recently announced that our teammate Northrop Grumman received the MUX TACAIR Collaborative Combat Aircraft, or CCA, program award, with Kratos Valkyrie as the CCA aircraft, equipped with Northrop’s mission systems. Additionally, Kratos has now successfully received another tactical drone program of record contract award, and I believe that we are in a sole source position for two additional tactical drone program opportunities, including for Valkyrie. As a result of our progress and based upon expected future customer contractually required delivery schedules, we will be executing a plan in 2026 to increase our rate of production up to approximately 40 Valkyries annually by the end of 2027.”
Mr. DeMarco added, “We now have 120 Kratos Zeus and Oriole solid rocket motors on order, with deliveries of the SRMs to Kratos expected to begin in Q3 of this year and expected to ramp into 2027, and the SRMs are either under customer contract or are directly related to expected hypersonic or “other” vehicle system integration and launch efforts to be performed. Additionally, it was recently announced that Kratos was selected to develop a next generation, highly maneuverable hypersonic missile, with certain other non-traditional vendors. We are also hoping to receive an additional approximate $1 Billion hypersonic program related opportunity by the end of this year, which we believe will be sole source to Kratos as prime. Kratos’ hypersonic franchise is expected to be a primary driver of our expected future revenue growth.”
Mr. DeMarcoconcluded, “We believe that Kratos’ strategy and consistent business plan since inception, including making true internally funded investments ahead of government commitment, for facilities, manufacturing capability and relevant products for the warfighter, while not paying dividends or buying back our stock, are aligned with the current Administration and is an important differentiator for Kratos. I believe that due to the global threat environment, certain customers are out of time, have limited immediate resources, and that the significant investments that Kratos has made to be first-to-market with relevant systems, hardware and software are now invaluable. We believe that the scarcity value of Kratos is clear, and we are laser focused on our balanced business model of making investments, rapidly delivering affordable products and systems to the warfighter at scale, and generating a financial return for our investors.”
Financial Guidance We are providing our first quarter and full year Base Case 2026 guidance, which includes our assumptions, including as related to: current forecasted business mix, expected employee sourcing, hiring and retention; potential manufacturing, production and supply chain disruptions; potential parts shortages and related continued significant cost and price increases in each of these areas, all of which are impacting the industry and Kratos. We are also making significant investments in bid, proposal and other new program opportunity areas, which are currently adversely impacting our profit margins. These investments are expected to continue at least into Kratos’ fiscal 2027, as our opportunity pipeline continues to increase.
Kratos’ operating cash flow guidance also assumes certain investments in our Rocket Systems and Unmanned Systems businesses, related to the procurement of rocket and related systems and our plan to begin producing approximately 40 Valkyries annually beginning by the end of 2027 as well as the completion of certain of our unmanned systems and related derivatives and vehicles. Additional forecasted investments in 2026 include our funding of the Prometheus joint venture established last year, our Anaconda radar program, our Helios hypersonic and arc chamber program, our Indiana hypersonic integration facility, our Birmingham advanced manufacturing facility for hypersonics, expansion and new microwave electronics facilities in Israel and the US, our GEK and BladeWorks engine facilities, the continued build of our second lot of 12 Valkyrie aircraft, and our Vulcan, Kraken, Elysium, Nemesis, Hermes and other initiatives. In summary, Kratos continues to make the required investments to support the rebuild of the U.S. defense industrial base and related infrastructure, take advantage of the ongoing generational recapitalization of strategic and other weapon and National Security related systems, and generate value for all Kratos stakeholders, including the warfighter and Kratos shareholders.
Our first quarter and full year Base Case 2026 guidance ranges, which includes the recently closed Nomad Global Communication Solutions acquisition, and a summary of the forecasted investments for new programs and opportunities are presented below.
For Kratos’ Base Case fiscal year 2026 forecast, we currently expect the first fiscal quarter to be the lowest in both revenue and Adjusted EBITDA, including as a result of the extended U.S. Federal Government shutdown in the fourth quarter of fiscal 2025, which impacted government contracting, program, administrative and other functions and offices. The impact of the shutdown, we believe, resulted in among other issues, the delay of certain “short turn” contract awards to Kratos, including certain expected software, data related and product sales, which typically generate higher than our normal profit margins. We believe the government shutdown also resulted in a delay in the award of certain longer-term contracts, programs and funding. With the government shutdown now over and the Department of War (DoW) and related Federal Agencies at full function again, we expect to receive these contract and program awards, sales and funding, beginning in our second quarter of 2026. The expected overall lower revenue in our first fiscal quarter is expected to result in lower Adjusted EBITDA, including as a result of the loss of financial leverage on certain of our fixed general, administrative, overhead, infrastructure, bid, proposal and other costs, with a more pronounced impact as we have expanded our infrastructure to support our growing businesses.
Also contributing to our expectation that Kratos second half of fiscal 2026 will have significantly higher Revenue and Adjusted EBITDA than the first half, we expect to begin to receive in the second half of 2026 certain long lead items related to existing customer funded programs, including solid rocket motors and other hardware related to certain hypersonic and other programs, hardware and components related to jet engine and propulsion system development and production, and hardware related to air defense, missile, radar and other National Security system production.
As a result of all of the above, we expect Kratos’ second quarter of fiscal 2026 to have somewhat increased Revenue and Adjusted EBITDA over our fiscal first quarter, and we expect Kratos’ second half of fiscal year 2026 Revenue, Adjusted EBITDA and operating cash flow to be greater than our first half, as our Revenue increases, Adjusted EBITDA margins are expected to expand and contract funding is expected to increase. All financial forecasts provided today include the expected contribution from the recently closed acquisition of Nomad Global Communication Solutions, Incorporated.
We continue to expect Base Case Kratos’ full year 2026 organic revenue growth to be approximately 15 percent to 20 percent above our full year fiscal 2025 revenue financial forecast, which we previously provided in November 2025, and which we exceeded. We continue to expect Kratos’ Base Case full year 2027 organic revenue growth to be approximately 18 percent to 23 percent above the full year fiscal 2026 revenue forecast we provided today. We continue to expect Kratos’ full year 2026 Adjusted EBITDA margin rates to be approximately 100 bps greater than our reported 2025 Adjusted EBITDA margin rates. And we continue to expect our current forecast 2027 Adjusted EBITDA margin rates to increase an additional 100 bps above 2026 Adjusted EBITDA margin rates. Kratos’ Base Case Revenue and Adjusted EBITDA forecasts do not include large scale production of Kratos Valkyrie or other tactical drone production, which will only be included once Kratos receives definitized customer delivery schedules that we can accurately forecast. Additionally, none of the above financial information includes the estimated impact from the pending Orbit Technologies Ltd acquisition, which financial information will only be included once the acquisition closes.
Management will discuss the Company’s financial results at a conference call beginning at 2:00 p.m. Pacific (5:00 p.m. Eastern) today. The call will be available at www.kratosdefense.com. Participants may register for the call using this Online Form. Upon registration, all telephone participants will receive the dial-in number along with a unique PIN that can be used to access the call. For those who cannot access the live broadcast, a replay will be available on Kratos’ website.
About Kratos Defense & Security Solutions
Kratos Defense & Security Solutions, Inc. (NASDAQ: KTOS) is a technology, hardware, products, system and software company addressing the defense, national security, and commercial markets. Kratos makes true internally funded research, development, capital and other investments, to rapidly develop, produce and field relevant solutions that address our customers’ mission critical needs and requirements. At Kratos, affordability is a technology, and we seek to utilize proven, leading-edge approaches and technology, not unproven bleeding edge approaches or technology, with Kratos’ approach designed to reduce cost, schedule and risk, enabling us to be first to market with cost effective solutions. We believe that Kratos is known as the innovative disruptive change agent in the industry, a company that is an expert in designing products and systems up front for successful rapid, large quantity, low-cost future manufacturing, which is a value-add competitive differentiator for our large traditional prime system integrator partners and also to our government and commercial customers. Kratos intends to pursue program and contract opportunities as the prime or lead contractor when we believe our probability of win is high and any investment required by Kratos is within our capital resource comfort level. We intend to partner and team with a large, traditional system integrator when our assessment of probability of win is greater or required investment is beyond Kratos’ comfort level. Kratos’ primary business areas include, virtualized ground systems for satellites and space vehicles including software for command & control (C2) and telemetry, tracking and control (TT&C), jet powered unmanned aerial drone systems, hypersonic vehicles and rocket systems, propulsion systems for drones, missiles, loitering munitions, supersonic systems, space craft and launch systems, command, control, communication, computing, combat, intelligence surveillance and reconnaissance (C5ISR) and microwave electronic products for missile, radar, air defense, missile defense, space, satellite, counter unmanned aircraft systems (CUAS), directed energy, communication and other systems, and virtual & augmented reality training systems for the warfighter. For more information, visit www.KratosDefense.com
Notice RegardingForward–LookingStatements This news release contains certain forward-looking statements that involve risks and uncertainties, including, without limitation, express or implied statements concerning the Company’s expectations regarding its future financial performance, including the Company’s expectations for its first quarter, second quarter, first half, second half, and full year 2026 revenues, R&D, operating income, depreciation, amortization, stock based compensation expense, and Adjusted EBITDA, and full year 2026 operating cash flow, capital expenditures, investments, and free cash flow, forecasted company and business unit organic revenue growth, estimated revenue and organic revenue growth for 2026 and 2027, Adjusted EBITDA margins in 2026 and 2027, future initiation of higher margin programs and negotiation of lower margin contracts which are expected to be renewed in the future, expected future investments in property, plant, facilities, and equipment (including expected investments in the Prometheus joint venture and other programs, opportunities, and initiatives), expected future production of Valkyries, the ability of the Company’s customers to respond to industry and market conditions, the impact of acquired companies and businesses on the Company’s operations and financial condition, the Company’s bid and proposal pipeline and backlog, including the Company’s ability to timely execute on its backlog, demand for its products and services, including the Company’s alignment with today’s National Security requirements and the positioning of its C5ISR and other businesses, ability to successfully compete and expected new customer awards, the impact of federal government shutdowns on the Company’s operations and financial condition, the availability and timing of government funding for the Company’s offerings, availability of an experienced skilled workforce, inflation and increased costs, risks related to potential cybersecurity events or disruptions of our information technology systems, and delays in our financial projections, industry, business and operations, including projected growth. Such statements are only predictions, and the Company’s actual results may differ materially from the results expressed or implied by these statements. Investors are cautioned not to place undue reliance on any such forward-looking statements. All such forward-looking statements speak only as of the date they are made, and the Company undertakes no obligation to update or revise these statements, whether as a result of new information, future events or otherwise. Factors that may cause the Company’s results to differ include, but are not limited to: risks to our business and financial results related to the reductions and other spending constraints imposed on the U.S. Government and our other customers, including as a result of sequestration and extended continuing resolutions, the Federal budget deficit and Federal government shut-downs; risks of adverse regulatory action or litigation; risks associated with debt leverage; risks that our cost-cutting initiatives will not provide the anticipated benefits; risks that changes, cutbacks or delays in spending by the DoW may occur, which could cause delays or cancellations of key government contracts; risks of delays to or the cancellation of our projects as a result of protest actions submitted by our competitors; risks that changes may occur in Federal government (or other applicable) procurement laws, regulations, policies and budgets; risks of the availability of government funding for the Company’s products and services due to performance, cost growth, or other factors, changes in government and customer priorities and requirements (including cost-cutting initiatives, the potential deferral of awards, terminations or reduction of expenditures to respond to the priorities of Congress and the Administration, or budgetary cuts resulting from Congressional committee recommendations or automatic sequestration under the Budget Control Act of 2011, as amended); risks that the unmanned aerial systems and unmanned ground sensor markets do not experience significant growth; risks that products we have developed or will develop will not become programs of record; risks that we cannot expand our customer base or that our products do not achieve broad acceptance which could impact our ability to achieve our anticipated level of growth; risks of increases in the Federal government initiatives related to in-sourcing; risks related to security breaches, including cyber security attacks and threats or other significant disruptions of our information systems, facilities and infrastructures; risks related to our compliance with applicable contracting and procurement laws, regulations and standards; risks related to the new DoW Cybersecurity Maturity Model Certification; risks relating to the ongoing conflict in Ukraine and the Israeli-Palestinian military conflict; risks to our business in Israel; risks related to contract performance; risks related to failure of our products or services; risks associated with our subcontractors’ or suppliers’ failure to perform their contractual obligations, including the appearance of counterfeit or corrupt parts in our products; changes in the competitive environment (including as a result of bid protests); failure to successfully integrate acquired operations and compete in the marketplace, which could reduce revenues and profit margins; risks that potential future goodwill impairments will adversely affect our operating results; risks that anticipated tax benefits will not be realized in accordance with our expectations; risks that a change in ownership of our stock could cause further limitation to the future utilization of our net operating losses; risks that we may be required to record valuation allowances on our net operating losses which could adversely impact our profitability and financial condition; risks that the current economic environment will adversely impact our business, including with respect to our ability to recruit and retain sufficient numbers of qualified personnel to execute on our programs and contracts, as well as expected contract awards and risks related to increasing interest rates; currently unforeseen risks associated with any public health crisis, and risks related to natural disasters or severe weather. These and other risk factors are more fully discussed in the Company’s Annual Report on Form 10-K for the period ended December 28, 2025, and in our other filings made with the Securities and Exchange Commission.
Note Regarding Use of Non-GAAP Financial Measures and Other Performance Metrics This news release contains non-GAAP financial measures, including organic revenue growth rates, Adjusted EPS (computed using income before income taxes, excluding depreciation, amortization of intangible assets, amortization of capitalized contract and development costs, stock-based compensation expense, acquisition and restructuring related items and other, which includes, but is not limited to, legal related items, non-recoverable rates and costs, and foreign transaction gains and losses, less the estimated impact to income taxes) and Adjusted EBITDA (which excludes, among other things, acquisition and restructuring related items, stock compensation expense, foreign transaction gains and losses, and the associated margin rates). Additional non-GAAP financial measures include Free Cash Flow from Operations computed as Cash Flow from Operations less Capital Expenditures plus proceeds from sale of assets and Adjusted EBITDA related to our KUS and KGS businesses. Kratos believes this information is useful to investors because it provides a basis for measuring the Company’s available capital resources, the actual and forecasted operating performance of the Company’s business and the Company’s cash flow, excluding non-recurring items and non-cash items that would normally be included in the most directly comparable measures calculated and presented in accordance with GAAP. The Company’s management uses these non-GAAP financial measures, along with the most directly comparable GAAP financial measures, in evaluating the Company’s actual and forecasted operating performance, capital resources and cash flow. Non-GAAP financial measures should not be considered in isolation from, or as a substitute for, financial information presented in compliance with GAAP, and investors should carefully evaluate the Company’s financial results calculated in accordance with GAAP and reconciliations to those financial results. In addition, non-GAAP financial measures as reported by the Company may not be comparable to similarly titled amounts reported by other companies. As appropriate, the most directly comparable GAAP financial measures and information reconciling these non-GAAP financial measures to the Company’s financial results prepared in accordance with GAAP are included in this news release.
Another Performance Metric the Company believes is a key performance indicator in our industry is our Book to Bill Ratio as it provides investors with a measure of the amount of bookings or contract awards as compared to the amount of revenues that have been recorded during the period and provides an indicator of how much of the Company’s backlog is being burned or utilized in a certain period. The Book to Bill Ratio is computed as the number of bookings or contract awards in the period divided by the revenues recorded for the same period. The Company believes that the rolling or last twelve months’ Book to Bill Ratio is meaningful since the timing of quarter-to-quarter bookings can vary.
")