What Will the First Week of Spring 2023 Bring Investors?
The week started out with Swiss authorities having persuaded UBS Group AG (UBSG.S) on Sunday to buy Credit Suisse Group AG (CSGN.S). UBS will pay 3 billion Swiss francs ($3.23 billion) for 167-year-old Credit Suisse and assume up to $5.4 billion in losses in a deal backed by a massive Swiss guarantee. It is expected to close on the deal this year.
The main focus of investors this week is still expected to be the two-day FOMC meeting and rate decision on Wednesday. While the need to dampen inflation hasn’t changed, weakness in the banking system, in part brought on by weaker asset prices which occurs naturally with higher rates, may cause the Fed to adjust its approach.
Monday 3/20
No Economic numbers are to be released
5:24 PM ET, Spring 2023 begins.
Tuesday 3/21
9:00 AM ET, The first day of a two-day Federal Open Market Committee (FOMC) begins.
10:00 AM ET, Existing Home Sales for February are expected to rise to a 4.17 million annualized rate after January’s lower-than-expected 4.0 million rate.isting home sales in
Wednesday 3/22
10:30 AM ET, The Energy Information Administration (EIA) Petroleum Status Report, provides weekly information on petroleum inventories in the U.S., whether produced here or abroad. The level of inventories helps determine prices for petroleum products.
2:00 PM ET, FOMC statement released. It has been a year since the Fed began its tightening post FOMC meetings and is expected to raise rates again. However, the statement after the meeting should yield clues as to the impact, if any, weakness in banks has on the path forward for the Fed.
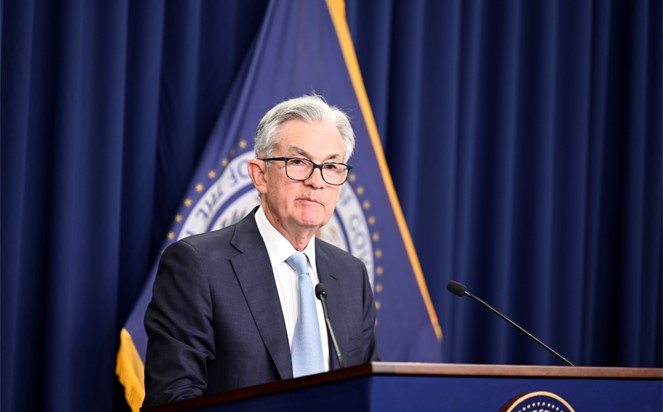
2:30 PM ET, Federal Reserve Chair J. Powell will hold a press conference to discuss the Fed’s decision.
Thursday 3/23
8:30 AM ET, Jobless Claims Jobless for the week of March 18 are expected to come in at 195,000 versus 192,000 in the prior week.
10:00 AM ET, New Home Sales are expected to fall to 645,000 after surging to a 670,000 annualized rate in January.
4:30 PM ET, The Federal Reserves Balance Sheet now includes the new Bank Term Funding Program (BTFP) announced last Sunday.
Friday 3/24
8:30 AM ET, Durable Goods Orders are expected to post a 1.5% rise in February boosted by an easy comparison against January’s 4.5% decline which was impacted by lower aircraft orders.
9:30 AM ET, The ST. Louis Federal Reserve President James Bullard is expected to give a public address. Bullard has been an outspoken hawk among Fed regional Presidents.
What Else
The markets are focused on the Fed announcement Wednesday, and holding its collective breath to see if there will be more bank closures and forced sales, or if there are only a few banks impacted by weak balance sheets.
On Tuesday there will be a live online event that is part of the Take Away series by Noble Capital Markets. This event will feature select mining companies from the PDAC mining conference held earlier this month. Learn more about the no cost event here.
For institutional or individual investors in New York or South Florida, there may be the opportunity to listen to the management of some interesting companies (no cost). Entravision (EVC) will be presenting in New York on March 23, and management of Maple Gold Mines (MGMLF) is making themselves available to meet investors on March 25 in Miami. Get more information here on attending.
On May 11 the Covid National Emergency Will Be Declared Over – Are You in the Right Stocks?
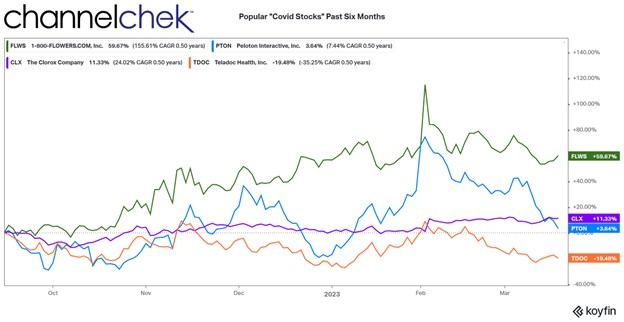
Were there any companies that had lasting benefits from the shutdowns and lockdowns in response to the pandemic? During the first two years of the 2020s, pandemic consumer behavior caused sports equipment makers, communications, ecommerce, and healthcare companies to be favorites of investors. As investors then pivoted and began to look for the “post-covid” trade, many of these high-flyers, including Peleton (PTON), Teledoc (TDOC), Chlorox (CLX) and others, no longer held the advantage they had, and sold off. The focus then turned to energy, leisure, and other segments that had been decimated during forced lockdowns and fear. While some once strong sectors and segments faltered, some ecommerce companies, that were experiencing growth going into the pandemic, received a huge, albeit challenging, boost during the changed economy. The astute ones took the opportunity to grow deeper roots.
Online businesses are one segment where many companies maintained their bulge from the Covid lockdowns. The following insights are largely from a roadshow I attended, supplemented by research by Noble Capital Markets on Channelchek.com. While this isn’t the only ecommerce business that has retained substantial benefits from the pandemic, it is a company that can serve as a template as to what to look for when doing your own fundamental analysis.
Toll free numbers (eight hundred numbers) for decades helped consumers overcome the reluctance to incur long-distance phone charges when needing help ordering from a mail order company. At the same time they saved the company from time-consuming collect calls. Introduced in 1967, it was a win-win technology that was quickly adopted and allowed broader reach.
From very humble beginnings an entrepreneur who still heads the company grew a 14-store flower shop based on Long Island by amassing enough financing to acquire 1-800-FLOWERS (FLWS), an ailing store based in Texas. His company instantly became a national brand through the use of this toll-free technology.
The company today is worth over $621 million and has not forgotten that they are a technology-based retailer. Their product is also not narrowly defined as flowers, but instead gifts for special occasions and people who are special to you. FLWS is a successful online retailer, willing to engage pertinent technology, learn from it, adapt that which works, and commercialize it to maintain a competitive edge in the ecommerce segment. This includes automation which helps offset post-pandemic era wage increases; artificial intelligence, which can help customers customize a notecard with a poem; and of course all that helps online retail build customers.
The pandemic allowed FLOWERS to double the size of its file of customers. On the revenue side, the company went from $1.2 billion in 2019, then quickly grew and peaked at $2.2 billion by March of 2022. They have been able to keep much of this revenue gain, and it isn’t going backward. This is because the ecommerce trend was already in place, but the pandemic helped accelerate the use and permanent adoption by individuals that are now in the habit of thinking online when it comes to special occasion gifts. This trend continues, even as the overall economy is showing cracks.
The negative for FLOWERS, like other retailers operating during the pandemic period, was grappling with supply chain issues and dramatically higher shipping costs. The cost of having a container shipped has now dropped significantly. FLWS, during the worst period, had worked to keep more than ample inventory of non-perishables since the supply-chain was not reliable. As a result, they are still working off more expensive inventory, which has the effect of a higher cost of goods sold, this shows up on financials as narrower profit margins. The working off of this more expensive inventory and replenishing it with goods with lower shipping costs should serve to expand profit margins going forward, even if revenue remains neutral.
Ecommerce
How might this this apply to other ecommerce companies? Flowers has innovative management that is not afraid to experiment with technology and adapt to their business those which helps save them money or reach more customers. A good way to discern this is by attending industry conferences such as NobleCon19 in December or attending roadshows as I did to meet FLWS management.
Another characteristic that this company had, that is admirable, is an acceleration of users during the pandemic that may not have otherwise decided to buy online. The company makes good use of this larger root system and stays in touch with the customers using its expanded list, sharing thoughts on other offerings.
An interesting situation of 1(800)-FLOWERS.com that may exist with others is the changed cost of shipping and inventory. This negative, which is still unwinding, provides a declining cost of goods sold for a period of time. This could translate into higher earnings, depending on other market and business factors – this could get the attention of investors. It’s important to note that once inventories are worked off, margins would stabilize, and lower-cost inventories would no longer contribute to net earnings.
Take Away
Meeting with management, in this case at a road show sponsored by Noble Capital Markets (see calendar here), or at a large investor conference such as NobleCon (Information provided here) helps provide insight into a company itself, an evaluation of management, plus ideas of what to look for in related companies. I wouldn’t expect CNBC or Bloomberg to spend as much time discussing a $621 million company as they spend on AAPL or MSFT, nor would I expect that the average investor can have breakfast with Elon Musk of Tesla or Mark Zuckerberg of META, and get to know their plans, their company, and current industry factors that they are challenged with.
If you are serious about discovering what’s beyond CNBC, Stocktwits, and Yahoo Finance, I recommend attending a meet-the-management style road show and if you can, an investment conference that showcases industries you are interested in.
Will Systemic Risks to the Banking System Override Inflation Concerns When the Fed Meets?
Yes, the Federal Reserve’s central objective is to help maintain a sound banking system in the United States. The Fed’s regional presidents are currently in a blackout period (no public appearances) until after the FOMC meeting ends on March 22. So there is little for markets to go on to determine if the difficulties being experienced by banks will hinder the Fed’s resolve to bring inflation down to 2%. Or if the systemic risks to banks will override concerns surrounding inflation. Below we discuss some of the considerations the Fed may consider at the next meeting.
The Federal Reserve’s sound banking system responsibility is part of its broader responsibility to promote financial stability in the U.S. economy. The Fed does its best to balance competing challenges through monetary policy to promote price stability (low-inflation), maintaining the safety and soundness of individual banks, and supervising and regulating the overall banking industry to ensure that it operates in a prudent and sound manner.
While the headline news after the Fed adjusts monetary policy is usually about the Fed Funds target, the Fed can also adjust Reserve Requirements for banks. Along with that, the rate paid on these reserves, Interest on Excess Reserves (IOER). Another key bank rate that is mostly invisible to consumers is the Discount Rate. This is the interest rate at which banks can borrow money directly from the Federal Reserve. The discount rate is set by the Fed’s Board of Governors and is typically higher than the Federal Funds rate.
Banks try to avoid going to the Discount Window at the Fed because using this more expensive money is a sign to investors or depositors that something may be unhealthy at the institution. Figures for banks using this facility are reported each Thursday afternoon. There doesn’t seem to be bright flashing warning signs in the March 9 report. The amount lent on average for the seven-day period ending Thursday March 9, had decreased substantially, following a decrease the prior week. While use of the Discount Window facility is just one indicator of the overall banking systems health, it is not sending up red flags for the Fed or other stakeholders.
The European Central Bank Raised Rates
There is an expression, “when America sneezes, the world catches a cold.” The actions of the central bank in Europe, (the equivalent of the Federal Reserve in the U.S.) demonstrates that the bank failures in the U.S. are viewed as less than a sneeze. The ECB raised interest rates by half of a percentage point on Thursday (March 16). This is in line with its previously stated plan, even as the U.S. worries surrounding the banking system have shaken confidence in banks and the financial markets in recent days.
The ECB didn’t completely ignore the noise across the Atlantic; it said in a statement that its policymakers were “monitoring current market tensions closely” and the bank “stands ready to respond as necessary to preserve price stability and financial stability in the euro area.”
While Fed Chair Powell is restricted from making public addresses during the pre-FOMC blackout period, it is highly likely that there have been conversations with his cohorts in Frankfurt.
The Fed’s Upcoming Decision
On March 14, the Bureau of Labor Statistics (BLS) reported core inflation (without volatile food and energy) rose in February. Another indicator, the most recent PCE index released on February 24 also demonstrated that core prices are rising at a pace faster than the Fed deems healthy for consumers, banking, or the economy at large. The inflation numbers suggest it would be perilous for the Fed to pause its tightening efforts now.
What has so far been limited to a few U.S. banks is not likely to have been a complete surprise to those that have been setting monetary policy for the last 12 months. It may have surprised most market participants, but warning signs are usually picked up by the FRS, FDIC, and even OCC well in advance. And before news of a bank closure becomes public. Yet, the FOMC continued raising rates and implementing quantitative tightening. The big difference today is, the world is now aware of the problems and the markets are spooked.
The post-meeting FOMC statement will likely differ vastly from the past few meetings. While what the Fed decides to do remains far from certain, what is certain is that inflation is still a problem, and rising interest rates mathematically erode the value of bank assets. At the same time, money supply (M2) is declining at its fastest rate in history. At its most basic definition, M2 is consumer’s cash position, including held at banks. As less cash is held at banks, some institutions may find themselves in the position SVB was in; they have to sell assets to meet withdrawals. The asset values, which were “purchased” at lower rates, now sell for far less than were paid for them.
This would seem to put the Fed in a box. However, if it uses the Discount Window tool, and makes borrowing easier by banks, it may be able to satisfy both demands. Tighter monetary policy, while providing liquidity to banks that are being squeezed.
Take Away
What the Fed will ultimately do remains far from certain. And a lot can happen in a week. Bank closings occur on Friday’s so the FDIC has the weekend to seize control. So if you’re concerned, don’t take Friday afternoons off.
If the Fed Declines to raise rates in March it could send a signal that the Fed is weakening its fight against inflation. This could cause rates to spike higher in anticipation of rising inflation. Everyone loses if that is the case, consumers, banks, and those holding U.S. dollars.
The weakness appears to be isolated in the regional-bank sector and was likely known to the Fed prior to the closing of the banks.
Consider this, only two things have changed for Powell since the last meeting, one is rising core CPI. The other is that he will have to do an even better job at building confidence post-FOMC meeting. Business people and investors want to know that the Fed can handle the hiccups along the path to stamping out high inflation.
FOMC Now Contending With Banks and Sticky Inflation
The Federal Reserve is facing a rather sticky problem. Despite its best efforts over the past year, inflation is stubbornly refusing to head south with any urgency to a target of 2%.
Rather, the inflation report released on March 14, 2023, shows consumer prices rose 0.4% in February, meaning the year-over-year increase is now at 6% – which is only a little lower than in January.
So, what do you do if you are a member of the rate-setting Federal Open Market Committee meeting March 21-22 to set the U.S. economy’s interest rates?
The inclination based on the Consumer Price Index data alone may be to go for broke and aggressively raise rates in a bid to tame the inflationary beast. But while the inflation report may be the last major data release before the rate-setting meeting, it is far from being the only information that central bankers will be chewing over.
Don’t let yourself be misled. Understand issues with help from experts
And economic news from elsewhere – along with jitters from a market already rather spooked by two recent bank failures – may steady the Fed’s hand. In short, monetary policymakers may opt to go with what the market has already seemingly factored in: an increase of 0.25-0.5 percentage point.
Here’s why.
While it is true that inflation is proving remarkably stubborn – and a robust March job report may have put further pressure on the Fed – digging into the latest CPI data shows some signs that inflation is beginning to wane.
Energy prices fell 0.6% in February, after increasing 0.2% the month before. This is a good indication that fuel prices are not out of control despite the twin pressures of extreme weather in the U.S. and the ongoing war in Ukraine. Food prices in February continued to climb, by 0.4% – but here, again, there were glimmers of good news in that meat, fish and egg prices had softened.
Although the latest consumer price report isn’t entirely what the Fed would have wanted to read – it does underline just how difficult the battle against inflation is – there doesn’t appear to be enough in it to warrant an aggressive hike in rates. Certainly it might be seen as risky to move to a benchmark higher than what the market has already factored in. So, I think a quarter point increase is the most likely scenario when Fed rate-setters meet later this month – but certainly no more than a half point hike at most.
This is especially true given that there are signs that the U.S. economy is softening. The latest Bureau of Labor Statistics’ Job Openings and Labor Turnover survey indicates that fewer businesses are looking as aggressively for labor as they once were. In addition, there have been some major rounds of layoffs in the tech sector. Housing has also slowed amid rising mortgage rates and falling prices. And then there was the collapse of Silicon Valley Bank and Signature Bank – caused in part by the Fed’s repeated hikes in its base rate.
This all points to “caution” being the watchword when it comes to the next interest rate decision. The market has priced in a moderate increase in the Fed’s benchmark rate; anything too aggressive has the potential to come as a shock and send stock markets tumbling.
This article was republished with permission from The Conversation, a news site dedicated to sharing ideas from academic experts. It represents the research-based findings and thoughts of Christopher Decker,Professor of Economics, University of Nebraska Omaha.
SVB Invested in the Entire Bubble of Everything Says, Renowned Economist
“SVB invested in the entire bubble of everything,” writes Daniel Lacalle, PhD, economist, fund manager,and once ranked as one of the top twenty most influential economists in the world (2016 and 2017). He explains in his article below the pathway the Silicon Valley bank took and “bets,” which it lost, that led to the bank’s quick demise. “Aaaaand it’s gone,” Lacalle says, borrowing a line from a South Park episode that originally aired in March 2009. – Paul Hoffman, Managing Editor, Channelchek
The second-largest collapse of a bank in recent history after Lehman Brothers could have been prevented. Now the impact is too large, and the contagion risk is difficult to measure.
The demise of the Silicon Valley Bank (SVB) is a classic bank run driven by a liquidity event, but the important lesson for everyone is that the enormity of the unrealized losses and the financial hole in the bank’s accounts would not have existed if not for ultra-loose monetary policy. Let me explain why.
As of December 31, 2022, Silicon Valley Bank had approximately $209.0 billion in total assets and about $175.4 billion in total deposits, according to their public accounts. Their top shareholders are Vanguard Group (11.3 percent), BlackRock (8.1 percent), State Street (5.2 percent) and the Swedish pension fund Alecta (4.5 percent).
The incredible growth and success of SVB could not have happened without negative rates, ultra-loose monetary policy, and the tech bubble that burst in 2022. Furthermore, the bank’s liquidity event could not have happened without the regulatory and monetary policy incentives to accumulate sovereign debt and mortgage-backed securities (MBS).
SVB’s asset base read like the clearest example of the old mantra “Don’t fight the Fed.” SVB made one big mistake: follow exactly the incentives created by loose monetary policy and regulation.
What happened in 2021? Massive success that, unfortunately, was also the first step to demise. The bank’s deposits nearly doubled with the tech boom. Everyone wanted a piece of the unstoppable new tech paradigm. SVB’s assets also rose and almost doubled.
The bank’s assets rose in value. More than 40 percent were long-dated Treasurys and MBS. The rest were seemingly world-conquering new tech and venture capital investments.
Most of those “low risk” bonds and securities were held to maturity. SVB was following the mainstream rulebook: low-risk assets to balance the risk in venture capital investments. When the Federal Reserve raised interest rates, SVB must have been shocked.
Its entire asset base was a single bet: low rates and quantitative easing for longer. Tech valuations soared in the period of loose monetary policy, and the best way to “hedge” that risk was with Treasurys and MBS. Why bet on anything else? This is what the Fed was buying in billions every month. These were the lowest-risk assets according to all regulations, and, according to the Fed and all mainstream economists, inflation was purely “transitory,” a base-effect anecdote. What could go wrong?
Inflation was not transitory, and easy money was not endless.
Rate hikes happened. And they caught the bank suffering massive losses everywhere. Goodbye, bonds and MBS prices. Goodbye, “new paradigm” tech valuations. And hello, panic. A good old bank run, despite the strong recovery of SVB shares in January. Mark-to-market unrealized losses of $15 billion were almost 100 percent of the bank’s market capitalization. Wipeout.
As the bank manager said in the famous South Park episode: “Aaaaand it’s gone.” SVB showed how quickly the capital of a bank can dissolve in front of our eyes.
The Federal Deposit Insurance Corporation (FDIC) will step in, but that is not enough because only 3 percent of SVB deposits were under $250,000. According to Time magazine, more than 85 percent of Silicon Valley Bank’s deposits were not insured.
It gets worse. One-third of US deposits are in small banks, and around half are uninsured, according to Bloomberg. Depositors at SVB will likely lose most of their money, and this will also create significant uncertainty in other entities.
SVB was the poster boy of banking management by the book. They followed a conservative policy of acquiring the safest assets—long-dated Treasury bills—as deposits soared.
SVB did exactly what those that blamed the 2008 crisis on “deregulation” recommended. SVB was a boring, conservative bank that invested its rising deposits in sovereign bonds and mortgage-backed securities, believing that inflation was transitory, as everyone except us, the crazy minority, repeated.
SVB did nothing but follow regulation, monetary policy incentives, and Keynesian economists’ recommendations point by point. SVB was the epitome of mainstream economic thinking. And mainstream killed the tech star.
Many will now blame greed, capitalism, and lack of regulation, but guess what? More regulation would have done nothing because regulation and policy incentivize buying these “low risk” assets. Furthermore, regulation and monetary policy are directly responsible for the tech bubble. The increasingly elevated valuations of unprofitable tech and the allegedly unstoppable flow of capital to fund innovation and green investments would never have happened without negative real rates and massive liquidity injections. In the case of SVB, its phenomenal growth in 2021 was a direct consequence of the insane monetary policy implemented in 2020, when the major central banks increased their balance sheet to $20 trillion as if nothing would happen.
SVB is a casualty of the narrative that money printing does not cause inflation and can continue forever. They embraced it wholeheartedly, and now they are gone.
SVB invested in the entire bubble of everything: Sovereign bonds, MBS, and tech. Did they do it because they were stupid or reckless? No. They did it because they perceived that there was very little to no risk in those assets. No bank accumulates risk in an asset it believes is high risk. The only way in which banks accumulate risk is if they perceive that there is none. Why do they perceive no risk? Because the government, regulators, central banks, and the experts tell them there is none. Who will be next?
Many will blame everything except the perverse incentives and bubbles created by monetary policy and regulation, and they will demand rate cuts and quantitative easing to solve the problem. It will only worsen. You do not solve the consequences of a bubble with more bubbles.
The demise of Silicon Valley Bank highlights the enormity of the problem of risk accumulation by political design. SVB did not collapse due to reckless management, but because they did exactly what Keynesians and monetary interventionists wanted them to do. Congratulations.
Lacalle was ranked as one of the top twenty most influential economists in the world in 2016 and 2017 by Richtopia. He holds the CIIA financial analyst title, with a postgraduate degree in higher business studies and a master’s degree in economic investigation.
The FDIC, no doubt, was working overtime this weekend trying to find a suitor for Silicon Valley Bank. The bank’s demise makes it the second-largest bank in US history to have not managed its risks well enough to survive. Investors, depositors, and other interested parties have been awakened and are now checking their own likelihood of overexposure to banks. Some of this exposure could be through investments in companies that had uninsured deposits at SVB.
One risk that may be impacting investors’ psyche now is recollections of 2008 and viewing last Friday’s bank closure as the canary (or Lehman Bros.) in the coal mine. Whether this is a singular incident or just the beginning of escalating problems remains to be seen. But investors tend to always look back on the most recent similar event then think “here we go again.” Important economic numbers aside, such as CPI on Tuesday, or Residential Construction on Thursday, the loudest news will be centered on SVB and whether the Fed will now pivot.
The Fed and regional Presidents have been in a blackout period since Saturday; this is normal leading up to an FOMC meeting (March 21-22). However, this blackout period has been partially breached with a joint statement between Fed Chair Powell and Treasury Secretary Yellen, who incidentally was his predecessor. Keep an eye on Channelchek news postings for more information on this statement.
Monday 3/13
No Economic numbers are to be released
Tuesday 3/14
6:00 AM ET, The Small Business Optimism index has been below the historical average of 98 for 13 months in a row. The small business optimism index comes a monthly survey that is by the National Federation of Independent Business (NFIB). The index is a composite of 10 seasonally adjusted components based on the following questions: plans to increase employment, plans to make capital outlays, plans to increase inventories, expect the economy to improve, expect real sales higher, current inventory, current job openings, expected credit conditions, now a good time to expand, and earnings trend.
8:30 AM ET, Consumer Price Index (CPI), investors now lay awake waiting for inflation reports. For February, core prices are expected to hold steady at an elevated 0.4 percent monthly gain, with overall prices also expected to rise 0.4 percent after January’s 0.5 percent rise. Annual rates, which in January were 6.4 percent overall and 5.6 percent for the core, are expected at 6.0 and 5.5 percent.
Wednesday 3/15
8:30 AM ET, Producer Price Index (PPI), this measure of wholesale inflation ought to be the second most market-impacting number of the week. After rising a sharper-than-expected 0.7 percent in January, producer prices in February are expected to slow to a monthly 0.3 percent. The annual rate in February is seen at 5.4 percent versus January’s 6.0 percent. February’s ex-food ex-energy rate is seen at 0.4 percent on the month and 5.2 percent on the year versus January’s 0.5 and 5.4 percent, both of which were also sharper than expected.
10:00 AM ET, The Housing Market Index jumped 4 points in January and another 7 points in February but further improvement, given a sharp rise in mortgage rates, is not expected for March where the consensus is a 1 point decline to 41.
10:00 AM ET, Business Inventories in January are expected to remain unchanged following 0.3 percent builds in both December and November. Rising inventories can be an indication of business optimism that sales will be growing in the coming months. By looking at the ratio of inventories to sales, investors can see whether production demands will expand or contract in the near future. On the other hand, if unintended inventory accumulation occurs then production will probably need to slow while current inventories are worked down. This is why business inventory data is a forward indicator.
10:00 AM ET, Atlanta Fed Business Inflation Expectations is was previously 2.9%. The percentage provides a monthly measure of year-ahead inflation expectations and inflation uncertainty from the perspective of firms. John Williams the President of the New York Fed will be speaking.
Thursday 3/16
8:30 AM ET, Housing Starts in February is expected to come in flat at 1.315 million. Permits that were 1.339 million in January, are also seen flat at 1.340 million.
8:30 AM ET, Jobless Claims for the March 11 week are expected to come in at 205,000 versus 211,000 in the prior week.
Friday 3/17
10:00 AM ET, Consumer Sentiment is expected to repeat at a depressed 67.0.
10:00 AM ET, the Index Leading Economic Indicators is expected to fall a further 0.2 percent in February. This index has been in severe decline though contraction did slow in January to minus 0.3 percent. It seldom moves markets as most of the components that make it up are already known.
What Else
The clock change ought to cause some traders to be more tired than normal. However, all will be looking to see the FDIC’s plans for SVB.
The markets have been a stock pickers market since January 2022. The consensus is that the stock indices will be weak after a strong January and bonds, according to the Fed itself, face strong monetary policy headwinds. Yet, inflation is high and therefore so are the detrimental erosive effects of price increases. So remaining in cash is like accepting a buying power loss.
For institutional or individual investors in New York or South Florida, there may be the opportunity to listen to the management of some interesting companies (no cost). The company that Michael Burry recently owned, GEO Group ($GEO) will be holding a luncheon roadshow in NYC on March 14. This is an interesting company with political policy headwinds and extreme historical positives. Get more information here on attending. Another interesting opportunity for investors to meet and question management of a company that doesn’t necessarily wilt with economic weakness is the breakfast (Boca Raton, FL) or lunch (Miami, FL) meetings with 1(800) FLOWERS ($FLWS). Register to see if there are still open seats here.
FDIC, Federal Reserve, and Treasury Issue Joint Statements on Silicon Valley Bank
In a joint statement released by Secretary of the Treasury Janet L. Yellen, Federal Reserve Board Chair Jerome H. Powell, and FDIC Chairman Martin J. Gruenberg, they announced actions they are now committed to taking to “protect the U.S. economy by strengthening public confidence in the banking system.” The actions are being taken to ensure that “the U.S. banking system continues to perform its vital roles of protecting deposits and providing access to credit to households and businesses in a manner that promotes strong and sustainable economic growth.”
Specifically, the actions directly impact two banks, Silicon Valley Bank in California and Signature Bank in New York, but it was made clear that it could be extended to other institutions. The joint news release reads, “After receiving a recommendation from the boards of the FDIC and the Federal Reserve and consulting with the President, Secretary Yellen approved actions enabling the FDIC to complete its resolution of Silicon Valley Bank, Santa Clara, California, in a manner that fully protects all depositors. Depositors will have access to all of their money starting Monday, March 13. No losses associated with the resolution of Silicon Valley Bank will be borne by the taxpayer.
In a second release by the three agencies, details were uncovered as to how this was designed to not impact depositors, with losses being borne by stockholders and debtholders. The release reads as follows:
“The additional funding will be made available through the creation of a new Bank Term Funding Program (BTFP), offering loans of up to one year in length to banks, savings associations, credit unions, and other eligible depository institutions pledging U.S. Treasuries, agency debt and mortgage-backed securities, and other qualifying assets as collateral. These assets will be valued at par. The BTFP will be an additional source of liquidity against high-quality securities, eliminating an institution’s need to quickly sell those securities in times of stress.
With approval of the Treasury Secretary, the Department of the Treasury will make available up to $25 billion from the Exchange Stabilization Fund as a backstop for the BTFP. The Federal Reserve does not anticipate that it will be necessary to draw on these backstop funds.
After receiving a recommendation from the boards of the Federal Deposit Insurance Corporation (FDIC) and the Federal Reserve, Treasury Secretary Yellen, after consultation with the President, approved actions to enable the FDIC to complete its resolutions of Silicon Valley Bank and Signature Bank in a manner that fully protects all depositors, both insured and uninsured. These actions will reduce stress across the financial system, support financial stability and minimize any impact on businesses, households, taxpayers, and the broader economy.
The Board is carefully monitoring developments in financial markets. The capital and liquidity positions of the U.S. banking system are strong and the U.S. financial system is resilient.”
Take Away
Confidence by depositors, investors, and all economic participants is important for those entrusted to keep the U.S. economy steady. The measures appear to strive for the markets to open on Monday with more calm than might otherwise have occurred.
While the sense of resolve of the steps explained in the two statements, both released at 6:15 ET Sunday evening is reminiscent of 2008, there is still no expectation that the problem is wider than a few institutions.
Without the Fed’s easy money, demand for housing would collapse, according to Ryan McMaken. McMaken, who authored the below article, is a former housing economist for the State of Colorado. He believes once the Fed pivots back to forcing down interest rates and again buying mortgage-backed securities (MBS), housing prices that have recently dipped, will again continue their march upward. He makes the case here that the housing market, without Fed support, faces difficult headwinds. – Paul Hoffman, Managing Editor, Channelchek
Last Friday, residential real estate brokerage firm Redfin released new data on home prices, showing that prices fell 0.6 percent in February, year over year. According to Redfin’s numbers, this was the first time that home prices actually fell since 2012. The year-over-year drop was pulled down by especially large declines in five markets: Austin (-11%), San Jose, California (-10.9%), Oakland (-10.4%), Sacramento (-7.7%), and Phoenix (-7.3%). According to Redfin, the typical monthly mortgage payment is now at a record high of $2,520.
The Redfin numbers come a few days before new numbers from the Case-Shiller home price index showing further slowing in home prices growth since late last year. The market’s expectation for December’s 20-city index had been -0.5 percent, month over month, and 5.8 percent, year over year. But the numbers came in worse (from the seller’s perspective) than was hoped. For December—the most recent monthly data available—the index ended up showing a month-over-month drop of -1.5 percent (seasonally adjusted), and a year-over-year gain of 4.6 percent (not seasonally adjusted).
By most accounts, the rapidly-slowing market faces headwinds thanks to rising interest rates, including the standard 30-year fixed mortgage, which is now back up over 6 percent. This puts homeownership out of reach for many first-time buyers and is also a big disincentive for current owners to “move-up” into higher-priced houses since any new home would come with a much higher mortgage rate than was available a year ago.
Not surprisingly, demand for new mortgages has plummeted. CNBC reported last week:
“Mortgage applications to purchase a home dropped 6% last week compared with the previous week, according to the Mortgage Bankers Association’s seasonally adjusted index. Volume was 44% lower than the same week one year ago and is now sitting at a 28-year low.”
So, sales have fallen and, at least according to Redfin, prices are falling too. This is what we should expect to see in any environment where the real estate market is not being incessantly fueled by easy money from the central bank. After all, easy money for real estate markets had been the main story since 2009. In recent months, however, the Fed has allowed interest rates to rise while pausing efforts to add more mortgage-backed securities (MBS) to the Fed’s portfolio. Without those key supports from policymakers, the real estate market simply lacks the market demand that is necessary to sustain rapid growth. Contrary to what countless mortgage brokers and real estate agents tell themselves and each other, there is precious little capitalism in real estate markets. It is a market that is thoroughly addicted to, and dependent on, continued stimulus and subsidization from the central bank.
Without the central bank propping up MBS demand in the secondary market, primary-market mortgage lenders have fewer dollars to throw around. That means higher interest rates and fewer eligible buyers. Similarly, by setting a higher target rate for the federal funds rate that banks must pay to manage liquidity, markets face less monetary growth in general. That comes with a lessening overall demand that—in the short term, at least—drives up incomes for both current and potential homebuyers.
Even worse, continued nominal income growth that does exist is not keeping up with price inflation. The result has been 22 months in a row of negative real wage growth, and that will translate to falling demand.
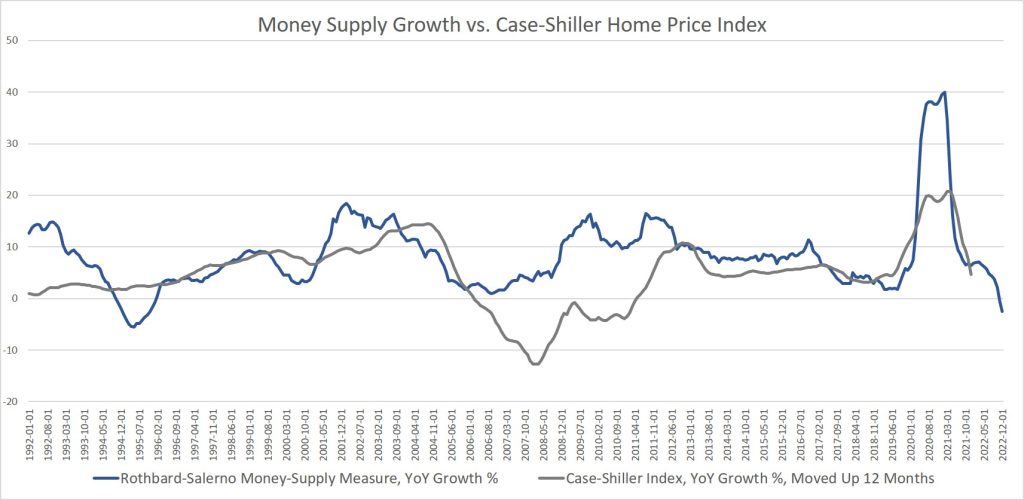
This close connection between easy money and demand for homes can be seen when we compare growth in the Case-Shiller index to growth in the money supply. This has been especially the case since 2009. As the graph shows, once money-supply growth begins to slow, a similar change occurs in home prices one year later.
As money-supply growth rapidly slowed after January 2021, we then saw a similar trend in home prices 12 months later, with a rapid deceleration in the Case-Shiller index. Remarkably, in November of last year, money-supply growth turned negative for the first time since 1994. That points toward continued drops in home prices throughout this year. If Redfin’s February numbers are any indicator, we should expect price growth to turn negative in the Case-Shiller numbers this spring.
Now just imagine how much more lackluster real estate markets would be without the Fed buying up all those trillions in MBS over the past decade. It’s now been more than a decade since we had any idea what real estate prices actually would be without enormous amounts of stimulus from the Fed. The money-printing-for-mortgages scheme entered its first phase throughout 2009 and 2010, and then was almost non-stop from 2013 to 2022, topping out around $1.7 trillion in 2018. The Fed had begun to pull back on its MBS assets in 2018 and 2019, but of course reversed course in 2020 and engaged in a frenzy of new MBS buying. In that period the Fed purchased an additional $1.4 trillion in MBS. That finally ended (for now) in the fall of 2022. The Fed still holds over $2.6 trillion in MBS assets.
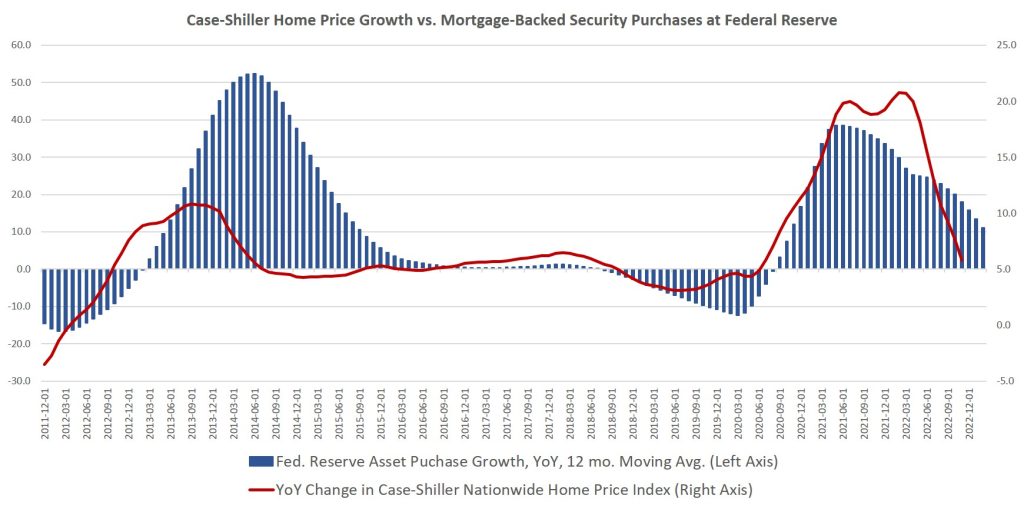
If we look at year-over-year changes in these MBS purchases along side Case-Shiller home prices, we again see a clear correlation:
It’s clear that once markets think the Fed may again increase its MBS purchases, home prices again surge. This close relationship should not surprise us since the volume of MBS purchases is a sizable portion of the overall market. Since 2020, the Fed’s MBS stockpile has equaled at least 20 percent of all the household mortgage debt in the United States. In early 2022, Fed-held MBS assets peaked at 24 percent of all US mortgage debt, but they still made up over 20 percent of the market as of late 2022.
Lest we think that real estate markets seem to be weathering the storm fairly well, let’s keep in mind this is all happening during a period when the unemployment rate is very low. Yes, the federal government has greatly exaggerated the amount of job growth that has occurred in the economy over the past 18 months. However, it’s also fairly clear that real estate markets are not yet seeing large numbers of unemployed workers who can’t pay their mortgages. When that does occur, we can expect an acceleration in falling home prices. For now, most mortgages are being paid, and even as real wages fall, most homeowners are cutting in places other than their mortgage payments. Once job losses do set in, all bets are off, and a wave of foreclosures will be likely. Many jobless workers won’t be able to sell quickly to avoid foreclosure either. With so few borrowers who can afford rising mortgage rates, there will be relatively few buyers. That’s when prices will really start to come down—when there is a mixture of motivated sellers and rising interest rates.
For now, though, the investor class remains relatively optimistic. Marcus Millichap CEO Hessam Nadji was on Fox Business last week flogging the now well-worn narrative that we should expect a “small recession,” but Nadji did not even entertain the idea that there might be sizable layoffs. Instead, he suggested that there is now a mere temporary softening of demand, and that will reverse itself once the Fed reverses course and embraces easy money again. In other words, the Fed will time everything perfectly, and it will be a “soft landing.”
This well captures the attitude of the “capitalists” heading the real estate industry right now. It’s all about the Fed. Without the Fed’s easy money, demand is down. Once the Fed pivots back to forcing down interest rates and buying up more MBS, well then happy times are here again. Gone is any discussion of worker productivity, savings, or other fundamentals that would drive demand in a areal capitalist market. All that matters now is a return to easy money. The real estate industry will get increasingly desperate for it. In 2023, it’s become the very foundation of their “market.”
About the Author
Ryan McMaken has a bachelors degree in economics and a master’s degree in public policy and international relations from the University of Colorado. He is the author of Breaking Away: The Case of Secession, Radical Decentralization, and Smaller Polities and Commie Cowboys: The Bourgeoisie and the Nation-State in the Western Genre. He was a housing economist for the State of Colorado. Ryan is a cohost of the Radio Rothbard podcast, has appeared on Fox News and Fox Business, and has been featured in a number of national print publications including Politico, The Hill, Bloomberg, and The Washington Post.
Image: Director of the Office of Management and Budget Shalanda Young besides President Biden (Credit: The White House, March 2022)
Investor Buy/Sell Patterns Could Change Under Biden Budget Proposals
The White House’s annual budget request to Congress has the power to move market sectors, as it’s a preliminary look at spending priorities and possible revenue sources. This year, alongside the pressure of Congress wrestling with raising the debt limit, the House Ways and Means Committee hearings related to the President’s budget could have a more significant impact than before. Treasury Secretary Janet Yellen will address the House committee on Friday, March 10th, and respond to questions. Taxation and spending priorities of the White House will be further revealed during this exchange.
The President’s proposed budget for the 2024 fiscal year proposes cutting the U.S. deficit “by nearly $3 trillion over the next decade,” according to White House Press Secretary Karine Jean-Pierre, this is a much larger number than the $2 trillion mentioned as a goal during the State of the Union address last month. Jean-Pierre explained to reporters that the proposed spending reduction is “something that shows the American people that we take this very seriously,” and it answers, “how do we move forward, not just for Americans today but for … other generations that are going to be coming behind us.”
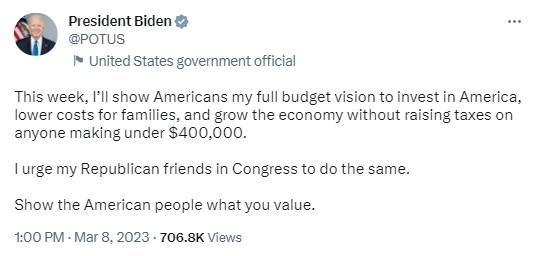
Source: Twitter
Biden’s requested budget includes a proposal that could impact healthcare as it would grow Medicare financing by raising the Medicare tax rate on earned and investment income to 5% from the current 3.8% for people making more than $400,000 a year.
Railroad safety measures are also included in Biden’s proposal, it asks for millions of additional funding for railroad safety measures spurred by recent derailments. The President also proposes a 5.2% pay raise for federal employees.
The budget deficit would be expected to shrink over ten years in part by raising taxes. One proposal investors should look out for is what has been called the Billionaire Minimum Income Tax. According to a White House brief, it “will ensure that the wealthiest Americans pay a tax rate of at least 20 percent on their full income, including unrealized appreciation. This minimum tax would make sure that the wealthiest Americans no longer pay a tax rate lower than teachers and firefighters.” The tax will apply only to the top 0.01% of American households (those worth over $100 million).
At present, the tax system discourages taking taxable gains on investments to postpone taxes. If adopted by Congress, a 20% tax on the unrealized appreciation of investments could have the effect of altering buying and selling patterns of securities, as well as real estate and other investments.
Jean-Pierre did say that the budget would propose “tax reforms to ensure the wealthy and large corporations pay their fair share while cutting wasteful spending on special interests like big oil and big pharma.” One reform, the White House has been outspoken about is corporate buybacks. He proposes, quadrupling the tax on corporate stock buybacks.
Take Away
The market will get insight beginning the second week of March 2023 into the financial priorities of the White House and thoughts on members of the House Ways and Means Committee. While nothing is set in stone, the White House and Congress would both seem to be on the same side of more fiscal restraint.
And although nothing is close to complete, the discussions and news of debate can have a dramatic impact on markets. For example, investors may be treated to more buybacks if it appears the tax on buybacks will increase in 2024. Another example would be a tax on the appreciated investments of wealthy individuals. It could follow that accounts of these individuals would have an increased incentive to transact than under a system where capital gains are only recognized by the IRS after taken.
Is the Fed Doing Too Much, Not Enough, or Just Right?
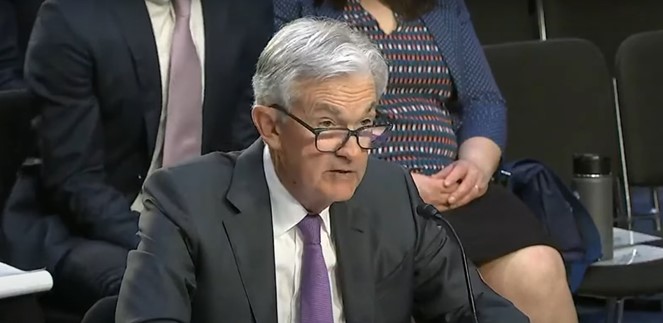
The Fed Reserve Chair Jerome Powell has an ongoing credibility problem. The problem is that markets, economists, and now Congress find him extremely credible. So credible that they have already declared him a winner fighting inflation, or of more pertinence, the economy a loser because Powell and the Fed policymakers have been so resolute in their fight against the rising cost of goods and services that soon there will be an abundance of newly unemployed, businesses will falter, and the stock market will be left in tatters. This view that he has already done too much and that the economy has been overkilled, even while it shows remarkable strength, was echoed many times during his visit to Capital Hill for his twice a year testimony.
“As of the end of December, there were 1.9 job openings for each unemployed individual, close to the all-time peak recorded last March, while unemployment insurance claims have remained near historic lows.” – Federal Reserve Chair Jay Powell (March 8, 2023).
Powell’s Address
Perhaps the most influential individual on financial markets in the U.S. and around the world, Fed Chair Powell continued his hawkish (inflation fighter, interest rate hiker) tone at his Senate and House testimonies. The overall message was; inflation is bad, inflation has been persistent, we will continue on the path to bring it down, also employment is incredibly strong, the employment situation is such that we can do more, we will do more to protect the U.S. economy from the ravages of inflation.
Powell began, “My colleagues and I are acutely aware that high inflation is causing significant hardship, and we are strongly committed to returning inflation to our 2 percent goal.” Powell discussed the forceful actions taken to date and added, “we have more work to do. Our policy actions are guided by our dual mandate to promote maximum employment and stable prices. Without price stability, the economy does not work for anyone. In particular, without price stability, we will not achieve a sustained period of labor market conditions that benefit all.”
Powell discussed the slowed growth last year; there were two periods of negative GDP growth reported during the first two quarters. He mentioned how the once red-hot housing sector is weakening under higher interest rates and that “Higher interest rates and slower output growth also appear to be weighing on business fixed investment.” He then discussed the impact on labor markets, “Despite the slowdown in growth, the labor market remains extremely tight. The unemployment rate was 3.4 percent in January, its lowest level since 1969. Job gains remained very strong in January, while the supply of labor has continued to lag.1 As of the end of December, there were 1.9 job openings for each unemployed individual, close to the all-time peak recorded last March, while unemployment insurance claims have remained near historic lows.”
On the subject of monetary policy, the head of the Federal Reserve mentioned that the target of 2% inflation has not been met and that recent numbers have it moving in the wrong direction. Powell also discussed that the Fed had raised short-term interest rates by adding 4.50%. He suggested that recent economic numbers require that an increase to where the sufficient height of fed funds peaks is likely higher than previously thought. All the while, he added, “we are continuing the process of significantly reducing the size of our balance sheet.”
Powell acknowledged some headway, “We are seeing the effects of our policy actions on demand in the most interest-sensitive sectors of the economy. It will take time, however, for the full effects of monetary restraint to be realized, especially on inflation. In light of the cumulative tightening of monetary policy and the lags with which monetary policy affects economic activity and inflation, the Committee slowed the pace of interest rate increases over its past two meetings.” Powell added, “We will continue to make our decisions meeting by meeting, taking into account the totality of incoming data and their implications for the outlook for economic activity and inflation.”
Questions and Answers
Congressmen both in the Senate and the House use the Semiannual Monetary Policy Report to Congress (formerly known as Humphrey Hawkins Testimony) to ask questions of the person with the most economic insight in Washington. Often their questions have already been covered in the Chair’s opening address, but Congresspeople will ask anyway to show their constituents at home that they are looking after them.
Elizabeth Warren is on the Senate Banking Committee; her math concluded the result of even a 1% increase in unemployment is a two million-worker job loss. Warren asked Powell, “Do you call laying off two million people this year not a sharp increase in unemployment?” “Explain that to the two million families who are going to be out of work.” In his response, Powell went back to historical numbers and reminded the Senator that an increase in unemployment would still rank the current economy above what Americans have lived through in most of our lifetimes, “We’re not, again, we’re not targeting any of that. But I would say even 4.5 percent unemployment is well better than most of the time for the last, you know, 75 years,” Chair Powell answered.
U.S. House Financial Services Committee on Wednesday heard Congressman Frank Lucas concerned about the pressure for the Fed to include climate concerns as an additional Fed mandate. Lucas from Oklahoma asked, “How careful are you in ensuring that the Fed does not place itself into the climate debate, and how can Congress ensure that the Fed’s regulatory tool kit is not warped into creating policy outcomes?” Powell answered that the Fed has a narrow but real role involving bank supervision. It’s important that individual banks understand and can manage over time their risks from any climate change and it’s impact on business and the economy. He wants to make sure the Fed never assumes a role where they are becoming a climate policymaker.
Other non-policy questions included Central Bank Digital Currencies. House Congressman Steven Lynch showed concerns that the Fed was experimenting with digital currencies. His question concerned receiving a public update on where they are with their partnership with MIT, their testing, and what they are trying to accomplish. Powell’s response seemed to satisfy the Congressman. “we engage with the public on an ongoing basis, we are also doing research on policy, and also technology,” said Powell. Follow-up questions on the architecture of a CBDC, were met with responses that indicated that the Fed, they are not at the stage of making decisions, instead, they are experimenting and learning. “How would this work, does it work, what is the best technology, what’s the most efficient.” Powell emphasized that the U.S. Federal Reserve is at an early stage, but making technological progress. They have not decided from a policy perspective if this is something that the country needs or desires.
Issues at Stake
As it relates to the stock and bond markets, the Fed has been holding overnight interest rates at a level that is more than one percentage point below the rate of inflation. The reality of this situation is that investors and savers that are earning near the Fed Funds rate on their deposits are losing buying power to the erosive effects of inflation. Those that are investing farther out on the yield curve are earning even less than overnight money. The impact here could be worse if inflation remains at current levels or higher, or better if the locked-in yields out longer on the curve are met with inflation coming down early on.
The Fed Chair indicated at the two testimony before both Houses of Congress that inflation has been surprisingly sticky. He also indicated that they might increase their expected stopping point on tightening credit. Interest rates out in the periods are actually lower than they had been in recent days and as much as 0.25% lower than they were last Fall. The lower market rates and inverted yield curve suggest the market thinks the Fed has already won and has likely gone too far. This thought process has made it difficult for the Fed Chair and others at the Fed that discuss a further need to throw cold water on an overheated economy. Fed Tightening has not led to an equal amount of upward movement out on the yield curve. This trust or expectation that the Fed has inflation under control would seem to be undermining the Fed’s efforts. With this, the Fed is likely to have to move even further to get the reaction it desires. The risk of an unwanted negative impact on the economy is heightened by the trust the bond market gives to Powell that he has this under control and may have already won.
Powell’s words are that the Fed has lost ground and has much more work to do.
Take Away
At his semiannual testimony to Congress, an important message was sent to the markets. The Fed has the right tools to do the job of bringing inflation down to the 2% range, but those tools operate on the demand side. In the U.S. we are fortunate to have two jobs open for every person seeking employment. While this is inflationary, it provides policy with more options.
As of the reporting of January economic numbers, a trend may be beginning indicating the Fed is losing its fight against inflation. It is likely that it will have to do more, but the Fed stands willing to do what it takes. Powell ended his prepared address by saying, “Everything we do is in service to our public mission. We at the Federal Reserve will do everything we can to achieve our maximum-employment and price-stability goals.”
The Supply Chain Part of Inflation Can be Declared Dead, Now What?
New data shows the supply chain is no longer putting meaningful pressure on inflation — will rising prices finally sail off and stay there?
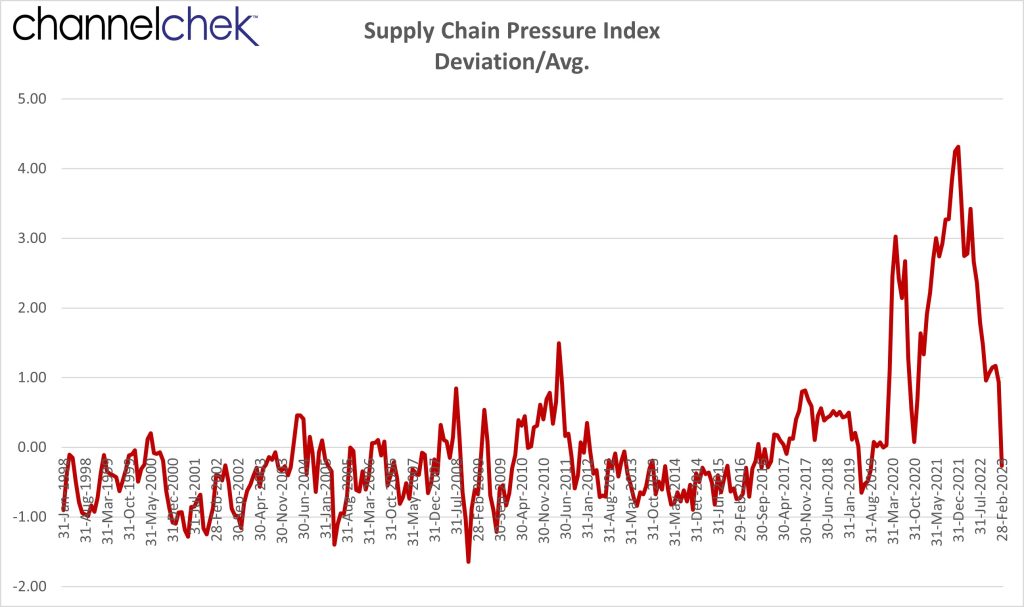
Historically, the Global Supply Chain Pressure Index (GSCPI) is now on the low side. In fact, for the monthly period ending February 28, it’s below its 25-year average. What’s more, is this is the first time the GSCPI has released a below-average reading of supply chain pressure since August of 2019.
This is significant as the supply-chain issues related to the pandemic, would seem to be transitory and are now no longer the issue. From March 2020 until this more recent report, consumers with easier money available, including stimulus checks, drove demand higher for goods. The suddenness of the onslaught of demand for goods caught the modern world’s “just-in-time” inventory management systems off guard. To make that situation much worse, lockdown policies slowed global production, and shipping and transport became entrenched in gridlock due to undermanned loading docks all under some level of new pandemic processes designed for health and safety.
Inflation climbed as the price of shipping was bid up substantially, and shortages of products on shelves caused retailers to lessen demand by hiking prices. Some products, particularly new and used cars, experienced sharp price increases as supply chain-related shortages on automotive components such as computer chips and other parts became difficult to obtain.
Will Inflation Finally Recede?
An 18-month-long period of rampant inflation in goods, including vehicles, electronics, food, and sporting goods, (including bicycles for both indoor and outdoor use became unavailable) began to decompress starting in early 2022. The supply chains had slowly worked through the main causes.
Around this same period in 2022, inflation pressures began to build in services. As price hikes for goods lessened or backtracked, the cost for services, including wages, shot up. This is still fueling inflation today.
Often, the fear or expectation of rising prices drives inflation and vice versa. This may be the reason Fed Chairman Powell used the description “transitory” long past the period that it was obvious that inflation was likely persistent. If the Chair of the US Central Bank had suggested back then that we had a long-term problem, the worst of it may have arrived faster and been worse. Conversely, now that higher-than-target inflation is here, it makes sense for Powell to speak more hawkishly, this helps alter expectations of ongoing high rates of inflation.
With inflation primarily coming from services, the medicine for reducing the demand for human services is lessen demand, or even more difficult, increase the labor force. This is a bitter pill for the economy and creates an issue with the Federal Reserve which has two mandates, one to keep inflation modest and the other to maximize employment.
Take Away
The GSCPI is an indicator that the goods-based part of the economy has normalized. Inflation is still raging in services, which are barely tied to services. The hope is that the Fed can reduce the demand for higher and higher wages or perhaps bring more capable workers into the workforce. Another part of this plan may have nothing to do with tightening credit conditions. Talking publicly about being resolved to squash inflation also has an impact on expectations which will reduce the prices charged for service.
The initial battle, the one that kicked off the price hikes (supply chain), has ended, now we have to see how the rest of the Fed’s fight against inflation, both in policy and psychologically, plays out.
Powell’s Testimony, then Beige Book Ought to Give More Information
While this will be a quiet week for economic data, and earnings season is now past its peak, the probabilities are high that it will be a week of dramatic volatility. The reason is that Federal Reserve Chairman Jerome Powell will spend two days answering questions from elected officials that are members of Congress. There are typically a lot of pointed questions from members of the House and Senate as well as grandstanding politicians that want their constituents to see them fighting. In 2023’s case, the Fed intentionally weakens the US economy. Links to watch the live broadcasts of both the Senate and the House Semiannual Monetary Policy Report to Congress are provided below.
Monday 3/6
10:00 AM ET, Factory orders are expected to have fallen 1.8 percent in January versus December’s 1.8 percent rise. Evidence of this turnaround can be seen in Durable Goods Orders for January, which had already been released and is one of two major components of this report. Durable Goods fell 4.5 percent in the month.
Tuesday 3/7
10:00 AM ET, Day one of Fed Chair Jerome Poll’s Semiannual Monetary Policy Report to Congress will be with the US Senate Committee on Banking, Housing, and Urban Affairs. A link to stream the intense exchange that usually occurs can be found here.
3:00 PM ET, Consumer Credit is expected to increase $26.4 billion in January versus a smaller-than-expected increase of $11.6 billion in December. This report has a long lag from the measuring period, this makes it paid attention to less than other reports. However it is of increasing importance now that investors are wondering how long consumers can continue at a high rate despite tighter money.
Wednesday 3/8
8:30 PM ET, International Trade is expected to show a deficit of $69.0 billion during January for total goods and services trade. This would compare with a $67.4 billion deficit in December. A stronger dollar makes US goods less attractive overseas, and goods and services billed in a currency that is weakening in relationship to the US dollar become more attractive domestically when paid for in stronger dollars.
10:00 AM ET, the Jolts or job openings report is expected to decline. It has been strong and rose to 11.0 million in December, however January’s expectation move down to 10.6 million.
2:00 PM ET, The Beige Book is a discussion of what is going on economically in each of the Federal Reserve districts. It is made available roughly two weeks before the FOMC meetings. This report on economic conditions is used for discussion at FOMC meetings which is back to beingthe single most influential events during the year impacting markets.
10:00 AM ET, Day two of Fed Chair Jerome Powell’s Semiannual Monetary Policy Report to Congress will be with the U.S. House Financial Services Committee. A link to stream the intense exchange that usually occurs can be found here.
Thursday 3/9
8:30 AM ET, Jobless claims are a weekly release, but they always have the ability to impact investor thinking. For the week that ended March 4 week they are expected to come in at 196,000 versus 190,000 during the prior week.
4:30 PM ET, The Fed’s balance sheet is a weekly report presenting a balance sheet for all Reserve Bank districts that lists factors supplying reserves into the banking system and factors absorbing reserves from the system. The report is officially named Factors Affecting Reserve Balances. The Fed has been reducing its balance sheet by letting a specific amount of securities owned mature without being reinvested. Investong by the Fed adds money to the marketplace which is stimulative.
Friday 3/10
8:30 AM ET, the consensus for the Employment Sitation is a 215,000 rise for nonfarm payroll growth in February. This compares to 517,000 in January which. January was the ninth straight month and eleventh of the last twelve that payroll growth exceeded consensus of economists.
What Else
As far as what is scheduled, nothing can impact the market greater than the Federal Reserve Chair testifying before Congress both Tuesday and Wednesday. It would be surprising if they all like what he has to say. Stocks continue to be very sensitive; the US 10-year Treasury Note has been a key to the stock markets tone recently.
Stock Market Performance – Looking Back at February, Forward to March
The months seem to go by quickly. And as satisfying as January was for most stock market investors, February left people with 2022 flashbacks. High inflation, or what more inflation could mean for monetary policy, again was the culprit weighing on investors’ minds and account values. One consideration is that investors are now entering March and are faced with very negative sentiment. This could actually be bullish and may lead the major indexes on a wave upward.
The next scheduled FOMC meeting is March 21-22. By then, we will have seen another round of inflation numbers as CPI (March 14) and the PCE index (March 15) are both released during the same week, otherwise known as the ides of March. While the Fed is wrestling with stubborn inflation, it is keeping an eye on the strong labor markets. Although low unemployment is desirable, tight labor markets are helping to drive prices up. The Fed is looking to find a better balance.
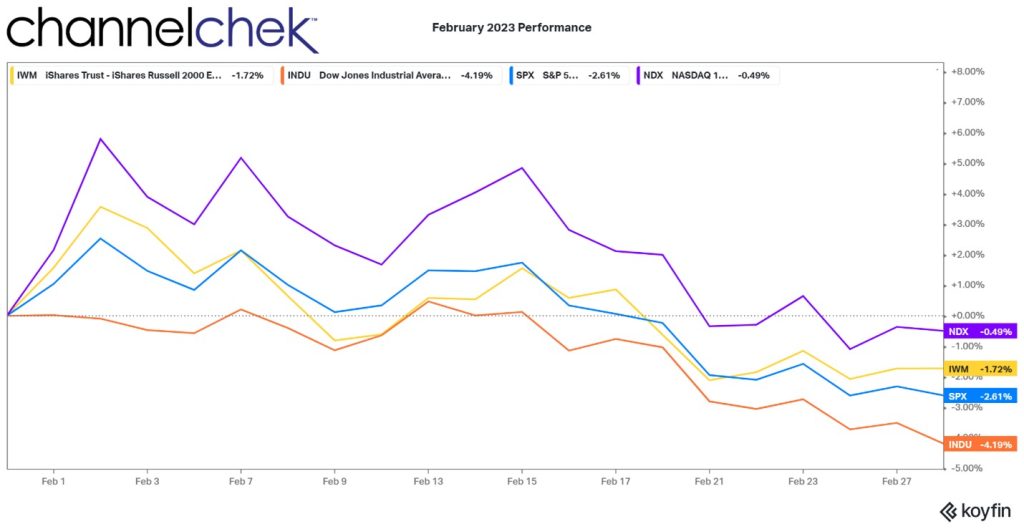
The three broad stock market indices (S&P 500, Nasdaq 100, and Russell 2000) are positive on the year, the Dow went negative on the 21st of February. The Nasdaq 100 and Russell 2000 have gained 9.70% and 8.22% respectively year-to-date, while the S&P is a positive 3.21% and the Dow Industrials is a negative 1.45%.
Each of the four closely watched indexes shown above began falling off as soon as January ended. It has only totalled a partial reversal, but the overall negative sentiment rose through February.
Viewing the indices from a year-to-date perspective, all but the Dow are well above their historical average pace.
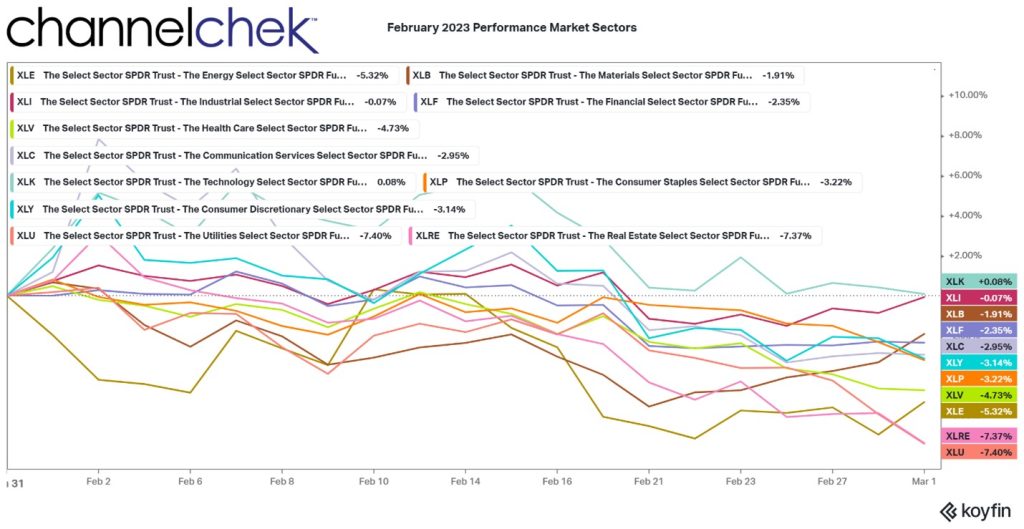
Of the 11 S&P market sectors (SPDRs) only one was in positive territory for the month. This is Technology (XLK) and was barely positive at .08%. That is followed by Industrials (XLI), which fell a mere .07%. This demonstrates the flaw in using the Dow 30 Industrials (declined 4.07%) which is not as broad of an index or a great gauge of stock market direction. The third top performer was Financials (XLF) which returned a negative 2.26%. Financial firms tend to benefit from higher yields, especially if the yield curev steepens, the curve currently has negative spreads out longer.
Of the worst performers are Utilities (XLU), down 7.45%. Many investors in utilities these stocks for dividend yield; as US government bonds pay more interest, they make utility stocks less attractive. Real Estate is also affected by higher rates as underlying assets (properties) decline and the attractiveness of its dividends diminish with high rates available elsewhere. The Energy sector (XLE) was the third worst. Energy is taking its lead from what is happening between Russia and the rest of Europe.
Looking Forward
Income and consumer spending have held strong in early 2023. This would seem to put off any chance of a recession beginning this quarter or next. Earnings reported for the fourth quarter have been mixed. Public companies are dealing with their own increased costs of doing business.
The Fed raising rates one, two, or three more times in 2023 is fully expected. What became less certain is whether they will continue to rely on 25bp increments or if another 50bp is on tap in March or beyond. The Fed began raising rates last March, a large impact has yet to be felt, and it is not expected to take a wait-and-see approach soon.
February’s small decline after a large January run-up is not unusual activity. In fact the short month has typically been one of the worst of the year for the U.S. stock market. Historically, the S&P 500 has performed better in March and April. How much better? Since 1928, the S&P 500 has averaged a 0.5% gain in March and a 1.4% gain in April.
Take-Away
The market was given a lot to think about in February. Inflation stopped trending down, earnings were not exciting, and participants had amassed better gains than they had in previous months. It was time for some to take some chips off the table and look for an opportunity to get back in.
March, which historically has been positive, will allow investors to see if the tick-up in inflation is a trend or an aberration and whether negative sentiment, with money on the sidelines, makes the current market more of a buy than a sell.