Newport Beach, CA, Nov. 05, 2026 (GLOBE NEWSWIRE) — Bimergen Energy Corporation (NYSE American: BESS), a developer, owner, and operator of utility-scale and distributed battery energy storage systems, is pleased to announce that October 29, 2026, Noble Capital Markets has initiated company-sponsored equity research coverage on the Company with an Outperform rating and a price target of $6.00 per share.
The research report, authored by Noble Capital Markets Senior Research Analyst Mark Reichman and Noble Capital Markets Research Analyst Richard Magnusen, is available on Channelchek, along with the latest news, market data, and additional information on Bimergen Energy.
The Noble research report can also be found on the Bimergen website along with 3 other research reports with price targets ranging from $9.50 to $10. Bimergen Analyst Coverage
Management encourages investors to review the report and ongoing coverage and updates.
About Bimergen Energy Corporation
Bimergen Energy Corporation (NYSE American: BESS) is a U.S.-based energy infrastructure developer, asset owner, and operator focused on utility-scale and distributed battery energy storage systems (BESS). The Company develops projects designed to enhance grid reliability, support renewable energy integration, and provide flexible energy solutions across key U.S. power markets. Bimergen works with technology providers and capital partners to advance projects through development, construction, and long-term operation. For more information about Bimergen Energy, please visit www.bimergen.com.
About Noble Capital Markets
Established in 1984, Noble Capital Markets is an SEC / FINRA registered full-service investment bank and advisory firm with an award-winning research team and proprietary investor distribution platform. We deliver middle market expertise to entrepreneurs, corporations, financial sponsors, and investors. Over the past 40 years, Noble has raised billions of dollars for companies and published more than 45,000 equity research reports.
About Channelchek
Noble launched www.channelchek.com in 2018 – an investor community dedicated exclusively to public emerging growth and their industries. Channelchek is the first service to offer institutional-quality research to the public, for FREE at every level without a subscription. More than 7,000 public emerging growth companies are listed on the site, and content including equity research, webcasts, and industry articles.
Media Contact: Dave Gentry RedChip Companies Inc. 1-407-644-4256 | 1-800-REDCHIP (733-2447) [email protected]
Strong Financial Performance Propelled by Facility Sales And Occupancy Gains $500 Million Accelerated Share Repurchase Agreement amplifies Per Share Growth Board of Directors Expands Share Repurchase Authorization By An Additional $500 Million
BRENTWOOD, Tenn., Nov. 04, 2026 (GLOBE NEWSWIRE) — CoreCivic, Inc. (NYSE: CXW) (CoreCivic or the Company) announced today its third quarter 2026 financial results.
Financial Highlights – Third Quarter 2026
For the Three Months Ended September 30, 2026
% Increase from Prior Year Quarter
• Total revenue
$744.1 million
28.2%
• Gain on sale of real estate assets, net
$1,770.7 million
NM
• Net Income
$1,344.1 million
NM
• Diluted EPS
$14.49
NM
• Adjusted Diluted EPS
$0.49
104.2%
• Normalized FFO per diluted share
$0.75
56.3%
• Adjusted EBITDA
$117.8 million
32.6%
NM – Not Meaningful
Sold four detention facilities containing 7,187 beds for gross proceeds of $2.2 billion
Repaid over $700 million of debt, resulting in a reduction in leverage (net debt to Adjusted EBITDA) to (0.1)x from 2.5x as of September 30, 2026 and 2025, respectively, using the trailing twelve months
Entered into $500 million Accelerated Share Repurchase Agreement (ASR)
Continued activating four previously idle facilities and entered into a new management contract to activate the previously idled 1,600-bed Appleton Detention Facility
Occupancy increases to 84.0% in the third quarter of 2026 from 76.7% in the prior year quarter
Lucibeth Mayberry, CoreCivic’s President and Chief Executive Officer, commented, “We delivered strong financial results in a very active quarter, driven by increased demand for our services from U.S. Immigration and Customs Enforcement (ICE), including higher utilization of recently activated facilities, as well as the contribution from our acquisition of Clinical Solutions Pharmacy earlier this year. Our capital allocation strategy also contributed to improved results through lower interest expense and a reduction in weighted average shares outstanding, which benefited our per share earnings and valuation metrics.”
Mayberry continued, “The sale of four detention facilities to the federal government during the third quarter generated total gross proceeds of $2.2 billion and a $1.8 billion aggregate gain on sale of real estate assets. We used a portion of the net proceeds after income taxes and transaction costs, amounting to $1.6 billion, to repay over $700.0 million of debt and to make a payment of $500.0 million under an ASR. Our balance sheet has improved meaningfully and provides us significant flexibility with both our capital allocation strategy and growth plans. The board’s decision to further expand the share repurchase authorization by $500.0 million underscores our commitment to that strategy and reflects confidence in our ability to generate long-term shareholder value.”
Mayberry concluded, “This quarter also marked a significant leadership transition following Patrick Swindle’s decision to step down as President and Chief Executive Officer due to health reasons. This was a difficult development for the CoreCivic team. We are thankful for Patrick’s leadership and dedication during his 19 years of service with CoreCivic and that he will continue to be a trusted advisor to me. As I assume this role, I remain committed to executing our strategy, which remains unchanged, delivering high-quality services for our government partners and generating long-term shareholder value.”
Third Quarter 2026 Financial Results Compared With Third Quarter 2025
Net income in the third quarter of 2026 was $1,344.1 million, or $14.49 per diluted share, compared with net income in the third quarter of 2025 of $26.3 million, or $0.24 per diluted share (Diluted EPS). The third quarter of 2026 included a number of special items, including gains on the sale of real estate assets and contingent consideration associated with the CSP acquisition, partially offset by expenses associated with mergers and acquisitions, expenses associated with debt repayments, and settlement compensation associated with the executive transition. Excluding these special items, Adjusted Net Income was $45.7 million, or $0.49 per diluted share (Adjusted Diluted EPS), compared with Adjusted Net Income in the third quarter of 2025 of $26.2 million, or $0.24 per diluted share. Special items are presented in detail in the calculation of Adjusted Net Income and Adjusted Diluted EPS in the Supplemental Financial Information following the financial statements presented herein.
The increases in Diluted EPS and Adjusted Diluted EPS compared with the prior year quarter resulted from continued occupancy increases at previously idle facilities resulting from new contract awards in the CoreCivic Residential segment at our 600-bed West Tennessee Detention Facility (West Tennessee Facility), the 2,560-bed California City Detention Facility (California City Facility), our 2,160-bed Diamondback Correctional Facility (Diamondback Facility), and the 1,033-bed Midwest Regional Reception Center (Midwest Facility). These four facilities are expected to generate total annual revenue of approximately $320.0 million once fully activated. Increases in Diluted EPS and Adjusted Diluted EPS also resulted from higher federal and state populations across the remaining Residential portfolio, and the acquisition on April 1, 2026 of Clinical Solutions Pharmacy (CSP) in the CoreCivic Services segment. Occupancy levels in our Residential segment increased to 84.0% in the third quarter of 2026 from 76.7% in the third quarter of 2025. Finally, Diluted EPS and Adjusted Diluted EPS benefited from lower interest expense, net, reflecting debt repayments and higher interest income on larger cash balances, as well as a 13.8% reduction in weighted average diluted shares outstanding primarily resulting from our share repurchase program, including most notably the $500.0 million ASR Agreement executed on August 10, 2026.
The solutions we provide for our federal customers, including primarily ICE and the U.S. Marshals Service (USMS), continue to be a significant component of our business. The federal customers in our Residential segment generated 53% and 55% of our total revenue for the three months ended September 30, 2026 and 2025, respectively, increasing $71.3 million, or 22.2%, during the three months ended September 30, 2026 compared with the same period in 2025. The increase in federal revenue was primarily a result of increased occupancy at numerous facilities, particularly those where we have contracts with ICE, and per diem increases.
Operating margin in the CoreCivic Residential segment was relatively flat at 22.3% versus 22.5% in the prior year quarter despite an increase in occupancy as the increase in occupancy was substantially attributable to the four facilities under activation. Because these four facilities continue to be in various stages of activation, they are not yet contributing at a fully activated margin percentage. During the three months ended September 30, 2026, these four facilities generated net operating income, or revenue less operating expenses, of $19.9 million.
Net operating income in the CoreCivic Services segment increased $8.5 million, to $9.6 million in the third quarter of 2026 from $1.1 million in the prior year quarter. The Services segment includes the operating results of CSP, a newly acquired subsidiary that provides mail order pharmacy services to over 600 correctional facilities, including correctional facilities owned or operated by CoreCivic, across 32 states. CoreCivic Services also includes the operating results of TransCor America, LLC, a subsidiary that provides transportation services to governmental agencies and CoreCivic, as well as the operating results of Recovery Monitoring Solutions, a subsidiary that provides electronic monitoring and case management services. The increase in net operating income in this segment was primarily attributable to the acquisition of CSP on April 1, 2026.
Earnings before interest, taxes, depreciation and amortization (EBITDA) was $1,899.9 million in the third quarter of 2026, compared with $89.0 million in the third quarter of 2025. The increase in EBITDA from the prior year quarter was attributable to the special items, including most notably the gain on sale of real estate assets. Adjusted EBITDA, which excludes special items, was $117.8 million in the third quarter of 2026, compared with $88.8 million in the third quarter of 2025, an increase of 32.6%. The increase in EBITDA and Adjusted EBITDA was primarily driven by the activation of four previously idle facilities and the acquisition of CSP, partially offset by an increase in general and administrative expenses resulting from higher incentive compensation, transitional expenses related to executive leadership changes, and expenditures in technology.
Funds From Operations (FFO), which excludes the after-tax impact of the gain on sale of real estate assets, for the third quarter of 2026 was $78.3 million, or $0.84 per diluted share, compared with $51.5 million, or $0.48 per diluted share, in the third quarter of 2025. Normalized FFO, which excludes the remaining special items, was $69.9 million, or $0.75 per diluted share, in the third quarter of 2026, compared with $52.1 million, or $0.48 per diluted share, in the third quarter of 2025. Normalized FFO per share was positively impacted by the same factors that affected Adjusted EBITDA, as well as the reduction in interest expense and a 13.8% reduction in weighted average diluted shares outstanding compared with the prior year quarter primarily due to the ASR Agreement.
Adjusted Net Income, EBITDA, Adjusted EBITDA, FFO, and Normalized FFO, and, where appropriate, their corresponding per share amounts, are financial measures calculated and presented on the basis of methodologies other than in accordance with generally accepted accounting principles (GAAP). Please refer to the Supplemental Financial Information and the note following the financial statements herein for further discussion and reconciliations of these measures to net income, the most directly comparable GAAP financial measure.
Facility Sales & Continuing Management
As previously announced, we completed the sales on July 2, 2026, of our California City Facility and our Otay Mesa Detention Center (Otay Mesa Facility), both located in California. On August 4, 2026, after announcing a new management contract with ICE to activate the Appleton Detention Facility, formerly known as the Prairie Correctional Facility (Appleton Facility), as further described hereinafter, we completed the sales of our Appleton Facility and our Midwest Facility. The gross sales price for these four facility sales totaled $2.2 billion, resulting in an aggregate gain on sales of approximately $1.8 billion. After federal and state income taxes of approximately $0.5 billion and transaction costs, our net proceeds from the facility sales were approximately $1.6 billion. All of these facilities were sold to the United States of America and its assigns, by and through the Department of Homeland Security (DHS).
We currently expect to continue to manage these four facilities under existing management contracts with ICE, although we expect the terms of the management contracts to be modified to reflect the change in ownership. However, since all of our contracts with ICE provide it with the ability to terminate our contracts for non-appropriation of funds or for convenience, we can provide no assurance that we will continue to manage these facilities in the future, or that the terms of the management agreements will remain the same. The management contract for the California City Facility expires in August 2027 and the management contract for the Otay Mesa Facility expires in December 2029 and contains a five-year extension option. The management contract for the Midwest Facility expires in August 2027, and the management contract for the Appleton Facility expires in August 2031.
In addition to the facility sales completed to-date, we have been in discussions with ICE about the potential acquisition of additional detention facilities from us. These discussions are in preliminary stages, and we can provide no assurance that any additional sales will occur.
Capital Strategy
Accelerated Share Repurchase Agreement. On August 4, 2026, our board of directors (BOD) authorized an increase to our existing share repurchase program pursuant to which we may purchase up to an additional $500.0 million of CoreCivic’s outstanding common stock. On August 10, 2026, we entered into the ASR Agreement with a financial institution (Dealer) to repurchase $500.0 million of the Company’s common stock.
Following entry into the ASR Agreement and using a portion of the net proceeds from the facility sales, we made a payment of $500.0 million to the Dealer and received 12.4 million shares of common stock from the Dealer, representing 80% of the $500.0 million divided by the August 7, 2026 closing trading price of the common stock of $32.27 per share. The final number of shares we will repurchase and the average price per share of such repurchases will be determined on the completion of the transactions contemplated by the ASR Agreement and will be based on the average of the daily volume-weighted average price of the common stock during the term of the ASR Agreement, less a discount and subject to adjustments pursuant to the ASR Agreement. At settlement, the Dealer may be required to deliver additional shares of common stock to the Company, or under certain circumstances, the Company may be required to deliver shares of common stock or to make a cash payment, at its election, to the Dealer. The final settlement of the transactions is scheduled to occur prior to the end of the second quarter of 2027.
Increase in Share Repurchase Authorization. On November 3, 2026, the BOD authorized an increase to its existing share repurchase program pursuant to which CoreCivic may purchase up to an additional $500.0 million of CoreCivic’s outstanding common stock. As a result of the increase, the aggregate authorization under CoreCivic’s repurchase program increased from $1.2 billion of CoreCivic’s outstanding common stock to $1.7 billion of CoreCivic’s outstanding common stock. Including the additional authorization, we have $755.8 million of repurchase authorization available under the share repurchase program, before any additional repurchase settlements occur under the ASR Agreement. Additional repurchases of common stock will be made in accordance with applicable securities laws and may be made at management’s discretion within parameters set by the BOD from time to time in the open market, through privately negotiated transactions, accelerated share repurchases or otherwise, subject to restricted payment limitations in our debt agreements. The share repurchase program currently has no time limit and, other than the ASR Agreement, does not obligate us to purchase any particular amount of our common stock. The authorization for the share repurchase program may be terminated, suspended, increased or decreased by the BOD in its discretion at any time.
Debt Repayments. As previously announced, during the third quarter of 2026, a portion of the net proceeds from the facility sales was used to pay down the then outstanding balances under our Bank Credit Facility, including all of the $270.0 million outstanding on the Revolving Credit Facility, which has a borrowing capacity of $575.0 million and can be redrawn, the $100.0 million outstanding balance of the Incremental Term Loan, and the $107.8 million outstanding balance on the Initial Term Loan. Additionally, we redeemed in full the 4.75% senior unsecured notes issued in October 2017 with an original principal amount of $250.0 million (2027 Notes) that remained outstanding, which amounted to $238.5 million, on August 12, 2026 (Redemption Date). The 2027 Notes were otherwise scheduled to mature on October 15, 2027. The 2027 Notes were redeemed at a redemption price, including the applicable make-whole premium, equal to $1,002.26 per $1,000.00 of the principal amount of the then outstanding 2027 Notes, or approximately $239.0 million, plus accrued and unpaid interest to, but not including, the Redemption Date. We reported charges totaling $4.0 million associated with these debt repayments. Following these debt repayments, the Company’s total debt outstanding as of September 30, 2026 was $629.6 million.
Other Business Developments
CEO Transition. On September 24, 2026, the BOD appointed Lucibeth N. Mayberry, who most recently served as the Company’s Executive Vice President and Chief Strategy Officer, as President and Chief Executive Officer of the Company. Patrick D. Swindle stepped down as President and Chief Executive Officer due to health reasons. Mr. Swindle had served as President and Chief Executive Officer since January 1, 2026, following his appointment as President and Chief Operating Officer on January 1, 2025. In addition, Mr. Swindle resigned from CoreCivic’s Board, and Ms. Mayberry was appointed to fill the vacancy.
Activation of the Appleton Facility. On August 3, 2026, we were awarded a new management contract with ICE to utilize the Appleton Facility. The new contract commenced on August 11, 2026, for a term of five years. The agreement provides for a fixed monthly payment plus an incremental per diem payment based on detainee populations. Taking into account start-up activities and the phased commencement of intake operations, we currently expect an immaterial impact to earnings for the remainder of 2026. Once the facility is fully activated, we expect this facility to generate total annual revenue of approximately $75.0 million. We expect to begin receiving detainees in the fourth quarter of 2026, with the activation estimated to be complete in the second quarter of 2027.
2026 Financial Guidance
Based on current business conditions, we are providing the following updated financial guidance for the full year 2026:
Updated Guidance Full Year 2026
PriorGuidance Full Year 2026
• Net income
$1.461 billion to $1.467 billion
$1.492 billion to $1.511 billion
• Adjusted Net Income
$165.0 million to $171.0 million
$157.0 million to $165.0 million
• Diluted EPS
$15.42 to $15.48
$15.62 to $15.82
• Adjusted Diluted EPS
$1.74 to $1.80
$1.64 to $1.73
• FFO per diluted share
$2.85 to $2.92
$2.66 to $2.75
• Normalized FFO per diluted share
$2.78 to $2.85
$2.68 to $2.77
• EBITDA
$2.221 billion to $2.224 billion
$2.216 billion to $2.236 billion
• Adjusted EBITDA
$442.5 million to $445.5 million
$434.5 million to $439.5 million
We continue to manage the four facilities we sold to DHS under the existing management contracts with ICE. Although we and ICE have not yet modified the management contracts for these facilities to reflect the change in ownership, the range of our guidance incorporates our best estimate of the financial impact of the change in ownership.
In addition to the facility sales completed to-date, we have been in discussions with ICE about the potential acquisition of additional detention facilities from us. These discussions are in preliminary stages, and we can provide no assurance that any additional facility sales will occur. Our updated guidance does not include the impact of any potential additional facility sales.
During 2026, we expect to invest $30.0 million to $35.0 million in maintenance capital expenditures on real estate assets, $35.0 million to $40.0 million for maintenance capital expenditures on other assets and information technology, and $12.0 million for other capital investments. We also expect to invest $35.0 million to $40.0 million for capital expenditures associated with previously idled facilities we are activating and for additional potential facility activations, in order to prepare these facilities to quickly accept residential populations if opportunities arise.
Supplemental Financial Information and Investor Presentations
We have made available on our website supplemental financial information and other data for the third quarter of 2026. Interested parties may access this information through our website at http://ir.corecivic.com/ under “Financial Information” of the Investors section. We do not undertake any obligation and disclaim any duties to update any of the information disclosed in this report.
Management may meet with investors from time to time during the fourth quarter of 2026. Written materials used in the investor presentations will also be available on our website beginning on or about November 17, 2026. Interested parties may access this information through our website at http://ir.corecivic.com/ under “Events & Presentations” of the Investors section.
Conference Call, Webcast and Replay Information
We will host a webcast conference call at 10:00 a.m. central time (11:00 a.m. eastern time) on Thursday, November 5, 2026, which will be accessible through the Company’s website at www.corecivic.com under the “Events & Presentations” section of the “Investors” page. To participate via telephone and join the call live, please register in advance here https://edge.media-server.com/mmc/p/si7rqqax/lan/en/. Upon registration, telephone participants will receive a confirmation email detailing how to join the conference call, including the dial-in number and a unique passcode.
About CoreCivic
CoreCivic is a diversified, government-solutions company with the scale and experience needed to solve tough government challenges in flexible, cost-effective ways. We provide a broad range of solutions to government partners that help build safer, healthier, and more productive communities one person at a time through residential corrections, detention, and reentry management, complementary service offerings to the corrections industry that include pharmaceutical, transportation, and alternatives to incarceration, and government real estate solutions. We are the nation’s largest owner of partnership correctional, detention and residential reentry facilities, and one of the largest operators of such facilities in the United States. We have been a flexible and dependable partner for government for more than 40 years. Our employees are driven by a deep sense of service, high standards of professionalism and a responsibility to help government better the public good. Learn more at www.corecivic.com.
Forward-Looking Statements
This press release contains statements as to our beliefs and expectations of the outcome of future events that are “forward-looking” statements as defined within the meaning of the Private Securities Litigation Reform Act of 1995, as amended. All statements other than statements of current or historical fact contained herein, including statements regarding our future financial position, business strategy, budgets, projected costs and plans, and objectives of management for future operations, are forward-looking statements. The words “anticipate,” “believe,” “continue,” “could,” “estimate,” “expect,” “intend,” “may,” “plan,” “projects,” “will,” and similar expressions, as they relate to us, are intended to identify forward-looking statements. These forward-looking statements are subject to risks and uncertainties that could cause actual results to differ materially from the statements made. These include, but are not limited to, the risks and uncertainties associated with: (i) changes in government policy, legislation and regulations that affect utilization of the private sector for corrections, detention, and residential reentry services, in general, or our business, in particular, including, but not limited to, the continued utilization of our correctional and detention facilities by the federal government as a consequence of presidential executive orders, changes in how the federal government, including ICE, elects to use our detention capacity or otherwise procures alternative detention capacity, and the impact of any changes to immigration reform and sentencing laws (we do not, under longstanding policy, lobby for or against policies or legislation that would determine the basis for, or duration of, an individual’s incarceration or detention); (ii) our ability to obtain and maintain correctional, detention, and residential reentry facility management contracts because of reasons including, but not limited to, sufficient governmental appropriations, contract compliance, negative publicity and effects of inmate disturbances; (iii) changes in the privatization of the corrections and detention industry, the acceptance of our services, the timing of the opening of new facilities and the commencement of new management contracts (including the extent and pace at which new contracts are utilized), as well as our ability to utilize available beds; (iv) our ability to successfully activate idle facilities in a timely manner in order to meet the growth in demand for our facilities and services from the federal government that has occurred as a result of changes in policies and actions of the current presidential administration, and to realize projected returns resulting therefrom; (v) general economic and market conditions, including, but not limited to, the impact governmental budgets can have on our contract renewals and renegotiations, per diem rates, and occupancy; (vi) fluctuations in our operating results because of, among other things, changes in occupancy levels; competition; contract renegotiations or terminations including as a result of a change in facility ownership; inflation and other increases in costs of operations, including a rise in labor costs; fluctuations in interest rates and risks of operations; (vii) government budget uncertainty, the impact of debt ceilings and government shutdowns, including partial shutdowns, and changing budget priorities; (viii) our ability to successfully identify and consummate future development and acquisition opportunities, integrate their operations, and realize projected returns resulting therefrom; (ix) the availability of debt and equity financing on terms that are favorable to us, or at all; and (x) our ability to successfully consummate the sales of additional company-owned assets, including the potential sale of additional facilities to ICE, on a timely basis and on commercially favorable terms. Other factors that could cause operating and financial results to differ are described in the filings we make from time to time with the Securities and Exchange Commission.
We take no responsibility for updating the information contained in this press release following the date hereof to reflect events or circumstances occurring after the date hereof or the occurrence of unanticipated events or for any changes or modifications made to this press release or the information contained herein by any third-parties, including, but not limited to, any wire or internet services, except as may be required by law.
Transactions Positive for Second Consecutive Quarter and Improved Sequentially for Three Consecutive Quarters
Year-to-Date Cash Flow from Operations Increased 143% to $41.8 million
Restaurant Operating Profit** for The Quarter expanded 190 basis points
Company Continues to Prioritize Capital-Efficient Growth
DENVER–(BUSINESS WIRE)– The ONE Group Hospitality, Inc. (“The ONE Group” or the “Company”) (Nasdaq: STKS) today reported its financial results for the third quarter ended September 27, 2026.
Highlights for the third quarter 2026 compared to the same quarter in 2025 are as follows:
Total GAAP revenues of $177.0 million from $180.2 million, a decrease of 1.8%, with $4.5 million, or 2.5%, the result of the permanent and temporary closure of restaurants as part of the Grill Concepts portfolio optimization strategy, partially offset by revenue from new restaurants opened since the third quarter of 2025
Consolidated comparable sales* and comparable transactions slightly decreased 0.4% and increased 1.8%, respectively
Benihana brand comparable sales* and comparable transactions increased 0.7% and increased 2.7%, respectively
Net cash provided by operating activities in the quarter increased 50% to $8.8 million from $5.9 million; year-to-date net cash provided by operating activities increased $24.6 million to $41.8 million from $17.2 million
Restaurant operating profit** increased by 190 basis points to 13.2% of owned restaurant net revenue from 11.3%
GAAP Operating Income year-to-date increased $11.1 million to $14.6 million from $3.5 million
Adjusted EBITDA*** attributable to The ONE Group Hospitality, Inc. increased 5% to $11.1 million from $10.6 million, and year-to-date increased 3% to $60.8 million from $59.1 million
“Our third quarter results demonstrate the meaningful progress we are making in strengthening the financial performance of The ONE Group. We delivered positive transaction growth, while significantly improving operating income and expanding restaurant-level margins. These results reflect the effectiveness of our operational initiatives, the strength of our differentiated restaurant brands and the disciplined execution of our strategic priorities,” said Emanuel “Manny” Hilario, President and Chief Executive Officer of The ONE Group. “Importantly, we are translating these operational improvements into stronger cash flow. Through enhanced restaurant-level profitability, disciplined capital allocation and continued portfolio optimization, we are building a more efficient and financially resilient organization.”
“The distinctiveness of our Vibe Dining brands, supported by our value messaging, is resonating with guests. Transactions have been positive for two consecutive quarters and have improved sequentially for three, demonstrating that guests continue to seek out differentiated dining experiences despite a cautious consumer environment,” Hilario continued, “Benihana, our largest brand, led the way in the quarter as we continue to execute our initiatives. Our strategy with the Grill Concepts has shown success in stabilizing transactions as comparable transactions were positive 1.7% for the quarter and positive 1.4% for year-to-date. The next step is to convert those traffic gains into sales.”
“Our beef strategy, supply chain initiatives and menu optimization drove a 190-basis point improvement in restaurant operating profit margin, enabling us to navigate a higher inflationary environment,” Hilario commented. “This operating discipline is also reflected in our cash generation, with cash flow from operations through the first three quarters more than doubled to $41.8 million after paying $29.4 million in interest.”
Hilario also provided an update on the Company’s capital efficient growth by remarking that, “our growth is now centered on franchise and license development and low cost conversions of select Grill Portfolio venues. We are particularly delighted with our progress with the performance of our Benihana Express prototype which now paces at an annual volume of $1.8 million. The combination of its small footprint, high revenues per square foot, and strong unit economics makes it a highly attractive vehicle for licensing. With this brand, we are able to bring the highly craveable Benihana food anywhere to consumers seeking a premium fast casual opportunity on the go,” Hilario concluded. “Entering our seasonally strongest quarter, we believe our improving transaction trends and strong portfolio position us well, and that disciplined capital allocation, together with operational execution, is the foundation for long-term shareholder value and accelerating the development of a significant pipeline of high-quality licensees for Benihana Express locations.”
Grill Concepts Portfolio Optimization
The Company continues to execute its portfolio optimization strategy, focusing on maximizing profitability and improving returns on invested capital across its restaurant portfolio. As part of this initiative, select Kona Grill and RA locations are being converted into Benihana and STK restaurants, leveraging the strength and established consumer appeal of these brands, coupled with the strength of the existing real estate.
As restaurants approach lease or option term end, the Company will make the determination to either 1) exit, or 2) refresh, relocate, remodel, or convert those units based on its evaluation of the quality of the real estate and projected return on capital spent on those options with an anticipated outcome of a highly performing restaurant portfolio. Currently, the Company operates twenty Kona Grills and twelve RAs, inclusive of the temporarily closed restaurants.
Currently, the Company has four temporarily closed Kona Grills and three temporarily closed RAs all awaiting conversion to Benihanas.
Year to date, the Company has re-opened the Riverton, Utah location (previously a Kona Grill) as a Benihana and the Baltimore, Maryland location (previously a Kona Grill) as a remodeled small footprint Kona Grill and a new STK.
Exited one RA (Phoenix, Arizona) and two Kona Grills (Cincinnati, Ohio and Huntsville, Alabama) due to lease expirations
Conversion economics are an approximate cost of $1.0 to $1.5 million, net per conversion, with an expected short payback
Expected outcome is a fully profitable Grill portfolio with enhanced margins and additional high quality Benihana and STK locations.
Capital Efficiency Focus
The Company is advancing a disciplined development strategy that prioritizes attractive investment returns, franchising, licensing and lower-cost restaurant formats. The Company has focused on increasing its capital efficiency by:
Significantly reducing discretionary capital expenditures to increase free cash flow and strengthen the balance sheet
Disciplined maintenance capital spend on existing restaurants
Prioritizing asset-light and conversion-driven growth with emphasis on franchising and licensing opportunities
Targeting new company-owned openings averaging $1.5 million, net or less in build-out costs
Benihana Express Expansion
The Company has accelerated its development of the Benihana Express brand primarily because of its potential for asset light expansion.
“Your Benihana Fix, On The Go!” A fast casual version of Benihana with heavy takeout / delivery
Premium food offerings (filet, lobster, Wagyu)
800-1,000 square foot space, with an anticipated cost of $400 to $500 per square foot
Compelling unit economics with projected combined food and labor costs of 45% to 50%
Two Company prototypes open (Miami, Florida, and Denver, Colorado); Miami prototype currently pacing at $1.8 million annual volume
Two additional locations expected to open in 2026 in Islamorada, Florida (Licensed) and Topanga Mall in Canoga Park, California (Owned)
2026 Completed Restaurant Development
Restaurant
Location
Date
Owned Kona Grill (relocation)
San Antonio, Texas
January 2026
Converted franchised Benihana to owned
Monterey, California
February 2026
Converted franchised Benihana Express to owned
Miami, Florida
March 2026
Owned STK (new)
Phoenix, Arizona
July 2026
Owned STK (new)
New York (Chelsea), New York
July 2026
Owned Benihana (conversion of a Kona Grill)
Riverton, Utah
July 2026
Owned STK (new)
Baltimore, Maryland
September 2026
Owned Kona Grill (relocation to smaller footprint)
Baltimore, Maryland
September 2026
Owned Benihana Express (new)
Denver, Colorado
November 2026
Current Restaurant Pipeline
Owned Restaurants Under Construction / Development:
Owned Benihana restaurant in Tigard, Oregon (conversion of a temporarily closed Kona Grill restaurant)
Owned Benihana Express in Topanga Mall in Canoga Park, California
Owned STK restaurant in New York City (Union Square)
Owned Kona Grill restaurant in Highlands Ranch, Colorado
Asset-Light Development:
Franchised Benihana in the Florida Keys
Licensed Benihana Express in the Florida Keys
Liquidity
As of September 27, 2026, the Company held a total of $40.3 million in short term liquidity, comprised of $13.7 million in cash and short-term credit card receivables and $26.6 million available under its revolving credit facility. Under the current conditions, the Company’s credit facility does not have any financial covenants.
2026 Financial Targets
The Company is updating its full year 2026 financial targets, reflecting its emphasis on expanding free cash flow through reduced capital expenditures, benefits of portfolio optimization and operational improvements.
Financial Results and Other Select DataUS$s in millions
2026 GuidanceDecember 27, 2026
Total GAAP revenues
$800 to $810
Consolidated comparable sales
+1%
Managed, license and franchise fee revenues
$13-$14
Total owned operating expenses as a percentage of owned restaurant net revenue
Approx. 82%
Consolidated total G&A, excluding stock-based compensation
$50-$51
Consolidated Adjusted EBITDA(1)
$95 to $100
Consolidated restaurant pre-opening expenses
$7.5 to $8.5(~$3 non-cash rent)
Consolidated interest expense, net of interest income
$38 to $39
Consolidated effective income tax rate
10% to 20%
Consolidated total capital expenditures, net of allowances received from landlords
Approx. $30-$34
Consolidated number of new system-wide venues
6 – 8 new venues
(1)We have not reconciled guidance for Consolidated Adjusted EBITDA to the corresponding GAAP financial measure because we do not provide guidance for the various reconciling items. We are unable to provide guidance for these reconciling items because we cannot determine their probable significance, as certain items are outside of our control and cannot be reasonably predicted since these items could vary significantly from period to period. Accordingly, reconciliations to the corresponding GAAP financial measures are not available without unreasonable effort.
Stock Repurchase Program
The Company’s Board of Directors authorized a repurchase program of up to $15.0 million of outstanding common stock that was completed in December 2023. In March 2024, the Company’s Board of Directors authorized an additional $5.0 million of repurchases under this program. As of September 27, 2026, the Company had purchased 3.4 million shares for $19.3 million under the repurchase program. As a result of the Company’s ability to grow operating cash flow, combined with the disciplined capital expenditures, on November 3, 2026, the Company’s Board of Directors has authorized an additional $5.0 million to this program.
Conference Call and Webcast
Emanuel “Manny” Hilario, President and Chief Executive Officer, and Nicole Thaung, Chief Financial Officer, will host a conference call and webcast today at 4:30 PM Eastern Time.
The conference call can be accessed live over the phone by dialing 201-389-0908. A replay will be available after the call and can be accessed by dialing 412-317-6671; the passcode is 13762363. The replay will be available until Wednesday, November 18, 2026.
The webcast can be accessed from the Investor Relations tab of The ONE Group’s website at www.togrp.com under “News / Events.”
About The ONE Group
The ONE Group Hospitality, Inc. (Nasdaq: STKS) is an international restaurant company that develops and operates upscale and polished casual, high-energy restaurants and lounges and provides hospitality management services for hotels, casinos and other high-end venues both in the U.S. and internationally. The ONE Group is recognized as one of “America’s Greatest Companies” (Newsweek, 2025), and Benihana is honored as one of ”America’s Best Brands for Value” (Forbes, 2025). The ONE Group’s focus is to be the global leader in Vibe Dining, and its restaurant brands and operations are:
STK, a modern twist on the American steakhouse concept with restaurants in major metropolitan cities in the U.S., Europe and the Middle East, featuring premium steaks, seafood and specialty cocktails in an energetic upscale atmosphere.
Benihana, an interactive dining destination with highly skilled chefs preparing food right in front of guests and served in an energetic atmosphere alongside fresh sushi and innovative cocktails. The Company franchises Benihanas in the U.S., Caribbean, Central America, and South America.
Samurai, an interactive dining experience located in sunny Miami, FL, provides a distinctive dining experience where skilled personal chefs masterfully perform the ancient art of teppanyaki right before your eyes.
Kona Grill, a polished casual, bar-centric Grill concept with restaurants in the U.S., featuring American favorites, award-winning sushi, and specialty cocktails in an upscale casual atmosphere.
Salt Water Social is your gateway to the seven seas, featuring an array of signature and unique fresh seafood items, complemented by the highest quality beef dishes and elegant, delicious cocktails.
Benihana Express, a small footprint fast casual concept showcasing the best of Benihana but without teppanyaki tables or bar.
RA, a Japanese fusion cuisine concept that offers a fun-filled, bar-forward, upbeat, and vibrant dining atmosphere with restaurants in the U.S. anchored by creative sushi, inventive drinks, and outstanding service.
ONE Hospitality, The ONE Group’s food and beverage hospitality services business develops, manages and operates premier restaurants and turnkey food and beverage services within high-end hotels and casinos currently operating venues in the U.S. and Europe.
Additional information about The ONE Group can be found at www.togrp.com.
Non-GAAP Definitions
We have evolved our definition of non-GAAP financial measures starting in Q4 2025. We use certain non-GAAP measures in analyzing operating performance and believe that the presentation of these measures provides investors and analysts with information that is beneficial to gaining an understanding of the Company’s financial results. Non-GAAP disclosures should not be viewed as a substitute for financial results determined in accordance with GAAP.
Reconciliations of these non-GAAP measures are included under “Reconciliation of Non-GAAP Measures” in this press release.
* Comparable sales represent total U.S. food and beverage sales at owned and managed units, a non-GAAP financial measure, opened for at least a full 24-months. This measure includes total revenue from our owned and managed locations. The Company monitors sales growth at its established restaurant base in addition to growth that results from restaurant acquisitions and new restaurant openings. Refer to the reconciliation of GAAP revenue to total food and beverage sales at owned and managed units in this press release.
** We define Restaurant operating profit as owned restaurant net revenue minus owned restaurant cost of sales and owned restaurant operating expenses. Restaurant operating profit has been presented in this press release and is a supplemental measure of financial performance that is not required by, or presented in accordance with, GAAP. Refer to the reconciliation of operating (loss) income to Restaurant operating profit in this press release.
*** We define Adjusted EBITDA as net income (loss) before interest expense, provision (benefit) for income taxes, depreciation and amortization, stock-based compensation, lease termination and restaurant closure expenses, transition and integration expenses, transaction costs, non-cash rent, non-cash impairment loss, non-recurring gains and losses, certain transactional and exit costs and loss on early debt extinguishment. Adjusted EBITDA has been presented in this press release and is a supplemental measure of financial performance that is not required by, or presented in accordance with, GAAP. Refer to the reconciliation of Net loss to Adjusted EBITDA in this press release.
Cautionary Statement on Forward-Looking Statements
This press release includes “forward-looking statements” within the meaning of the “safe harbor” provisions of the United States Private Securities Litigation Reform Act of 1995, including with respect to portfolio optimization, restaurant openings, the impact of the Benihana acquisition and 2026 financial targets. Forward-looking statements may be identified by the use of words such as “target,” “intend,” “anticipate,” “believe,” “expect,” “estimate,” “plan,” “outlook,” and “project” and other similar expressions that predict or indicate future events or trends or that are not statements of historical matters. A number of factors could cause actual results or outcomes to differ materially from those indicated by such forward-looking statements, including but not limited to: (1) our ability to integrate the new or acquired restaurants into our operations without disruptions to operations; (2) our ability to capture anticipated synergies; (3) our ability to open new restaurants and food and beverage locations in current and additional markets, grow and manage growth profitably, maintain relationships with suppliers and obtain adequate supply of products and retain employees; (4) factors beyond our control that affect the number and timing of new restaurant openings, including weather conditions and factors under the control of landlords, contractors and regulatory and/or licensing authorities; (5) our ability to successfully improve performance and cost, realize the benefits of our marketing efforts and achieve improved results as we focus on developing new management and license deals; (6) changes in applicable laws or regulations; (7) the possibility that The ONE Group may be adversely affected by other economic, business, and/or competitive factors, including economic downturns; (8) the impact of actual and potential changes in immigration policies, including potential labor shortages; (9) the potential impact of the imposition of tariffs, including increases in food prices and inflation and any resulting negative impacts on the macro-economic environment; (10) the impact of international conflicts on macroeconomic conditions; (11) risks related to our development and franchise partners; and (12) other risks and uncertainties indicated from time to time in our filings with the Securities and Exchange Commission, including our Annual Report on Form 10-K filed for the year ended December 28, 2025 and Quarterly Reports on Form 10-Q.
Investors are referred to the most recent reports filed with the Securities and Exchange Commission by The ONE Group Hospitality, Inc. Investors are cautioned not to place undue reliance upon any forward-looking statements, which speak only as of the date made, and we undertake no obligation to update or revise the forward-looking statements, whether as a result of new information, future events or otherwise.
Revenue of US$6.5 million, or 95.5% generated from the data center in Mo i Rana, Norway
Net profit of US$0.6 million, compared with a net loss of US$7.4 million in Q1 FY2026
EBITDA of US$0.8 million versus EBITDA loss of US$5.5 million in Q1 FY2026
Positive operating cash flow of US$2.1 million
LONDON, UK, Nov. 04, 2026 (GLOBE NEWSWIRE) — VivoPower PLC (Nasdaq: VIVO) (“VivoPower” or the “Company”), a leading B Corp-certified global developer and owner of powered land and data center infrastructure today announced its unaudited financial results for the first quarter of fiscal year 2027, being the three months ended September 30, 2026 (“Q1 FY2027”).
Q1 FY2027 Financial Highlights
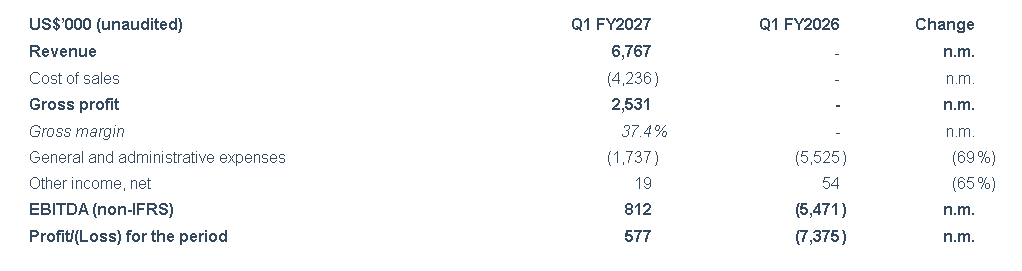
Revenue for the quarter was US$6.8 million, compared with no revenue in Q1 FY2026. The data center business at Mo i Rana, Norway, accounted for US$6.5 million, or 95.5% of total revenue. The electric vehicles business (Tembo) represented the balance with revenues of US$0.3 million as a result of the first batch of vehicle fleet deliveries completed during the quarter.
Gross profit for the quarter was US$2.5 million, representing a gross margin of 37.4%. This was primarily contributed from the Mo i Rana data center, with a combination of bitcoin mining hosting revenues as well as demand response revenues.
The Company recorded a net profit of US$0.6 million for the quarter, compared with a net loss of US$7.4 million in Q1 FY2026.
VivoPower generated positive EBITDA of US$0.8 million during the quarter, compared with negative EBITDA of US$5.5 million in Q1 FY2026.
General and administrative expenses for the quarter decreased by 69% to US$1.7 million, compared with US$5.5 million in Q1 FY2026, notwithstanding a significant scale-up in activities with the data center business. This reflects the Company executing on an AI-native strategy across various support functions, in order to be able to scale productively.
Net cash generated from operating activities was US$2.1 million for the quarter, compared with a net cash outflow of US$2.8 million in Q1 FY2026.
Q1 FY2027 Corporate and Recent Highlights
Secured a US$50.0 million PIPE convertible preference share financing of which US$17.5 million has been received in cash, US$16.5 million was satisfied by the exchange of AWN shareholder loan principal, with the balance subject to completion of customary bank KYC approvals (July 2026).
Appointed a Group Finance Director with experience in every market that the Group Operates globally in order to strength the Company’s finance function (July 2026).
Retired US$28.8 million of AWN shareholder loan principal, of which US$12.3 million was repaid in cash and US$16.5 million was exchanged for convertible preference shares. Approximately US$16 million of outstanding accrued interest is non-interest bearing, classified as an unsecured trade creditor and is allocated to the balance sheet of Tembo (but at this stage still consolidated under VivoPower).
Board approved the establishment of a separate Singapore-headquartered AI infrastructure company to hold 2.2GW non-Nordic portfolio and pipeline, with a planned pre-IPO funding round and independent listing, while retaining de facto control (August 2026).
Decided (post quarter end) not to pursue a lease with the tenant announced as preferred on June 29, 2026, given better offers presented in a rising rent market for Nordic powered land. The Group is working to finalize definitive terms with another prospective AI tenant for Mo i Rana and is concurrently progressing project-level financing discussions. (October 2026).
Summary Income Statement: Three months ended September 30, 2026
Figures may not sum due to rounding. n.m. = not meaningful.
Revenue by Business Unit: three months ended September 30, 2026
Figures may not sum due to rounding. n.m. = not meaningful.
Basis of Preparation
The financial information in this press release is unaudited and has been derived from the Company’s management accounts for the three months ended September 30, 2026, and the comparative three months ended September 30, 2025. It has not been reviewed or audited by the Company’s independent auditors and may be subject to change.
Non-IFRS Financial Measures
This press release includes EBITDA, which is not a measure defined under International Financial Reporting Standards (“IFRS”). VivoPower defines EBITDA as profit/loss for the period before net interest expense, income tax, depreciation and amortization. Management believes this measure helps investors compare operating performance before the effects of financing, taxation and depreciation and amortization. EBITDA is not a measure of cash flow or liquidity. EBITDA should not be considered in isolation or as a substitute for measures prepared under IFRS and may not be comparable to similarly titled measures used by other companies. A reconciliation of EBITDA to profit/loss for the period, the most directly comparable IFRS measure, is set out below.
Reconciliation of Profit/Loss for the period to EBITDA: three months ended September 30, 2026
Figures may not sum due to rounding.
About VivoPower
Originally founded in 2014 and listed on Nasdaq since 2016, VivoPower is an award-winning B Corporation with data center and powered land infrastructure across the Nordics and the GCC regions. The Company’s mission is to be the independent, trusted partner for sovereign nations that develop and operate sustainable data center infrastructure, ensuring sovereign control over power, data, and national intelligence. In doing so, VivoPower helps sovereign nations bridge the gap between their energy assets and their AI ambitions by providing the Power-to-X infrastructure necessary to build and control their own domestic intelligence hubs.
Forward-Looking Statements
This press release contains forward-looking statements within the meaning of the U.S. Private Securities Litigation Reform Act of 1995. The Company intends to rely on the protections of Section 27A of the Securities Act of 1933 and Section 21E of the Securities Exchange Act of 1934 only to the extent legally available. Historical and current factual statements are not forward-looking merely because the financial information is unaudited or may be revised. Forward-looking statements include all statements that are not historical facts, including statements about VivoPower’s strategy and how it will carry it out, the expected growth and contribution of its data center business at Mo i Rana, Norway, including its planned conversion to AI data center capacity, its future revenue, margins, EBITDA and cash flows. Words such as “anticipate”, “believe”, “continue”, “could”, “estimate”, “expect”, “intend”, “may”, “plan”, “potential”, “should”, “will”, “would” and similar expressions are intended to identify forward-looking statements, but the absence of these words does not mean that a statement is not forward-looking.
These statements are based on management’s current expectations and assumptions. They involve risks and uncertainties, many of which are outside the Company’s control, that could cause actual results to differ materially from those expressed or implied. These risks include, among others:
changes to the unaudited financial information once the Company’s review and audit processes are complete;
the Company’s ability to grow revenue from its data center business, secure and keep tenants, and manage power costs;
the Company’s ability to keep operating cash flow positive, meet its working capital needs (including payments to suppliers), and get financing on acceptable terms;
changes in market, economic and regulatory conditions; and
the other risks described in the Company’s filings with the U.S. Securities and Exchange Commission, including its most recent Annual Report on Form 20-F.
Forward-looking statements speak only as of the date of this press release. The Company undertakes no obligation to update them, whether as a result of new information, future events or otherwise, except as required by applicable law.
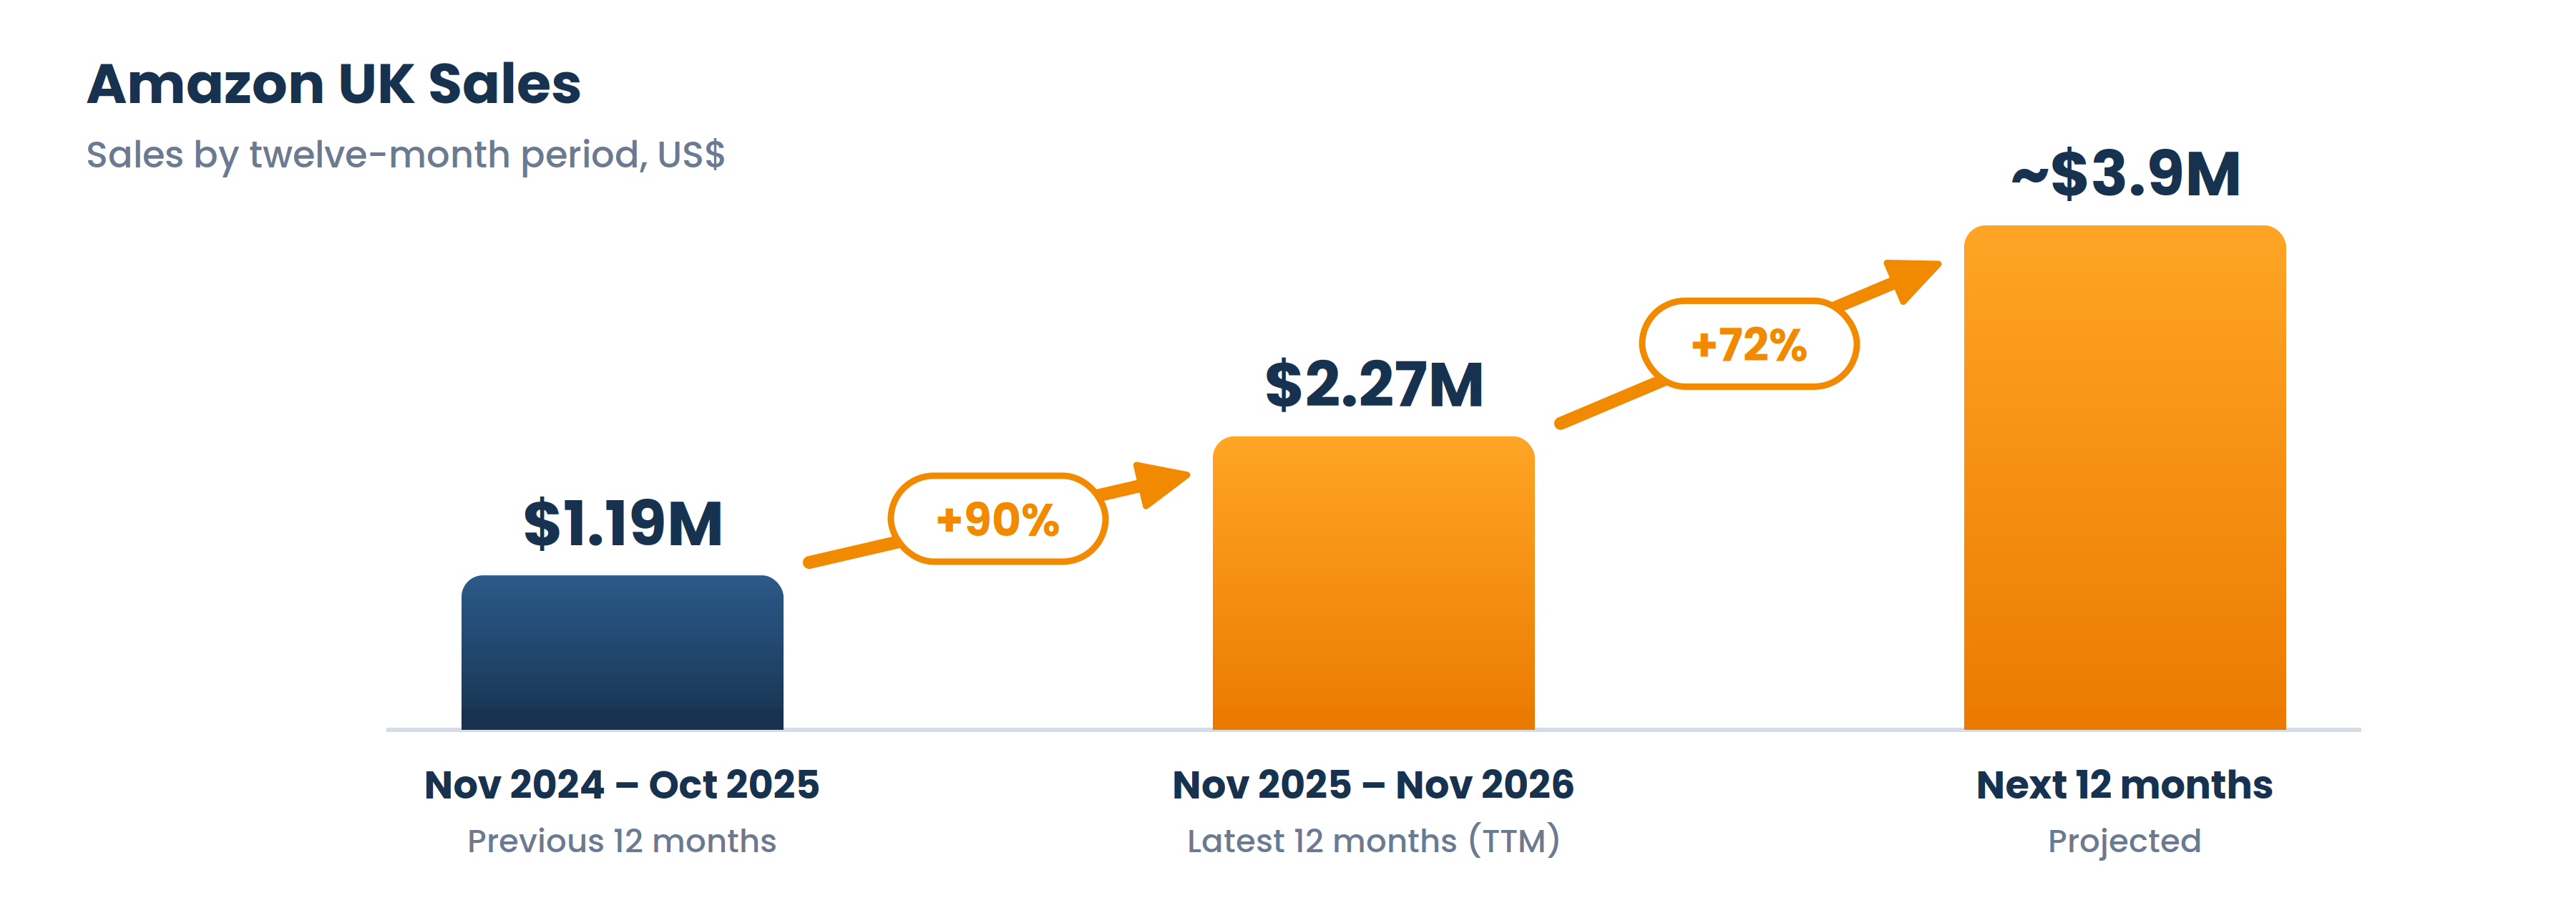
Amazon UK sales up 90%: $2.27 million in TTM sales for the twelve months to November 2, 2026, up from approximately $1.19 million in the prior twelve months23% net margin on Amazon UK: the Amazon UK channel generated $525,000 in net profit after all direct channel costs, including Amazon fees, cost of goods, shipping, advertising and VAT116,978 units sold on Amazon UK: an average of approximately 320 units per dayRecord performance: July through October 2026 were the four strongest months to date on Amazon UK, each with sales above $215,000Efficient growth: advertising costs of only 2.4% of Amazon UK sales, with refunds below 1%72% growth expected: the Company expects Amazon UK sales of approximately $3.9 million over the next twelve months, an average of approximately $325,000 per month
CHICAGO, IL / ACCESS Newswire / November 4, 2026 /Cosmos Health Inc. (“Cosmos Health” or the “Company”) (NASDAQ:COSM), a diversified, vertically integrated global healthcare group, today provided an update on its Amazon UK business, reporting strong sales growth and profitability for the trailing twelve months (“TTM”) from November 1, 2025 to November 2, 2026.
Amazon UK Performance
Over the trailing twelve months, Amazon UK sales reached £1.71 million, or approximately $2.27 million, representing an increase of 90% compared with approximately $1.19 million in the prior twelve-month period. During the same period, the Company sold 116,978 units to customers in the United Kingdom, an average of approximately 320 units per day.
This growth built steadily throughout the year. Monthly sales rose from approximately $144,000 in November 2025 to more than $215,000 in each of the last four months, July through October 2026, the four strongest months in the Company’s history on Amazon UK.
Efficient and Profitable Growth
Importantly, this growth has been achieved efficiently. Advertising costs represented only 2.4% of TTM sales, while refunds remained below 1% of sales. After all direct channel costs, including Amazon fees, cost of goods, shipping, advertising and VAT, Amazon UK generated net profit of approximately £395,000, or approximately $525,000, representing a net margin of approximately 23%. The Company believes these results reflect healthy underlying demand for its products, as well as an efficient and scalable sales channel.
Supporting the Transition to a High-Margin Business Model
Amazon UK has become an integral part of Cosmos Health’s transition to a high-margin business model. The Company believes the channel’s performance demonstrates the level of profitability that its proprietary brands can achieve when sold through efficient online channels.
Outlook
Building on this momentum, the Company expects Amazon UK sales over the next twelve months to grow by approximately 72% compared with the TTM period, to approximately $3.9 million, or an average of approximately $325,000 per month. The outlook is based on the Company’s current sales trends and planned growth initiatives on the platform.
CEO Commentary
Greg Siokas, CEO of Cosmos Health, stated: “Amazon UK is now a multi-million-dollar business for us. Over the past twelve months, sales grew 90% to $2.27 million, and the last four months were our strongest ever on the platform.
“Just as important is the quality of that growth. Advertising was only 2.4% of sales, refunds stayed below 1%, and we generated $525,000 in net profit, representing a net margin of approximately 23%. This is the kind of efficient, profitable growth that supports our transition to a high-margin business model.
“Amazon UK is an integral part of our UK business. Looking ahead, we expect sales on the platform to grow by approximately 72% over the next twelve months, to around $3.9 million. We look forward to providing a broader update on our UK operations in due course.”
About Cosmos Health Inc.
Cosmos Health Inc. (NASDAQ: COSM), incorporated in 2009 in Nevada, is a diversified, vertically integrated global healthcare group. The Company owns a portfolio of proprietary pharmaceutical and nutraceutical brands, including Sky Premium Life®, Mediterranation®, bio-bebe®, C-Sept® and C-Scrub®. Through its subsidiary Cana Laboratories S.A., licensed under European Good Manufacturing Practices (GMP) and certified by the European Medicines Agency (EMA), it manufactures pharmaceuticals, food supplements, cosmetics, biocides, and medical devices within the European Union. Cosmos Health also distributes a broad line of pharmaceuticals and parapharmaceuticals, including branded generics and OTC medications, to retail pharmacies and wholesale distributors through its subsidiaries in Greece and the UK. Furthermore, the Company has established R&D partnerships targeting major health disorders such as obesity, diabetes, and cancer, enhanced by artificial intelligence drug repurposing technologies, and focuses on the R&D of novel patented nutraceuticals, specialized root extracts, proprietary complex generics, and innovative OTC products. Cosmos Health has also entered the telehealth space through the acquisition of ZipDoctor, Inc., based in Texas, USA. With a global distribution platform, the Company is currently expanding throughout Europe, Asia, and North America, and has offices and distribution centers in Thessaloniki and Athens, Greece, and in Harlow, UK. More information is available at www.cosmoshealthinc.com, www.skypremiumlife.com, www.cana.gr, www.zipdoctor.co, www.cloudscreen.gr, as well as LinkedIn and X.
Forward-Looking Statements
With the exception of the historical information contained in this news release, the matters described herein may contain forward-looking statements within the meaning of Section 27A of the Securities Act of 1933, as amended, and Section 21E of the Securities Exchange Act of 1934, as amended. Words such as “believes,” “expects,” “anticipates,” “intends,” “projects,” “estimates,” “plans,” and similar expressions, or future or conditional verbs such as “will,” “should,” “would,” “may,” and “could,” generally identify forward-looking statements, although not all forward-looking statements contain these words. These statements involve risks and uncertainties that may individually or materially affect the matters discussed herein for a variety of reasons outside the Company’s control, including, but not limited to: the Company’s ability to raise sufficient financing to implement its business plan; the effectiveness of its digital asset strategies, including accumulation and yield-generating activities; the impact of the war in Ukraine and ongoing conflicts in the Middle East and other regions on the Company’s business, operations, and the economy in general; the Company’s ability to successfully develop and commercialize its proprietary products and technologies; the timing, execution, regulatory clearance, valuation, structuring, and completion of any potential asset-backed or tokenized financing program; the legal, regulatory, and technological risks associated with digital assets and blockchain-based financial structures; the conversion of contract manufacturing pipeline volumes into production and revenue, including the timing, volume and terms of orders placed under multi-year agreements; the realization of anticipated gross margins; the timing, cost and completion of planned capital investments; changes in interest rates; changes in foreign currency exchange rates, commodity or other price inflation and deflation; our ability to issue debt on terms and at rates acceptable to us; the impact and expected outcome of investigations, inquiries, claims, and litigation; the challenges of operating in international markets; the adequacy of insurance coverage; the effect of accounting charges and of adopting certain accounting standards; the impact of legal and regulatory changes, including changes to tax laws and regulations; guidance for fiscal 2026 and beyond and financial outlook. Forward-looking statements are based on currently available information and our current assumptions, expectations and projections about future events. You should not rely on our forward-looking statements. These statements are not guarantees of future performance and are subject to future events, risks and uncertainties – many of which are beyond our control, dependent on the actions of third parties, or currently unknown to us – as well as potentially inaccurate assumptions that could cause actual results to differ materially from our historical experience and our expectations and projections. These risks and uncertainties include, but are not limited to, those described from time to time in our periodic reports filed with the SEC and available at the SEC’s website (www.sec.gov). There also may be other factors that we cannot anticipate or that are not described herein, generally because we do not currently perceive them to be material. Such factors could cause results to differ materially from our expectations. Forward-looking statements speak only as of the date they are made, and we do not undertake to update these statements other than as required by law. You are advised, however, to review any further disclosures we make on related subjects in our filings with the Securities and Exchange Commission and in our other public statements.
Note: Sales, unit and profit figures are based on the Company’s Amazon UK seller platform data. They are unaudited and may differ from amounts in the Company’s financial statements. Net profit and net margin are channel-level operating metrics, calculated after all direct channel costs and before corporate overheads; they are not U.S. GAAP measures. U.S. dollar figures have been converted from British pounds sterling at the exchange rate as of the date of this release. The sales outlook is a forward-looking statement based on management’s current expectations and assumptions; actual results may differ materially.
Q3 Digital Advertising Revenue YoY Growth Accelerates to 13%
Digital Represents 57% of September YTD Net Revenue and 56% of Segment Profit
PURCHASE, N.Y., Nov. 04, 2026 (GLOBE NEWSWIRE) — Townsquare Media, Inc. (NYSE: TSQ) (“Townsquare”, the “Company,” “we,” “us” or “our”) announced today its financial results for the third quarter ended September 30, 2026.
“Townsquare’s third quarter results reflect the continued strength of our Digital Advertising platform,” commented Bill Wilson, Chief Executive Officer of Townsquare Media, Inc. “Third quarter net revenue of $110.9 million increased 3.9% year-over-year and exceeded our guidance range, Adjusted EBITDA of $22.6 million increased 2.7% year-over-year and was within our guidance range, and net loss narrowed by $1.5 million year-over-year to $4.0 million. These results were driven by the growth of Townsquare Ignite, our Digital Advertising business, and by political revenue that is tracking ahead of our expectations. Digital Advertising net revenue grew 12.7% year-over-year, accelerating for the third consecutive quarter, led by programmatic revenue growth of 22.5%. Our Media Partnerships business now serves 18 partners and extends our digital programmatic advertising platform to 122 markets across the United States, and we expect Media Partnerships revenue to more than double in 2026. In addition, Townsquare Interactive delivered strong profitability, with Segment Profit margins of 36% in Q3, as we rebuild and grow our sales team.”
Mr. Wilson continued, “At the same time, we want to be candid about the challenges we face. Our local clients continue to feel pressure from higher operating costs and interest rates, and they are scrutinizing every marketing dollar, particularly those spent on traditional media. Excluding political, Broadcast Advertising net revenue declined 5.2% in the third quarter. We expect those declines to deepen in the fourth quarter, partly as political advertising crowds out other inventory. In addition, while Townsquare Interactive’s profit remains strong, lower-than-anticipated sales velocity means it will not return to sequential revenue growth in Q4 2026 as we had projected.”
“Given these challenges, and the meaningful direct impact of higher interest rates on our floating-rate debt, we have made the decision, together with our Board, to suspend our quarterly dividend,” concluded Mr. Wilson, “We do not believe that the market is ascribing value to the dividend and we believe this cash can generate greater value for shareholders elsewhere. Suspending the dividend will preserve approximately $14 million of cash annually, which we will use for general corporate liquidity and to opportunistically pursue higher-return opportunities. We believe this is the prudent course for Townsquare and our stakeholders, and that it positions us to continue investing in our digital growth engine while strengthening our financial flexibility.”
In November 2026, the Company’s Board of Directors approved the suspension of its quarterly cash dividend in order to redirect capital toward general corporate liquidity and strategic growth opportunities. The previously declared quarterly dividend of $0.20 per share was paid on November 2, 2026 to stockholders of record as of October 26, 2026. Any future declaration of dividends will be at the discretion of the Board of Directors.
Segment Reporting
We have three reportable operating segments, Digital Advertising, Subscription Digital Marketing Solutions, and Broadcast Advertising. The Digital Advertising segment, marketed externally as Townsquare Ignite, includes digital advertising on our digital programmatic advertising platform and our owned and operated digital properties, and our first party data digital management platform. The Subscription Digital Marketing Solutions segment includes our subscription digital marketing solutions business, Townsquare Interactive. The Broadcast Advertising segment includes our local, regional, and national advertising products and solutions delivered via terrestrial radio broadcast, and other miscellaneous revenue that is associated with our broadcast advertising platform. The remainder of our business is reported in the Other category, which includes our live events business.
Third Quarter Results*
As compared to the third quarter of 2025:
Net revenue increased 3.9%, and 1.4% excluding political
Net loss decreased $1.5 million to a net loss of $4.0 million
Adjusted EBITDA increased 2.7%, and decreased 7.9% excluding political
Total Digital net revenue increased 6.0%
Digital Advertising net revenue increased 12.7%
Subscription Digital Marketing Solutions (“Townsquare Interactive”) net revenue decreased 8.5%
Total Digital Segment Profit decreased 1.1%
Digital Advertising Segment Profit decreased 1.7%
Subscription Digital Marketing Solutions Segment Profit decreased 0.2%
Broadcast Advertising net revenue increased 0.4%, and decreased 5.2% excluding political
Net loss per diluted share was $(2.47) and Adjusted Net Income per diluted share was $0.18
*See below for discussion of non-GAAP measures.
Guidance
For the fourth quarter of 2026, net revenue is expected to be between $107 million and $109 million, and Adjusted EBITDA is expected to be between $23 million and $25 million.
For the full year 2026, net revenue is expected to be between $430 million and $432 million, and Adjusted EBITDA is expected to be between $87 million and $89 million, both within our original guidance ranges.
Quarter EndedSeptember 30, 2026Compared to the Quarter EndedSeptember 30, 2025
Net Revenue
Net revenue for the three months ended September 30, 2026 increased $4.2 million, or 3.9%, as compared to the same period in 2025. Digital Advertising net revenue increased $5.1 million, or 12.7%, due to increases in the purchases of advertising by our clients. Other net revenue increased $0.5 million, or 51.8%, due to the timing of certain events in the current period as compared to the same period a year ago, and Broadcast Advertising net revenue increased $0.2 million, or 0.4%, due to an increase in political revenue. These increases were partially offset by a $1.6 million, or 8.5%, decrease in Subscription Digital Marketing Solutions net revenue, due to reduced sales velocity as a result of lower sales headcount.
Excluding political revenue of $2.9 million and $0.2 million for the three months ended September 30, 2026 and 2025, respectively, net revenue increased $1.5 million, or 1.4%, to $108.0 million. Digital Advertising net revenue increased $5.0 million, or 12.4%, to $45.2 million, and Broadcast Advertising net revenue decreased $2.4 million, or 5.2%, to $44.4 million.
Net Loss
For the three months ended September 30, 2026, we reported a net loss of $4.0 million, a decrease of $1.5 million or 27.5%, as compared to a net loss of $5.5 million in the same period in 2025. The decrease was primarily due to a $5.8 million decrease in transaction and business realignment costs, a $0.9 million increase in income tax benefit, a $0.7 million decrease in interest expense, net, a $0.7 million favorable change in other (income) expense, net, and a $0.7 million increase in segment profit, partially offset by a $5.0 million increase in total non-cash impairment charges and a $1.6 million decrease in net gain on sales and retirement of assets. Adjusted Net Income increased $1.4 million, or 168.8%, to $2.3 million, as compared to $0.9 million for the same period of 2025.
Adjusted EBITDA
Adjusted EBITDA for the three months ended September 30, 2026 increased $0.6 million, or 2.7%, to $22.6 million, as compared to $22.0 million for the same period in 2025. Adjusted EBITDA (Excluding Political) decreased $1.7 million, or 7.9%, to $20.1 million, as compared to $21.9 million for the same period in 2025.
Nine Months Ended September 30,2026Compared to theNine Months Ended September 30,2025
Net Revenue
Net revenue for the nine months ended September 30, 2026 increased $2.2 million, or 0.7%, as compared to the same period in 2025. Digital Advertising net revenue increased $12.3 million, or 10.3%, due to increases in the purchases of advertising by our clients. This increase was partially offset by a $5.2 million, or 3.8%, decrease in Broadcast Advertising net revenue due to decreases in the purchases of advertising by our clients, a $4.7 million, or 8.3%, decrease in Subscription Digital Marketing Solutions net revenue due to reduced sales velocity, and a $0.2 million, or 2.6%, decrease in Other net revenue.
Excluding political revenue of $4.9 million and $1.3 million for the nine months ended September 30, 2026 and 2025, respectively, net revenue decreased $1.4 million, or 0.4%, to $318.2 million, Broadcast Advertising net revenue decreased $8.8 million, or 6.4%, to $127.7 million, and Digital Advertising net revenue increased $12.2 million, or 10.3%, to $131.6 million.
Net Loss
For the nine months ended September 30, 2026, we reported a net loss of $42.8 million, an increase of $37.8 million as compared to a net loss of $5.0 million in the same period last year. The increase in net loss was primarily due to a $38.7 million increase in total non-cash impairment charges, a $7.2 million decrease in net gain on sales and retirement of assets and a $2.8 million decrease in segment profit. These amounts were partially offset by a $6.3 million decrease in transaction and business realignment costs, a $1.7 million decrease in income tax provision, and the absence of a $1.2 million loss on the early extinguishment of debt recognized in 2025. Adjusted Net Income decreased $0.3 million to $3.3 million, as compared to $3.6 million for the same period in 2025.
Adjusted EBITDA
Adjusted EBITDA for the nine months ended September 30, 2026 decreased $2.8 million, or 4.2%, to $63.8 million, as compared to $66.6 million in the same period last year. Adjusted EBITDA (Excluding Political) decreased $5.9 million, or 8.9%, to $59.6 million, as compared to $65.5 million for the same period in 2025.
Liquidity and Capital Resources
As of September 30, 2026, we had a total of $4.6 million of cash and cash equivalents and $467.5 million of outstanding indebtedness, representing 5.48x and 5.43x gross and net leverage, respectively, based on Adjusted EBITDA for the twelve months ended September 30, 2026 of $85.3 million.
The table below presents a summary, as of October 30, 2026, of our outstanding common stock (net of treasury shares).
Security
Number Outstanding
Description
Class A common stock
16,922,126
One vote per share.
Class B common stock
815,296
10 votes per share.1
Class C common stock
500,000
No votes.1
Total
18,237,422
1 Each share converts into one share of Class A common stock upon transfer or at the option of the holder, subject to certain conditions, including compliance with FCC rules.
Conference Call
Townsquare Media, Inc. will host a conference call to discuss certain third quarter 2026 financial results and 2026 guidance on Wednesday, November 4, 2026 at 8:00 a.m. Eastern Time. The conference call dial-in number is 1-800-717-1738 (U.S. & Canada) or 1-646-307-1865 (International) and the conference ID is “Townsquare.” A live webcast of the conference call will also be available on the investor relations page of the Company’s website at www.townsquaremedia.com.
A replay of the conference call will be available through November 11, 2026. To access the replay, please dial 1-844-512-2921 (U.S. and Canada) or 1-412-317-6671 (International) and enter confirmation code 1140294. A web-based archive of the conference call will also be available at the above website.
About Townsquare Media, Inc.
Townsquare is a community-focused digital and broadcast media and digital marketing solutions company principally focused outside the top 50 markets in the U.S. Townsquare Ignite, our robust digital advertising division, specializes in helping businesses of all sizes connect with their target audience through data-driven, results-based strategies, by utilizing a) our proprietary digital programmatic advertising technology stack with an in-house demand and data management platform and b) our owned and operated portfolio of more than 400 local news and entertainment websites and mobile apps along with a network of leading national music and entertainment brands, collecting valuable first party data. Townsquare Interactive, our subscription digital marketing services business, partners with SMBs to help manage their digital presence by providing a SaaS business management platform, website design, creation and hosting, search engine optimization and other digital services. And through our portfolio of local radio stations strategically situated outside the Top 50 markets in the United States, we provide effective advertising solutions for our clients and relevant local content for our audiences. For more information, please visit www.townsquaremedia.com, www.townsquareinteractive.com and www.townsquareignite.com.
Forward-Looking Statements
Except for the historical information contained in this press release, the matters addressed are forward-looking statements within the meaning of the Private Securities Litigation Reform Act of 1995. Forward-looking statements often discuss our current expectations and projections relating to our financial condition, results of operations, plans, objectives, future performance and business. You can identify forward-looking statements by the fact that they do not relate strictly to historical or current facts. These statements may include words such as “aim,” “anticipate,” “estimate,” “expect,” “forecast,” “outlook,” “potential,” “project,” “projection,” “plan,” “intend,” “seek,” “believe,” “may,” “could,” “would,” “will,” “should,” “can,” “can have,” “likely,” the negatives thereof and other words and terms. Actual events or results may differ materially from the results anticipated in these forward-looking statements as a result of a variety of factors. While it is impossible to identify all such factors, factors that could cause actual results to differ materially from those estimated by us include the impact of general economic conditions in the United States, or in the specific markets in which we currently do business including supply chain disruptions, inflation, labor shortages and the effect on advertising activity, industry conditions, including existing competition, artificial intelligence and future competitive technologies, the popularity of radio as a broadcasting and advertising medium, cancellations, disruptions or postponements of advertising schedules in response to national or world events, our ability to develop and maintain digital technologies (including artificial intelligence) and hire and retain technical and sales talent, our dependence on key personnel, our capital expenditure requirements, our continued ability to identify suitable acquisition targets, and consummate and integrate any future acquisitions, legislative or regulatory requirements, risks and uncertainties relating to our leverage and changes in interest rates, our ability to obtain financing at times, in amounts and at rates considered appropriate by us, our ability to access the capital markets as and when needed and on terms that we consider favorable to us, tariffs and other factors discussed in our Quarterly Report on Form 10-Q in the section entitled “Management’s Discussion and Analysis of Financial Condition and Results of Operations” and under “Risk Factors” in our 2025 Annual Report on Form 10-K, for the year ended December 31, 2025, filed with the SEC on March 16, 2026, as well as other risks discussed from time to time in our filings with the SEC. Many of these factors are beyond our ability to predict or control. In addition, as a result of these and other factors, our past financial performance should not be relied on as an indication of future performance. The cautionary statements referred to in this section also should be considered in connection with any subsequent written or oral forward-looking statements that may be issued by us or persons acting on our behalf. The forward-looking statements included in this press release are made only as of the date hereof or as of the date specified herein. We undertake no obligation to publicly update or revise any forward-looking statements, whether as a result of new information, future events or otherwise, except as required by law.
Non-GAAP Financial Measures and Definitions
In this press release, we refer to Adjusted EBITDA, Adjusted EBITDA (Excluding Political), Adjusted Net Income and Adjusted Net Income Per Share which are financial measures that have not been prepared in accordance with generally accepted accounting principles in the United States (“GAAP”).
We define Adjusted EBITDA as net (loss) income before the deduction of income taxes, interest expense, net, (gain) loss on repayments and extinguishment of debt, transaction and business realignment costs, depreciation and amortization, stock-based compensation, impairments, net (gain) loss on sale and retirement of assets and other expense (income), net. We define Adjusted EBITDA (Excluding Political) as Adjusted EBITDA less political net revenue, net of a fifteen percent deduction to account for estimated national representative firm fees, music licensing fees and sales commissions expense. Adjusted Net Income is defined as net income before the deduction of transaction and business realignment costs, impairments, net (gain) loss on sale and retirement of assets, (gain) loss on repayments and extinguishment of debt, gain on insurance recoveries and net income attributable to non-controlling interest, net of income taxes stated at the Company’s applicable statutory effective tax rate. Adjusted Net Income Per Share is defined as Adjusted Net Income divided by the weighted average shares outstanding. We define Net Leverage as our total outstanding indebtedness, net of our total cash balance as of September 30, 2026, divided by our Adjusted EBITDA for the twelve months ended September 30, 2026. These measures do not represent, and should not be considered as alternatives to or superior to, financial results and measures determined or calculated in accordance with GAAP. In addition, these non-GAAP measures are not based on any comprehensive set of accounting rules or principles. You should be aware that in the future we may incur expenses or charges that are the same as or similar to some of the adjustments in the presentation, and we do not infer that our future results will be unaffected by unusual or nonrecurring items. In addition, these non-GAAP measures may not be comparable to similarly-named measures reported by other companies.
We use Adjusted EBITDA and Adjusted EBITDA (Excluding Political) to facilitate company-to-company operating performance comparisons by backing out potential differences caused by variations in capital structures (affecting interest expense), taxation and the age and book depreciation of facilities and equipment (affecting relative depreciation expense), which may vary for different companies for reasons unrelated to operating performance, and to facilitate year over year comparisons, by backing out the impact of political revenue which varies depending on the election cycle and may be unrelated to operating performance. We use Adjusted Net Income and Adjusted Net Income Per Share to assess total company operating performance on a consistent basis. We use Net Leverage to measure the Company’s ability to handle its debt burden. We believe that these measures, when considered together with our GAAP financial results, provide management and investors with a more complete understanding of our business operating results, including underlying trends, by excluding the effects of net, (gain) loss on repayments and extinguishment of debt, transaction costs, net (gain) loss on sale and retirement of assets, business realignment costs and impairments. Further, while discretionary bonuses for members of management are not determined with reference to specific targets, our board of directors may consider Adjusted EBITDA, Adjusted EBITDA (Excluding Political), Adjusted Net Income, Adjusted Net Income Per Share, and Net Leverage when determining discretionary bonuses.
Madrid, Spain and Tel Aviv, Israel, November 4, 2026 (GLOBE NEWSWIRE) – Codere Online Luxembourg, S.A. (Nasdaq: CDRO / CDROW) (the “Company” or “Codere Online”) a leading online gaming operator in Spain and Latin America, today announced that it will release its third quarter 2026 results prior to 8:30AM US Eastern Time on November 12, 2026.
At 8:30AM US Eastern Time on the same day, Codere Online’s management will host a conference call to discuss the results and provide a business update.
The Company’s earnings press release and related materials will be available on Codere Online’s website at www.codereonline.com. Dial-in details for the conference call as well as the audio webcast registration link are accessible in the Events & Presentations section of the same website. A recording of the webcast will be available following the conference call.
About Codere Online
Codere Online refers, collectively, to Codere Online Luxembourg, S.A. and its subsidiaries. Codere Online launched in 2014 as part of the renowned casino operator Codere Group. Codere Online offers online sports betting and online casino through its state-of-the art website and mobile applications. Codere currently operates in its core markets of Spain, Mexico, Colombia, Panama and Argentina. Codere Online’s online business is complemented by Codere Group’s physical presence throughout Latin America, forming the foundation of the leading omnichannel gaming and casino presence.
About Codere Group Codere Group is a multinational group devoted to entertainment and leisure. It is a leading player in the private gaming industry, with four decades of experience and with presence in seven countries in Europe (Spain and Italy) and Latin America (Argentina, Colombia, Mexico, Panama, and Uruguay).
Contacts:
Investors and Media Guillermo Lancha Director, Investor Relations and Communications [email protected] (+34)-628-928-152
OLD GREENWICH, Conn., Nov. 04, 2026 (GLOBE NEWSWIRE) — Star Equity Holdings, Inc. (Nasdaq: STRR and STRRP) (“Star” or the “Company”), a diversified holding company, announced today that it will release its financial results for the third quarter ended September 30, 2026, after the close of the market on Wednesday, November 11, 2026.
A conference call is scheduled for 10:00 a.m. ET on Thursday, November 12, 2026, to discuss the results and management’s outlook. The call may be accessed by dialing:
An archived replay of the webcast will be available shortly after the end of the conference call.
About Star Equity Holdings, Inc. Star Equity Holdings, Inc. is a diversified holding company that seeks to build long-term shareholder value by acquiring, managing, and growing businesses with strong fundamentals and market opportunities. Its current structure comprises four segments: Building Solutions, Business Services, Energy Services, and Investments. For more information visit www.starequity.com.
Building Solutions The Building Solutions division operates in three specialties: (i) modular building manufacturing; (ii) structural wall panel and wood foundation manufacturing, including building supply distribution operations; and (iii) glue-laminated timber (glulam) column, beam, and truss manufacturing.
Business Services The Business Services division provides flexible and scalable recruitment solutions to a global clientele, servicing organizations at all levels, from entry-level positions to the C-suite. The division focuses on mid-market and enterprise organizations worldwide, partnering consultatively with talent acquisition, HR, and procurement leaders to build diverse, high-impact teams and drive business success.
Energy Services The Energy Services division engages in the rental, sale, and repair of downhole tools used in the oil and gas, geothermal, mining, and water-well industries.
Investments The Investments division manages and finances the Company’s real estate assets as well as its investment positions in private and public companies.
For more information contact: The Equity Group Lena Cati Senior Vice President 212-836-9611 [email protected]
First Quarter of Fiscal Year 2027 – Consolidated Earnings Highlights
Revenue of $280.0 million
Net loss of $(20.3) million
Adjusted EBITDA* of $(17.0) million
Fiscal Year 2027 Guidance Ranges:
Revenue expected in the range of $1.35 billion to $1.45 billion
Adjusted EBITDA* expected in the range of $90 million to $115 million
Operating Cash Flow expected to be more than $60 million
First Quarter Fiscal Year 2027 – Segment Highlights
Senior
Revenue of $50.8 million
Adjusted EBITDA of $(12.3) million
Approved Medicare Advantage policies of 50,976
Healthcare Services
Revenue of $186.3 million
Adjusted EBITDA of $11.2 million
99,753 SelectRx members
Life
Revenue of $42.8 million
Adjusted EBITDA of $7.3 million
OVERLAND PARK, Kan.–(BUSINESS WIRE)– SelectQuote, Inc. (NYSE: SLQT) reported consolidated revenue for the first quarter of fiscal year 2027 of $280.0 million compared to consolidated revenue for the first quarter of fiscal year 2026 of $328.8 million. Consolidated net loss for the first quarter of fiscal year 2027 was $20.3 million compared to consolidated net loss for the first quarter of fiscal year 2026 of $30.5 million. Consolidated Adjusted EBITDA* for the first quarter of fiscal year 2027 was $(17.0) million compared to consolidated Adjusted EBITDA* for the first quarter of fiscal year 2026 of $(32.1) million. Consolidated cash used in operations during the first quarter of fiscal year 2027 was $17.2 million compared to $21.6 million used during the first quarter of fiscal year 2026.
Tim Danker, SelectQuote’s Chief Executive Officer, remarked, “We are proud of another strong quarter across both our Senior and Healthcare Services segments, resulting in a material year-over-year improvement in adjusted EBITDA and operating cash flow. We have high confidence in our current and long-term strategy to drive value for stakeholders, and we are pleased to reiterate our full-year financial targets for fiscal 2027. Our confidence stems primarily from growing efficiencies and process management that are within our control. The company’s foundational commitment to technology- and agent-led service have increasingly driven operating leverage in our business, which has only been accelerated through the use of AI. Now that AEP has kicked off, we are excited to see that our tenured agent force is helping a highly-engaged Medicare beneficiary population find the right plans to meet their unique needs. We firmly believe SelectQuote is well-positioned to drive meaningful growth in profit and cash flow for shareholders, both in fiscal 2027 and in an improving Medicare Advantage environment which we believe is on the horizon.”
Mr. Danker continued, “SelectQuote’s performance, in our seasonally slowest quarter, showcases the continued impact of our strategy to optimize profitability and cash flow. Despite lower revenue across both Senior and Healthcare Services, SelectQuote drove a 30% improvement in our year-over-year trailing twelve month adjusted EBITDA, and we remain on track to drive over $60 million in operating cash flow in fiscal 2027. Better yet, we are achieving these results in an environment where we strategically lowered agent headcount for Senior and continue to scale Healthcare Services despite the revenue headwind from the Inflation Reduction Act.”
* See “Non-GAAP Financial Measures” below.
Segment Results
We currently have three reportable segments: 1) Senior, 2) Healthcare Services and 3) Life. The performance measures of the segments include total revenue and adjusted EBITDA. Costs of commissions and other services revenue, cost of goods sold-pharmacy revenue, marketing and advertising, selling, general, and administrative, and technical development operating expenses that are directly attributable to a segment are reported within the applicable segment. Indirect costs of revenue, marketing and advertising, selling, general, and administrative, and technical development operating expenses are allocated to each segment based on varying metrics such as headcount.
Senior
Financial Results
The following table provides the financial results for the Senior segment for the periods presented:
Operating Metrics
Submitted Policies
Submitted policies are counted when an individual completes an application with our licensed agent and provides authorization to the agent to submit the application to the insurance carrier partner. The applicant may have additional actions to take before the application will be reviewed by the insurance carrier.
The following table shows the number of submitted policies for the periods presented:
Approved Policies
Approved policies represents the number of submitted policies that were approved by our insurance carrier partners for the identified product during the indicated period. Not all approved policies will go in force.
The following table shows the number of approved policies for the periods presented:
Lifetime Value of Commissions per Approved Policy
Lifetime value of commissions per approved policy represents commissions estimated to be collected over the estimated life of an approved policy based on multiple factors, including but not limited to, contracted commission rates, carrier mix and expected policy persistency with applied constraints. The lifetime value of commissions per approved policy is equal to the sum of the commission revenue due upon the initial sale of a policy, and when applicable, an estimate of future renewal commissions.
The following table shows the lifetime value of commissions per approved policy for the periods presented:
Healthcare Services
Financial Results
The following table provides the financial results for the Healthcare Services segment for the periods presented:
Operating Metrics
Members
The total number of SelectRx members represents the amount of active customers to which an order has been shipped and the prescriptions per day represents the total average prescriptions shipped per business day. These two metrics are the primary drivers of revenue for Healthcare Services.
The following table shows the total number of SelectRx members as of the periods presented:
The total number of SelectRx members decreased by 7% as of September 30, 2026, compared to September 30, 2025, primarily due to refined customer qualification with a focus on long-term profitability and operational efficiency. Profitability per SelectRx member increased 60% compared to a year ago from $67.1 per member to $107.6 per member. Profitability per member is calculated as Healthcare Services divisional Adjusted EBITDA for the period divided by average members, represented by the mean of ending membership in the prior period and ending membership in the current period.
The following table shows the average prescriptions shipped per day for the periods presented:
Combined Senior and Healthcare Services – Consumer Per Unit Economics
Combined Senior and Healthcare Services consumer per unit economics represents total MA and MS commissions; other product commissions; other revenues, including revenues from Healthcare Services; and operating expenses associated with Senior and Healthcare Services, each shown per number of approved MA and MS policies over a given time period. Management assesses the business on a per-unit basis to help ensure that the revenue opportunity associated with a successful policy sale is attractive relative to the marketing acquisition cost. Because not all acquired leads result in a successful policy sale, all per-policy metrics are based on approved policies, which is the measure that triggers revenue recognition.
The MA and MS commission per MA/MS policy represents the LTV for policies sold in the period. Other commission per MA/MS policy represents the LTV for other products sold in the period, including DVH prescription drug plan, and other products, which management views as additional commission revenue on our agents’ core function of MA/MS policy sales. Pharmacy revenue per MA/MS policy represents revenue from SelectRx, and other revenue per MA/MS policy represents revenue from Healthcare Select, production bonuses, marketing development funds, lead generation revenue, and adjustments from the Company’s reassessment of its cohorts’ transaction prices. Total operating expenses per MA/MS policy represents all of the operating expenses within Senior and Healthcare Services. The revenue to customer acquisition cost (“CAC”) multiple represents total revenue as a multiple of total marketing acquisition cost, which represents the direct costs of acquiring leads. These costs are included in marketing and advertising expense within the total operating expenses per MA/MS policy.
The following table shows combined Senior and Healthcare Services consumer per unit economics for the periods presented. Based on the seasonality of Senior and the fluctuations between quarters, we believe that the most relevant view of per unit economics is on a rolling 12-month basis. All per MA/MS policy metrics below are based on the sum of approved MA/MS policies, as both products have similar commission profiles.
Total revenue per MA/MS policy increased 2% for the twelve months ended September 30, 2026, compared to the twelve months ended September 30, 2025, primarily due to the increase in pharmacy revenue during the twelve month period. Total operating expenses per MA/MS policy decreased 1% for the twelve months ended September 30, 2026, compared to the twelve months ended September 30, 2025.
Life
Financial Results
The following table provides the financial results for the Life segment for the periods presented:
Operating Metrics
Life premium represents the total premium value for all policies that were approved by the relevant insurance carrier partner and for which the policy document was sent to the policyholder and payment information was received by the relevant insurance carrier partner during the indicated period. Because our commissions are earned based on a percentage of total premium, total premium volume for a given period is the key driver of revenue for our Life segment.
The following table shows term and final expense premiums for the periods presented:
For those interested in dialing into the conference call, please register using this link: https://events.q4inc.com/analyst/147967155?pwd=mzE1TBCI. After registering, a confirmation will be sent via email, including dial-in details and unique conference call codes for entry. Registration is open through the live call, but to ensure you are connected for the full call we suggest registering at least 10 minutes before the start of the call.
Non-GAAP Financial Measures
This release includes certain non-GAAP financial measures intended to supplement, not substitute for, comparable GAAP measures. To supplement our financial statements presented in accordance with GAAP and to provide investors with additional information regarding our GAAP financial results, we have presented in this release Adjusted EBITDA, which, when presented on a consolidated basis, is a non-GAAP financial measure. This non-GAAP financial measure is not based on any standardized methodology prescribed by GAAP and is not necessarily comparable to any similarly titled measure presented by other companies. We define Adjusted EBITDA as net income (loss) plus interest expense, income taxes, depreciation and amortization, changes in fair value of warrant liabilities, loss on extinguishment of debt, and certain add-backs for non-cash or non-recurring expenses, including restructuring and share-based compensation expenses. The most directly comparable GAAP measure is net income (loss). We monitor and have presented in this release Adjusted EBITDA because it is a key measure used by our management and Board of Directors to understand and evaluate our operating performance, establish budgets, and develop operational goals for managing our business. In particular, we believe that excluding the impact of these expenses in calculating Adjusted EBITDA can provide a useful measure for period-to-period comparisons of our core operating performance.
A reconciliation of the differences between Adjusted EBITDA and its most directly comparable GAAP measure, net income (loss), is presented below on page 12. The Company is unable to provide a quantitative reconciliation of forward-looking Adjusted EBITDA to its most directly comparable GAAP measure without unreasonable effort because it is not possible to predict certain information included in the calculation of such GAAP measure, including the fair value of outstanding warrants to purchase shares of the Company’s common stock. The unavailable information could have a significant impact on the Company’s GAAP financial results.
Forward Looking Statements
This release contains forward-looking statements. These forward-looking statements reflect our current views with respect to, among other things, future events and our financial performance. These statements are often, but not always, made through the use of words or phrases such as “may,” “should,” “could,” “predict,” “potential,” “believe,” “will likely result,” “expect,” “continue,” “will,” “anticipate,” “seek,” “estimate,” “intend,” “plan,” “projection,” “would” and “outlook,” or the negative version of those words or other comparable words or phrases of a future or forward-looking nature. These forward-looking statements are not historical facts, and are based on current expectations, estimates and projections about our industry, management’s beliefs and certain assumptions made by management, many of which, by their nature, are inherently uncertain and beyond our control. Accordingly, we caution you that any such forward-looking statements are not guarantees of future performance and are subject to risks, assumptions and uncertainties that are difficult to predict. Although we believe that the expectations reflected in these forward-looking statements are reasonable as of the date made, actual results may prove to be materially different from the results expressed or implied by the forward-looking statements. There are or will be important factors that could cause our actual results to differ materially from those indicated in these forward-looking statements, including, but not limited to, the following: our reliance on a limited number of insurance carrier partners and any potential termination of those relationships or failure to develop new relationships; existing and future laws and regulations affecting the health insurance market; changes in health insurance products offered by our insurance carrier partners and the health insurance market generally; insurance carriers offering products and services directly to consumers; changes to commissions paid by insurance carriers and underwriting practices; competition with brokers, exclusively online brokers and carriers who opt to sell policies directly to consumers; competition from government-run health insurance exchanges; developments in the U.S. health insurance system; our dependence on revenue from carriers in our senior segment and downturns in the senior health as well as life, automotive and home insurance industries; our ability to develop new offerings and penetrate new vertical markets; risks from third-party products; failure to enroll individuals during the Medicare annual enrollment period; our ability to attract, integrate and retain qualified personnel; our dependence on lead providers and ability to compete for leads; failure to obtain and/or convert sales leads to actual sales of insurance policies; access to data from consumers and insurance carriers; accuracy of information provided from and to consumers during the insurance shopping process; cost-effective advertisement through internet search engines; ability to contact consumers and market products by telephone;our use of artificial intelligence and other emerging technologies;global economic conditions, including inflation; disruption to operations as a result of future acquisitions; significant estimates and assumptions in the preparation of our financial statements; impairment of goodwill; potential litigation and other legal proceedings or inquiries; our existing and future indebtedness; our ability to maintain compliance with our debt covenants; access to additional capital; our ability to regain and maintain compliance with NYSE listing standards; failure to protect our intellectual property and our brand; fluctuations in our financial results caused by seasonality; accuracy and timeliness of commissions reports from insurance carriers; timing of insurance carriers’ approval and payment practices; factors that impact our estimate of the constrained lifetime value of commissions per policyholder; changes in accounting rules, tax legislation and other legislation; disruptions or failures of our technological infrastructure and platform; failure to maintain relationships with third-party service providers; cybersecurity breaches or other attacks involving our systems or those of our insurance carrier partners or third-party service providers; our ability to protect consumer information and other data; failure to market and sell Medicare plans effectively or in compliance with laws; and other factors related to our pharmacy business, including manufacturing or supply chain disruptions, access to and demand for prescription drugs, changes in reimbursement rates under our contracts with pharmacy benefit managers, and regulatory changes or other industry developments that may affect our pharmacy operations. For a further discussion of these and other risk factors that could impact our future results and performance, see the section entitled “Risk Factors” in the most recent Annual Report on Form 10-K (the “Annual Report”) and subsequent periodic reports filed by us with the Securities and Exchange Commission. Accordingly, you should not place undue reliance on any such forward-looking statements. Any forward-looking statement speaks only as of the date on which it is made, and, except as otherwise required by law, we do not undertake any obligation to publicly update or review any forward-looking statement, whether as a result of new information, future developments or otherwise.
About SelectQuote:
Founded in 1985, SelectQuote (NYSE: SLQT) pioneered the model of providing unbiased comparisons from multiple, highly-rated insurance companies, allowing consumers to choose the policy and terms that best meet their unique needs. Two foundational pillars underpin SelectQuote’s success: a strong force of highly-trained and skilled agents who provide a consultative needs analysis for every consumer, and proprietary technology that sources and routes high-quality leads. Today, the Company operates an ecosystem offering high touchpoints for consumers across insurance, pharmacy, and virtual care.
With an ecosystem offering engagement points for consumers across insurance, Medicare, pharmacy, and value-based care, the company now has three core business lines: SelectQuote Senior, SelectQuote Healthcare Services, and SelectQuote Life. SelectQuote Senior serves the needs of a demographic that sees around 10,000 people turn 65 each day with a range of Medicare Advantage and Medicare Supplement plans. SelectQuote Healthcare Services is comprised of the SelectRx Pharmacy, a Patient-Centered Pharmacy Home™ (PCPH) accredited pharmacy, SelectPatient Management, a provider of chronic care management services, and Healthcare Select which proactively connects consumers with a wide breadth of healthcare services supporting their needs.
Received Provisional Approval and Priority Designation for OCU400 in The Bahamas
Executed agreement with local partner Global Alliance for Regenerative Medicine (GARM) to coordinate and manage patient care
Progressing site readiness in preparation to accept patients
Advancing toward full approval and potential patient enrollment as early as year-end
Executed an exclusive OCU400 license agreement for the Middle East and North Africa (MENA) with Roots Pharmaceutical
Initiated dosing in Phase 3 ArMaDa3 trial of OCU410 for geographic atrophy (GA)
Cash, cash equivalents, restricted cash, and short-term investments of $84.6 million as of September 30, 2026; with expected runway into 2028
MALVERN, Pa., Nov. 04, 2026 (GLOBE NEWSWIRE) — Ocugen, Inc. (“Ocugen” or the “Company”) (NASDAQ: OCGN), a pioneering biotechnology leader in gene therapies for blindness diseases, today reported third quarter 2026 financial results along with a general business update.
“With three Phase 3 modifier gene therapy programs underway, Ocugen is executing against a clear strategy of advancing our pipeline and leveraging strategic partnerships to expand global reach and potentially bring our therapies to patients worldwide,” said Dr. Shankar Musunuri, Chairman, CEO and Co-Founder of Ocugen. “As we demonstrated in the third quarter, we remain focused on executing key clinical and regulatory milestones, expanding our commercial opportunities, and maintaining a disciplined approach as we advance toward the anticipated OCU400 Phase 3 topline data early next year.”
Ocugen continues to advance its three late-stage modifier gene therapy programs toward key clinical and regulatory milestones, with OCU400 expected to be the first Phase 3 study to read out in the first quarter of 2027. The Company remains focused on execution across its pivotal programs while preparing for potential regulatory submissions and broader patient access opportunities.
Clinical Program Updates
OCU400 (RP)
Granted Provisional Approval and Priority Designation from the Longevity and Regenerative Therapies (LARTA) Board of The Bahamas; agreement with local partner, GARM, to manage process; site readiness progressing; LARTA final approval and potential patient enrollment as early as year-end
Completed an exclusive OCU400 license for MENA with Roots Pharmaceutical. Ocugen is eligible for up to $4 million in combined upfront license fee and potential initial development milestone payments, up to $255 million of potential sales milestones, and a 22% royalty on net sales, and will manufacture commercial supply. It is Ocugen’s second regional OCU400 license agreement, following Kwangdong Pharmaceutical in South Korea
Top-line data from the 140-patient Phase 3 liMeliGhT trial are expected in the first quarter of 2027, followed by a planned Biologics License Application (BLA) submission; completed Process Performance Qualification (PPQ) batches to support the BLA and commercial launch supply
OCU410ST (Stargardt disease)
Topline data from the Phase 2/3 pivotal confirmatory trial (N=63 subjects) are anticipated in the second quarter of 2027, with a planned BLA submission to follow
OCU410 (GA)
Announced the first patient dosed in ArMaDa3, a 240-subject global Phase 3 trial randomizing patients 2:1 to a single subretinal injection of OCU410 or untreated control across the U.S., Canada, and Europe; the primary endpoint is GA lesion growth over 12 months
Presented 12-month Phase 2 ArMaDa2 results at three scientific conferences, including two podium presentations at AAO 2026
Corporate Updates
Named Jolanda Crombach General Manager of its newly established European affiliate in Amsterdam to support the OCU410 Phase 3 development program, upcoming marketing authorization submissions, and potential commercialization in Europe. Ms. Crombach most recently served as Managing Director and Board Member of Moderna Netherlands and previously held leadership roles at MSD (Merck) and Pfizer
Third Quarter 2026 Financial Results
The Company’s cash, cash equivalents, restricted cash, and short-term investments totaled $84.6 million as of September 30, 2026, which is expected to extend the runway into 2028
The Company had 339.3 million shares of common stock outstanding as of September 30, 2026
Total operating expenses for the three months ended September 30, 2026, were $19.7 million and included research and development expenses of $12.5 million and general and administrative expenses of $7.2 million, compared to total operating expenses for the three months ended September 30, 2025, of $19.4 million that included research and development expenses of $11.1 million and general and administrative expenses of $8.2 million
Ocugen reported a $(0.01) net loss per common share for the three months ended September 30, 2026, compared to a $(0.07) net loss per common share for the three months ended September 30, 2025
Conference Call and Webcast Details Ocugen has scheduled a conference call and webcast for 8:30 a.m. ET today to discuss the financial results and recent business highlights. Ocugen’s senior management team will host the call, which will be open to all listeners. There will also be a question-and-answer session following the prepared remarks.
Attendees are invited to participate on the call using the following details: Dial-in Numbers: (800) 715-9871 for U.S. callers and (646) 307-1963 for international callers Conference ID: 6835403 Webcast:https://edge.media-server.com/mmc/p/w8rytgud (also available on the investor section of the Ocugen website)
A replay of the call and archived webcast will be available on the Ocugen investor site.
About Ocugen, Inc. Ocugen, Inc. is a pioneering biotechnology company developing gene therapies for blindness diseases. The Company’s breakthrough modifier gene therapy platform has the potential to address significant unmet medical needs across large patient populations through a gene-agnostic approach. Unlike traditional gene therapies and gene-editing technologies that target a single gene mutation, Ocugen’s modifier gene therapies are designed to address the underlying disease biology by restoring balance across multiple gene networks. The Company is currently advancing programs for inherited retinal diseases and other causes of blindness that affect millions worldwide, including retinitis pigmentosa, Stargardt disease, and geographic atrophy, an advanced form of dry age-related macular degeneration. Discover more at www.ocugen.com and follow the Company on LinkedIn and X.
Cautionary Note on Forward-Looking Statements This press release contains forward-looking statements within the meaning of the Private Securities Litigation Reform Act of 1995, including, but not limited to, strategy, business plans and objectives for Ocugen’s clinical programs, plans and timelines for the preclinical and clinical development of Ocugen’s product candidates, including the therapeutic potential, clinical benefits and safety thereof, expectations regarding timing, success and data announcements of current ongoing preclinical and clinical trials, including the timing of enrollment and data readouts, the ability to initiate new clinical programs, Ocugen’s financial condition and expected cash runway into 2028, statements regarding qualitative assessments of available data, potential benefits, expectations for ongoing clinical trials, anticipated regulatory filings and anticipated development timelines, statements regarding potential market size and commercial possibilities of Ocugen’s product candidates, statements regarding the ability to obtain the full LARTA approval in The Bahamas, and statements regarding the anticipated benefits to Ocugen of the definitive license agreement and supply agreement with Roots Pharmaceutical, which are subject to risks and uncertainties. We may, in some cases, use terms such as “predicts,” “believes,” “potential,” “proposed,” “continue,” “estimates,” “anticipates,” “expects,” “plans,” “intends,” “may,” “could,” “might,” “will,” “should,” or other words that convey uncertainty of future events or outcomes to identify these forward-looking statements. Such statements are subject to numerous important factors, risks, and uncertainties that may cause actual events or results to differ materially from our current expectations, including, but not limited to, the risks that receipt of Provisional LARTA Approval and Priority Designation may not lead to faster regulatory review and full approval, that the license agreement and supply agreement with Roots Pharmaceutical Company will not lead to the current anticipated benefits to Ocugen, that preliminary, interim and top-line clinical trial results may not be indicative of, and may differ from, final clinical data; that unfavorable new clinical trial data may emerge in ongoing clinical trials or through further analyses of existing clinical trial data; that earlier non-clinical and clinical data and testing may not be predictive of the results or success of later clinical trials; and that clinical trial data are subject to differing interpretations and assessments, including by regulatory authorities. These and other risks and uncertainties are more fully described in our filings with the Securities and Exchange Commission (SEC), including the risk factors described in the section entitled “Risk Factors” in the quarterly and annual reports that we file with the SEC. Any forward-looking statements that we make in this press release speak only as of the date of this press release. Except as required by law, we assume no obligation to update forward-looking statements contained in this press release whether as a result of new information, future events, or otherwise, after the date of this press release.
Financial results for FY2026 are not reflective of full-year contribution from the Mo i Rana Data Center business
Mo i Rana data center results consolidated from 12 May 2026, being the date of effective completion
FY2026 revenue was US$2.6 million, primarily reflecting consolidation of the Mo i Rana Data Center
IFRS loss from continuing operations of US$50.4 million (FY2025: US$17.3 million, restated)
IFRS basic and diluted loss per share from continuing operations was US$(2.59) (FY2025: US$(2.60))
Adjusted EBITDA from continuing operations (non-IFRS) of US$(24.4) million (FY2025: US$(11.1) million, restated), or US$(11.3) million (FY2025: US$(9.2) million) before non-cash share-based payment expense of US$13.1 million
Post balance date, both the Data Center business unit and the Electric Vehicle business unit (Tembo) have respectively booked revenues in excess of FY2026 totals with both targeting EBITDA profitability
LONDON, UK, Nov. 03, 2026 (GLOBE NEWSWIRE) — VivoPower PLC (Nasdaq: VIVO) (“VivoPower” or the “Company”), a leading B Corp-certified global developer and owner of powered land and data center infrastructure for AI compute applications, today announced results for the fiscal year ended 30 June 2026 (FY2026).
Its Annual Report on Form 20-F was filed with the SEC on 2 November 2026, and the FY2026 results presentation is available on the Company’s website under investor relations.
Results Call
VivoPower will host a results call and webcast for investors and analysts on Tuesday, 10 November 2026 at 8:00 a.m. ET / 1:00 p.m. GMT / 2:00 p.m. CET / 9:00 p.m. SGT. Participants can join the call using the link on the investor relations page of the Company’s website.
Management will review the FY2026 results presentation and discuss the outlook for the group.
Group Level Overview
Profit and Loss: FY2026 revenues of US$2.6 million, reflecting part-period consolidation of Mo i Rana data center related revenues (from hosting of bitcoin mining). Consolidated group IFRS losses include US$13.1 million of non-cash share-based payment expense and US$14.8 million of non-cash fair-value losses on derivatives, warrants and other investments.
Balance Sheet: net assets increased to US$37.0 million (30 June 2025: US$17.2 million, restated), mainly from share issuances.
Interest-bearing debt: At 30 June 2026, loans and borrowings were US$28.8 million and lease liabilities (under IFRS standards) were US$10.3 million (relating to Mo i Rana). The US$28.8 million was principal owed to AWN, a related party. After year end it was settled with US$12.3 million in cash and US$16.5 million exchanged for convertible preference shares. Accrued interest of approximately US$16 million remains outstanding.
Data Center Segment
Financial results: revenues for the Data Center segment were US$2.5 million whilst operating profit was US$0.04 million for the 50 days to 30 June 2026. These result from existing hosting of bitcoin mining activities, not AI leases. This short-period result is not indicative of full-year performance and reflects one-off post-acquisition costs and some downtime for site works and maintenance undertaken to optimize for future performance as well as reduced bitcoin prices during this period. Post balance date, improved bitcoin prices and better-than-expected demand response revenues have translated into year-to-date results materially in excess of the FY2026 full-year results.
AI tenant selection: the Company launched a competitive process to select one or more AI compute tenants and announced a shortlist on 21 May 2026. The Company has decided not to pursue a lease with the tenant announced as preferred on 29 June 2026, given better offers presented to it in a rising rent market for powered land in the Nordics. It is now working to finalize definitive terms with another prospective AI tenant and concurrently working on financing options (refer below).
Conversion financing: alongside the tenant process, the Company is progressing discussions with prospective financiers to fund the first 40MW phase. Based on the Company’s current internal plans, the estimated capital expenditure for this phase is approximately US$411 million (a preliminary management estimate that may change materially). The Company expects to fund the conversion largely through project-finance debt and is also evaluating potential project-level co-development investment partnerships. In such an arrangement, VivoPower would contribute the operational powered land site whilst the co-development partner would provide the equity finance. In evaluating such partnerships, the Company would seek to retain a majority equity interest. In this regard, it is targeting project-level funding of approximately 70-75% debt and 25-30% equity. If the Company secures a suitable co-development partner for the equity and project finance for the debt, this could reduce the amount of its own funds required for the project. However, this is not assured, and the Company may require additional financing. In addition, tenants may provide prepayments or deposits, if agreed, which could help to fund the project capital expenditure.
Electric Vehicles Segment (Tembo)
FY2026 results: revenues for the Electric Vehicles segment were US$0.09 million (FY2025: US$0.05 million), reflecting conversion kit and vehicle sales by Tembo. This segment generated an operating loss of US$3.01 million, reflecting continued investment in product homologation and go-to-market programs. Post balance date, Tembo has booked revenues and received purchase orders in excess of the FY2026 result, with sharply higher diesel prices in its key markets fueling demand, and is targeting EBITDA profitability in FY2027.
Strategic status: on 2 July 2026, the Board resolved that the development and scale-up of the Company’s AI data center business is the principal strategic priority of the Group, and that its Tembo electric vehicle business and its Caret business are non-core businesses to be separated in a manner consistent with that priority. In respect of Tembo, previously contemplated special dividend arrangements have been discontinued and superseded by the proposed business combination with Cactus Acquisition Corp. 1 Limited (“Cactus”) described below, on completion of which the Company would retain a minority shareholding in the combined company.
Proposed Tembo business combination: on 29 August 2024, the Company entered into a business combination agreement with Cactus and Tembo, under which Tembo would become a subsidiary of a new holding company, Tembo Group B.V., which is proposed to be converted into a Dutch public limited liability company named Tembo Group N.V. and which would apply to list its shares on Nasdaq and in which the Company would retain a minority shareholding. A draft registration statement on Form F-4 for the transaction has been confidentially submitted to the SEC. Completion is subject to, among other things, the registration statement being declared effective, approval by Cactus’s shareholders, approval of the combined company’s initial listing application by Nasdaq under its current initial listing requirements, and other closing conditions. On 27 October 2026, Cactus’s shareholders approved an extension of the date by which Cactus must complete a business combination to 2 November 2027. Tembo’s results will continue to be consolidated in the Company’s results while the Company retains control of Tembo.
Non-IFRS Measures (from Continuing Operations)
Adjusted EBITDA from continuing operations is a non-IFRS performance measure calculated by adjusting IFRS loss from continuing operations for income tax, finance expense less finance income, the fair-value loss on financial instruments, depreciation and amortization, impairment losses, and the restructuring-related and other adjustments itemized in the reconciliation. This measure retains non-cash share-based payment expense.
Adjusted EBITDA from continuing operations before non-cash share-based payments is a further non-IFRS performance measure calculated by adding back to Adjusted EBITDA from continuing operations the expense recognized in continuing operations for professional fees settled in shares or other equity instruments and employee equity incentive awards. It excludes that expense, rather than treating it as having no economic cost.
Management believes that presenting both measures alongside IFRS loss helps investors distinguish changes in other operating costs from changes in equity-settled professional-fee and employee-award expense across periods. Neither measure should be considered in isolation or as a substitute for IFRS loss or other IFRS financial measures.
The reconciliation includes both the costs and the gains within the restructuring-related adjustments. Adjusted EBITDA from continuing operations includes non-cash share-based payment expense of US$13.1 million in FY2026 and US$1.9 million in FY2025. These costs can recur, and settling them in shares or other equity instruments can dilute shareholders. In this reconciliation, those amounts are added back only for the separately labelled measure before non-cash share-based payments. Neither non-IFRS measure is a measure of cash flow or liquidity, and similarly titled measures used by other companies may be calculated differently.
Source: VivoPower Annual Report on Form 20-F for FY2026, filed with the SEC on 2 November 2026 (Item 5 and Note 8).
Additional Information
Full details are in the Form 20-F, available at www.sec.gov and on the investor relations page of the Company’s website. Shareholders may request a free hard copy of the Annual Report by sending an email to [email protected]. Please read the results presentation with its disclaimer.
About VivoPower
Originally founded in 2014 and listed on Nasdaq since 2016, VivoPower is an award-winning B Corporation with data center and powered land infrastructure across Norway, Finland, and the United Arab Emirates. The Company’s mission is to be the independent, trusted partner for sovereign nations that develop and operate sustainable data center infrastructure, ensuring sovereign control over power, data, and national intelligence. In doing so, VivoPower helps sovereign nations bridge the gap between their energy assets and their AI ambitions by providing the Power-to-X infrastructure necessary to build and control their own domestic intelligence hubs.
Forward-Looking Statements
This announcement contains forward-looking statements, including statements about the Company’s strategy, future financial and operating performance, the proposed AI conversion and expansion of Mo i Rana, the AI-tenant selection and contracting process, estimated capital expenditure, construction and commissioning, project financing and funding mix, potential co-development arrangements, prospective tenant prepayments, future ownership interests, additional capital requirements and the expected effects of market conditions. Words such as “anticipate”, “believe”, “could”, “estimate”, “expect”, “intend”, “may”, “plan”, “potential”, “target” and “would” may identify forward-looking statements, but their absence does not mean a statement is not forward-looking.
These statements reflect management’s current expectations, estimates and assumptions, not guarantees of performance or completed transactions. Estimates of conversion cost, financing proportions, ownership, timing and tenant contributions may change materially as design, due diligence, negotiations, approvals and financing progress; a target or conditional scenario is not an approved or fully financed outcome, and the separate prerequisites for each scenario may not be achieved together.
The Company intends to rely on the forward-looking-statement protections of Section 27A of the Securities Act of 1933 and Section 21E of the Securities Exchange Act of 1934 only to the extent legally available. These protections do not apply to every statement, speaker or transaction, do not turn historical or current trading information into forward-looking information, and do not displace applicable disclosure or anti-fraud obligations.
Forward-looking statements speak only as of the date made, unless another date is expressly stated. Readers should not place undue reliance on them; except as required by applicable law, the Company undertakes no obligation to update them, and nothing in this statement limits any applicable duty to correct materially inaccurate or misleading information or to make a required disclosure.
Risk factors
Actual results could differ materially from those expressed or implied because of the following risks, among others. These risks should be read with the Company’s Annual Report on Form 20-F for FY2026, including Items 3.D, 5 and 15 and the financial-statement notes, and any subsequent SEC disclosures; this summary is not exhaustive.
AI tenant and conversion execution: The Company has not entered into a definitive AI-compute lease for Mo i Rana; discussions with a prospective tenant are not a lease, and there is no assurance that an agreement will be concluded on acceptable terms or at all. Tenant requirements, credit support, design, engineering, equipment supply, permits, power and grid arrangements, construction, commissioning and operating requirements may change, increase cost or delay or prevent the proposed conversion; existing energised capacity does not establish completed AI-ready capacity, contracted AI revenue or approval for additional capacity.
Conversion financing and ownership: Financing for the proposed AI conversion is not assured, and the Form 20-F states that the Company expects to fund the conversion largely through project-finance debt and may also require additional equity financing. A targeted debt ratio does not establish lender willingness, debt capacity, acceptable covenants or availability of funds; a prospective co-development partner’s contribution or a prospective tenant’s prepayment is not available cash unless agreed, funded and usable for the relevant expenditure. The Company may have to contribute additional cash, provide security or guarantees, issue further securities, accept less favourable economics or control rights, reduce its ownership interest, or defer or abandon the project; neither retention of majority ownership nor avoidance of further Company-level fundraising or dilution is assured.
Existing hosting, power and demand-response activities: Mo i Rana’s reported FY2026 revenue arose from existing bitcoin-mining hosting rather than an AI lease. Bitcoin prices, mining economics and customer credit or activity, Norwegian power prices, tariffs, hedging, grid availability and restrictions, regulatory changes, equipment downtime and maintenance, and the eligibility, availability, pricing and dispatch of demand-response services can affect revenue, margins and cash receipts; any favourable price movements or demand-response receipts may not recur, and prequalification does not guarantee dispatch or revenue.
Liquidity and subscription collections: At 30 June 2026 the Group had net current liabilities of US$11.95 million, and the Form 20-F reports an unsecured outstanding Ceres-led Regulation S subscription receivable of US$53.3 million at that date. It also reports that US$16.0 million of PIPE 2 proceeds remained outstanding at the date of the report, subject to completion of KYC approvals; neither a subscription commitment nor completion of an administrative process guarantees collection or its timing. Liquidity depends on actual cash receipts and payments, creditor arrangements and meeting obligations as they fall due, including acquisition instalments and other liabilities; failure or delay in collecting subscriptions or obtaining other necessary funds could adversely affect operations and the ability to continue as a going concern.
AWN, related parties and capital structure: The post-year-end settlement of US$28.8 million of AWN shareholder-loan principal comprised US$12.3 million paid in cash and US$16.5 million exchanged for convertible preference shares, rather than an equivalent cash repayment of all debt; the Form 20-F reports approximately US$16 million of accrued AWN interest still outstanding after those transactions. AWN is a related party, and the exchange did not eliminate the rights and economic claims represented by the preference shares or the remaining interest; settlement, conversion, dividends, warrants, reset terms, equity-settled fees and further fundraising can dilute ordinary shareholders, create competing economic priorities and materially affect reported results.
Operating, regulatory and geopolitical exposure: Power-market and grid regulation, environmental and planning requirements, counterparties, physical and cybersecurity incidents, supply-chain constraints, exchange rates and interest rates may adversely affect the Company’s operations and projects. Arctic Norge Data I AS is subject to the pre-acquisition Norwegian VAT and corporate-income-tax audit disclosed in the Form 20-F; resulting liabilities may not be recoverable from the seller, and disputes over recovery or withholding deferred acquisition payments could affect cash requirements. The Middle East conflict and other geopolitical developments may disrupt funding transfers, customer or investor payments, energy markets, logistics and business conditions; effects may be adverse.
Financial reporting and controls: The Company has restated FY2025 comparative financial information and reported that its disclosure controls and procedures and internal control over financial reporting were ineffective at 30 June 2026 because of material weaknesses, which remained outstanding at that date. Remediation may take time and may not be effective; errors, complex-transaction accounting, estimates, valuations or further adjustments could affect reported results, timeliness, access to capital and investor confidence.
Listing, status and trading: Maintaining Nasdaq listing and foreign-private-issuer status depends on continuing satisfaction of applicable requirements; loss of either status, further securities issuance, low liquidity or share-price volatility could adversely affect shareholders and financing access, and loss of foreign-private-issuer status could increase reporting and compliance obligations and costs. This risk statement is not a statement that a current Nasdaq deficiency exists.
Non-IFRS financial measures
Adjusted EBITDA from continuing operations and Adjusted EBITDA from continuing operations before non-cash share-based payments, where presented, are non-IFRS performance measures, not substitutes for IFRS loss, and not measures of cash generation, cash available for investment or debt service, or liquidity. Their definitions and reconciliations must be read with the IFRS results; similarly titled measures used by other companies may differ.
Ordinary Adjusted EBITDA from continuing operations retains non-cash share-based payment expense; the separately labelled before-share-based-payments measure adds back that expense. Excluded share-settled professional fees and equity awards have an economic cost, can recur, and can dilute shareholders; “non-cash” does not mean cost-free, exceptional or irrelevant to operating performance, and the timing or form of settlement does not itself establish the appropriate accounting or adjustment.
The measures should be considered only alongside the most directly comparable IFRS measures and the definitions, individual adjustments, explanations and reconciliations provided in this announcement. Presentation of an adjustment does not establish that its effects will not recur or that it represents cash saved; neither measure is an alternative statement of IFRS profitability.
Restatement of FY2025 comparatives
FY2025 comparative financial information is presented on the restated basis where indicated and should be read with Note 35 to the FY2026 Form 20-F, which describes the nature and financial effects of the restatement. Comparisons with previously published, unadjusted FY2025 amounts may therefore be misleading; the restatement does not eliminate the financial-control risks described above or provide assurance that future corrections will not be required.
Post-period and unaudited information
Post-30 June 2026 operating and trading information, where included, is unaudited unless expressly stated otherwise; the audit of the FY2026 financial statements is not an audit opinion on subsequent trading performance or a forecast. The applicable period, cut-off date, scope, accounting basis and comparison must be read with each such statement; periods of different lengths and a partial acquisition period are not automatically comparable.
Bookings, purchase orders, inquiries and indicative proposals are not necessarily IFRS revenue or collectible cash. Interim performance must not be annualised or treated as assurance of future profitability, and historical year-end cash does not represent cash available at the announcement date after subsequent receipts, payments and commitments.
Third-party and market information
Market, industry and third-party information is subject to the methodologies, assumptions, dates and limitations of the relevant provider. Market-wide trends, indicative rents, tenant interest, recent prices or general financing practices do not establish the terms available to the Company, the creditworthiness of a specific counterparty, a signed contract or an entitlement to tenant deposits.
Attribution to a third party does not relieve the Company of responsibility for its own statements or provide an independent audit of project assumptions, interim performance or forecasts. Nothing in this announcement should be read as an endorsement of those matters by the Company’s auditors.
No offer or solicitation
This announcement is for information and is not intended to constitute an offer to sell or a solicitation of an offer to buy securities, or an offering document. Any securities offering or sale must comply with applicable registration requirements or an available exemption and be made through the applicable offering documents; no offer or sale may be made in a jurisdiction where it would be unlawful.
Not investment advice / no reliance
This announcement does not provide personalised investment, legal or tax advice or an assessment of the suitability of any investment for a particular person. Investors should read the complete relevant SEC disclosures and offering documents, assess their own circumstances and, where appropriate, obtain independent professional advice; they should not rely on forward-looking statements or selected financial measures as a complete investment analysis.
Nothing in this announcement excludes or limits any liability or obligation under applicable securities laws or any non-waivable investor right. In particular, this section does not disclaim responsibility for accurate, non-misleading disclosure or ask investors to waive reliance on statements of historical or current fact.
Website and hyperlinks
Website addresses and hyperlinks are provided for convenience. Website contents are not incorporated into this announcement solely because an address or hyperlink is included; this statement does not alter any express incorporation by reference in an SEC filing, any applicable legal treatment of linked information or the Company’s disclosure obligations.
Investors should consult the dated announcement and the relevant SEC filings rather than assume that subsequent website changes update this announcement. The inclusion of a hyperlink does not itself verify the information or replace any required public disclosure.
Acquisition Adds Established Enterprise Client Relationships, Experienced U.S. Sales Leadership, and Back-Office Synergies
OLD GREENWICH, Conn., Nov. 03, 2026 (GLOBE NEWSWIRE) — Star Equity Holdings, Inc. (Nasdaq: STRR and STRRP) (“Star” or the “Company”), a diversified holding company, announced today its Hudson Talent Solutions business (“HTS”) has acquired Cornerstone RPO LLC (“Cornerstone”), a recruitment process outsourcing (“RPO”) provider based in Richmond, Virginia. The transaction closed on November 2, 2026. Cornerstone will operate as part of HTS within Star’s Business Services division.
Founded in 2005 by Rodney Ashby and David Kenworthy, Cornerstone delivers flexible, people-focused recruiting solutions across the United States, Canada, and Mexico. It serves more than 30 active clients and has worked with more than 200 organizations, from startups to Fortune 100 companies, across financial services, manufacturing, technology, hospitality, and healthcare.
This acquisition advances HTS’s strategy as a global total talent solutions provider, with capabilities spanning RPO, talent advisory, workforce solutions, executive search, employer branding, sourcing, and recruitment technology across the Americas, EMEA, and Asia Pacific. The combination gives HTS’s clients access to Cornerstone’s expertise and experienced team, strengthening HTS’s ability to support complex and changing hiring needs across North America.
Mr. Ashby, Managing Principal of Cornerstone, an expert in recruiting strategy, sales process design, and project execution, has joined HTS as a North American Sales Leader focused on building new enterprise accounts and integrating Cornerstone’s clients into HTS’s operations.
Jeff Eberwein, CEO of Star, said, “Cornerstone is a price-disciplined, value-enhancing bolt-on acquisition for HTS and is another clear example of how Star’s acquisition strategy can accelerate growth. With Cornerstone, we are adding established client relationships, an experienced U.S. team, and a proven sales leader. Additionally, bringing Cornerstone onto HTS’s existing back-office platform will drive improved cost efficiency. HTS’s larger U.S. footprint is expected to add U.S. taxable income, helping Star make more efficient use of its sizeable NOL.”
Jake Zabkowicz, Global CEO of HTS, added, “The addition of Cornerstone to HTS immediately bolsters our presence in the U.S. RPO market, the world’s largest, and brings a roster of blue-chip clients, marking an important step in our growth strategy. Cornerstone has built a strong business by staying close to its clients and delivering flexible solutions that work effectively. We see a clear opportunity to grow Cornerstone’s existing client engagements into larger, longer-term programs through HTS’s enterprise RPO, talent advisory, and TalentFusion™ capabilities, without losing the responsiveness and human connection that define strong partnerships. I have tremendous confidence in Rodney and David’s leadership, and I’m thrilled to welcome them and the Cornerstone team to HTS.”
About Star Equity Holdings, Inc. Star Equity Holdings, Inc. is a diversified holding company that seeks to build long-term shareholder value by acquiring, managing, and growing businesses with strong fundamentals and market opportunities. Its current structure comprises four divisions: Building Solutions, Business Services, Energy Services, and Investments. For more information, visit www.starequity.com.
Building Solutions The Building Solutions division operates in three specialties: (i) modular building manufacturing; (ii) structural wall panel and wood foundation manufacturing, including building supply distribution operations; and (iii) glue-laminated timber (glulam) column, beam, and truss manufacturing.
Business Services The Business Services division provides flexible and scalable recruitment solutions to a global clientele, serving organizations at all levels, from entry-level positions to the C-suite. The division focuses on mid-market and enterprise organizations worldwide, partnering consultatively with talent acquisition, HR, and procurement leaders to build diverse, high-impact teams and drive business success.
Energy Services The Energy Services division engages in the rental, sale, and repair of downhole tools used in the oil and gas, geothermal, mining, and water-well industries.
Investments The Investments division manages and finances the Company’s real estate assets as well as its investment positions in private and public companies.
Forward-Looking Statements This press release contains statements that the Company believes to be “forward-looking statements” within the meaning of Section 27A of the Securities Act of 1933, as amended, Section 21E of the Securities Exchange Act of 1934, as amended, and the Private Securities Litigation Reform Act of 1995. All statements other than statements of historical fact included in this press release, including statements regarding the Company’s future financial condition, results of operations, business operations and business prospects, are forward-looking statements. Words such as “anticipate,” “estimate,” “expect,” “project,” “intend,” “plan,” “predict,” “believe,” and similar words, expressions, and variations of these words and expressions are intended to identify forward-looking statements. All forward-looking statements are subject to important factors, risks, uncertainties, and assumptions, including industry and economic conditions that could cause actual results to differ materially from those described in the forward-looking statements. Such factors, risks, uncertainties, and assumptions include, but are not limited to, (1) global economic fluctuations, (2) changes in the cost and availability of commodities, materials, and equipment, (3) risks related to providing uninterrupted service to clients, (4) the ability of clients to terminate their relationship with the Company at any time, (5) risks associated with real estate ownership, (6) the Company’s ability to successfully achieve its strategic initiatives, (7) risks related to fluctuations in the Company’s operating results from quarter to quarter, (8) risks related to potential acquisitions or dispositions of businesses by the Company, (9) our profitability and growth being tied to the success of our operating businesses, (10) risks associated with our financial investments in other businesses, (11) our ability to improve existing products and services and develop, introduce, and market new products and services successfully, (12) the loss of or material reduction in our business with any of the Company’s largest customers, (13) competition in the Company’s markets, (14) risks related to potential decreases in demand for products, (15) our ability to maintain costs at an acceptable level, (16) the negative cash flows and operating losses that may recur in the future, (17) risks related to international operations, including foreign currency fluctuations, political events, trade wars, natural disasters or health crises, including the Russia-Ukraine war, and potential conflict in the Middle East, (18) risks relating to how future credit facilities may affect or restrict our operating flexibility, (19) our ability to generate or borrow sufficient cash to make payments on our indebtedness, (20) risks related to indebtedness, (21) risks associated with the Company’s investment strategy, (22) the Company’s dependence on key management personnel, (23) the Company’s ability to attract and retain highly skilled professionals, management, and advisors, (24) the Company’s ability to collect accounts receivable, (25) the Company’s exposure to legal proceedings, investigations and disputes, and limits on related insurance coverage, (26) the Company’s ability to utilize net operating loss carryforwards, (27) the potential for goodwill impairment, (28) volatility of the Company’s stock price, (29) risks related to our historically low trading volume, (30) risks related to securities or industry analysts, (31) the Company’s ability to declare dividends, (32) risks associated with failure to pay dividends on our Series A Preferred Stock, (33) our history of annual net losses, (34) risks related to compliance with federal and state laws, regulations, and other rules, (35) our exposure to employment-related claims, legal liability, and costs from clients, employees, and regulatory authorities, (36) risks related to the imposition of licensing or tax requirements or new regulations, (37) the effect of anti-takeover provisions in our organizational documents, (38) the effect of the protective amendment contained in our Restated Certificate of Incorporation, (39) the impact of our stockholder rights plan, or “poison pill,” on stockholder decision making, (40) risks related to our scaled disclosure requirements as a smaller reporting company, (41) the heavy reliance on information systems and the impact of potentially losing or failing to develop technology, (42) the adverse impacts of cybersecurity threats and attacks, (43) risks related to the use of new and evolving technologies, and (44) those risks set forth in “Risk Factors” in the Company’s Annual Report on Form 10-K for the year ended December 31, 2025. The foregoing list should not be construed to be exhaustive. Actual results could differ materially from the forward-looking statements contained in this press release. In view of these uncertainties, you should not place undue reliance on any forward-looking statements, which are based on our current expectations. These forward-looking statements speak only as of the date of this press release. The Company assumes no obligation, and expressly disclaims any obligation, to update any forward-looking statements, whether as a result of new information, future events or otherwise.
For more information contact: The Equity Group Lena Cati Senior Vice President 212-836-9611 [email protected]
Two new products extend T3 Defense subsidiary Tiltan’s physics-based simulation portfolio; debut set for the world’s largest modeling, simulation and training event, in Orlando, Florida, November 30 – December 3, 2026
NEW YORK and NETANYA, Israel, Nov. 03, 2026 (GLOBE NEWSWIRE) — T3 Defense Inc. (Nasdaq: DFNS) (“T3 Defense” or the “Company”), a defense technology holding company, today announced that its subsidiary, Tiltan Software Engineering Ltd. (“Tiltan”), will launch two new simulation products, TOPS-NX Studio and SILOS, at the I/ITSEC 2026, the Interservice/Industry Training and Simulation Conference, taking place November 30 – December 3, 2026 at the Orange County Convention Center in Orlando, Florida. The products extend Tiltan’s physics-based simulation portfolio and strengthen its position in the training, simulation, and sensor-development market.
I/ITSEC, organized by the National Training and Simulation Association (NTSA), an affiliate of the National Defense Industrial Association (NDIA), is the world’s largest event dedicated to modeling, simulation and training (MS&T). It brings together the U.S. Department of Defense, the U.S. armed services, allied militaries, defense prime contractors and training commands.
Two New Products Launching at I/ITSEC 2026
Together, TOPS-NX Studio and SILOS are designed to connect scenario creation with simulation deployment: TOPS-NX Studio enables users to build and configure synthetic environments, while SILOS enables those environments to run across multiple simulation instances.
TOPS-NX Studio – Your One-Stop Shop for Physics-Based Simulation and Synthetic Data TOPS-NX Studio is a physics-based simulation platform for sensor engineering, AI training and validation, and synthetic data generation across space, air, land and maritime domains. Its no-code environment enables teams to build geo-located scenarios, accurately model sensors across visible, thermal infrared, SAR and LiDAR spectrums, and simulate infrared using a validated library of more than 250 materials. Optional plug-ins support batch simulations across varying conditions, managed recordings and automatically annotated datasets, reducing the time and cost of real-world data collection.
SILOS – The System-in-the-Loop Battle Lab SILOS integrates real and simulated sensors, platforms, AI and autonomy into a single battle lab to evaluate performance against repeatable, physics-based mission scenarios. Live simulations are scored against ground truth, providing insight into overall system performance. Defense teams can compare sensors, tactics and operating conditions before costly field trials, enabling more informed decisions and better field readiness.
“Tiltan is executing the playbook we apply across T3 Defense: take capabilities already validated by demanding customers and develop new products that expand the applications and customers those capabilities can serve,” said Menny Shalom, Chairman and Chief Executive Officer of T3 Defense. “TOPS-NX Studio and SILOS are designed to give existing customers additional capabilities while creating new entry points with U.S. and allied defense organizations and their integration partners. This launch supports our strategy to broaden the geographic reach and customer base of our portfolio companies.”
Expanding Toward the U.S. and Allied Training Market
Tiltan’s participation at I/ITSEC is part of a deliberate effort to broaden its commercial footprint from an Israel-centered customer base toward U.S. and allied defense simulation & training markets. The United States is the world’s largest buyer of military simulation and training systems, and I/ITSEC concentrates the requirement owners, prime contractors and integrators that serve that demand in a single venue.
T3 Defense believes the same simulation, synthetic data and geospatial capabilities Tiltan has delivered to the Israeli defense establishment and Tier-1 defense contractors, including for unmanned aerial systems (UAS) training and next-generation electro-optical/infrared (EO/IR) sensor development, are directly transferable to U.S. and allied programs.
“I/ITSEC is where the training and simulation community sets its direction for the coming year, and it is the right place to introduce TOPS-NX Studio and SILOS,” said Ehud Shafir, Chief Executive Officer of Tiltan. “Our customers have told us they want to build and scale their own synthetic environments on our engine. TOPS-NX Studio puts that capability in their hands, and SILOS lets them run it at the scale of a real exercise. Together they turn a validated engine into a platform our customers can grow with.”
Meeting Requests
Defense organizations, integrators and partners interested in meeting Tiltan at I/ITSEC 2026 may contact [email protected] or the T3 Defense investor relations contacts listed below.
About Tiltan Software Engineering Ltd.
Tiltan Software Engineering Ltd., a wholly owned subsidiary of T3 Defense, is a leading solution provider specializing in Simulation, 3D Engines, Generative AI Training, Geo-Systems, 3D Content, and Operations Center Systems and Tools. With over 30 years of experience, Tiltan’s simulation products provide a comprehensive one-stop solution for training, development, and hardware-in-the-loop systems, powered by a proprietary 3D engine and Generative AI. Tiltan’s geo-system products support space, aerial, manned, and unmanned vehicles, addressing registration, localization, and navigation challenges, as well as geo-mapping systems. Its in-house content production delivers high-fidelity, geo-specific visual databases, 3D models, and mapping data for VIS, IR, LiDAR, and SAR applications. For more information, visit www.tiltan-se.com.
About T3 Defense Inc.
T3 Defense Inc. (Nasdaq: DFNS) is a defense company that acquires and operates mission-critical defense businesses involved in national security programs. It focuses on manufacturers with strong customer relationships and solid order backlogs, often capacity- and resource-constrained, in specialized areas such as drones and autonomous vehicles, counter-drone systems, advanced manufacturing, tactical robotics, and AI software and system integration. Through disciplined acquisitions, centralized capital and strategy, and decentralized day-to-day operations, T3 Defense aims to strengthen essential defense capabilities and build long-term value. For more information, visit www.t3dfns.com.
Forward-Looking Statements
This press release contains forward-looking statements within the meaning of Section 27A of the Securities Act of 1933, as amended, and Section 21E of the Securities Exchange Act of 1934, as amended. All statements other than statements of historical fact are forward-looking statements, including, without limitation, statements regarding Tiltan’s participation in I/ITSEC 2026; the planned launch, anticipated capabilities, features, availability and commercial release timing of TOPS-NX Studio and SILOS; the anticipated benefits of that participation and those launches; Tiltan’s expansion into the United States and allied defense training and simulation markets; the transferability of Tiltan’s capabilities to those markets; expected demand for simulation, synthetic data and geospatial software; the potential for orders, qualification, partnerships, licensing or recurring revenue; and the Company’s growth strategy. These statements are based on management’s current expectations and assumptions and involve known and unknown risks and uncertainties that could cause actual results to differ materially from those expressed or implied, including risks related to the absence of any orders, contracts or partnership agreements arising from the conference or the product launches; the risk that new products are delayed, modified or do not achieve market acceptance; the length and uncertainty of United States and international defense qualification, evaluation and procurement cycles; export control and licensing requirements applicable to Israeli defense technology, including under U.S. and Israeli regulations; competition from established U.S. and allied simulation and training providers; the Company’s ability to convert pipeline and proposals into binding orders or revenue; customer concentration; defense program funding, procurement cycles and timing; the Company’s liquidity and capital resources; the Company’s ability to maintain compliance with Nasdaq listing requirements; integration of acquired businesses; competitive and geopolitical conditions, including conditions in Israel; and other risks described in the Company’s filings with the Securities and Exchange Commission, including its Annual Report on Form 10-K, Quarterly Reports on Form 10-Q, and Current Reports on Form 8-K. Forward-looking statements speak only as of the date of this release, and the Company undertakes no obligation to update or revise them, except as required by law.