CHICAGO, June 29, 2026 (GLOBE NEWSWIRE) — FreightCar America, Inc. (NASDAQ: RAIL) announced today that it has been added to the Russell 2000® and Russell 3000® indexes, effective June 29, 2026.
“We are pleased to be recognized through the inclusion in the Russell indexes, which we view as a reflection of FreightCar America’s growth trajectory and the progress we have made strengthening our business,” said Nick Randall, President and Chief Executive Officer. “Membership in these widely followed benchmarks broadens our visibility within the institutional investment community and reinforces our commitment to creating long-term value for our shareholders.”
Russell indexes are widely used by investment managers and institutional investors for index funds and as benchmarks for active investment strategies. Approximately $12.2 trillion in investor assets are benchmarked to or invested in products based on the Russell US Indexes, according to FTSE Russell, a leading global index provider.
The June reconstitution of the Russell US indexes captures up to the 4,000 largest US stocks as of April 30, ranking them by total market capitalization. Membership in the Russell 3000® Index, which remains in place for half a year beginning 2026, means automatic inclusion in the large-cap Russell 1000 Index or small-cap Russell 2000 Index as well as the appropriate growth and value style indexes. FTSE Russell determines membership for its Russell indexes primarily by objective, market-capitalization rankings and style attributes.
For more information on the Russell 3000® Index and the Russell indexes reconstitution, go to the “Russell Reconstitution” section on the FTSE Russell website.
About FreightCar America
FreightCar America, headquartered in Chicago, Illinois, is a leading designer, producer and supplier of railroad freight cars, railcar parts and components. We also specialize in railcar repairs, complete railcar rebody services and railcar conversions that repurpose idled rail assets back into revenue service. Since 1901, our customers have trusted us to build quality railcars that are critical to economic growth and instrumental to the North American supply chain. To learn more about FreightCar America, visit www.freightcaramerica.com.
CHARLOTTE, N.C., June 29, 2026 (GLOBE NEWSWIRE) — NN, Inc. (“NN” or the “Company”) (NASDAQ: NNBR), a global diversified industrial company that engineers and manufactures high-precision components and assemblies with six sigma quality, today provided an update on its rapidly growing Data Center business. NN’s combined Data Center and Electric Grid business is already its 2nd largest business, with a further goal to grow the business into the Company’s largest business by sales. The Data Center & Electric Grid end markets are top targeted growth markets for the Company along with Medical products and Defense and Electronics products.
NN has secured a significant amount of additional 2026 immediate-supply awards for liquid cooling products that go into NVIDIA AI data center racks. The new awards in this announcement are additive to prior communicated awards and greatly increase the size of NN’s liquid cooling product portfolio for AI data center racks.
NN is on its way to having 52 dedicated machines to make liquid cooled products for its data center business. 50 machines will be dedicated production lines and an additional 2 machines will be dedicated to making samples for new business. NN has already pre-sold 100% of the production capacity. NN is continuing to prospect globally and is using its global business development team and global machining footprint to prospect for additional business in this fast-growing area. In 2026, NN has attended Data Center tradeshows in the United States, Europe, and China.
Harold Bevis, President and Chief Executive Officer of NN, Inc. commented, “The liquid-cooled AI data center market is one of our targeted end markets for growth. We announced the successful launch of a new product line in Q1 2026. It is a custom-designed, stainless-steel product line for the liquid-cooled data center market. Since then, we have secured multiple AI data center awards, have invested in an initial complement of 17 next-generation, high-speed, high-precision CNC machines at our Wuxi, China plant, and began production. We have a big set of data center products already but we are just beginning. We make products that go into both the electrical system and cooling system for Data Centers and produce these products in multiple plant locations.
Today, we are pleased to announce that we have tripled the size of the liquid cooling product line that just launched in Q1 2026. Specifically, we have secured another set of multi-year, multi-product awards for stainless-steel cooling products for the NVIDIA supply chain. NN is now underway with procuring an additional 30 new machine centers on top of the 17 new CNC machine centers we previously announced. Additionally, we have successfully repurposed and retooled 5 automotive CNC production centers to become dedicated data center production. We have a strategic goal to rotate out of commodity auto products and this accelerates the achievement of that objective.”
Bevis continued, “We are building a meaningful position in the global supply chain for liquid cooled AI systems. The Wuxi plant had approximately 200 CNC machine centers before successfully entering the data center business. These additional 47 machine centers bring the total in that plant to approximately 250 CNC machine centers when this expansion is complete. We have large aspirations with our global footprint, and the industry needs NN to scale up and supply more. The AI data center liquid cooling industry is scaling very rapidly, and we are participating in the global data center buildout. This is a natural product fit as we are experienced veterans in pressurized fluid management, stainless steel part production, exceptional repetitive quality levels at high volumes, electropolishing, abrasive flow machining, debris-free and leak-free products, and fast innovation.
We have a dedicated company effort to grow Data Center products, and we are happy to have secured our next set of new awards. This expansion and ramp up is underway now during Q2 2026 and will be additive to our 2026 sales. Based on equipment lead times, the 47th new machine will be installed in November 2026. We are underway prospecting for additional awards and developing new products. As mentioned, the 47 new machines in this announcement will go into NN’s Wuxi, China plant and it will be supplying parts into NVIDIA’s Asia supply chain in China, Taiwan, and Vietnam. NN’s Wuxi China plant is a global low-cost plant that is well known in the metal part making industry. It is in an ideal location for supplying the metal parts that go into the global supply chain for AI data center racks. We believe these data center racks which are being produced in Asia are coming back to the US and being installed in data centers being built in the United States AI market.”
Bevis concluded, “As next generation supply chain decisions are being made in the data center industry, NN intends to use its global footprint of machining plants to participate further. This is a multi-billion market that is scaling up right now, and these computing racks are the hardware behind the expanding use of AI and cloud computing. These new awards fit within NN’s previously issued new wins guidance for achieving $80 to $90 million of accretive new business during 2026. We will combine this new information along with other information and adjust 2026 and 2027 sales and EBITDA guidance, if needed, during NN’s next business and guidance update when we release Q2 earnings in early August. We look forward to discussing this big advancement during that time.”
About NN’s Fluid Management Products
NN is a leader in precision fluid management products for over 40 years. The Company makes precision metal fluid management components including valve body, socket body, valve seat, sealing seat, needle, plunger, plug base, socket base, guides, and threaded connector parts. Given its long-term expertise, NN can make these products in a variety of manners across high-mix, medium-speed single spindle machines as well as high-volume, high-speed production with multi-spindle machines and rotary transfer systems. It makes these products in-house in its plants in China, Europe, South America, and North America. NN makes these products today and has for decades under multi-year contracts for many of the top OEMs in the world. The goal is leak-free, debris-free products that never fail during the life of the equipment.
NN’s existing liquid management products precisely fit the requirements of data center applications, and the demanding performance and quality requirements of AI data center and cloud customers are a direct use of the Company’s existing capabilities. Furthermore, next generation computing designs require even higher power use and even higher heat generation, which will lead to next-generation liquid-cooled computing systems and components. The Company can already make products that are advanced beyond today’s requirements. NN has delivered six sigma quality, micron-level tolerance parts for combustion engines for decades. The Company’s decades of global experience and footprint are directly applicable to this new area.
About NN
NN, Inc., a global diversified industrial company, combines advanced engineering and production capabilities with in-depth materials science expertise to design and manufacture high-precision components and assemblies for a variety of markets on a global basis. Headquartered in Charlotte, North Carolina, NN has facilities in North America, Europe, South America, and China. For more information about the Company and its products, please visit www.nninc.com.
Forward-Looking Statements
This press release contains express and implied forward-looking statements within the meaning of the Private Securities Litigation Reform Act of 1995, including, but not limited to, statements regarding future growth of NN’s liquid-cooled AI data center business, the procurement and timing of additional machines to support the liquid-cooled AI data center business, NN’s aspirations , the size and future outlook of the data center market, NN’s competitive position in the data center market, , expected new business wins for 2026, the Company’s 2026 performance and other statements that are not historical facts.
Forward-looking statements generally will be accompanied by words such as “anticipate,” “believe,” “could,” “estimate,” “expect,” “forecast,” “guidance,” “intend,” “may,” “will,” “possible,” “potential,” “predict,” “project”, “achieve,” “growth,” “enable,” “improve,” or the negative of these terms, and similar words, phrases or expressions that convey uncertainty of future events or outcomes. Forward-looking statements involve a number of risks and uncertainties that are outside of management’s control and that may cause actual results to be materially different from such statements. Such factors include, among others, general economic conditions and economic conditions in the industrial sector; competitive influences; risks that current customers will commence or increase captive production; risks of capacity underutilization; quality issues; inflationary pressures and material changes in the cost or availability of raw materials, supply chain shortages and disruptions, the availability of labor and labor distributions along the supply chain; our dependence on certain major customers, some of whom are not parties to long-term agreements (and/or are terminable on short notice); the impact of acquisitions and divestitures, as well as expansion of end markets and product officers; our ability to hire or retain key personnel; the restrictions contained in our debt agreements; the level of our indebtedness and our ability to obtain financing at favorable rates, if at all, or to refinance existing debt as it matures; our ability to secure, maintain or enforce patents or other appropriate protections for our intellectual property; the impact on climate change on our operations; economic, social and geopolitical instability, military conflict, current fluctuation, and other risks of doing business outside of the United States; and uncertainty of government policies and actions in respect to global trade and tariffs, including the potential impacts of tariffs on the United States economy, the economy of other countries in which we conduct operations and our industry, cyber liability or potential liability for breaches of our or our service providers’ information technology systems or business operations disruptions. The foregoing factors should not be construed as exhaustive and should be read in conjunction with the sections entitled “Risk Factors” and “Management’s Discussion and Analysis of Financial Condition and Results of Operations” included in the Company’s filings made with the U.S. Securities and Exchange Commission. Any forward-looking statement speaks only as of the date of this press release, and the Company undertakes no obligation to publicly update or review any forward-looking statement, whether as a result of new information, future developments or otherwise, except as required by law. New risks and uncertainties may emerge from time to time, and it is not possible for the Company to predict their occurrence or how they will affect the Company. The Company qualifies all forward-looking statements by these cautionary statements.
ATLANTA, June 25, 2026 (GLOBE NEWSWIRE) — DLH Holdings Corp. (NASDAQ: DLHC) (“DLH” or the “Company”), a leading provider of digital transformation and cybersecurity, systems engineering and integration, and science research and development, today announced that it has been awarded a multiple-award indefinite delivery/indefinite quantity (“MAC ID/IQ”) contract to provide a full range of logistics information technology services for U.S. Navy integrated platforms and DevSecOps pipelines. The Logistics IT Integration and Support (LIIS) Capability Modernization Deployment, and Support MAC is administered by Naval Air Systems Command (“NAVAIR”).
Through task orders to be competed under this contract, DLH will have the opportunity to implement agile development processes and adaptable architecture to enable continuous systems modernization, integration, sustainment, and migration, all in the aim of accelerating speed to fleet of Navy logistics capabilities. Services may include design, development, testing and evaluation, training, service desk request fulfillment, deployment, hardware and software configuration, and other related tasks.
DLH is one of multiple prime awardees on the contract, which includes a base period of five years. The contract has a ceiling of $250 million for all awardees. Task orders are expected to be released under the contract, for which DLH expects to compete.
“DLH delivers innovative logistics, engineering, and integration services to safeguard the American warfighter’s ability to out-detect, out-think, and outmaneuver our adversaries,” said Billy Burnett, President of DLH’s National Security Programs Operations Center. “Through this award, DLH will implement mission-driven, interoperable, and cost-effective solutions for our customers as they confront critical system integration challenges.”
About DLH
DLH (NASDAQ: DLHC) enhances technology, public health, and cyber security readiness missions through science, technology, cyber, and engineering solutions and services. Our experts solve some of the most complex and critical missions faced by federal customers, leveraging digital transformation, artificial intelligence, advanced analytics, cloud-based applications, telehealth systems, and more. With a world-class workforce dedicated to the idea that “Your Mission is Our Passion,” DLH brings a unique combination of government sector experience, proven methodology, and unwavering commitment to innovative solutions to improve the lives of millions. For more information, visit www.DLHcorp.com.
Safe Harbor Statement under the Private Securities Litigation Reform Act of 1995:
This press release may contain forward-looking statements within the meaning of the Private Securities Litigation Reform Act of 1995. These statements relate to future events or DLH`s future financial performance. Any statements that refer to expectations, projections or other characterizations of future events or circumstances or that are not statements of historical fact (including without limitation statements to the effect that the Company or its management “believes”, “expects”, “anticipates”, “plans”, “intends” and similar expressions) should be considered forward-looking statements that involve risks and uncertainties which could cause actual events or DLH’s actual results to differ materially from those indicated by the forward-looking statements. Forward-looking statements in this release include, among others, statements regarding the anticipated use of proceeds. These statements reflect our belief and assumptions as to future events that may not prove to be accurate. Our actual results may differ materially from such forward-looking statements due to a variety of factors, including: the failure to achieve the anticipated benefits of any future acquisition (including anticipated future financial operating performance and results); the inability to retain employees and customers; contract awards in connection with re-competes for present business and/or competition for new business; our ability to manage our debt obligations; compliance with bank financial and other covenants; changes in client budgetary priorities; government contract procurement (such as bid and award protests, small business set asides, loss of work due to organizational conflicts of interest, etc.) and termination risks; significant delays or reductions in appropriations for our programs and broader changes in U.S. government funding and spending patterns; legislation that amends or changes discretionary spending levels or budget priorities; legal, regulatory, and political changes from the federal government that could result in economic uncertainty; the impact of inflation and higher interest rates; and other risks described in our SEC filings. For a discussion of such risks and uncertainties which could cause actual results to differ from those contained in the forward-looking statements, see “Risk Factors” in the Company’s periodic reports filed with the SEC, including our Annual Report on Form 10-K for the fiscal year ended September 30, 2025, as well as interim quarterly filings thereafter. The forward-looking statements contained herein are not historical facts, but rather are based on current expectations, estimates, assumptions and projections about our industry and business.
Such forward-looking statements are made as of the date hereof and may become outdated over time. The Company does not assume any responsibility for updating forward-looking statements.
VANCOUVER, BC, April 28, 2026 – Nicola Mining Inc.(NASDAQ: NICM) (TSXV: NIM) (FSE: HLIA) (the “Company” or “Nicola“) is pleased to announce commencement of the 2026 Exploration Diamond Drilling Program (the “2026 Program“) at its New Craigmont Copper Project (“New Craigmont”), near Merritt, BC.
Exploration Target
In 2022, Nicola Mining Inc. completed a property-wide Z-axis Tipper Electromagnetic (ZTEM) survey conducted by Geotech Ltd. Interpretation of the dataset identified a prominent resistivity anomaly located immediately north of the historical Craigmont open pit (Figure 1). Subsequent drilling completed in 2023 (holes NC23-005 and NC23-006), positioned to the south of this anomaly, intersected encouraging porphyry-style alteration assemblages, supporting the potential for a larger mineralized system at depth. Nicola has designated this geophysical feature as the “Jotun” target (pronounced Yoten).
The Company considers the Jotun target to be a compelling exploration opportunity that may represent the causative intrusive source responsible for the high-grade copper skarn historically mined at Craigmont. Nicola’s 2026 plans include drilling an exploration hole to directly test the ZTEM anomaly and evaluate its potential as a core of a porphyry-skarn system; however, it should be noted that New Craigmont has the potential of hosting multiple porphyries, as highlighted by the adjacent Highland Valley Copper.
Figure 1. Location Map of the Planned Drill Hole and Geological Setting
Diamond Drilling Plans
Exploration plans for the 2026 Program include diamond drilling at the Jotun target area, a previously untested zone within the New Craigmont Project. The Company will be working with Dorado Drilling Ltd. to execute the program.
The planned drill hole is designed to test the interpreted ZTEM resistivity anomaly at depth, with the target zone expected to be intersected at approximately 775 metres downhole, based on the current geological model and assuming a drill orientation of approximately 80 degrees dip and the planned azimuth. This hole is intended to evaluate the potential presence of a causative intrusive body associated with the historical Craigmont copper skarn system.
Drilling at the Jotun target will open a new exploration area at New Craigmont and is expected to provide valuable geological information to support ongoing target development, including improved understanding of alteration assemblages, structural controls, lithological contacts, and mineralization, which are critical components in advancing exploration of a potential porphyry copper system at New Craigmont.
Figure 2. Cross section (and plan view) of the Jotun target: untested ZTEM resistivity high.
The estimated budget for the 2026 Program is $1.5M, which includes a geophysical survey and a soil sampling campaign. Nicola anticipates drilling to conclude in early June before commencing another diamond drilling program at its Treasure Mountain silver project.
Soil sampling will be conducted in the northwestern portion of the property to support target generation in underexplored areas. In addition, the Company plans to complete a comprehensive Mobile Magnetotelluric (Mobile MT) survey to further refine deep geophysical targets across the property. Details of these programs will be shared as the field season advances.
The Company also expects to have its thermal vectoring dataset fully processed during the season, which will support further interpretation of hydrothermal alteration patterns and help guide decisions on whether to continue expanding this work with additional data collection in the following year.
The Company expects to provide additional updates on exploration activities and results as the field season progresses.
Qualified Person The scientific and technical disclosure included in this news release have been reviewed and approved by Will Whitty, P.Geo., who is the Qualified Person as defined by NI 43-101. Mr. Whitty is Vice President, Exploration for the Company.
About Nicola Mining Nicola Mining Inc. is a junior mining company listed on the TSX-V Exchange and Frankfurt Exchange that maintains a 100% owned mill and tailings facility, located near Merritt, British Columbia. It has signed Mining and Milling Profit Share Agreements with high-grade BC-based gold projects. Nicola’s fully permitted mill can process both gold and silver mill feed via gravity and flotation processes.
The Company owns 100% of the New Craigmont Project, a property that hosts historic high-grade copper mineralization and covers an area of over 10,800 hectares along the southern end of the Guichon Batholith and is adjacent to Highland Valley Copper, Canada’s largest copper mine. The Company also owns 100% of the Treasure Mountain Property, which includes 30 mineral claims and a mineral lease, spanning an area exceeding 2,200 hectares.
Neither the TSX Venture Exchange nor its Regulation Services Provider (as that term is defined in the policies of the TSX Venture Exchange) accepts responsibility for the adequacy or accuracy of this release.
Registration Aligns With The Federal Rescheduling of Cannabis to Schedule III, Which Grants Federal Safe Harbor To Licensed Operators And Removes IRS Section 280E Restrictions
NORWOOD, Mass., June 25, 2026 (GLOBE NEWSWIRE) — MariMed Inc. (“MariMed” or the “Company”) (CSE: MRMD) (OTCQB: MRMD), a leading multi-state cannabis operator, today announced the Company has submitted applications with the U.S. Drug Enforcement Agency (“DEA”) to register certain state-licensed medical cannabis operations. Registering the Company’s medical cannabis licenses with the DEA is a requirement to qualify for protections provided by the federal rescheduling of medical marijuana to Schedule III of the Controlled Substances Act.
“DEA registration of certain of our medical businesses marks an important step forward for MariMed as we move the Company toward becoming a federally legal business,” said MariMed CEO Jon Levine.
About MariMed MariMed Inc. is a leading multi-state cannabis operator, known for developing and managing state-of-the-art cultivation, production, and retail facilities. Our award-winning portfolio of cannabis brands, including Betty’s Eddies™, Bubby’s Baked™, Vibations™, InHouse™, and Nature’s Heritage™, sets us apart as an industry leader. These trusted brands, crafted with quality and innovation, are recognized and loved by consumers across the country. With a commitment to excellence, MariMed continues to drive growth and set new standards in the cannabis industry. For additional information, visit www.marimedinc.com.
Company Contact: Howard Schacter Chief Communications Officer Email: [email protected] Phone: (781) 277-0007
CULVER CITY, Calif., June 25, 2026 (GLOBE NEWSWIRE) — Snail, Inc. (Nasdaq: SNAL) (“Snail Games” or the “Company”), a leading global independent developer and publisher of interactive digital entertainment, provided an update on recent portfolio developments, including the announcement of a major new expansion for PixARK, participation in the annual 2026 Steam Summer Sale event, and continued momentum for Bellwright following its console launch.
Snail Games unveiled PixARK: Terracrypt, the first paid DLC expansion for PixARK. The upcoming DLC is planned to introduce more than 200 hours of gameplay, 80 new creatures, and a vast new environment designed to further extend player progression and exploration opportunities within the PixARK universe. PixARK has accumulated over a million downloads, and the new DLC launch aims to re-engage its community and expand the titles reach even further. In conjunction with the Steam Summer Sale, the PixARK base game is currently available at 57% off, providing new players an opportunity to experience the sandbox survival adventure ahead of the DLC’s release.
The Company also highlighted its participation in the 2026 Steam Summer Sale event, which provides players with limited time discounts. Seasonal Steam sale events have historically served as meaningful engagement drivers for Snail’s catalog, generating increased player acquisition, unit sales, and revenue contributions while expanding and re-engaging communities across established and emerging titles. As part of the promotion, ARK: Survival Ascended is available at 75% off, offering one of the deepest discounts on the title and providing an accessible entry point for new players to join the growing ARK ecosystem ahead of the July 2nd launch of Genesis Ascended Part I and Tides of Fortune content.
In addition, as part of the Steam Summer Sale event, Bellwright is also available at 34% off. The title continues to gain momentum across platforms following its console launch, maintaining a Mostly Positive user review status on Steam and earning user ratings of 3.7 stars and 3.8 stars on PlayStation and Xbox, respectively. The title also reached the Top 5 Paid Games list on Xbox, underscoring player interest as the development team delivers ongoing updates and gameplay improvements.
The Company is committed to continue supporting its portfolio through regular content updates, platform expansions, seasonal promotions, and new product launches throughout the rest of the year, including ARK: Genesis AscendedPart 1 and ARK Tides of Fortune, both currently slated for release on July 2, 2026.
For creators interested in collaborations, please reach out to [email protected]
About Snail, Inc. Snail, Inc. (Nasdaq: SNAL) is a leading global independent developer and publisher of interactive digital entertainment for consumers around the world, with a premier portfolio of premium games designed for use on a variety of platforms, including consoles, PCs, and mobile devices. For more information, please visit: https://snail.com/.
Forward-Looking Statements: This press release contains statements that constitute forward-looking statements. Many of the forward-looking statements contained in this press release can be identified by the use of forward-looking words such as “anticipate,” “believe,” “could,” “expect,” “should,” “plan,” “intend,” “may,” “predict,” “continue,” “estimate” and “potential,” or the negative of these terms or other similar expressions. These forward-looking statements include information about possible or assumed future results of Snail Games’ business, financial condition, results of operations, liquidity, plans and objectives. Forward-looking statements appear in a number of places in this press release and include, but are not limited to, statements regarding the continued momentum for Bellwright following its console launch; the development team delivering ongoing updates; and continuing to support the Company’s portfolio through regular content updates, platform expansions, seasonal discounts, and new product launches throughout the remainder of the year, including ARK: Genesis Ascended Part 1 and ARK Tides of Fortune slated for release July 2, 2026; and assumptions underlying any of the foregoing. Further information on risks, uncertainties and other factors that could affect Snail Games’ financial results and business include Snail Games’ ability to strengthen its gaming portfolio’s visibility; Snail Games’ ability to expand and grow its franchise and increase its revenue; Snail Games’ ability to retain its key employees or maintain its Nasdaq listing; and the risks that are included in its filings with the Securities and Exchange Commission (the “SEC”) from time to time, including its annual reports on Form 10-K and quarterly reports on Form 10-Q filed, or to be filed, with the SEC. You should not rely on these forward-looking statements, as actual outcomes and results may differ materially from those expressed or implied in the forward-looking statements as a result of such risks and uncertainties. All forward-looking statements in this press release are based on management’s beliefs and assumptions and on information currently available to Snail, and Snail does not assume any obligation to update the forward-looking statements provided to reflect events that occur or circumstances that exist after the date on which they were made.
Investor Contact: John Yi and Steven Shinmachi Gateway Group, Inc. 949-574-3860 [email protected]
PrimeC was associated with changes across multiple biomarkers spanning key neurodegenerative disease pathways, providing early biological evidence consistent with potential target engagement
Findings support continued development of PrimeC’s multi-target approach in Alzheimer’s disease
CAMBRIDGE, Mass., June 25, 2026 /PRNewswire/ — NeuroSense Therapeutics Ltd. (NASDAQ: NRSN) (“NeuroSense”), a late-clinical stage biotechnology company developing novel treatments for severe neurodegenerative diseases, today announced positive biomarker findings from its Phase 2, randomized, double-blind, placebo-controlled proof-of-concept RoAD study (NST-AD-001) of PrimeC in Alzheimer’s disease (AD).
The RoAD clinical trial enrolled eight participants, randomized to PrimeC or placebo. Three participants completed a 12-month follow-up period, with both CSF and plasma samples collected at three timepoints.
The plasma biomarker analysis showed multiple, distinctive protein biomarker changes. Most notably, these included changes in the hallmark protein biomarkers of AD – brain-derived tau (total) and phospho-tau(s) as well as the amyloid-beta 42/40 ratio. Distinctive changes were also found in the levels of other major neurodegenerative disease misfolding proteins: alpha-synuclein (total, oligomeric and p129) and TAR DNA-binding protein 43 (“TDP-43,” both total and p409). TDP-43 is the hallmark of ALS while Parkinson’s and dementia with Lewy bodies are characterized by accumulations of alpha-synuclein. These pathological proteins commonly co-occur with Alzheimer’s disease. Either (or both) of these may be present in more than 50% of Alzheimer’s disease cases, and when co-pathology is present, it is associated with faster and/or more severe dementia. Finally, additional changes were observed in key biomarkers of oxidative stress and inflammation affecting proteostasis and neurodegeneration. All of these changes were directionally consistent with PrimeC’s proposed mechanism of action and align with biomarker effects previously observed in the Company’s ALS program, supporting engagement of shared neurodegenerative pathways.
The biomarker findings supporting PrimeC’s target engagement build on its previously reported favorable safety and tolerability profile from RoAD, in which no serious adverse events and no new or unexpected safety signals were identified.
“The initial findings seen from the RoAD study are encouraging, in that they may suggest that the same multi-target mechanism we have been advancing in ALS is engaging biology that is also central to Alzheimer’s,” said Alon Ben-Noon, Co-Founder and Chief Executive Officer of NeuroSense. “This was a small, exploratory proof-of-concept study with a limited number of analyzable patient samples, and so we are appropriately measured about what it can tell us on its own. But seeing biological signals that point in the same direction across two distinct neurodegenerative diseases strengthens our conviction in PrimeC’s underlying approach and helps inform the design of a next, adequately powered study.”
“Alzheimer’s disease is driven by multiple, interacting pathological processes, which is one reason single-target therapies so often fall short. The biomarker findings in this first treated AD patient suggest broad proteostatic effects, consistent with PrimeC’s proposed mechanism of action,” said Prof. Steven E. Arnold, Professor of Neurology at Harvard Medical School and member of NeuroSense’s Scientific Advisory Board. “Of course these are the very first biomarker data of PrimeC treatment in AD and should be interpreted with that in mind. They do, however, support the rationale for evaluating PrimeC in a larger, well-controlled trial designed to test whether these biological effects replicate and more importantly, translate into meaningful clinical benefit.”
Next Steps
NeuroSense intends to use these proof-of-concept findings to help inform the design of a future, adequately powered clinical study of PrimeC in Alzheimer’s disease, and will continue engaging with scientific and regulatory stakeholders as the program advances.
About RoAD
RoAD (NST-AD-001) is a Phase 2, randomized, double-blind, placebo-controlled, exploratory proof-of-concept study evaluating the safety, tolerability, and biomarker effects of PrimeC in eight participants with Alzheimer’s disease. As a proof-of-concept study, clinical outcome measures are descriptive by design.
About Alzheimer’s Disease
Alzheimer’s disease (AD) is a progressive neurodegenerative disorder and the leading cause of dementia worldwide, affecting more than 30 million people globally. AD is characterized by memory loss, cognitive decline, and behavioral changes, and currently has no cure. Existing therapies provide only limited symptomatic relief, leaving a significant unmet need for disease-modifying treatments that can slow or halt progression. Given the complexity of AD, approaches that target multiple disease mechanisms simultaneously, such as PrimeC, hold potential to deliver meaningful therapeutic advances for patients and their families.
About PrimeC
PrimeC, NeuroSense’s lead drug candidate, is a novel extended-release oral formulation composed of a unique fixed-dose combination of two FDA-approved drugs: ciprofloxacin and celecoxib. PrimeC is designed to synergistically target several key mechanisms of ALS and AD, that contribute to neuron degeneration, inflammation, iron accumulation and impaired ribonucleic acid (“RNA”) regulation to potentially inhibit the progression of ALS and AD.
About NeuroSense
NeuroSense Therapeutics, Ltd. is a late-stage clinical biotechnology company focused on discovering and developing treatments for people suffering from debilitating neurodegenerative diseases. NeuroSense believes that these diseases, which include amyotrophic lateral sclerosis (ALS), Alzheimer’s disease and Parkinson’s disease, among others, represent one of the most significant unmet medical needs of our time, with limited effective therapeutic options available for patients to date. Due to the complexity of neurodegenerative diseases and based on strong scientific research on a large panel of related biomarkers, NeuroSense’s strategy is to develop combined therapies targeting multiple pathways associated with these diseases.
For additional information, we invite you to visit our website and follow us on LinkedIn, YouTube and X. Information that may be important to investors may be routinely posted on our website and these social media channels.
Forward-Looking Statements
This press release contains “forward-looking statements” that are subject to substantial risks and uncertainties. All statements, other than statements of historical fact, contained in this press release are forward-looking statements, including, without limitation, statements regarding the interpretation, significance and potential implications of the exploratory biomarker observations from the RoAD study, the potential of PrimeC to affect disease related biology or engage mechanisms relevant to Alzheimer’s disease and the potential for these preliminary observations to inform the design of future studies. Forward-looking statements contained in this press release may be identified by the use of words such as “anticipate,” “believe,” “contemplate,” “could,” “estimate,” “expect,” “intend,” “seek,” “may,” “might,” “plan,” “potential,” “predict,” “project,” “target,” “aim,” “should,” “will” “would,” or the negative of these words or other similar expressions, although not all forward-looking statements contain these words. Forward-looking statements are based on NeuroSense Therapeutics’ current expectations and are subject to inherent uncertainties, risks and assumptions that are difficult to predict. Further, certain forward-looking statements are based on assumptions as to future events that may not prove to be accurate. The future events and trends may not occur and actual results could differ materially and adversely from those anticipated or implied in the forward looking statements. These risks include, without limitation, the very limited sample size and exploratory nature of the biomarker analyses reported in this press release; the risk that preliminary observations from three analyzed patients may not be predictive, may not be statistically meaningful, may not be replicated in this study or future studies and may not correlate with or translate into clinical outcomes or benefit or disease modification; risks related to the timing of current and future clinical trials; the risk that PrimeC will not advance towards later-stage development; the risk that additional data from the RoAD study may differ from the observations reported in this press release; timing for reporting data, including from the study of PrimeC in Alzheimer’s disease; that the study will not be successful; the ability of NeuroSense to remain listed on Nasdaq; and other risks and uncertainties set forth in NeuroSense’s filings with the Securities and Exchange Commission (SEC). You should not rely on these statements as representing our views in the future. More information about the risks and uncertainties affecting NeuroSense is contained under the heading “Risk Factors” in the Annual Report on Form 20-F filed with the Securities and Exchange Commission on April 7, 2025 and NeuroSense’s subsequent filings with the SEC. Forward-looking statements contained in this announcement are made as of this date, and NeuroSense undertakes no duty to update such information except as required under applicable law.
Part C domestic enrollment is underway at three clinical sites in the U.S.
CHICAGO, June 25, 2026 (GLOBE NEWSWIRE) — MAIA Biotechnology, Inc. (NYSE American: MAIA) (“MAIA”, the “Company”), a clinical-stage biopharmaceutical company focused on developing targeted immunotherapies for cancer, today announced that it has completed international enrollment in Part C of its Phase 2 THIO-101 expansion trial evaluating its lead candidate, ateganosine, in advanced non-small cell lung cancer (NSCLC) patients receiving third line (3L) therapy. Ateganosine is an investigational dual-mechanism therapy targeting telomeres and immune activation in difficult-to-treat cancers.
THIO-101 Part C patients, who are resistant to prior checkpoint inhibitor (CPI) therapy and chemotherapy, are randomized between MAIA’s proposed combination regimen of ateganosine followed by cemiplimab (Libtayo®) and treatment with ateganosine alone for two cycles. International screening was conducted in Taiwan, Turkey, Poland, Hungary, Romania and Georgia, with 41 patients enrolled and receiving treatment. The Part C study is currently screening patients at multiple clinical sites in the United States.
“We greatly appreciate the dedication and contributions of the investigators supporting our THIO-101 trial,” said Vlad Vitoc, Founder and Chief Executive Officer of MAIA Biotechnology. “With enrollment now complete at the international Part C clinical sites, we are closely monitoring patient outcomes as the data continues to mature, including key efficacy measures such as disease control rate and overall survival, which have remained central endpoints throughout the Phase 2 THIO-101 trial. Meanwhile, patient screening is ongoing at three activated clinical sites in the United States.”
In Parts A and B of THIO-101, MAIA reported data showing median survival of 17.8 months. Overall survival (OS) beyond two years was observed for eight patients in Parts A and B of THIO-101; the patients did not receive subsequent lines of therapy. One patient in this cohort receiving 3L therapy has survived for over 33 months. Expected survival in this heavily pre-treated population is 5.8 months.1
The FDA has granted Fast Track designation for ateganosine in NSCLC treatment, potentially expediting the regulatory process to a potential Accelerated Approval and Priority Review.
About Ateganosine
Ateganosine (THIO, 6-thio-dG or 6-thio-2’-deoxyguanosine) is a first-in-class investigational telomere-targeting agent currently in clinical development to evaluate its activity in non-small cell lung cancer (NSCLC). Telomeres, along with the enzyme telomerase, play a fundamental role in the survival of cancer cells and their resistance to current therapies. The modified nucleotide 6-thio-2’-deoxyguanosine induces telomerase-dependent telomeric DNA modification, DNA damage responses, and selective cancer cell death. Ateganosine-damaged telomeric fragments accumulate in cytosolic micronuclei and activates both innate (cGAS/STING) and adaptive (T-cell) immune responses. The sequential treatment of ateganosine followed by PD-(L)1 inhibitors resulted in profound and persistent tumor regression in advanced, in vivo cancer models by induction of cancer type–specific immune memory. Ateganosine is presently developed as a second or later line of treatment for NSCLC for patients that have progressed beyond the standard-of-care regimen of existing checkpoint inhibitors.
About THIO-101 Phase 2 Clinical Trial
THIO-101 is a multicenter, open-label, dose finding Phase 2 clinical trial. It is the first trial designed to evaluate ateganosine’s anti-tumor activity when followed by PD-(L)1 inhibition. The trial is testing the hypothesis that low doses of ateganosine administered prior to cemiplimab (Libtayo®) will enhance and prolong immune response in patients with advanced NSCLC who previously did not respond or developed resistance and progressed after first-line treatment regimen containing another checkpoint inhibitor. The trial design has two primary objectives: (1) to evaluate the safety and tolerability of ateganosine administered as an anticancer compound and a priming immune activator (2) to assess the clinical efficacy of ateganosine using Overall Response Rate (ORR) as the primary clinical endpoint. The expansion of the study will assess overall response rates (ORR) in advanced NSCLC patients receiving third line (3L) therapy who were resistant to previous checkpoint inhibitor treatments (CPI) and chemotherapy. Treatment with ateganosine followed by cemiplimab (Libtayo®) has shown an acceptable safety profile to date in a heavily pre-treated population. For more information on this Phase II trial, please visit ClinicalTrials.gov using the identifier NCT05208944.
About MAIA Biotechnology, Inc.
MAIA is a targeted therapy, immuno-oncology company focused on the development and commercialization of potential first-in-class drugs with novel mechanisms of action that are intended to meaningfully improve and extend the lives of people with cancer. Our lead program is ateganosine (THIO), a potential first-in-class cancer telomere targeting agent in clinical development for the treatment of NSCLC patients with telomerase-positive cancer cells. For more information, please visit www.maiabiotech.com.
Forward Looking Statements
MAIA cautions that all statements, other than statements of historical facts contained in this press release, are forward-looking statements. Forward-looking statements are subject to known and unknown risks, uncertainties, and other factors that may cause our or our industry’s actual results, levels or activity, performance or achievements to be materially different from those anticipated by such statements. The use of words such as “may,” “might,” “will,” “should,” “could,” “expect,” “plan,” “anticipate,” “believe,” “estimate,” “project,” “intend,” “future,” “potential,” or “continue,” and other similar expressions are intended to identify forward looking statements. However, the absence of these words does not mean that statements are not forward-looking. For example, all statements we make regarding (i) the initiation, timing, cost, progress and results of our preclinical and clinical studies and our research and development programs, (ii) our ability to advance product candidates into, and successfully complete, clinical studies, (iii) the timing or likelihood of regulatory filings and approvals, (iv) our ability to develop, manufacture and commercialize our product candidates and to improve the manufacturing process, (v) the rate and degree of market acceptance of our product candidates, (vi) the size and growth potential of the markets for our product candidates and our ability to serve those markets, and (vii) our expectations regarding our ability to obtain and maintain intellectual property protection for our product candidates, are forward looking. All forward-looking statements are based on current estimates, assumptions and expectations by our management that, although we believe to be reasonable, are inherently uncertain. Any forward-looking statement expressing an expectation or belief as to future events is expressed in good faith and believed to be reasonable at the time such forward-looking statement is made. However, these statements are not guarantees of future events and are subject to risks and uncertainties and other factors beyond our control that may cause actual results to differ materially from those expressed in any forward-looking statement. Any forward-looking statement speaks only as of the date on which it was made. We undertake no obligation to publicly update or revise any forward-looking statement, whether as a result of new information, future events or otherwise, except as required by law. In this release, unless the context requires otherwise, “MAIA,” “Company,” “we,” “our,” and “us” refers to MAIA Biotechnology, Inc. and its subsidiaries.
New capabilities combine real-time translation, AI-driven training simulation and voice enhancement technologies to improve customer satisfaction and help organizations scale service delivery globally
Conduent Incorporated (Nasdaq: CNDT), a global technology-driven business solutions and services company, today introduced new AI-powered capabilities within its Next Generation CX Platform designed to help organizations overcome language barriers, accelerate agent readiness and improve customer interactions. The platform combines real-time translation, AI-driven training simulation and voice enhancement technologies to help clients expand into new markets, improve service quality and increase customer satisfaction.
The Next Generation CX Platform is comprised of modular solutions that leverage AI, automation and advanced analytics to optimize customer interactions, enhance agent performance, improve contact center operations and generate actionable insights. Together, these capabilities help organizations deliver more consistent, personalized and efficient customer experiences across channels and geographies.
Real-Time Translation Helps Organizations Reach More Customers
As organizations expand globally, delivering support in customers’ preferred languages can be costly and complex. Recruiting multilingual agents, relying on interpreters or routing customers through multiple touchpoints can increase costs and create friction in the customer experience.
Conduent’s AI-powered real-time translation solution helps remove those barriers by enabling seamless conversations between customers and agents across more than 90 languages. Customers receive support in their preferred language while organizations continue to leverage their existing agent workforce and subject matter expertise. The solution enables organizations to expand into new markets more quickly while maintaining a consistent, high-quality customer experience.
AI-Powered Training Accelerates Agent Readiness
Effective training is critical to delivering exceptional customer service. Conduent’s AI-driven training simulation solution enables agents to practice realistic customer scenarios and receive targeted coaching based on analysis of voice, chat and screen interactions.
The solution provides consistent training experiences across languages and globally distributed teams, helping organizations onboard agents more efficiently and maintain service quality at scale. For clients with seasonal or cyclical customer service demands, such as tax season or holiday peaks, the solution can accelerate time to proficiency by up to 40%, enabling agents to become customer-ready faster.
Voice Enhancement Improves Customer Interactions
Conduent is also introducing AI-powered accent smoothing and noise cancellation capabilities to improve the clarity and effectiveness of customer-agent conversations. By reducing communication barriers and minimizing background distractions, these technologies help improve customer engagement, increase interaction quality and support faster issue resolution. The result is a more seamless customer experience and greater confidence in every interaction.
“The future of customer experience isn’t AI or people, it’s AI and people working together,” said George Wehbe, President, Commercial Solutions at Conduent. “Our Next Generation CX Platform has arrived. It helps clients reach more customers, onboard agents faster and deliver more consistent service across languages and geographies. By combining AI-powered automation with experienced agents, we’re helping organizations improve customer satisfaction while scaling more efficiently.”
About Conduent’s Next Generation CX Platform
Conduent’s Next Generation CX Platform combines AI-powered automation, agent enablement, operational intelligence and customer insights into a flexible suite of solutions that can be deployed across the customer experience lifecycle. The platform is designed to help organizations improve customer outcomes, increase operational efficiency and adapt to evolving customer expectations while maintaining the human expertise required to resolve complex issues and build long-term loyalty.
About Conduent
Conduent delivers digital business solutions and services spanning the commercial, government and transportation spectrum – creating valuable outcomes for its clients and the millions of people who count on them. The Company leverages cloud computing, artificial intelligence, machine learning, automation and advanced analytics to deliver mission-critical solutions. Through a dedicated global team of approximately 48,000 associates, process expertise and advanced technologies, Conduent’s solutions and services digitally transform its clients’ operations to enhance customer experiences, improve performance, increase efficiencies and reduce costs. Conduent adds momentum to its clients’ missions in many ways including disbursing approximately $80 billion in government payments annually, enabling approximately 2.0 billion customer service interactions annually, empowering millions of employees through HR services every year and processing over 14 million tolling transactions every day. Learn more at www.conduent.com .
Conduent is a trademark of Conduent Incorporated in the United States and/or other countries. Other names may be trademarks of their respective owners.
Selection highlights the clinical value potential of Cadrenal’s first-in-class 12-lipoxygenase inhibitor for Heparin-Induced Thrombocytopenia (HIT)
First-ever randomized, blinded, placebo-controlled trial in HIT, a life-threatening blood-clotting disorder triggered by an immune reaction to heparin, the most widely used blood thinner in hospitals
Phase-3 ready and addresses a peak $2 billion annual revenue potential in the HIT market
PONTE VEDRA, Fla., June 24, 2026 (GLOBE NEWSWIRE) — Cadrenal Therapeutics, Inc. (Nasdaq: CVKD), a biopharmaceutical company advancing late-stage novel therapies for life-threatening immune and thrombotic conditions, today announced that late-breaking clinical data on its first-in-class 12-lipoxygenase (12-LOX) inhibitor, CAD-1005 (formerly VLX-1005), have been accepted for a prestigious oral presentation at the 34th Congress of the International Society on Thrombosis and Haemostasis (ISTH). The congress will be held live and onsite from July 11-15, 2026, at the Palais des Congrès de Paris in Paris, France.
The abstract, titled “12-lipoxygenase inhibition with VLX-1005 in heparin-induced thrombocytopenia,” was selected by expert peer reviewers for inclusion in the high-profile session on clinical trials and breakthrough innovations.
“The selection of our Phase 2 CAD-1005 study for a late-breakthrough oral presentation at ISTH is another milestone underscoring the scientific integrity and commercial importance of our pipeline,” said Quang X. Pham, Chief Executive Officer of Cadrenal Therapeutics. “Heparin-Induced Thrombocytopenia represents a high-value therapeutic market with significant unmet needs and no approved therapies that target the specific underlying immune mechanisms of HIT. This presentation offers an elite global platform to showcase the clinical potential of CAD-1005.”
“Targeting 12-lipoxygenase is a novel, highly selective therapeutic approach that addresses the root cause of immune-mediated platelet activation in HIT,” added Dr. Steve McKenzie, Professor of Medicine at Thomas Jefferson University, the principal investigator and presenter. “The data we are presenting live in Paris – the first-ever randomized, blinded, placebo-controlled trial in HIT – illustrate how CAD-1005 could fundamentally shift the treatment paradigm for acute thrombotic care and may, if approved, offer a highly differentiated option for these high-risk patients.”
Presentation Details:
Session Title: Late-Breakthrough Abstracts I: Clinical Trials and Innovation in Thrombosis
Abstract Title: 12-lipoxygenase inhibition with VLX-1005 in heparin-induced thrombocytopenia
HIT is an immune-mediated, prothrombotic adverse drug reaction in which antibodies against platelet factor 4-heparin complexes activate platelets via FcγRIIA receptors, triggering a cascade that can lead to life-threatening thrombosis. Current management relies on non-heparin anticoagulants, which reduce thrombin generation but do not directly address the underlying antibody-mediated platelet activation; new thrombosis remains a major clinical concern even with appropriate anticoagulant therapy.
About CAD-1005
CAD-1005 is a novel investigational therapeutic under development for the treatment of heparin-induced thrombocytopenia (HIT). CAD-1005 is designed to selectively inhibit 12-lipoxygenase (12-LOX), an enzyme central to platelet immune activation and thrombo-inflammatory signaling associated with HIT. CAD-1005 is intended to be used alongside existing standards of care and is being developed to address the underlying biological mechanisms that contribute to disease progression.
About Cadrenal Therapeutics, Inc.
Cadrenal Therapeutics, Inc. is a late-stage biopharmaceutical company advancing novel therapies for life-threatening immune and thrombotic conditions. Its lead program, CAD-1005, is being investigated as a first-in-class 12-LOX inhibitor for heparin-induced thrombocytopenia (HIT), a deadly immune-mediated thrombotic disorder. CAD-1005 has received Orphan Drug and Fast Track designations from the U.S. Food and Drug Administration and orphan drug status from the European Medicines Agency. Second-generation 12-LOX oral therapeutics are also in development for chronic indications.
The Company’s broader pipeline includes tecarfarin, a late-stage oral vitamin K antagonist designed to prevent heart attacks, strokes, and deaths from blood clots in patients requiring chronic anticoagulation, including those with end-stage kidney disease, those with left ventricular assist devices, and potentially, those with Kawasaki disease (KD), an acute self-limited febrile illness that primarily affects children <5 years old, and the leading cause of acquired heart disease in developed countries.
Safe Harbor
Any statements in this press release about future expectations, plans, and prospects, as well as any other statements regarding matters that are not historical facts, may constitute “forward-looking statements.” The words “anticipate,” “believe,” “continue,” “could,” “estimate,” “expect,” “intend,” “may,” “plan,” “potentially,” “predict,” “project,” “should,” “target,” “will,” “would” and similar expressions are intended to identify forward-looking statements, although not all forward-looking statements contain these identifying words. These statements include, without limitation, statements regarding the late-breakthrough oral presentation at ISTH being a significant milestone that supports the scientific integrity and commercial importance of the Company’s pipeline and the data being presented illustrating how CAD-1005 could fundamentally shift the treatment paradigm for acute thrombotic care, and may, if approved, offer a highly differentiated option for these high-risk patient patients and CAD-1005 being intended to be used in conjunction with existing standards of care and is being developed to address the underlying biological mechanisms contributing to disease progression.
Actual results may differ materially from those indicated by such forward-looking statements as a result of various important factors, including the ability to raise sufficient capital to continue progress of CAD-1005; the ability to advance directly to Phase 3 study evaluating CAD-1005 in patients with HIT; the ability to successfully design and complete the Phase 3 study and derive the results needed for an NDA submission; and the other risk factors described in the Company’s Annual Report on Form 10-K for the year ended December 31, 2025, and the Company’s subsequent filings with the Securities and Exchange Commission, including subsequent periodic reports on Quarterly Reports on Form 10-Q and Current Reports on Form 8-K. Any forward-looking statements contained in this press release speak only as of the date hereof and, except as required by federal securities laws, the Company specifically disclaims any obligation to update any forward-looking statement, whether as a result of new information, future events, or otherwise.
NEW ALBANY, Ohio, June 23, 2026 (GLOBE NEWSWIRE) — CVG (NASDAQ: CVGI), a diversified industrial products and services company, announced that it is expected to join the U.S. small-cap Russell 2000® Index and the broad-market Russell 3000® Index as part of the 2026 reconstitution of the Russell U.S. Indexes. The reconstituted indexes will take effect after the U.S. equity markets close on Friday, June 26, 2026.
“We are pleased to be added as a member of the Russell 2000® Index, one of the most widely tracked benchmarks for U.S. small-cap companies,” commented Angie O’Leary, Interim Chief Financial Officer. “As we continue to execute our strategy and optimize operations, we are excited to connect with a wider network of investors.”
Russell indexes are widely used by investment managers and institutional investors for index funds and as benchmarks for active investment strategies. According to data as of the end of June 2025, about $12.2 trillion in assets are benchmarked against the Russell US indexes, which belong to FTSE Russell, the global index provider.
For more information on the Russell 2000® Index and the Russell indexes reconstitution, go to the “Russell Reconstitution” section on the FTSE Russell website.
About CVG
CVG is a global provider of systems, assemblies and components to global commercial vehicle markets and electric vehicle markets. We deliver real solutions to complex design, engineering and manufacturing problems while creating positive change for our customers, industries and communities we serve. Information about the Company and its products is available on the internet at www.cvgrp.com.
About FTSE Russell, an LSEG Business
FTSE Russell is a global index leader that provides innovative benchmarking, analytics and data solutions for investors worldwide. FTSE Russell calculates thousands of indexes that measure and benchmark markets and asset classes in more than 70 countries, covering 98% of the investable market globally. FTSE Russell index expertise and products are used extensively by institutional and retail investors globally.
Approximately $21.20 trillion is benchmarked to FTSE Russell indexes. Leading asset owners, asset managers, ETF providers and investment banks choose FTSE Russell indexes to benchmark their investment performance and create ETFs, structured products and index-based derivatives.
A core set of universal principles guides FTSE Russell index design and management: a transparent rules-based methodology is informed by independent committees of leading market participants. FTSE Russell is focused on applying the highest industry standards in index design and governance and embraces the IOSCO Principles. FTSE Russell is also focused on index innovation and customer partnerships as it seeks to enhance the breadth, depth and reach of its offering.
This press release contains forward-looking statements that are subject to risks and uncertainties. These statements often include words such as “believe”, “anticipate”, “plan”, “expect”, “intend”, “will”, “should”, “could”, “would”, “project”, “continue”, “likely”, and similar expressions. In particular, this press release may contain forward-looking statements about the Company’s expectations for future periods with respect to its plans to improve financial results, the future of the Company’s end markets, including, but not limited to, global commercial vehicle markets and electric vehicle markets, changes in the North America Class 8 and Class 5-7 truck build rates, performance of the global construction and agricultural equipment businesses, the Company’s prospects in the global commercial vehicle markets and electric vehicle markets, the Company’s initiatives to address customer needs, organic growth, the Company’s strategic plans and plans to focus on certain segments, competition faced by the Company, volatility in and disruption to the global economic environment including global supply chain constraints, inflation and labor shortages, tariffs and counter-measures, financial covenant compliance, anticipated effects of acquisitions or divestitures, production of new products, plans for capital expenditures, and the Company’s financial position or other financial information. These statements are based on certain assumptions that the Company has made in light of its experience as well as its perspective on historical trends, current conditions, expected future developments and other factors it believes are appropriate under the circumstances. Actual results may differ materially from the anticipated results because of certain risks and uncertainties, including those included in the Company’s filings with the SEC. There can be no assurance that statements made in this press release relating to future events will be achieved. The Company undertakes no obligation to update or revise forward-looking statements to reflect changed assumptions, the occurrence of unanticipated events or changes to future operating results over time. All subsequent written and oral forward-looking statements attributable to the Company or persons acting on behalf of the Company are expressly qualified in their entirety by such cautionary statements.
Investor Relations Contact: Ross Collins or Nathan Skown Alpha IR Group [email protected]
TORONTO, June 23, 2026 /PRNewswire/ – Power Metallic Mines Inc. (the “Company” or “Power Metallic”) (TSXV: PNPN) (OTCBB: PNPNF) (Frankfurt: IVV1) is pleased to provide additional assay results from its Winter 2026 drill program.
Summary
Figure 1 – Lion Zone MRE Drill holes reported in this news release (CNW Group/Power Nickel Inc.)
These additional assays from Power Metallic’s winter 2026 drill program is nearing the completion of winter drill results to be used for the initial NI-43-101 Mineral Resource Estimate (MRE) on Lion. Completion and reporting of the MRE estimates on Lion and the Nisk deposit is scheduled for the end of July. This MRE will form the basis for a Preliminary Economic Assessment (PEA) to begin immediately following the completion of the MRE.
Lion Zone MRE In-fill program
This news release includes drill holes defining the western side of the Lion Zone close to surface (Figure 1). All holes are in preparation for the 2026 Mineral Resource Estimate (MRE). The infill drill holes in this release were drilled to delimit the western side of Lion to increase the confidence of modelling the zone, particularly within the range of a potential future open pit.
In-fill drill holes in the shallow central parts of the deposit continue to report good near surface grades as evidenced by PML-26-115 which intersected high-grade copper near surface with 13.30 m @ 3.98% CuEqRec1 at 25m below surface, and PML-26-105 which intersected 5.26 m @ 8.45% CuEqRec1 at approximately 140m below surface (Table 1 and Figure 1).
Drill holes included in Figure 1 but not in the table of Lion results (Table 1) occur on the western side of Lion, delimiting the western edge for MRE resource modelling. These holes did intersect the favourable mineralized structure, but had low grade assays, including individual assays of up to 0.57% Cu and 1.22 g/t Pd. The fact that these holes are within a few 10s of meters of very high grade intersections is important for the continuing exploration in the Lion area. Understanding that good structure with low grade mineralization in exploratory drilling could indicating potential proximity to higher grades will help vector current and future drilling programs.
Table 1: Lion Results – Winter 2026
Hole
From
To
Length
Au
Ag
Cu
Pd
Pt
Ni
CuEq Rec1
(m)
(m)
(m)2
(g/t)
(g/t )
( %)
(g/t)
(g/t)
( %)
( %)
PML-26-063
430.73
437.25
6.52
0.04
0.87
0.05
0.26
0.07
0.10
0.41
PML-26-105
172.22
174.10
1.88
0.13
10.44
0.37
–
–
–
0.56
and
177.00
185.00
8.00
0.16
6.31
0.24
0.18
–
–
0.51
and
188.74
194.00
5.26
0.59
24.94
6.10
1.77
0.60
0.42
8.45
and
203.70
211.00
7.30
0.22
8.59
0.82
0.24
0.02
0.03
1.21
and
237.50
242.00
4.50
0.46
9.17
1.67
0.21
–
0.18
2.51
PML-26-106
45.00
52.00
7.00
0.03
3.76
1.92
1.12
0.02
0.21
2.84
Including
47.00
49.00
2.00
0.08
11.65
6.46
3.80
0.03
0.37
8.87
PML-26-114
21.00
25.16
4.16
0.30
13.28
0.42
0.03
–
–
0.78
and
39.00
41.00
2.00
0.22
1.55
0.46
0.26
–
–
0.77
and
52.00
57.40
5.40
0.20
4.01
0.45
0.43
0.02
0.02
0.86
Including
54.00
55.54
1.54
0.50
12.74
1.31
1.38
0.05
0.03
2.43
PML-26-115
27.00
40.30
13.30
0.45
21.65
1.68
3.28
0.98
0.04
3.98
Including
35.53
39.30
3.77
0.72
53.69
4.89
7.25
0.74
0.12
9.36
1Copper Equivalent Rec Calculation (CuEqRec1) CuEqRec represents CuEq calculated based on the following metal prices (USD) : 2,360.15 $/oz Au, 27.98 $/oz Ag, 1,215.00 $/oz Pd, 1000.00 $/oz Pt, 4.00 $/lb Cu, 10.00 $/lb Ni and 22.50 $/lb Co., and recovered grades based on recent locked-cycle metallurgical recoveries by SGS Canada Inc (see press release Jan 21, 2006).
2 Reported length is downhole distance; true width based on model projections is estimated as 85% of downhole length
Power Metallic is expecting more assay results from the MRE drilling and regional exploration in the weeks to come.
Qualified Person
Joseph Campbell, P. Geo, VP Exploration at Power Metallic, is the qualified person who has reviewed and approved the technical disclosure contained in this news release.
About Power Metallic Mines Inc.
Power Metallic is a Canadian exploration company focused on advancing the Nisk Project Area (Nisk–Lion–Tiger)—a high–grade Copper–PGE, Nickel, gold and silver system—toward Canada’s next polymetallic mine.
On 1 February 2021, Power Metallic (then Chilean Metals) secured an option to earn up to 80% of the Nisk project from Critical Elements Lithium Corp. (TSX–V: CRE). Following the June 2025 purchase of 313 adjoining claims (~167 km²) from Li–FT Power, the Company now controls ~330 km² and roughly 50 km of prospective basin margins.
Power Metallic is expanding mineralization at the Nisk and Lion discovery zones, evaluating the Tiger target, and exploring the enlarged land package through successive drill programs.
Beyond the Nisk Project Area, Power Metallic indirectly has an interest in significant land packages in British Columbia and Chile, by its 50% share ownership position in Chilean Metals Inc., which were spun out from Power Metallic via a plan of arrangement on February 3, 2025.
It also owns 100% of Power Metallic Arabia which owns 100% interest in the Jabul Baudan exploration license in The Kingdon of Saudi Arabia’s Jabal Said Belt. The property encompasses over 200 square kilometres in an area recognized for its high prospectivity for copper gold and zinc mineralization. The region is known for its massive volcanic sulfide (VMS) deposits, including the world-class Jabal Sayid mine and the promising Umm and Damad deposit.
For further information, readers are encouraged to contact: Power Metallic Mines Inc. The Canadian Venture Building 82 Richmond St East, Suite 202 Toronto, ON
Neither the TSX Venture Exchange nor its Regulation Services Provider accepts responsibility for the adequacy or accuracy of this release.
QAQC and Sampling
GeoVector Management Inc (“GeoVector”) is the Consulting company retained to perform the actual drilling program, which includes core logging and sampling of the drill core.
All core in this news release is either HQ or NQ sized core. Drill core is re-fitted and measured. Geotech on core includes photographs (wet & dry), rock quality index, magnetic susceptibility, conductivity, and recovery estimates. Core is logged for lithology, mineralogy, and structural features, and sample intervals are delineated and tagged.
Sampled core is mechanically sawn, and half-core is retained for future reference. GeoVector’s QAQC program includes regular insertion of CRM standards, duplicates, and blanks into the sample stream with a stringent review of all results. QAQC and data validation was performed, and no material errors were observed.
All samples were submitted to and analyzed at Activation Laboratories Ltd (“Actlabs”), a commercial laboratory independent of Power Metallic with no interest in the Project. Actlabs is an ISO 9001 and 17025 certified and accredited laboratories. Samples submitted through Actlabs are run through standard preparation methods and analysed using RX-1 (Dry, crush (< 7 kg) up to 80% passing 2 mm, riffle split (250 g) and pulverize (mild steel) to 95% passing 105 μm) preparation methods, and using 1F2 (ICP-OES) and 1C-OES – 4-Acid near total digestion + Gold-Platinum-Palladium analysis and 8-Peroxide ICP-OES, for regular and over detection limit analysis. Pegmatite samples are analyzed using UT7 – Li up to 5%, Rb up to 2% method. Actlabs also undertake their own internal coarse and pulp duplicate analysis to ensure proper sample preparation and equipment calibration.
This message contains certain statements that may be deemed “forward-looking statements” concerning the Company within the meaning of applicable securities laws. Forward-looking statements are statements that are not historical facts and are generally, but not always, identified by the words “expects,” “plans,” “anticipates,” “believes,” “intends,” “estimates,” “projects,” “potential,” “indicates,” “opportunity,” “possible” and similar expressions, or that events or conditions “will,” “would,” “may,” “could” or “should” occur. Although the Company believes the expectations expressed in such forward-looking statements are based on reasonable assumptions, such statements are not guarantees of future performance, are subject to risks and uncertainties, and actual results or realities may differ materially from those in the forward-looking statements. Such material risks and uncertainties include, but are not limited to, among others; the timing for various drilling plans; the ability to raise sufficient capital to fund its obligations under its property agreements going forward and conduct drilling and exploration; to maintain its mineral tenures and concessions in good standing; to explore and develop its projects; changes in economic conditions or financial markets; the inherent hazards associates with mineral exploration and mining operations; future prices of nickel and other metals; changes in general economic conditions; accuracy of mineral resource and reserve estimates; the potential for new discoveries; the ability of the Company to obtain the necessary permits and consents required to explore, drill and develop the projects and if accepted, to obtain such licenses and approvals in a timely fashion relative to the Company’s plans and business objectives for the applicable project; the general ability of the Company to monetize its mineral resources; and changes in environmental and other laws or regulations that could have an impact on the Company’s operations, compliance with environmental laws and regulations, dependence on key management personnel and general competition in the mining industry.
CAMBRIDGE, Mass., June 22, 2026 /PRNewswire/ — NeuroSense Therapeutics Ltd. (NASDAQ: NRSN) (“NeuroSense”), a late-stage clinical biotechnology company focused on developing disease-modifying treatments for neurodegenerative diseases, today announced that EverythingALS will host a conversation built around a look at emerging data on PrimeC and what it may mean for the science of ALS and the people living with it.
Event details:
Date: June 24, 2026 Time: 7 pm ET Link for registration: Click Here
The session will be presented by Prof. Jeffrey Rosenfeld, MD, PhD, FAAN, Professor of Neurology and Director of the Neuromuscular ALS/MND Program at Loma Linda University School of Medicine. With more than 30 years caring for people with ALS and leading some of the most extensive multidisciplinary ALS programs in the country, Prof. Rosenfeld brings both the clinical depth and the bedside perspective to walk through what the latest findings show.
He’ll be joined by Alon Ben-Noon, Co-Founder and CEO of NeuroSense Therapeutics, for the conversation that follows.
This is a conversation for people living with ALS, families, caregivers, clinicians, and anyone who wants to understand the latest developments in ALS research.
About NeuroSense
NeuroSense Therapeutics is a late-clinical stage biotechnology company developing novel treatments for severe neurodegenerative diseases, including amyotrophic lateral sclerosis (ALS) and Alzheimer’s disease. The Company’s lead product candidate, PrimeC, is a novel oral therapy designed to target multiple key biological pathways underlying disease progression, including neuroinflammation, oxidative stress and dysregulated iron metabolism.
NeuroSense has generated compelling clinical data from its Phase 2b PARADIGM study in ALS, demonstrating meaningful slowing of disease progression. The Company also reported significant biological activity across multiple biomarkers associated with ALS, including microRNAs, supporting PrimeC’s multi-target mechanism of action. Notably, long-term follow-up data indicated a meaningful survival benefit, representing a potentially important advancement in the treatment of ALS.
NeuroSense has received clearance from the U.S. Food and Drug Administration (FDA) to initiate a pivotal Phase 3 clinical trial (PARAGON) in ALS, which is expected to enroll approximately 300 participants, primarily in the United States.
For additional information, we invite you to visit our website and follow us on LinkedIn, YouTube and X. Information that may be important to investors may be routinely posted on our website and these social media channels.
About PrimeC
PrimeC, NeuroSense’s lead drug candidate, is a novel extended-release oral formulation composed of a unique fixed-dose combination of two FDA-approved drugs: ciprofloxacin and celecoxib. PrimeC is designed to synergistically target several key mechanisms of ALS and AD, that contribute to neuron degeneration, inflammation, iron accumulation and impaired ribonucleic acid (“RNA”) regulation to potentially inhibit the progression of ALS and AD.
About ALS
Amyotrophic lateral sclerosis (“ALS”) is an incurable neurodegenerative disease that causes complete paralysis and death within 2-5 years from diagnosis. Every year, more than 5,000 people are diagnosed with ALS in the U.S. alone, with an annual disease burden of $1 billion. The number of people living with ALS is expected to grow by 24% by 2040 in the U.S. and EU.
Forward-Looking Statements
This press release contains “forward-looking statements” that are subject to substantial risks and uncertainties. All statements, other than statements of historical fact, contained in this press release are forward-looking statements. Forward-looking statements contained in this press release may be identified by the use of words such as “anticipate,” “believe,” “contemplate,” “could,” “estimate,” “expect,” “intend,” “seek,” “may,” “might,” “plan,” “potential,” “predict,” “project,” “target,” “aim,” “should,” “will” “would,” or the negative of these words or other similar expressions, although not all forward-looking statements contain these words. Forward-looking statements are based on NeuroSense Therapeutics’ current expectations and are subject to inherent uncertainties, risks and assumptions that are difficult to predict. Further, certain forward-looking statements, including statements regarding the planned event, development, regulatory progress and potential commercialization of PrimeC, are based on assumptions as to future events that may not prove to be accurate. The future events and trends may not occur and actual results could differ materially and adversely from those anticipated or implied in the forward looking statements. These risks include the uncertainty regarding the benefits of outcomes and the timing of current and future clinical trials; timing for reporting data, including from the study of PrimeC in Alzheimer’s disease; that the study will not be successful; the ability of NeuroSense to remain listed on Nasdaq; and other risks and uncertainties set forth in NeuroSense’s filings with the Securities and Exchange Commission (SEC). You should not rely on these statements as representing our views in the future. More information about the risks and uncertainties affecting NeuroSense is contained under the heading “Risk Factors” in the Annual Report on Form 20-F filed with the Securities and Exchange Commission on March 31, 2026 and NeuroSense’s subsequent filings with the SEC. Forward-looking statements contained in this announcement are made as of this date, and NeuroSense undertakes no duty to update such information except as required under applicable law.


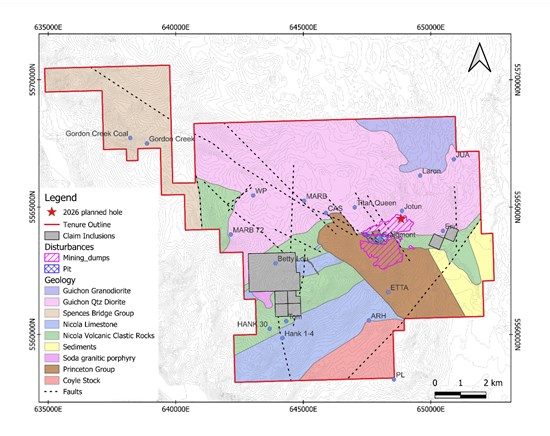
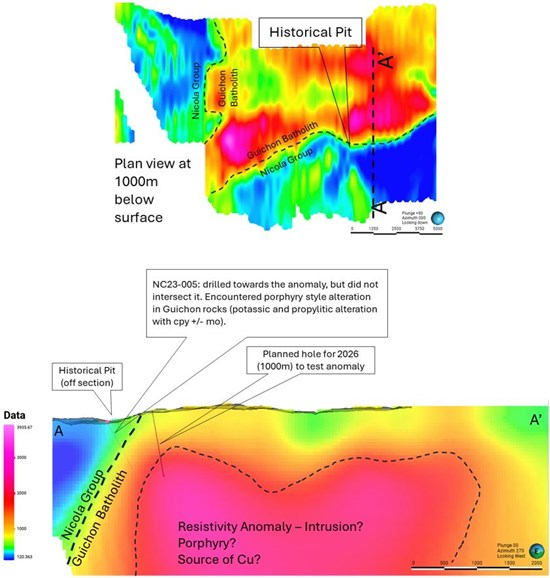


")
")