FORT WORTH, Texas, March 31, 2026 /PRNewswire/ — AZZ Inc. (NYSE: AZZ), the leading independent provider of hot-dip galvanizing and coil coating solutions, today announced it will conduct a conference call to review the Company’s financial results for the fourth quarter and fiscal year 2026 at 11:00 a.m. ET on Thursday, April 23, 2026. The Company will issue a press release reporting fourth quarter and full fiscal year financial results after the market closes on Wednesday, April 22, 2026.
Conference Call Details Interested parties can access the conference call by dialing (844) 855-9499 or (412) 317-5497 (international). A webcast of the call will be available on the Company’s Investor Relations page at https://investor.azz.com/
A replay of the call will be available at (855) 669-9658 or (412) 317-0088 (international), replay access code: 5871094 through April 30, 2026, or by visiting https://investor.azz.com/ for the next 12 months.
About AZZ Inc.
AZZ Inc. is the leading independent provider of hot-dip galvanizing and coil coating solutions to a broad range of end-markets. Collectively, our business segments provide sustainable, unmatched metal coating solutions that enhance the longevity and appearance of buildings, products and infrastructure that are essential to everyday life. For more information, please refer to www.azz.com.
Safe Harbor Statement
Certain statementsherein about our expectations of future events or results constitute forward-looking statements for purposes of the safe harbor provisions of The Private Securities Litigation Reform Act of 1995. You can identify forward-looking statements by terminology such as “may,” “could,” “should,” “expects,” “plans,” “will,” “might,” “would,” “projects,” “currently,” “intends,” “outlook,” “forecasts,” “targets,” “anticipates,” “believes,” “estimates,” “predicts,” “potential,” “continue,” or the negative of these terms or other comparable terminology. Such forward-looking statements are based on currently available competitive, financial, and economic data and management’s views and assumptions regarding future events. Such forward-looking statements are inherently uncertain, and investors must recognize that actual results may differ from those expressed or implied in the forward-looking statements. Forward-looking statements speak only as of the date they are made and are subject to risks that could cause them to differ materially from actual results. Certain factors could affect the outcome of the matters describedherein. This press release may contain forward-looking statements that involve risks and uncertainties including, but not limited to, changes in customer demand for our manufactured solutions, including demand by the construction markets, the industrial markets, and the metal coatings markets. We could also experience additional increases in labor costs, components and raw materials including zinc and natural gas, which are used in our hot-dip galvanizing process, paint used in our coil coating process; supply-chain vendor delays; customer requested delays of our manufactured solutions; delays in additional acquisition opportunities; an increase in our debt leverage and/or interest rates on our debt, of which a significant portion is tied to variable interest rates; availability of experienced management and employees to implement AZZ’s growth strategy; a downturn in market conditions in any industry relating to the manufactured solutions that we provide; economic volatility, including a prolonged economic downturn or macroeconomic conditions such as inflation or changes in the political stability in the United States and other foreign markets in which we operate; tariffs; acts of war or terrorism inside the United States or abroad; and other changes in economic and financial conditions. AZZ has provided additional information regarding risks associated with the business, including in Part I, Item 1A. Risk Factors, in AZZ’s Annual Report on Form 10-K for the fiscal year ended February28, 2026, and other filings with the SEC, available for viewing on AZZ’s website at www.azz.com and on the SEC’s website at www.sec.gov. You are urged to consider these factors carefully when evaluating the forward-looking statements herein and are cautioned not to place undue reliance on such forward-looking statements, which are qualified in their entirety by this cautionary statement. These statements are based on information as of the datehereof and AZZ assumes no obligation to update any forward-looking statements, whether as a result of new information, future events, or otherwise.
Company Contact: David Nark, Chief Marketing, Communications, and Investor Relations Officer AZZ Inc. (817) 810-0095 www.azz.com
Investor Contact: Sandy Martin or Phillip Kupper Three Part Advisors (214) 616-2207 or (817) 368-2556 www.threepa.com
ATLANTA, GA – March 31, 2026 (NEWMEDIAWIRE) – GeoVax Labs, Inc. (Nasdaq: GOVX), a clinical-stage biotechnology company developing vaccines and immunotherapies against infectious diseases and cancer, today announced its entry into a warrant inducement agreement with existing healthcare-focused institutional investors of the Company for the immediate exercise of existing warrants (the “Existing Warrants”) to purchase up to 634,658 shares of the Company’s common stock, par value $0.001 per share (the “Common Stock”) at a reduced exercise price of $1.36 for gross cash proceeds of approximately $863,000, before deducting financial advisor fees and other transaction expenses. The Company intends to use the net proceeds from the offering for working capital and other general corporate purposes.
In consideration for the immediate exercise in full of the Existing Warrants, the investor will receive, in a private placement, new unregistered warrants to purchase up to 1,269,316 shares of Common Stock (the “New Warrants”). The New Warrants will have an exercise price of $1.36, will be initially exercisable on the date that shareholder approval of the issuance of the New Warrants is obtained (the “Approval Date”), and will expire five (5) years following the Approval Date. The closing of the warrant inducement transaction is expected to occur on or about April 1, 2026, subject to satisfaction of customary closing conditions.
The private placement of the New Warrants and the shares of Common Stock underlying the New Warrants offered to the institutional investor will be made in reliance on an exemption from registration under Section 4(a)(2) of the Securities Act of 1933, as amended (the “Securities Act”) and Regulation D promulgated thereunder. Accordingly, the securities issued in the Concurrent Private Placement may not be offered or sold in the United States except pursuant to an effective registration statement or an applicable exemption from the registration requirements of the Securities Act and such applicable state securities laws.
This press release does not constitute an offer to sell or a solicitation of an offer to buy any of the securities in this Offering, nor shall there be any sale of these securities in any state or other jurisdiction in which such offer, solicitation or sale would be unlawful prior to the registration or qualification under the securities laws of any such state or other jurisdiction.
About GeoVax
GeoVax Labs, Inc. is a clinical-stage biotechnology company focused on the development of vaccines and immunotherapies addressing high-consequence infectious diseases and solid tumor cancers. GeoVax’s priority program is GEO-MVA, a Modified Vaccinia Ankara (MVA)–based vaccine targeting mpox and smallpox. The program is advancing under an expedited regulatory pathway, with plans to initiate a pivotal Phase 3 clinical trial in the second half of 2026, to address critical global needs for expanded orthopoxvirus vaccine supply and biodefense preparedness. In oncology, GeoVax is developing Gedeptin(R), a gene-directed enzyme prodrug therapy (GDEPT) designed to enhance immune checkpoint inhibitor activity. Gedeptin has completed a multicenter Phase 1/2 clinical trial in advanced head and neck cancer and is being advanced into combination strategies, including planned neoadjuvant and first-line settings. GeoVax’s broader pipeline includes the development of GEO-CM04S1, a next-generation COVID-19 vaccine candidate being evaluated in immunocompromised and other patient populations. GeoVax maintains a global intellectual property portfolio supporting its infectious disease and oncology programs and continues to evaluate strategic partnerships and funding opportunities aligned with its development priorities. For more information, visit www.geovax.com.
Forward-Looking Statements
This release contains forward-looking statements regarding GeoVax’s business plans. The words “believe,” “look forward to,” “may,” “estimate,” “continue,” “anticipate,” “intend,” “should,” “plan,” “could,” “target,” “potential,” “is likely,” “will,” “expect” and similar expressions, as they relate to us, are intended to identify forward-looking statements. We have based these forward-looking statements largely on our current expectations and projections about future events and financial trends that we believe may affect our financial condition, results of operations, business strategy and financial needs. Actual results may differ materially from those included in these statements due to a variety of factors, including whether: GeoVax is able to obtain acceptable results from ongoing or future clinical trials of its investigational products, GeoVax’s immuno-oncology products and preventative vaccines can provoke the desired responses, and those products or vaccines can be used effectively, GeoVax’s viral vector technology adequately amplifies immune responses to cancer antigens, GeoVax can develop and manufacture its immuno-oncology products and preventative vaccines with the desired characteristics in a timely manner, GeoVax’s immuno-oncology products and preventative vaccines will be safe for human use, GeoVax’s vaccines will effectively prevent targeted infections in humans, GeoVax’s immuno-oncology products and preventative vaccines will receive regulatory approvals necessary to be licensed and marketed, GeoVax raises required capital to complete development, there is development of competitive products that may be more effective or easier to use than GeoVax’s products, GeoVax will be able to enter into favorable manufacturing and distribution agreements, and other factors, over which GeoVax has no control.
Further information on our risk factors is contained in our periodic reports on Form 10-Q and Form 10-K that we have filed and will file with the SEC. Any forward-looking statement made by us herein speaks only as of the date on which it is made. Factors or events that could cause our actual results to differ may emerge from time to time, and it is not possible for us to predict all of them. We undertake no obligation to publicly update any forward-looking statement, whether as a result of new information, future developments or otherwise, except as may be required by law.
Phase 1b norovirus challenge study is underway at Emory University School of Medicine
CDI-988 is the first oral antiviral candidate being developed for norovirus treatment and prevention
No approved treatments or vaccines are available for norovirus infection, posing a significant unmet need and contributing to a global economic burden of $60 billion annually
BOTHELL, Wash., March 31, 2026 (GLOBE NEWSWIRE) — Cocrystal Pharma, Inc. (Nasdaq: COCP) (“Cocrystal” or the “Company”) reports financial results for the year ended December 31, 2025, and provides updates on its antiviral product pipeline, upcoming milestones and business activities.
“We are delighted to report that our norovirus human challenge study evaluating efficacy and safety of CDI‑988 is underway at Emory University School of Medicine. In our first cohort, healthy subjects are being inoculated with the GII.2 (Snow Mountain Virus) strain under highly controlled conditions,” said Sam Lee, Ph.D., President and co‑CEO of Cocrystal.
“Norovirus remains a significant and underserved market. Developing an effective norovirus antiviral or vaccine has been challenging due to the high genetic and antigenic diversity of norovirus and lack of simple in vitro cell-based assays and animal model system,” Dr. Lee continued. “Using our proprietary structure‑based drug discovery platform technology, we developed CDI‑988 as a direct‑acting, oral antiviral that targets a highly conserved region of the viral 3CL protease found in all known norovirus strains. As a pan-viral 3CL protease inhibitor, CDI‑988 also holds potential as a broad‑spectrum antiviral effective against coronaviruses.”
“Norovirus outbreaks can strike at any time of year in semi-closed environments such as cruise ships, military settings, and healthcare and assisted-living facilities,” said James Martin, Cocrystal’s CFO and co-CEO. “This constant threat underscores the need for an effective oral treatment and preventive that can be deployed whenever and wherever norovirus infections emerge. With CDI-988, our goal is to provide an easy-to-administer, safe and effective drug to combat these unpredictable outbreaks. We believe CDI‑988 represents a key value-creating opportunity for our Company and our investors.”
The Phase 1b randomized, double-blind, placebo-controlled study will enroll up to 40 subjects. The study’s primary endpoint is efficacy in reducing the incidence of clinical symptoms; secondary endpoints include reduction of viral shedding and disease severity, and safety and pharmacokinetic profiles.
Antiviral Product Pipeline Overview
We leverage our innovative structure-based drug discovery platform technology to develop next-generation, broad-spectrum antivirals that effectively block viral replication. Unlike other drug discovery approaches, our technology identifies compounds that bind to highly conserved regions of viral drug targets, including proteases and replication enzymes. By specifically targeting these essential viral functions, our drug candidates maintain efficacy even as viruses mutate, while simultaneously minimizing off-target interactions that typically lead to adverse side effects. This dual advantage represents a significant breakthrough in antiviral drug development. In addition, our innovative methodology fundamentally transforms the conventional drug discovery paradigm by eliminating the inefficient, resource-intensive cycles of high-throughput compound screening and prolonged hit-to-lead optimization. The result is faster identification of promising candidates with superior resistance profiles and safety characteristics.
Norovirus Program Norovirus is a common, highly contagious virus that afflicts people of all ages and causes symptoms of acute gastroenteritis including nausea, vomiting, stomach pain and diarrhea, as well as fatigue, fever and dehydration. There are currently no effective treatments or vaccines for norovirus, and the ability to curtail outbreaks is inadequate.
Oral protease inhibitor CDI-988 for the treatment of noroviruses and coronaviruses: Our novel, broad-spectrum 3CL protease inhibitor CDI-988 is designed as a potential treatment for noroviruses and coronaviruses. CDI-988 has shown in vitro activity against multiple norovirus strains.
In April 2025 we announced that CDI-988 showed superior broad-spectrum antiviral activity against the norovirus GII.17 strain, the most prevalent strain in the U.S. and Europe in 2024-2025.
In August 2025 we presented favorable Phase 1 safety and tolerability data from all CDI-988 doses, including a high-dose 1200 mg cohort, at the 2025 Military Health System Research Symposium (MHSRS).
In September 2025 we discussed CDI-988’s scientific foundation and clinical progress in an oral presentation at the 9th International Calicivirus Conference, the leading calicivirus scientific meeting.
In September 2025 we received a Study May Proceed Letter from the FDA to conduct a Phase 1b challenge study in the U.S. evaluating CDI-988 as a norovirus preventive and treatment.
In March 2026 we enrolled the first subjects in our Phase 1b challenge study with the initial cohort evaluating the infectivity rate of the GII.2 challenge inoculum, and subsequent cohorts to be orally administered CDI-988 or placebo.
Influenza Programs Influenza is a major global health threat that may become more challenging to treat due to the emergence of highly pathogenic avian influenza viruses and resistance to approved influenza antivirals. Currently approved antiviral treatments for influenza are effective but are burdened with significant viral resistance.
CC-42344 is our novel PB2 inhibitor that showed excellent in vitro activity against pandemic and seasonal influenza A strains, as well as against strains that are resistant to Tamiflu® and Xofluza®.
Oral CC-42344 as a treatment for pandemic and seasonal influenza A
In December 2022 we reported favorable Phase 1 safety and tolerability results.
In December 2023 we began a randomized, double-blind, placebo-controlled Phase 2a human challenge study to evaluate the safety, tolerability, and viral and clinical measurements of CC-42344 in influenza A-infected subjects in the United Kingdom, following authorization from the UK Medicines and Healthcare Products Regulatory Agency.
In May 2025 we reported that CC-42344 was shown to be active against the highly pathogenic 2024 Texas H5N1 avian influenza strain.
In November 2025 an initial Phase 2a study was completed, with CC-42344 showing a favorable safety and tolerability profile with no serious adverse events and no drug-related discontinuations by study participants. Efficacy analyses were not reported due to issues with trial conduct.
We plan to continue development of oral CC-42344 as a treatment for pandemic and seasonal influenza A with an additional Phase 2a study.
Inhaled CC-42344 as prophylaxis and treatment for pandemic and seasonal influenza A
Our preclinical testing showed superior pulmonary pharmacology with CC-42344, including high exposure to drug and a long half-life.
We have developed a dry powder inhalation formulation and have completed toxicology studies.
Influenza A/B program
In October 2025 we received a $500,000 Small Business Innovation Research Phase I award from the NIH’s National Institute of Allergy and Infectious Diseases to support the development of a novel, broad-spectrum lead candidate targeting the influenza A/B polymerase complex.
SARS-CoV-2 and Other Coronavirus Program By targeting viral replication enzymes and proteases, we believe it is possible to develop effective treatments for all diseases caused by coronaviruses including SARS-CoV-2 and its variants, Severe Acute Respiratory Syndrome (SARS) and Middle East Respiratory Syndrome. CDI-988 showed potent in vitro pan-viral activity against common human coronaviruses, rhinoviruses and respiratory enteroviruses, as well as against noroviruses. By the end of 2031, the global COVID-19 therapeutics market is estimated to exceed $16 billion annually.
Oral protease inhibitor CDI-988 for the treatment of coronaviruses and noroviruses: CDI-988 exhibited superior in vitro potency against SARS-CoV-2 and demonstrated a favorable safety profile and pharmacokinetic properties.
In August 2025 we presented favorable safety and tolerability Phase 1 data from all CDI-988 doses, including a high-dose 1200 mg cohort, at the MHSRS.
We are currently pursuing further development of CDI-988 as a prophylaxis and treatment for norovirus and remain optimistic about its viability as a treatment for coronaviruses.
2025 Financial Results
Research and development expenses for 2025 were $5.1 million compared with $12.5 million for 2024, with the decrease primarily due to lower costs with the winddown of the Phase 2a influenza study and reduction in employee-related expenses. General and administrative expenses for 2025 were $4.0 million compared with $5.3 million for 2024, with the decrease primarily due to a reduction in compensation, insurance and corporate expenses.
Net loss for 2025 was $8.8 million, or $0.78 per share, compared with a net loss for 2024 of $17.5 million, or $1.72 per share.
Cocrystal reported unrestricted cash as of December 31, 2025, of $7.7 million compared with $9.9 million as of December 31, 2024. Net cash used in operating activities for 2025 was $8.2 million compared with $16.5 million for 2024. The Company had working capital of $5.9 million and 11.3 million common shares outstanding as of December 31, 2025.
About Cocrystal Pharma, Inc.
Cocrystal Pharma, Inc. is a clinical-stage biotechnology company discovering and developing novel antiviral therapeutics that target the replication process of noroviruses, influenza viruses, coronaviruses (including SARS-CoV-2) and hepatitis C viruses. Cocrystal employs unique structure-based technologies and Nobel Prize-winning expertise to create viable antiviral drugs. For further information about Cocrystal, please visit www.cocrystalpharma.com.
Cautionary Note Regarding Forward-Looking Statements This press release contains forward-looking statements within the meaning of the Private Securities Litigation Reform Act of 1995, including statements regarding our plans for the future development of preclinical and clinical product candidates, the and the potential characteristics and benefits of and market for our product candidates. The words “believe,” “may,” “estimate,” “continue,” “anticipate,” “intend,” “should,” “plan,” “could,” “target,” “potential,” “is likely,” “will,” “expect” and similar expressions, as they relate to us, are intended to identify forward-looking statements. We have based these forward-looking statements largely on our current expectations and projections about future events. Some or all of the events anticipated by these forward-looking statements may not occur. Important factors that could cause actual results to differ from those in the forward-looking statements include, but are not limited to, the risks and uncertainties arising from inflation, affordability, a deteriorating labor market, the possibility of recession, increases or other developments with respect to interest rates, uncertainty surrounding the impacts arising from imposed and threatened tariffs and developments with respect thereto, and wars and geopolitical conflicts including those in the Middle East and Ukraine on our Company, our collaboration partners, and on the U.S. and global economies, including manufacturing and research delays arising from raw materials and labor shortages, supply chain disruptions and other business interruptions including any adverse impacts on our ability to obtain raw materials and test animals as well as similar problems with our vendors and our current and any future CROs and CMOs, the progress and results of the studies for CC-42344 and CDI-988 including issues with the initial Phase 2a study for CC-42344 which will prolong the development timeline of such product candidate, the ability of our CROs to recruit volunteers for, and to proceed with, clinical studies, our and our collaboration partners’ technology and software performing as expected, financial difficulties experienced by certain partners, the results of future preclinical and clinical trials, general risks arising from clinical trials, receipt of regulatory approvals, regulatory changes including based on initiatives and actions taken by the Trump Administration which could, among other things, result in delays in regulatory approvals or limit access to federal funding for our programs, development of effective treatments and/or vaccines by competitors, including as part of the programs financed by the U.S. government, and potential mutations in a virus we are targeting which may result in variants that are resistant to a product candidate we develop. Further information on our risk factors is contained in our filings with the SEC, including the “Risk Factors” in Item 1A of our Annual Report on Form 10-K for the year ended December 31, 2025. Any forward-looking statement made by us herein speaks only as of the date on which it is made. Factors or events that could cause our actual results to differ may emerge from time to time, and it is not possible for us to predict all of them. We undertake no obligation to publicly update any forward-looking statement, whether as a result of new information, future developments or otherwise, except as may be required by law.
Investor Contact: Alliance Advisors IR Jody Cain 310-691-7100 [email protected]
Nutriband has selected the commercial worldwide brand name for its lead product, an abuse deterrent fentanyl transdermal system, and will submit to the FDA for approval per FDA Guidance.
Nutriband partnered with Brand Institute, Inc, the global leader in pharmaceutical and healthcare-related brand name and identity development.
ORLANDO, Fla., March 30, 2026 (GLOBE NEWSWIRE) — Nutriband Inc. (NASDAQ:NTRB)(NASDAQ:NTRBW), a company engaged in the development of prescription transdermal pharmaceutical products, today announced that it has selected the commercial worldwide brand name candidate for its lead product, an abuse deterrent fentanyl transdermal system. The proposed brand name and product labeling will be submitted to the FDA and other international regulatory agencies for review and approval. In addition, the selected name is being submitted to the United States Patent and Trademark Office for trademark registration and to secure full intellectual property rights in the United States and internationally.
The company engaged Brand Institute, Inc, the global leader in pharmaceutical and healthcare-related brand name and identity development services to develop the worldwide commercial brand name and visual identity for the product. This product utilizes Nutriband’s AVERSA™ abuse deterrent transdermal technology and has the potential to be the world’s first abuse-deterrent patch designed to deter the abuse and misuse and reduce the risk of accidental exposure of transdermal fentanyl.
Nutriband’s abuse deterrent fentanyl transdermal system has the potential to reach peak annual US sales of $80 million to $200 million.1 While initially concentrating on the US market, the unmet medical need for adequate pain management is a global problem, and the product is in development for all major medical markets worldwide.
Developing a proprietary brand name for a prescription drug product is a critical element in drug product development because the end users (doctors, pharmacists, patients) must be able to easily distinguish a proprietary name from other drug names that are phonetically similar (sound-alike names) or similar in their spelling or appearance (look-alike names). In addition, if the drug name is otherwise confusing or misleading, the patient might receive the wrong product and the subsequent medication error could lead to significant harm to the patient.
Brand Institute has been leading the market for over 20 years with a 75% share of drug name approvals globally, including 87% of FDA approved names in 2024. In addition, Brand Institute has been responsible for many of the opioid chronic pain product brand names and specifically a majority of the abuse deterrent opioid product brand names approved by FDA for sale in the United States.
Drug Safety Institute (DSI), a wholly owned regulatory subsidiary of Brand Institute, will provide regulatory services, solutions and support on the project. DSI is led by former officials from US Food & Drug Administration (FDA), European Medicines Agency (EMA), Health Canada (HC), United States Adopted Name Council (USAN), and World Health Organization (WHO) who co-authored the naming guidance documents while with their former respective agencies.
Nutriband’s AVERSA™ abuse-deterrent technology is utilized to incorporate aversive agents into transdermal patches to prevent the abuse, diversion, misuse, and accidental exposure of drugs with abuse potential including opioids and stimulants. The AVERSA™ abuse deterrent technology is protected by a broad international intellectual property portfolio with patents issued in 46 countries including the United States, Europe, Japan, Korea, Russia, China, Canada, Mexico, and Australia.
1 Health Advances Aversa Fentanyl market analysis report 2022
About AVERSA™ Abuse-Deterrent Transdermal Technology
Nutriband’s AVERSA™ abuse-deterrent transdermal technology incorporates aversive agents into transdermal patches to prevent the abuse, diversion, misuse, and accidental exposure of drugs with abuse potential. The AVERSA™ abuse-deterrent technology has the potential to improve the safety profile of transdermal drugs susceptible to abuse, such as fentanyl, while making sure that these drugs remain accessible to those patients who really need them. The technology is covered by a broad intellectual property portfolio with patents granted in the United States, Europe, Japan, Korea, Russia, China, Canada, Mexico, and Australia.
About Nutriband, Inc.
We are primarily engaged in the development of a portfolio of transdermal pharmaceutical products. Our lead product under development is an abuse-deterrent fentanyl patch incorporating our AVERSA™ abuse-deterrent technology. AVERSA™ technology can be incorporated into any transdermal patch to prevent the abuse, misuse, diversion, and accidental exposure of drugs with abuse potential.
The Company’s website is www.nutriband.com. Any material contained in or derived from the Company’s websites or any other website is not part of this press release.
About Brand Institute, Inc., and wholly owned regulatory subsidiary, Drug Safety Institute
Brand Institute is the global leader in pharmaceutical and healthcare-related name development, with a portfolio of over 5,000 marketed healthcare brand names and 1,800 USAN/INN nonproprietary names for nearly 1,600 clients. The company partners on over 75% of pharmaceutical brand and nonproprietary name approvals globally every year with healthcare manufacturers. Drug Safety Institute is composed of former naming regulatory officials from global government health agencies, including Food and Drug Administration (FDA), European Medicines Agency (EMA), Health Canada (HC), American Medical Association (AMA), and the World Health Organization (WHO). These regulatory experts co-authored the name review guidelines while with their former respective agencies, with many responsible for ultimately approving (or rejecting) brand name applications to ensure safety and prevent medication errors. To learn more about Brand Institute’s capabilities and experience, please visit www.brandinstitute.com and contact your local Brand Institute representative.
Forward-Looking Statements
Certain statements contained in this press release, including, without limitation, statements containing the words “believes,” “anticipates,” “expects” and words of similar import, constitute “forward-looking statements” within the meaning of the Private Securities Litigation Reform Act of 1995. Such forward-looking statements involve both known and unknown risks and uncertainties. The Company’s actual results may differ materially from those anticipated in its forward-looking statements as a result of a number of factors, including those including the Company’s ability to develop its proposed abuse-deterrent fentanyl transdermal system and other proposed products, its ability to obtain patent protection for its abuse technology, its ability to obtain the necessary financing to develop products and conduct the necessary clinical testing, its ability to obtain Federal Food and Drug Administration approval to market any product it may develop in the United States and to obtain any other regulatory approval necessary to market any product in other countries, including countries in Europe, its ability to market any product it may develop, its ability to create, sustain, manage or forecast its growth; its ability to attract and retain key personnel; changes in the Company’s business strategy or development plans; competition; business disruptions; adverse publicity and international, national and local general economic and market conditions and risks generally associated with an undercapitalized developing company, as well as the risks contained under “Risk Factors” and “Management’s Discussion and Analysis of Financial Condition and Results of Operations” in the Company’s Form S-1, Forms 10-K’s and Forms 10-Q’s, and the Company’s other filings with the Securities and Exchange Commission. Except as required by applicable law, we undertake no obligation to revise or update any forward-looking statements to reflect any event or circumstance that may arise after the date hereof.
Nutriband is a registered trademark of Nutriband, Inc. AVERSA is a trademark of Nutriband, Inc.
Brand Institute and Drug Safety Institute are registered trademarks of Brand Institute, Inc.
2025 marked transition of PrimeC into a late-stage clinical asset with FDA-cleared Phase 3 program in ALS
Statistically significant survival benefit demonstrated, including 65% reduction in risk of death and >14-month median survival advantage
Results published in JAMA Neurology, providing high-level peer-reviewed validation of clinical and biological activity
Advancing toward key regulatory milestones with planned pre-NDS meeting in Canada and near-term Alzheimer’s readout
CAMBRIDGE, Mass., March 31, 2026 /PRNewswire/ — NeuroSense Therapeutics Ltd. (Nasdaq: NRSN) (“NeuroSense” or the “Company”), a late-stage clinical biotechnology company developing treatments for severe neurodegenerative diseases, today reported its financial results for the year ended December 31, 2025 and provided a business update.
“2025 was a transformational year for NeuroSense, as we advanced PrimeC from a successful Phase 2b program into a late-stage clinical asset with a clear regulatory path forward,” said Alon Ben-Noon, Chief Executive Officer of NeuroSense. “As we entered 2026, we further strengthened our clinical and scientific foundation with statistically significant survival data and publication of our results in JAMA Neurology. Together, these milestones position PrimeC as a differentiated therapeutic candidate with the potential to meaningfully impact people with ALS and potentially other neurodegenerative diseases.”
Business Highlights from 2025
2025 marked a transformative year for NeuroSense, as the Company advanced PrimeC from a successful Phase 2b program into a late-stage clinical asset with a clearly defined regulatory and development pathway. Results from the Phase 2b PARADIGM study demonstrated approximately 33% slowing in disease progression over 18 months, alongside a substantial reduction in ALS-related complications. During the year, NeuroSense further strengthened its data package through additional biomarker analyses, including microRNA data, supporting the biological activity of PrimeC, supporting PrimeC’s potential as a disease-modifying therapy.
The Company also completed commercial-scale manufacturing and advanced its regulatory strategy, including engagement with Health Canada and ongoing partnership discussions.
Importantly, in November 2025, NeuroSense received FDA clearance to initiate the PARAGON Phase 3 trial in ALS, marking a key inflection point in the Company’s development trajectory.
NeuroSense also reported early signals of biological activity and statistically significant reductions in key biomarkers associated with Alzheimer’s disease, supporting broader potential across neurodegenerative diseases.
Recent Developments and First Quarter 2026 Highlights
Since the beginning of 2026, NeuroSense has continued to strengthen PrimeC’s position through significant clinical and scientific milestones. The Company reported statistically significant survival data from its Phase 2b study, demonstrating a 65% reduction in the risk of death and a greater than 14-month median survival benefit.
Further reinforcing the strength of its clinical package, results from the PARADIGM trial were published in JAMA Neurology, highlighting meaningful clinical outcomes and biological activity, including biomarker changes consistent with the proposed mechanism of action.
NeuroSense also expanded its scientific visibility through presentations at leading international conferences and strengthened its intellectual property portfolio with newly granted patents in the United States and internationally. In addition, the Company enhanced its Scientific Advisory Board with leading experts to support continued development in ALS and Alzheimer’s disease.
Upcoming Expected Milestones
Additional biomarkers readouts from PARADIGM
Readouts from the Phase 2 Alzheimer’s study
Planned pre-NDS meeting with Health Canada in May 2026
Potential NDS submission in Canada, subject to regulatory feedback
Continued preparation for initiation of the Phase 3 PARAGON trial in ALS
Financial Results
Research and development expenses for the years ended December 31, 2025 and 2024 were $6.2 million and $5.7 million, respectively. The increase of $0.5 million, or 8.8%, was mainly attributed to an increase in share-based payment expenses and increase in our salaries and social benefits expenses which were partly offset by a decrease of our expenses to subcontractors and consultants.
General and administrative expenses for the years ended December 31, 2025 and 2024 were $4.9 million and $4.2 million, respectively. The increase of $0.7 million, or 16.6%, was mainly attributed to an increase in share-based compensation.
As of December 31, 2025, NeuroSense had cash of approximately $0.2 million.
A summary of NeuroSense’s consolidated financial results is included in the tables below.
A copy of the Company’s annual report on Form 20-F for the year ended December 31, 2025 has been filed with the U.S. Securities and Exchange Commission at https://www.sec.gov/ and posted on the Company’s investor relations website at https://neurosense.investorroom.com/sec-filings. The Company will deliver a hard copy of its annual report, including its complete audited financial statements, free of charge, to its shareholders upon request at [email protected].
About NeuroSense
NeuroSense Therapeutics, Ltd. is a clinical-stage biotechnology company focused on discovering and developing treatments for patients suffering from debilitating neurodegenerative diseases. NeuroSense believes that these diseases, which include amyotrophic lateral sclerosis (ALS), Alzheimer’s disease and Parkinson’s disease, among others, represent one of the most significant unmet medical needs of our time, with limited effective therapeutic options available for patients to date. Due to the complexity of neurodegenerative diseases and based on strong scientific research on a large panel of related biomarkers, NeuroSense’s strategy is to develop combined therapies targeting multiple pathways associated with these diseases.
For additional information, we invite you to visit our website and follow us on LinkedIn, YouTube and X. Information that may be important to investors may be routinely posted on our website and these social media channels.
About PrimeC
PrimeC, NeuroSense’s lead drug candidate, is a novel extended-release oral formulation composed of a unique fixed-dose combination of two FDA-approved drugs: ciprofloxacin and celecoxib. PrimeC is designed to synergistically target several key mechanisms of ALS and AD, that contribute to neuron degeneration, inflammation, iron accumulation and impaired ribonucleic acid (“RNA”) regulation to potentially inhibit the progression of ALS and AD.
About ALS
Amyotrophic lateral sclerosis (“ALS”) is an incurable neurodegenerative disease that causes complete paralysis and death within 2-5 years from diagnosis. Every year, more than 5,000 people are diagnosed with ALS in the U.S. alone, with an annual disease burden of $1 billion. The number of people living with ALS is expected to grow by 24% by 2040 in the U.S. and EU.
Forward-Looking Statements
This press release contains “forward-looking statements” that are subject to substantial risks and uncertainties. All statements, other than statements of historical fact, contained in this press release are forward-looking statements. Forward-looking statements contained in this press release may be identified by the use of words such as “anticipate,” “believe,” “contemplate,” “could,” “estimate,” “expect,” “intend,” “seek,” “may,” “might,” “plan,” “potential,” “predict,” “project,” “target,” “aim,” “should,” “will” “would,” or the negative of these words or other similar expressions, although not all forward-looking statements contain these words. Forward-looking statements are based on NeuroSense Therapeutics’ current expectations and are subject to inherent uncertainties, risks and assumptions that are difficult to predict and include statements regarding the timing of regulatory filings, reporting of data, meetings and regulatory decisions. Further, certain forward-looking statements, including statements regarding future development of PrimeC, are based on assumptions as to future events that may not prove to be accurate. The future events and trends may not occur and actual results could differ materially and adversely from those anticipated or implied in the forward looking statements. These risks include the uncertainty regarding the timing of regulatory filings, meetings and regulatory decisions; outcomes and the timing of current and future clinical trials; the risk the PrimeC will not advance towards later-stage development, timing for reporting data, including from the study of PrimeC in Alzheimer’s disease; that the study will not be successful; the ability of NeuroSense to remain listed on Nasdaq; and other risks and uncertainties set forth in NeuroSense’s filings with the Securities and Exchange Commission (SEC). You should not rely on these statements as representing our views in the future. More information about the risks and uncertainties affecting NeuroSense is contained under the heading “Risk Factors” in the Annual Report on Form 20-F filed with the Securities and Exchange Commission on March 31, 2026 and NeuroSense’s subsequent filings with the SEC. Forward-looking statements contained in this announcement are made as of this date, and NeuroSense undertakes no duty to update such information except as required under applicable law.
Potential breakthrough therapeutic targets $50B+ global immunotherapy market1
CHICAGO, March 31, 2026 (GLOBE NEWSWIRE) — MAIA Biotechnology, Inc. (NYSE American: MAIA) (“MAIA”, the “Company”), a clinical-stage biopharmaceutical company focused on developing targeted immunotherapies for cancer, today announced highlights from a poster presented on March 27, 2026, at the European Lung Cancer Congress 2026 (ELCC), a premier thoracic oncology forum held March 25-28, 2026, in Copenhagen, Denmark.
MAIA reports overall survival (OS) beyond two years for eight patients treated with ateganosine sequenced with cemiplimab in Parts A and B of its ongoing Phase 2 THIO-101 clinical trial in non-small cell lung cancer (NSCLC). The patients did not receive subsequent lines of therapy.
The eight patients featured in the poster include:
1 patient in third-line (3L) therapy with survival of 33 months. Expected survival in this heavily pre-treated population is 5.8 months.2
4 patients in 2L therapy with survival over 30 months. Documented OS for standard of care treatment (chemotherapy or checkpoint inhibitors alone) in second-line (2L) therapy is 10.5 months.3
All patients have failed previous treatment (prior to THIO-101) with a checkpoint inhibitor (CPI) alone.
All patients completed 29-34 cycles of therapy, except for 1 patient who completed 2 cycles of therapy with survival follow-up of 725 off therapy.
5 of the 8 patients have survival follow-up ongoing.
“It’s very encouraging to see such outstanding survival from these patients extending beyond our 24-month trial protocol and without any subsequent treatment. OS surpassing two-years bodes well as we continue to monitor patients in our ongoing Phase 3 pivotal trial and in THIO-101 Part C,” said Vlad Vitoc, M.D., Founder and Chief Executive Officer of MAIA. “These results illuminate ateganosine’s valuable role in targeting telomeres to eliminate NSCLC tumor cells and support this treatment—ateganosine sequenced by a CPI—as a potential breakthrough therapeutic option for NSCLC.”
THIO-101 treated 79 patients in Parts A and B of the trial. The Part C expansion is currently enrolling up to 48 participants in Asia and Europe. Treatment with ateganosine followed by cemiplimab (Libtayo®) has shown an acceptable safety profile to date in a heavily pre-treated population.
Ateganosine (THIO, 6-thio-dG or 6-thio-2’-deoxyguanosine) is a first-in-class investigational telomere-targeting agent currently in clinical development to evaluate its activity in non-small cell lung cancer (NSCLC). Telomeres, along with the enzyme telomerase, play a fundamental role in the survival of cancer cells and their resistance to current therapies. The modified nucleotide 6-thio-2’-deoxyguanosine induces telomerase-dependent telomeric DNA modification, DNA damage responses, and selective cancer cell death. Ateganosine-damaged telomeric fragments accumulate in cytosolic micronuclei and activates both innate (cGAS/STING) and adaptive (T-cell) immune responses. The sequential treatment of ateganosine followed by PD-(L)1 inhibitors resulted in profound and persistent tumor regression in advanced, in vivo cancer models by induction of cancer type–specific immune memory. Ateganosine is presently developed as a second or later line of treatment for NSCLC for patients that have progressed beyond the standard-of-care regimen of existing checkpoint inhibitors.
About THIO-101 Phase 2 Clinical Trial
THIO-101 is a multicenter, open-label, dose finding Phase 2 clinical trial. It is the first trial designed to evaluate ateganosine’s anti-tumor activity when followed by PD-(L)1 inhibition. The trial is testing the hypothesis that low doses of ateganosine administered prior to cemiplimab (Libtayo®) will enhance and prolong immune response in patients with advanced NSCLC who previously did not respond or developed resistance and progressed after first-line treatment regimen containing another checkpoint inhibitor. The trial design has two primary objectives: (1) to evaluate the safety and tolerability of ateganosine administered as an anticancer compound and a priming immune activator (2) to assess the clinical efficacy of ateganosine using Overall Response Rate (ORR) as the primary clinical endpoint. The expansion of the study will assess overall response rates (ORR) in advanced NSCLC patients receiving third line (3L) therapy who were resistant to previous checkpoint inhibitor treatments (CPI) and chemotherapy. Treatment with ateganosine followed by cemiplimab (Libtayo®) has shown an acceptable safety profile to date in a heavily pre-treated population. For more information on this Phase II trial, please visit ClinicalTrials.gov using the identifier NCT05208944.
About MAIA Biotechnology, Inc.
MAIA is a targeted therapy, immuno-oncology company focused on the development and commercialization of potential first-in-class drugs with novel mechanisms of action that are intended to meaningfully improve and extend the lives of people with cancer. Our lead program is ateganosine (THIO), a potential first-in-class cancer telomere targeting agent in clinical development for the treatment of NSCLC patients with telomerase-positive cancer cells. For more information, please visit www.maiabiotech.com.
Forward Looking Statements
MAIA cautions that all statements, other than statements of historical facts contained in this press release, are forward-looking statements. Forward-looking statements are subject to known and unknown risks, uncertainties, and other factors that may cause our or our industry’s actual results, levels or activity, performance or achievements to be materially different from those anticipated by such statements. The use of words such as “may,” “might,” “will,” “should,” “could,” “expect,” “plan,” “anticipate,” “believe,” “estimate,” “project,” “intend,” “future,” “potential,” or “continue,” and other similar expressions are intended to identify forward looking statements. However, the absence of these words does not mean that statements are not forward-looking. For example, all statements we make regarding (i) the initiation, timing, cost, progress and results of our preclinical and clinical studies and our research and development programs, (ii) our ability to advance product candidates into, and successfully complete, clinical studies, (iii) the timing or likelihood of regulatory filings and approvals, (iv) our ability to develop, manufacture and commercialize our product candidates and to improve the manufacturing process, (v) the rate and degree of market acceptance of our product candidates, (vi) the size and growth potential of the markets for our product candidates and our ability to serve those markets, and (vii) our expectations regarding our ability to obtain and maintain intellectual property protection for our product candidates, are forward looking. All forward-looking statements are based on current estimates, assumptions and expectations by our management that, although we believe to be reasonable, are inherently uncertain. Any forward-looking statement expressing an expectation or belief as to future events is expressed in good faith and believed to be reasonable at the time such forward-looking statement is made. However, these statements are not guarantees of future events and are subject to risks and uncertainties and other factors beyond our control that may cause actual results to differ materially from those expressed in any forward-looking statement. Any forward-looking statement speaks only as of the date on which it was made. We undertake no obligation to publicly update or revise any forward-looking statement, whether as a result of new information, future events or otherwise, except as required by law. In this release, unless the context requires otherwise, “MAIA,” “Company,” “we,” “our,” and “us” refers to MAIA Biotechnology, Inc. and its subsidiaries.
Encouraging Phase 2 HIT data and recent FDA feedback support continued advancement of CAD-1005 as Cadrenal’s near-term development priority; broader 12-LOX platform remains a longer-term opportunity
PONTE VEDRA, Fla., March 31, 2026 (GLOBE NEWSWIRE) — Cadrenal Therapeutics, Inc. (Nasdaq: CVKD), a late-stage biopharmaceutical company advancing novel therapies for life-threatening immune and thrombotic conditions, today reported its financial results for the fourth quarter and full year ended December 31, 2025, and provided a corporate update highlighting recent progress across its CAD-1005 program for HIT and broader 12-LOX inhibitor platform. The update reflects continued progress for CAD-1005, Cadrenal’s first-in-class 12-LOX inhibitor for suspected heparin-induced thrombocytopenia (HIT), including completion of its End-of-Phase 2 (EOP2) meeting with the U.S. Food and Drug Administration (FDA) on March 26, 2026, to align on the proposed Phase 3 pivotal trial of CAD-1005 in patients with HIT.
Recent Highlights
Reported encouraging results from a randomized, blinded, placebo-controlled Phase 2 study of CAD-1005 in HIT, with fewer new or worsening thrombotic events observed in patients treated with CAD-1005 on a background of standard anticoagulant therapy.
Observed a greater than 25% absolute reduction in thrombotic events in the CAD-1005 treatment arm versus placebo, while also gaining important insight that platelet count recovery may not be an appropriate surrogate endpoint for clinical efficacy in HIT.
On March 26, 2026, the Company completed its End-of-Phase 2 meeting with the FDA and clarified a potential registrational path for its planned Phase 3 pivotal trial.
Incorporation of FDA feedback into Phase 3 protocol is currently underway.
Continued to position CAD-1005 as the only selective 12-LOX inhibitor currently in clinical development, supported by Orphan Drug and Fast Track designations from the FDA and orphan drug status from the European Medicines Agency.
While HIT remains the Company’s near-term development priority, it continues to see additional scientific support for 12-LOX inhibition beyond HIT, including research in obesity and type 2 diabetes showing potential improvements in glycemic control, pancreatic beta-cell preservation, and inflammatory signaling.
“CAD-1005 continues to reinforce our conviction that selective 12-LOX inhibition may offer a differentiated approach for patients with HIT, a life-threatening, immune-mediated prothrombotic disorder, and a serious condition with substantial unmet need,” commented Quang X. Pham, Chairman & CEO. “Despite modern care, mortality remains high (up to 18-20% in some groups), with many survivors facing limb amputations. The encouraging Phase 2 results, including the reduction in thrombotic events observed on top of standard anticoagulant therapy, further strengthen our confidence in the program and in the decision to make CAD-1005 our lead development priority.”
“The recent End-of-Phase 2 meeting with the FDA is an important milestone in clarifying the regulatory path forward for CAD-1005. As we incorporate FDA feedback and prepare for the next stage of development, we remain focused on advancing CAD-1005 as our lead priority in HIT. At the same time, we continue to evaluate longer-term opportunities across our broader 12-LOX platform and other pipeline assets to support future value creation.”
Fourth Quarter 2025 Financial Highlights Research and development expenses for the quarter ended December 31, 2025, were $0.7 million compared to $1.5 million for the same period in 2024. General and administrative expenses for the quarter ended December 31, 2025, were $2.4 million compared to $2.7 million for the same period in 2024. Cadrenal reported a net loss of $3.0 million for the quarter ending December 31, 2025, compared to $4.2 million for the same period in 2024.
On December 31, 2025, Cadrenal had cash and cash equivalents of $4.0 million. The Company is evaluating financing and strategic alternatives to support its planned clinical development activities. The Company had approximately 2.3 million shares of common stock outstanding as of December 31, 2025.
About Cadrenal Therapeutics, Inc.
Cadrenal Therapeutics, Inc. (Nasdaq: CVKD) is a late-stage biopharmaceutical company advancing novel therapies for life-threatening immune and thrombotic conditions. Its lead program, CAD-1005, is a first-in-class 12-LOX inhibitor for the treatment of heparin-induced thrombocytopenia (HIT), a deadly immune-mediated thrombotic disorder. CAD-1005 has received Orphan Drug and Fast Track designations from the U.S. Food and Drug Administration and orphan drug status from the European Medicines Agency. Second-generation 12-LOX oral therapeutics are also under development for chronic indications.
The Company’s broader pipeline features tecarfarin, a late-stage oral vitamin K antagonist designed to prevent heart attacks, strokes, and deaths due to blood clots in patients requiring chronic anticoagulation, including for patients with end-stage kidney disease and left ventricular assist devices, and frunexian, a parenteral Factor XIa inhibitor intended for use in acute hospital settings.
Any statements in this press release about future expectations, plans, and prospects, as well as any other statements regarding matters that are not historical facts, may constitute “forward-looking statements.” The words “anticipate,” “believe,” “continue,” “could,” “estimate,” “expect,” “intend,” “may,” “plan,” “potentially,” “predict,” “project,” “should,” “target,” “will,” “would” and similar expressions are intended to identify forward-looking statements, although not all forward-looking statements contain these identifying words. These statements include, without limitation, statements regarding the continued progress for CAD-1005 for suspected heparin-induced thrombocytopenia; a potential registrational path for the Company’s planned Phase 3 pivotal trial; additional scientific support for 12-LOX inhibition beyond HIT; research in obesity and type 2 diabetes showing potential improvements in glycemic control, pancreatic beta-cell preservation, and inflammatory signaling; selective 12-LOX inhibition offering a differentiated approach for patients with HIT, a serious condition with substantial unmet need; continuing to evaluate longer-term opportunities across the Company’s broader 12-LOX platform and other pipeline assets to support future value creation; the Company’s clinical development plans and timing, regulatory pathway and potential registration strategy for CAD-1005; the design and initiation of its planned Phase 3 trial, the potential therapeutic and commercial opportunity for CAD-1005 and the Company’s broader pipeline, and the Company’s capital requirements and potential financing or strategic alternatives. Actual results may differ materially from those indicated by such forward-looking statements as a result of various important factors, including the ability to continue progress CAD-1005; the ability to successfully plan a registrational path for the Company’s planned Phase 3 pivotal trial; the ability for 12-LOX inhibition to provide improvements in obesity and type 2 diabetes in glycemic control, pancreatic beta-cell preservation, and inflammatory signaling and support future value creation; the Company’s ability to raise sufficient funding to commence and complete its planned Phase 3 trial, and the other risk factors described in the Company’s Annual Report on Form 10-K for the year ended December 31, 2025, and the Company’s subsequent filings with the Securities and Exchange Commission, including subsequent periodic reports on Quarterly Reports on Form 10-Q and Current Reports on Form 8-K. Any forward-looking statements contained in this press release speak only as of the date hereof and, except as required by federal securities laws, the Company specifically disclaims any obligation to update any forward-looking statement, whether as a result of new information, future events, or otherwise.
For more information, please contact:
Lytham Partners, LLC Robert Blum, Managing Partner 602-889-9700 [email protected]
Saguenay-Lac-Saint-Jean, Quebec–(Newsfile Corp. – March 31, 2026) – First Phosphate Corp. (CSE: PHOS) (OTCQX: FRSPF) (OTCQX ADR: FPHOY) (FSE: KD0) (“First Phosphate” or the “Company“) is pleased to announce the completion of its infill drill program launched on October 21, 2025 at its Bégin-Lamarche property in Saguenay-Lac-St-Jean, Quebec.
The drilling campaign has confirmed extensive, continuous mineralization across the existing horizon of the initial resource estimate. The drill program has also discovered two new phosphate intersects located in the Northern Zone and in the Southern Zone on the eastern side of the existing mineralized zone. An additional 10,000 meters of targeted drilling was added to the initial drill program of 30,000 meters to solidify an understanding of these new intersects as well as to test additional mineralization located at depth in various areas across the Northern and Southern Zones.
The Company is currently processing the full set of drill results from its original and expanded drill campaign which totalled about 40,000 m with the goal of upgrading the geological model for the Bégin-Lamarche property in the coming weeks.
“We were able to discover, drill and create a significant geological model for the Bégin-Lamarche property all within about 3.5 years,” commented Gilles Laverdiere, Chief Geologist of First Phosphate. “Such rapid progression from initial discovery reflects the exceptional continuity of the phosphate mineralization and the efficiency of our exploration approach.”
The Company also announces that Gilles Laverdiere will be retiring as Chief Geologist following 48 years of dedicated service to the mining industry. Existing team member, Steeve Lavoie, PGeo., will assume the role of Chief Geologist. Steeve has over 20 years of experience in the mineral exploration industry, having worked most recently with Agnico Eagle Mines prior to joining First Phosphate in November 2025.
“I’d like to thank Gilles Laverdière for his dedication to First Phosphate and the Bégin-Lamarche project since its early discovery and for building our strong exploration foundation,” says First Phosphate CEO, John Passalacqua. “Most importantly, we would like to thank Gilles for delaying his retirement until he could see through Bégin-Lamarche to its resource definition and geological modelling. Gilles is a man of remarkable dedication and a true role model for the industry.”
The Company also announces today a grant of 300,000 incentive stock options (the “Options”) to Steeve Lavoie in accordance with the terms of the Company’s Omnibus Equity Incentive Plan. Each Option has an exercise price of $0.98 and expires on December 29, 2028 with 25% vesting every 6 months for two years following the date of grant. All securities issued in accordance with the Option grant are subject to a hold period of four months plus one day.
First Phosphate Bégin-Lamarche Project 2023-2026 Drill Holes
The scientific and technical information relating to First Phosphate contained in this press release has been reviewed and approved by Gilles Laverdière, P.Geo., Chief Geologist of First Phosphate and Steeve Lavoie, P,Geo., Geology Manager of First Phosphate who are qualified persons within the meaning of National Instrument 43-101 – Standards of Disclosure for Mineral Projects (“NI 43-101”).
About First Phosphate Corp.
First Phosphate (CSE: PHOS) (OTCQX: FRSPF) (OTCQX ADR: FPHOY) (FSE: KD0) is a mineral exploration and development and clean technology company dedicated to building and reshoring a vertically integrated mine-to-market supply chain for the production of LFP batteries in North America. Target markets include energy storage, data centers, robotics, mobility, and national security.
First Phosphate’s flagship Bégin-Lamarche property, located in Saguenay-Lac-Saint-Jean, Québec, Canada, represents a rare North American igneous phosphate resource producing high-purity phosphate characterized by very low levels of impurities.
Forward-Looking Information and Cautionary Statement
This release includes certain statements that may be deemed “forward-looking information”. Any statement that discusses predictions, expectations, beliefs, plans, projections, objectives, assumptions, future events or performance (often but not always using phrases such as “expects”, or “does not expect”, “is expected”, “anticipates” or “does not anticipate”, “plans”, “budget”, “scheduled”, “forecasts”, “estimates”, “believes” or “intends” or variations of such words and phrases or stating that certain actions, events or results “may” or “could”, “would”, “might” or “will” be taken to occur or be achieved) are not statements of historical fact and may be forward-looking information. In particular, of the GPI funding award under the contribution agreement with NRCan and the project funded thereby including the Company’s plans for building and onshoring a vertically integrated mine-to-market LFP battery supply chain for North America. Although the Company believes the expectations expressed in such forward-looking statements are based on reasonable assumptions, such statements are not guarantees of future performance and actual results or developments may differ materially from those forward-looking statements. Factors that could cause actual results to differ materially from those in forward-looking statements include development and exploration successes, continued availability of capital and financing, and general economic, market or business conditions. These statements are based on a number of assumptions including, among other things, assumptions regarding general business and economic conditions; there being no significant disruptions affecting the activities of the Company or inability to access required project inputs; permitting and development of the projects being consistent with the Company’s expectations; the accuracy of the current mineral resource estimates for the Company and results of metallurgical testing; certain price assumptions for P2O5 and Fe2O3; inflation and prices for Company project inputs being approximately consistent with anticipated levels; the Company’s relationship with First Nations and other Indigenous parties remaining consistent with the Company’s expectations; the Company’s relationship with other third party partners and suppliers remaining consistent with the Company’s expectations; and government relations and actions being consistent with Company expectations. Investors are cautioned that any such statements are not guarantees of future performance and actual results or developments may differ materially from those projected in the forward-looking statements. Accordingly, readers should not place undue reliance on the forward-looking information contained in this press release. The Company does not assume any obligation to update or revise its forward-looking statements, whether because of new information, future events or otherwise, except as required by applicable law. All forward-looking information contained in this release is qualified by these cautionary statements.
TNX-4800 is a long-acting anti-Borrelia burgdorferi OspA human monoclonal antibody in development as a single-dose Lyme prophylactic
Phase 1 study of TNX-4800 demonstrated safety, tolerability, and pharmacokinetics supportive of approximately four months protection
Company expects to initiate a randomized, double-blind, placebo-controlled, adaptive Phase 2 field study in the first half of 2027, pending FDA clearance
BERKELEY HEIGHTS, N.J., March 31, 2026 (GLOBE NEWSWIRE) — Tonix Pharmaceuticals Holding Corp. (Nasdaq: TNXP) (“Tonix” or the “Company”), a fully integrated, commercial biotechnology company, announced Phase 1 data of TNX-4800 (formerly known as mAb 2217LS)1,2 was presented by Mark S. Klempner, MD, professor of medicine at UMass Chan Medical School, an inventor of TNX-4800 and principal investigator of the study, on March 30, 2026, at the World Vaccine Congress Washington 2026. Tonix also announced its planned strategy for an adaptive Phase 2 field study expected to initiate in the first half of 2027, pending FDA clearance.
TNX-4800 is a long-acting borreliacidal (or bactericidal), human monoclonal antibody (mAb) with an engineered crystallizable fragment (Fc) domain for an extended half-life that targets the outer surface protein A (OspA) of Borrelia burgdorferi, which causes 99.9% of Lyme disease cases in the U.S.3,4 Tonix is developing TNX-4800, which the Company in-licensed from UMass Chan Medical School in 2025, as a prophylactic that is administered in a single subcutaneous (SC) dose expected to provide approximately four months protection to people in endemic areas during the U.S. tick season. There are currently no marketed U.S. Food and Drug Administration (FDA)-approved vaccines or prophylactics to protect against Lyme disease.
“TNX-4800 is expected to provide a preventative option to the 87 million5 people in the United States who are at high risk of contracting the disease because they live, work, or vacation in a tick-endemic area,” said Seth Lederman, MD, Chief Executive Officer of Tonix Pharmaceuticals. “As a monoclonal antibody, we believe TNX-4800 offers significant advantages over vaccines in development. Lyme disease vaccines that elicit antibodies to OspA currently in development take more than six months to offer protection and require complex immunization schedules. A previously approved anti-OspA vaccine was withdrawn due to poor uptake,6 potentially relating to its complex immunization schedule.”
Dr. Lederman continued, “TNX-4800, targeting Borrelia burgdorferi, the serotype that causes 99.9% of Lyme disease in the U.S., is a single dose subcutaneous administration that potentially offers immunity within two days for a duration of approximately four months. We believe TNX-4800’s differentiating characteristics could offer meaningful improvements for people seeking protection from Lyme disease. We believe the Phase 1 pharmacokinetic (PK) data support our plan to conduct an adaptive field study in the first half of 2027, pending FDA clearance, in which protection at four months is the primary endpoint, and protection at six months is a key secondary endpoint.”
Phase 1 Results
“Our study demonstrated potentially protective blood levels of TNX-4800 at two days, with protective blood levels sustained for at least four months due to its extended half-life design,” said Dr. Klempner. “Additionally, with its differentiated mechanism of action, TNX-4800 has the potential to provide passive immunity by directly supplying neutralizing antibodies, bypassing the need for a vaccine to induce a patient’s immune system to generate its own antibodies, which can be associated with other issues. We look forward to further clinical investigation of TNX-4800 as we strive to overcome this major public health challenge.”
The primary objective of the Phase 1 study was to evaluate the safety and tolerability of a SC injection of TNX-4800 when administered to healthy male and female subjects ages 19-65 years old. The secondary objective was to evaluate the PK of a SC dose of TNX-4800 when administered to healthy subjects. 44 subjects were enrolled, with 41 subjects completing the study. Subjects received a single SC administration of placebo or TNX-4800 at 0.5, 1.5, 5, or 10 mg/kg.
Results showed no significant clinical or laboratory safety signals, with most adverse events mild or moderate. Peak serum concentration (Cmax) increased by ~25-fold for a 20-times increase in dose. Serum TNX-4800 was measurable at earliest sampling time of two days, indicating rapid systemic absorption. TNX-4800 levels remained quantifiable for >200 days in 80% of subjects at the lowest dose, and for up to 350 days in the majority of subjects at higher doses (i.e., ≥ 1.5 mg/kg). The mean half-life ranged from 62-69 days across TNX-4800 cohorts. Serum concentrations were quantifiable for up to 12 months in most subjects.
Mean exposure for the 10 mg/kg cohort had <17% of the highest exposures in a nonclinical toxicology study.
The maximum half-life ranged from 81-104 days, with the 10mg/kg cohort at 97 days and 5mg/kg cohort at 87 days.
In the 5mg/kg dose cohort, mean serum TNX-4800 concentration was approximately 10 μg/ml at four months, which was approximately twice the minimum effective concentration, or MEC, calculated from in vitro bactericidal activity, and approximately the MEC from in vitro tick-feeding experiments. These data support Tonix’s planned evaluation of protection at four months as the proposed primary endpoint.
Adaptive Phase 2 Field Study Plans
Pending FDA clearance, the Company plans to initiate an adaptive field study in the first half of 2027. TNX-4800 will be studied in a randomized, double-blind, placebo-controlled, adaptive Phase 2 field study to evaluate the efficacy of a single SC dose of TNX-4800, 350 mg, in preventing the first occurrence of confirmed Lyme disease during the primary efficacy surveillance period (Day 3 through Month 4 following administration). Based on the Phase 1 PK data, a fixed dose of 350 mg was selected for the Phase 2 field study, which is expected to provide exposures comparable to the 5 mg/kg dose evaluated in Phase 1. Participants will include adolescents and adults 16 to 65 years of age in Lyme-endemic areas in the U.S. The primary endpoint will be the prevention of Lyme disease at four months (comparison of TNX-4800 group and placebo group). A key secondary endpoint will be the prevention of Lyme disease at six months (comparison of TNX-4800 and placebo).
The Company expects to have GMP investigational product available for clinical testing in early 2027. Additionally, if necessary and pending FDA clearance, the Company plans to initiate a controlled human infection model (CHIM) study in 2028.
A copy of Dr. Klempner’s World Vaccine Congress Washington 2026 presentation is available under the Scientific Presentations tab on the Tonix website at https://www.tonixpharma.com/scientific-presentations. The Company’s TNX-4800 specific presentation can be found under the Presentations tab on the Investors section of the Tonix website at https://ir.tonixpharma.com/presentations.
About TNX-4800 TNX-4800 (formerly known as mAb 2217LS) is a long-acting borreliacidal (or bactericidal), human monoclonal antibody with an engineered extended half-life that targets the outer-surface protein A (OspA) on Lyme-causing Borrelia bacteria. When TNX-4800-containing blood is ingested by the tick, TNX-4800 kills and blocks the maturation of Borrelia burgdorferi in the mid-gut of infected deer ticks. The Company in-licensed TNX-4800 from UMass Chan Medical School in 2025. Published work in animals showed that TNX-4800 was 95% effective at preventing infection of non-human primates after six days of exposure to ticks infected with Borrelia burgdorferi.1 TNX-4800 was derived from mAb 2217 by amino acid substitutions in its Fc domain, which serve to prolong the serum half-life. A single administration is designed to potentially provide immunity against Lyme disease within two days and maintain protective antibody levels for approximately four months, without relying on the recipient’s immune system to generate antibodies. TNX-4800 also avoids the multidose priming schedules required for OspA vaccines in development7 and the FDA-approved vaccine that was withdrawn from the market.8
About the TNX-4800 Phase 1 Study TNX-4800 was studied in a randomized, double-blind, sequential dose-escalation study (NCT04863287) that evaluated safety, tolerability, PK, and immunogenicity of TNX-4800 in healthy adults. 44 subjects were randomized, and 41 completed the study. Subjects received a single SC administration of placebo or TNX-4800 at 0.5, 1.5, 5, or 10 mg/kg. Safety was assessed via clinical and lab evaluations. Drug exposure increased by approximately 25 times for a 20-times increase in dose. Serum TNX-4800 was measurable at the earliest sampling time of two days, indicating rapid systemic absorption. TNX-4800 concentrations remained quantifiable for >200 days in 80% of volunteers at the lowest dose and for up to 350 days in the majority of volunteers at higher doses (i.e., ≥ 1.5 mg/kg). Mean half-life ranged from 62-69 days across groups. Serum concentrations remained quantifiable for up to 12 months in most subjects. Mean exposure for the 10 mg/kg cohort was less than 17% of the highest exposures in a rat toxicology study. Anti-drug antibodies were detected in <10% of treated subjects, with no impact on PK. Most adverse events were mild or moderate. TNX-4800 was determined to be generally safe and well tolerated.
About Lyme Disease In the United States, Lyme disease is caused by the bacterium Borrelia burgdorferi. Lyme disease remains the most common vector-borne infection in the United States, and its incidence is climbing each year, due in part to global changes in climate expanding the habitat range for ticks.9 It occurs most commonly in the Northeast, mid-Atlantic, and upper-Midwest regions. Lyme disease bacteria are transmitted through the bite of infected Ixodes ticks. Typical symptoms include fever, headache, fatigue, and a characteristic skin rash called erythema migrans. If left untreated, infection can spread to joints, heart, and nervous system. Laboratory testing is helpful if used correctly and performed with FDA-cleared tests. Although many cases of Lyme disease can be treated successfully with antibiotics, diagnosis and treatment are often delayed or missed. Chronic Lyme is considered an Infection Associated Chronic Illness (IACI), and is a chronic, debilitating disease state characterized by joint and muscle pain, fatigue, and other symptoms.10
Citations 1Schiller ZA, et al. J Clin Invest. 2021 131(11):e144843. 2Wang Y, et al. J Infect Dis. 2016. 214(2):205-11. 3Marques AR, et al. Emerg Infect Dis. 2021. 27(8):2017-2024. 4Pritt BS, et al. Lancet Infect Dis. 2016. 6(5):556-564. 5Kugeler KJ, et al. Emerg Infect Dis. 2021. 27(2):616-619. 6 Nigrovic LE, et al. Epidemiol Infect. 2006. Aug 8;135(1):1-8. 7Comstedt P, et al. Vaccine. 2015 33(44):5982-8. 8Connaught’s (ImuLyme™) and SmithKline Beecham’s (LYMErix™) Lyme disease vaccines were withdrawn. Nigrovic LE, et al. Epidemiol Infect. 2007 135(1):1-8. 9Gomes-Solecki M, et. al. Clin Infect Dis. 2020 70(8):1768-1773. 10National Academies of Sciences, Engineering, and Medicine. 2025. Charting a Path Toward New Treatments for Lyme Infection-Associated Chronic Illnesses. Washington, DC: The National Academies Press. https://doi.org/10.17226/28578.
Tonix Pharmaceuticals Holding Corp. Tonix Pharmaceuticals* is a fully-integrated, commercial-stage biotechnology company focused on central nervous system (CNS) and immunology treatments in areas of high unmet medical need. TONMYA® (cyclobenzaprine HCl sublingual tablets 2.8 mg), is the first new treatment for fibromyalgia in adults in more than 15 years. Tonix’s CNS commercial infrastructure supports its marketed products, including its acute migraine products, Zembrace® SymTouch® (sumatriptan injection 3 mg) and Tosymra® (sumatriptan nasal spray 10 mg). Tonix is investigating TONMYA® in Phase 2 clinical trials to evaluate its potential in major depressive disorder and acute stress disorder/acute stress reaction. In addition, the Company’s CNS portfolio includes TNX-2900 (intranasal oxytocin), which is Phase 2 ready for the treatment of Prader-Willi syndrome, a rare disease. Tonix is also advancing a pipeline of immunology programs, including TNX-4800, a Phase 2 ready long-acting human anti-Borrelia OspA monoclonal antibody (mAb) for the prevention of Lyme disease in the U.S., and TNX-1500, a Phase 2 ready third-generation CD40 ligand inhibitor for the prevention of kidney transplant rejection. To learn more, visit www.tonixpharma.com and follow the Company on LinkedIn and X.
*Tonix’s product development candidates are investigational new drugs or biologics; their efficacy and safety have not been established and have not been approved for any indication.
Zembrace SymTouch and Tosymra are registered trademarks of Tonix Medicines. TONMYA is a registered trademark of Tonix Pharma Limited. All other marks are property of their respective owners.
About UMass Chan Medical School UMass Chan Medical School, one of five campuses of the University of Massachusetts system, comprises the T.H. Chan School of Medicine, the Morningside Graduate School of Biomedical Sciences, the Tan Chingfen Graduate School of Nursing, ForHealth Consulting at UMass Chan Medical School, MassBiologics, and a thriving Nobel-Prize-winning biomedical research enterprise. UMass Chan is advancing together to improve the health and wellness of our diverse communities throughout Massachusetts and across the world by leading and innovating in education, research, health care delivery and public service. It is ranked among the best medical schools in the nation for primary care education and biomedical research by U.S. News & World Report. Learn more at www.umassmed.edu.
Forward Looking Statements Certain statements in this press release are forward-looking within the meaning of the Private Securities Litigation Reform Act of 1995 including those relating to the completion of the offering, the satisfaction of customary closing conditions, the intended use of proceeds from the offering and other statements that are predictive in nature. These statements may be identified by the use of forward-looking words such as “anticipate,” “believe,” “forecast,” “estimate,” “expect,” and “intend,” among others. There are a number of factors that could cause actual events to differ materially from those indicated by such forward-looking statements. These factors include, but are not limited to, risks related to the failure to successfully launch and commercialize TONMYA® and any of our approved products; risks related to the failure to obtain FDA clearances or approvals and noncompliance with FDA regulations; risks related to the timing and progress of clinical development of our product candidates; our need for additional financing; uncertainties of patent protection and litigation; uncertainties of government or third party payor reimbursement; limited research and development efforts and dependence upon third parties; and substantial competition. As with any pharmaceutical under development, there are significant risks in the development, regulatory approval and commercialization of new products. Tonix does not undertake an obligation to update or revise any forward-looking statement. Investors should read the risk factors set in the Company’s Annual Report on Form 10-K for the year ended December 31, 2025, as filed with the SEC on March 12, 2026, and periodic reports filed with the SEC on or after the date thereof. Tonix does not undertake an obligation to update or revise any forward-looking statement. All of Tonix’s forward-looking statements are expressly qualified by all such risk factors and other cautionary statements. The information set forth herein speaks only as of the date thereof.
SASKATOON, Saskatchewan, Canada, March 31, 2026 – MustGrow Biologics Corp. (TSXV: MGRO; OTC: MGROF; FRA: 0C0) (the “Company” or “MustGrow“), announces it is to close its wholly-owned Canadian marketing and distribution business NexusBioAg effective April 15, 2026. NexusBioAg had been re-selling and distributing third party products to Canadian farmers, a lower-margin and price-competitive business. Remaining inventory will be sold in subsequent months through existing distribution channels. MustGrow will focus its capital and resources on scaling inventory to meet accelerating demand for its mustard-derived organic biofertility product TerraSante™ in the U.S.
TerraSante™ Sales Growth
In 2025, sales demand from large U.S. commercial farmers outstripped MustGrow’s inventory production. MustGrow’s decision to focus on its proprietary TerraSante™ product in the U.S. requires more focused capital and resources to scale inventory to meet the accelerating demand MustGrow experienced in 2025, and continues to see in 2026.
In January 2026, MustGrow closed a $2 million equity financing, and the proceeds are, in part, being used to build TerraSante™ inventory to meet growing demand for the product. A $2 million credit facility via CIBC and guaranteed by Canada’s Export Development Canada (EDC) has also strengthened MustGrow’s ability to produce inventory. MustGrow utilizes multiple international third-party manufacturers to produce TerraSante™, allowing MustGrow to ramp-up production to meet sales demand, while eliminating the need to build an expensive production plant.
Additionally, MustGrow is assessing multiple global partnership opportunities to expand TerraSante™ internationally.
TerraSante™ for Soil and Ecological Health
MustGrow’s mustard-derived TerraSante™ organic biofertilizer is a wettable powder containing nutritious plant proteins and carbohydrates that feed the soil and soil microbes. TerraSante™ is currently registered and approved for sale in California, Florida, Arizona, Idaho, Oregon, and Washington State, under Organic OMRI Listed® certification and California’s Organic Input Material (OIM) Program.
MustGrow’s biofertility program focuses on soil and soil microbiome health, nutrient and water use efficiencies, and plant yields. Soil is a farmer’s most valuable asset, and MustGrow’s mustard plant-based technologies are being applied with the intention to improve the health of the soil and soil microbiome, and have a positive impact on root and plant health.
TerraSante™ contains nutritious plant proteins and carbohydrates that feed the soil and soil microbes, potentially improving beneficial microbial activity and ensuring long-term sustainable soil health. These targeted micro-communities have been shown to work to improve nutrient availability, which can potentially increase plant vigor and yields, while reducing plant stress. TerraSante™ has the potential to improve crop nutrient uptake and, hence, overall crop performance. There are no artificial additives or preservatives used during its manufacturing.
MustGrow Biologics Corp. is a provider of innovative biological and regenerative agriculture solutions designed to support sustainable farming. The Company’s technology is centered on harnessing the natural defense mechanisms and organic compounds found in mustard seed and formulating them into organic biofertility, biostimulant, and biocontrol products. These solutions are designed to protect soil health and the soil microbiome, support plant health, and contribute to global food security through more sustainable agricultural practices. In the United States, MustGrow’s flagship biofertility product, TerraSante™, is registered, organically certified, and commercially sold in key agricultural states, including California. Outside of North America, MustGrow is focused on collaborating with leading global agriculture companies, such as Bayer AG in Europe, the Middle East, and Africa, to commercialize its wholly owned proprietary products and technologies. The Company is dedicated to driving shareholder value through the commercialization and expansion of its intellectual property portfolio, which includes approximately 110 issued and pending patents. MustGrow is publicly traded on the TSX Venture Exchange under the symbol MGRO and has approximately 62.9 million common shares issued and outstanding, and approximately 77.1 million shares on a fully diluted basis.
Corey Giasson Director & CEO Phone: +1-306-668-2652 [email protected]
MustGrow Forward-Looking Statements
Certain statements included in this news release constitute “forward-looking statements” which involve known and unknown risks, uncertainties and other factors that may affect the results, performance or achievements of MustGrow.
Generally, forward-looking information can be identified by the use of forward-looking terminology such as “plans”, “expects”, “is expected”, “budget”, “estimates”, “intends”, “anticipates” or “does not anticipate”, or “believes”, or variations of such words and phrases or statements that certain actions, events or results “may”, “could”, “would”, “might”, “occur” or “be achieved”. Forward-looking statements in this news release, including statements about: the impact and significance of performance data and field testing, the timing of the closing of NexusBioAg, if at all, the future demand for the Company’s products and the use of proceeds from past financings, and are subject to a number of risks and uncertainties that may cause the actual results of MustGrow to differ materially from those discussed in such forward-looking statements, and even if such actual results are realized or substantially realized, there can be no assurance that they will have the expected consequences to, or effects on, MustGrow. Important factors that could cause MustGrow’s actual results and financial condition to differ materially from those indicated in the forward-looking statements include: those risks described in more detail in MustGrow’s Annual Information Form for the year ended December 31, 2024 and other continuous disclosure documents filed by MustGrow with the applicable securities regulatory authorities which are available on SEDAR+ at www.sedarplus.ca. Readers are referred to such documents for more detailed information about MustGrow, which is subject to the qualifications, assumptions and notes set forth therein.
Neither the TSXV, nor their Regulation Services Provider (as that term is defined in the policies of the TSXV), nor the OTC Markets has approved the contents of this release or accepts responsibility for the adequacy or accuracy of this release.
FORT WORTH, Texas, March 30, 2026 (GLOBE NEWSWIRE) — Sports Entertainment Gaming Global Corporation (NASDAQ: SEGG, LTRYW) (the “Company” or “SEGG Media”), the global sports, entertainment, and gaming group, today announced the appointments of Veloce executives Daniel Bailey as Chief Commercial Officer and Jack Clarke as Chief Strategy Officer, further strengthening our leadership team as SEGG Media moves forward in its strategic growth phase.
After completing the Veloce acquisition and materially increasing the Company’s revenue, these appointments have been made to further support SEGG Media’s 90-day plan focused on execution, integrating operations and teams, and monetizing new assets.
Operators with Proven Track Records
Daniel Bailey, Chief Commercial Officer, brings over a decade of experience in motorsport and global sports commercial strategy, having delivered $53+ million in commercial partnerships and revenue.
Mr. Bailey played a key role in scaling Veloce Media Group, including structuring the acquisition of Quadrant and securing a series of multi-million-pound funding rounds. His experience includes partnerships with global blue-chip brands and rights holders including Formula 1, VISA, Ferrari, McLaren, Mercedes, E.ON, Tencent, Sotheby’s, and Deutsche Bank.
Previously, Mr. Bailey led commercial efforts at IMG Motorsports and co-founded MPA Creative, an award-winning PR, marketing, and events agency, where he remains an active Director. MPA was named 2026 Boutique Agency of the Year at the Race Media Awards.
As Chief Commercial Officer, Mr. Bailey will lead SEGG Media’s global monetization strategy, focused on revenue growth, partnerships, and value creation across the Company’s digital ecosystem.
Jack Clarke, Chief Strategy Officer, combines elite sporting experience with high-growth media entrepreneurship. A former professional racing driver with wins and podiums in FIA Formula 2, he transitioned into business in 2015.
After roles in a sports technology investment fund and IMG, Mr. Clarke co-founded Veloce Media Group, helping build one of the fastest-growing digital motorsport and gaming media platforms globally. He played a key role in scaling Veloce’s esports operations and growing its media network to over 600 million monthly views – shaping commercial and strategic direction from inception, and driving innovation across content, partnerships, and revenue models.
As Chief Strategy Officer, Mr. Clarke will focus on enterprise strategy, capital discipline, and integration execution to ensure acquisitions translate into scalable revenue and long-term shareholder value.
Marc Bircham, Chairman of SEGG Media, commented:“We are aligning leadership for execution to deliver the results expected of us by our shareholders. Dan and Jack are operators who have built, scaled, and monetized platforms globally.”
Robert Stubblefield, Chief Financial Officer and Interim President and CEO, added:“Dan and Jack bring a rare combination of strategic discipline and commercial firepower. Their experience in scaling Veloce and delivering real revenue growth directly aligns with our priorities. We believe this significantly strengthens our ability to execute and deliver value that is not yet reflected in the market.”
Positioned for Near-Term Revenue Expansion
SEGG Media’s current initiatives are expected to:
Expand revenue through maximizing the potential of high-growth digital and media assets
Accelerate monetization for Sports.com, Concerts.com, and TicketStub.com
Unlock operating efficiencies through integration and scale
Improve financial visibility as execution milestones for revenue growth are achieved
Disciplined Strategy, High-Impact Execution
SEGG Media continues to prioritize fiscal and operating discipline and high-return initiatives, focusing on:
Near-term revenue generation
Minimizing shareholder dilution
Clear, measurable achievement that results in creating shareholder value
About SEGG Media Corporation
Sports Entertainment Gaming Global Corporation (Nasdaq: SEGG, LTRYW) is a global sports, entertainment, and gaming group operating a portfolio of digital and experiential assets including Sports.com, Concerts.com, TicketStub.com, Lottery.com, and Veloce Media Group. Through its expanding ecosystem of media, live experiences, gaming platforms, and creator-led content, the Company connects global audiences to the sports, events, and interactive entertainment they love. Focused on disciplined execution, ethical gaming, and scalable revenue generation, SEGG Media is building an integrated platform designed to drive sustainable growth and long-term shareholder value.
Important Notice Regarding Forward-Looking Statements
This press release contains statements that constitute “forward-looking statements” within the meaning of Section 27A of the Securities Act of 1933, as amended, and Section 21E of the Securities Exchange Act of 1934, as amended. All statements, other than statements of present or historical fact included in this press release, regarding the Company’s strategy, future operations, prospects, plans and objectives of management, are forward-looking statements. When used in this Form 8-K, the words “could,” “should,” “will,” “may,” “believe,” “anticipate,” “intend,” “estimate,” “expect,” “project,” “initiatives,” “continue,” the negative of such terms and other similar expressions are intended to identify forward-looking statements, although not all forward-looking statements contain such identifying words. These forward-looking statements are based on management’s current expectations and assumptions about future events and are based on currently available information as to the outcome and timing of future events. The forward-looking statements speak only as of the date of this press release or as of the date they are made. The Company cautions you that these forward-looking statements are subject to numerous risks and uncertainties, most of which are difficult to predict and many of which are beyond the control of the Company. In addition, the Company cautions you that the forward-looking statements contained in this press release are subject to risks and uncertainties, including but not limited to, any future findings from ongoing review of the Company’s internal accounting controls, additional examination of the preliminary conclusions of such review, the Company’s ability to secure additional capital resources, the Company’s ability to continue as a going concern, the Company’s ability to respond in a timely and satisfactory matter to the inquiries by Nasdaq, the Company’s ability to regain compliance with the Bid Price Requirement, the Company’s ability to regain compliance with Nasdaq Listing Rules, the Company’s ability to become current with its SEC reports, and those additional risks and uncertainties discussed under the heading “Risk Factors” in the Form 10-K/A filed by the Company with the SEC on April 22, 2025, and the other documents filed, or to be filed, by the Company with the SEC. Additional information concerning these and other factors that may impact the operations and projections discussed herein can be found in the reports that the Company has filed and will file from time to time with the SEC. These SEC filings are available publicly on the SEC’s website at www.sec.gov. Should one or more of the risks or uncertainties described in this press release materialize or should underlying assumptions prove incorrect, actual results and plans could differ materially from those expressed in any forward-looking statements. Except as otherwise required by applicable law, the Company disclaims any duty to update any forward-looking statements, all of which are expressly qualified by the statements in this section, to reflect events or circumstances after the date of this press release.
This press release was published by a CLEAR® Verified individual.
For additional information, visit www.seggmedia.com or contact media relations at [email protected].
Oxylanthanum carbonate (OLC) New Drug Application (NDA) resubmission under review by U.S. Food and Drug Administration (FDA) with a Prescription Drug User Fee Act (PDUFA) target action date of June 29, 2026
Commercial readiness activities ongoing in anticipation of potential commercial launch of OLC in 3Q26
As of March 30, 2026 unaudited cash, cash equivalents, and marketable securities totaled $54.9 million, with expected runway into 2027
LOS ALTOS, Calif., March 30, 2026 (GLOBE NEWSWIRE) — Unicycive Therapeutics, Inc. (Nasdaq: UNCY), a clinical-stage biotechnology company developing therapies for patients with kidney disease, today announced its financial results for the full year ended December 31, 2025, and provided a business update.
“This year is shaping up to be pivotal for Unicycive, underscored by the U.S. Food and Drug Administration’s acceptance of our New Drug Application resubmission for OLC and the potential for approval and launch later this year,” said Shalabh Gupta, M.D., Chief Executive Officer of Unicycive. “With hyperphosphatemia still uncontrolled in nearly 75% of U.S. patients with chronic kidney disease undergoing dialysis, OLC, if approved, has the potential to offer a meaningful new treatment option characterized by a differentiated clinical profile and reduced pill burden compared to currently available phosphate binders.”
Key Highlights & Upcoming Milestones
In January 2026, the Company announced the FDA has accepted the resubmission of its NDA for OLC, an investigational oral phosphate binder for the treatment of hyperphosphatemia in patients with CKD on dialysis. The FDA set a PDUFA target action date of June 29, 2026. The NDA is supported by data from three clinical studies (a Phase 1 study in healthy volunteers, a bioequivalence study in healthy volunteers and a tolerability study in patients with CKD on dialysis), multiple preclinical studies and chemistry, manufacturing and controls (CMC) data. The FDA did not raise any concerns regarding the preclinical, clinical or safety data for OLC included in the original NDA submission. The resubmission in December 2025 was based on the progress made by the third-party manufacturing vendor responsible for the drug product (Drug Product).
As part of Unicycive’s continued preparation to support a potential launch of OLC later this year, the Company is continuing to strengthen its commercial infrastructure and advance market readiness initiatives.
Financial Results for the Year Ended December 31, 2025
Research and Development (R&D) expenses were $9.1 million for the year ended December 31, 2025, compared to $20.0 million for the same period in 2024. The decrease in research and development expenses was primarily due to a decrease in drug development as well as clinical trial costs.
General and Administrative (G&A) expenses were $20.4 million for the year ended December 31, 2025, compared to $12.1 million for the same period in 2024. The increase was primarily due to an increase in consulting, professional services, and commercial launch preparation costs.
Other income was $3.0 million for the year ended December 31, 2025 compared to Other expense of $4.6 million in the same period in 2024 due primarily to a decrease in the fair value of the Company’s warrant liability.
Net loss attributable to common stockholders for the year ended December 31, 2025 was $26.6 million, or $1.67 per share of common stock, compared to a net loss attributable to common stockholders of $37.8 million, or $5.65 per share of common stock for the same period in 2024. The decreased net loss for the year ended December 31, 2025, was attributable primarily to the decrease in drug development and clinical trial costs.
As of March 30, 2026 unaudited cash, cash equivalents, and marketable securities totaled $54.9 million. The Company believes that it has sufficient resources to fund planned operations into 2027.
About Unicycive Therapeutics
Unicycive Therapeutics is a biotechnology company developing novel treatments for kidney diseases. Unicycive’s lead investigational treatment is oxylanthanum carbonate, a novel phosphate binding agent currently under review by the U.S. Food and Drug Administration (FDA) for the treatment of hyperphosphatemia in patients with chronic kidney disease who are on dialysis. Unicycive’s second investigational treatment UNI-494 is intended for the treatment of conditions related to acute kidney injury. It has been granted orphan drug designation (ODD) by the FDA for the prevention of Delayed Graft Function (DGF) in kidney transplant patients and has completed a Phase 1 dose-ranging safety study in healthy volunteers. For more information, please visit Unicycive.com and follow us on LinkedIn and X.
Forward-looking statements
Certain statements in this press release are forward-looking within the meaning of the Private Securities Litigation Reform Act of 1995. These statements may be identified using words such as “anticipate,” “believe,” “forecast,” “estimated” and “intend” or other similar terms or expressions that concern Unicycive’s expectations, strategy, plans or intentions. These forward-looking statements are based on Unicycive’s current expectations and actual results could differ materially. There are several factors that could cause actual events to differ materially from those indicated by such forward-looking statements. These factors include, but are not limited to, clinical trials involve a lengthy and expensive process with an uncertain outcome, and results of earlier studies and trials may not be predictive of future trial results; our clinical trials may be suspended or discontinued due to unexpected side effects or other safety risks that could preclude approval of our product candidates; our dependence on third parties for manufacturing; risks related to business interruptions, which could seriously harm our financial condition and increase our costs and expenses; dependence on key personnel; substantial competition; uncertainties of patent protection and litigation; dependence upon third parties; market acceptance of our products; and risks related to failure to obtain FDA clearances or approvals and noncompliance with FDA regulations. Actual results may differ materially from those indicated by such forward-looking statements as a result of various important factors, including: the uncertainties related to market conditions and other factors described more fully in the section entitled ‘Risk Factors’ in Unicycive’s Annual Report on Form 10-K for the year ended December 31, 2025, and other periodic reports filed with the Securities and Exchange Commission. Any forward-looking statements contained in this press release speak only as of the date hereof, and Unicycive specifically disclaims any obligation to update any forward-looking statement, whether as a result of new information, future events or otherwise.
CHARLOTTE, N.C., March 27, 2026 (GLOBE NEWSWIRE) — NN, Inc. (“NN” or the “Company”) (NASDAQ: NNBR), a global diversified industrial company that engineers and manufactures high-precision components and assemblies with six sigma quality today announced that it has acquired the large-scale automated plating operations from a leading global provider of electrical infrastructure solutions. This seller is an existing customer which is moving from in-house manufacturing to outsourced operations with this decision.
The equipment acquisition will enable NN to significantly expand its processing capabilities in silver-plated busbars and terminals among other capabilities, which are ideal electrical components for electric grid and data center equipment. This further enables NN to broaden its market aperture on growth in this area, its second largest end market.
The plating line being acquired is substantially larger and more automated than NN’s current capabilities, featuring large plating baths designed for high-volume, low-cost production. The automated plating line will enable NN to process larger parts representing a transformative expansion of its product offering in terms of size, volume, and type of plated metal products that NN will be able to deliver to its electrical customers.
NN expects this new capability to be operational at an existing facility in the fall of 2026. Financially, the new business won from this line will be inclusive to the Company’s prior guidance of $70 million to $80 million of new business wins in 2026. The capex associated with this project is inclusive to the company’s capex guidance of $20 million to $22 million in 2026. The Company is funding this strategic addition from operating cash flow.
The key end markets that will be targeted with this new capability are electric grid equipment and data center equipment. The Company is initially focused on switchgear assemblies used in emergency power generation for the grid, hospitals, and data centers.
Harold Bevis, President and Chief Executive Officer of NN, Inc., commented, “This equipment acquisition is another stepping stone for NN’s strategic pivot into certain high-value verticals that fit its operational footprint. We are adding capabilities that open up the aperture for growth in the target markets of electric grid and data center. Our plating business is known in the industry as GMF and is one of the highest gross margin plants in the NN portfolio. This is accretive business for NN. The return on investment is consistent with the ROIs that we target for new business.”
Bevis continued, “This is precisely the type of high-value, capital-efficient growth opportunity that we are focused on securing as we execute our sales growth plan. GMF has a strong reputation for quality, on-time delivery, and deep expertise in the science of electroplating. This business is key to growth in electronics, defense, electric grid, and data center. This equipment is a logical addition to our capabilities and will unlock our prospecting into larger parts, higher volume parts, bigger programs, and more customers. The equipment was acquired from a long-term NN customer, that intends to repurpose its reclaimed floor space as data center and grid infrastructure markets take off, so this is a win-win for all parties.”
“This acquisition is consistent with NN’s broader strategic transformation plan, which has already delivered three consecutive years of improved adjusted EBITDA. The Company has exited dilutive, lower-value business and is actively replacing that rationalized volume with higher-margin, accretive new growth through engineering-led new products and new program wins. NN has secured more than $200 million of new awards from its technology-based new business development program, and NN expects to launch approximately 100 awarded programs during 2026. Launched in mid-2023 under new management, the new business program is focused on leveraging the Company’s technology and operational footprint strengths into new areas. The Company is guiding to a fourth consecutive year of improved adjusted EBITDA and a materially higher amount of operating cash flow.”
Bevis continued, “NN has a couple of other small acquisitions that we are focused upon and have been working on for about a year. They are also focused on non-automotive, high-value capability expansion and profitable growth. Over the last two years most of our operating cash flow was consumed by four plant closures and severing about 800 people, which was tough and brutal for those impacted but necessary for NN’s transition.
We have turned the page onto a new chapter and have a balanced approach to our revenue growth and repositioning. We are pursuing a few target markets that require safety critical features on linchpin metal parts and assemblies. We are extremely committed to a common engineering and manufacturing platform that can deliver value-added metal part solutions in several safety-critical end markets that offer high margins due to delivering high value. These include:
High-value auto parts – our #1 end market
Electric grid and data center parts – our #2 market, on a plan to become our #1 market
Defense, weapons, and electronic parts
Medical equipment parts
Bevis concluded, “We are intentionally pricing higher on low-value, low-margin business like commodity auto. Where we can, we are repurposing existing equipment, but when we must buy new equipment, we are doing so. We do not keep these kinds of records but 2026 will probably be the most amount of new equipment installed in our company. And it is all pre-loaded with new awards. The key enablers in our success are our engineering skills and our trade secrets regarding making metals deliver exceptional functionality at scale. This is code for world-class six sigma quality processes designed around error-proof, fail-proof design-for-manufacturability. We do this through our own knowledge, co-development with our customers, and emerging AI assistance. 2026 is shaping up to be a fun year focused upon engineering-driven revenue growth.”
ABOUT GMF
GMF has supported high-reliability programs across defense, aerospace, medical, and industrial markets for more than 50 years. The division provides manual rack, barrel, and vibratory plating, stainless steel electropolishing, and a broad range of precious and non-precious metal finishes that meet stringent military and commercial specifications. GMF holds NADCAP accreditation, ISO 13485:2016, and ISO 9001:2015 certifications, and processes millions of parts annually across more than 50,000 square feet of production space. The division is noted for its reputation in high-quality production, on-time delivery, and a 50% hit rate on quoted new business, which is well above industry averages. For more information, please visit www.genmetal.com.
ABOUT NN
NN, Inc., a global diversified industrial company, combines advanced engineering and production capabilities with in-depth materials science expertise to design and manufacture high-precision components and assemblies for a variety of markets on a global basis. Headquartered in Charlotte, North Carolina, NN has facilities in North America, Europe, South America, and China. For more information about the Company and its products, please visit www.nninc.com.
Forward-Looking Statements
This press release contains express and implied forward-looking statements within the meaning of the Private Securities Litigation Reform Act of 1995, including, but not limited to, statements regarding NN’s pursuit of new end markets, NN’s competitive position in the data center market, the success of NN’s investments to meet the requirements of awarded business, and expected new business wins for 2026 and other statements that are not historical facts. Forward-looking statements generally will be accompanied by words such as “anticipate,” “believe,” “could,” “estimate,” “expect,” “forecast,” “growth,” “guidance,” “intend,” “may,” “will,” “possible,” “potential,” “predict,” “project”, “trajectory” or other similar words, phrases or expressions. Forward-looking statements involve a number of risks and uncertainties that are outside of management’s control and that may cause actual results to be materially different from such statements. Such factors include, among others, general economic conditions and economic conditions in the industrial sector; material changes in the costs and availability of raw materials; the level of our indebtedness; our ability to secure, maintain or enforce patents or other appropriate protections for our intellectual property; and cyber liability or potential liability for breaches of our or our service providers’ information technology systems or business operations disruptions. The foregoing factors should not be construed as exhaustive and should be read in conjunction with the sections entitled “Risk Factors” and “Management’s Discussion and Analysis of Financial Condition and Results of Operations” included in the Company’s filings made with the U.S. Securities and Exchange Commission. The Company undertakes no obligation to publicly update or review any forward-looking statement, whether as a result of new information, future developments or otherwise, except as required by law. New risks and uncertainties may emerge from time to time, and it is not possible for the Company to predict their occurrence or how they will affect the Company. The Company qualifies all forward-looking statements by these cautionary statements.
Investor Relations: Joseph Caminiti or Abe Plimpton [email protected] 312-445-2870


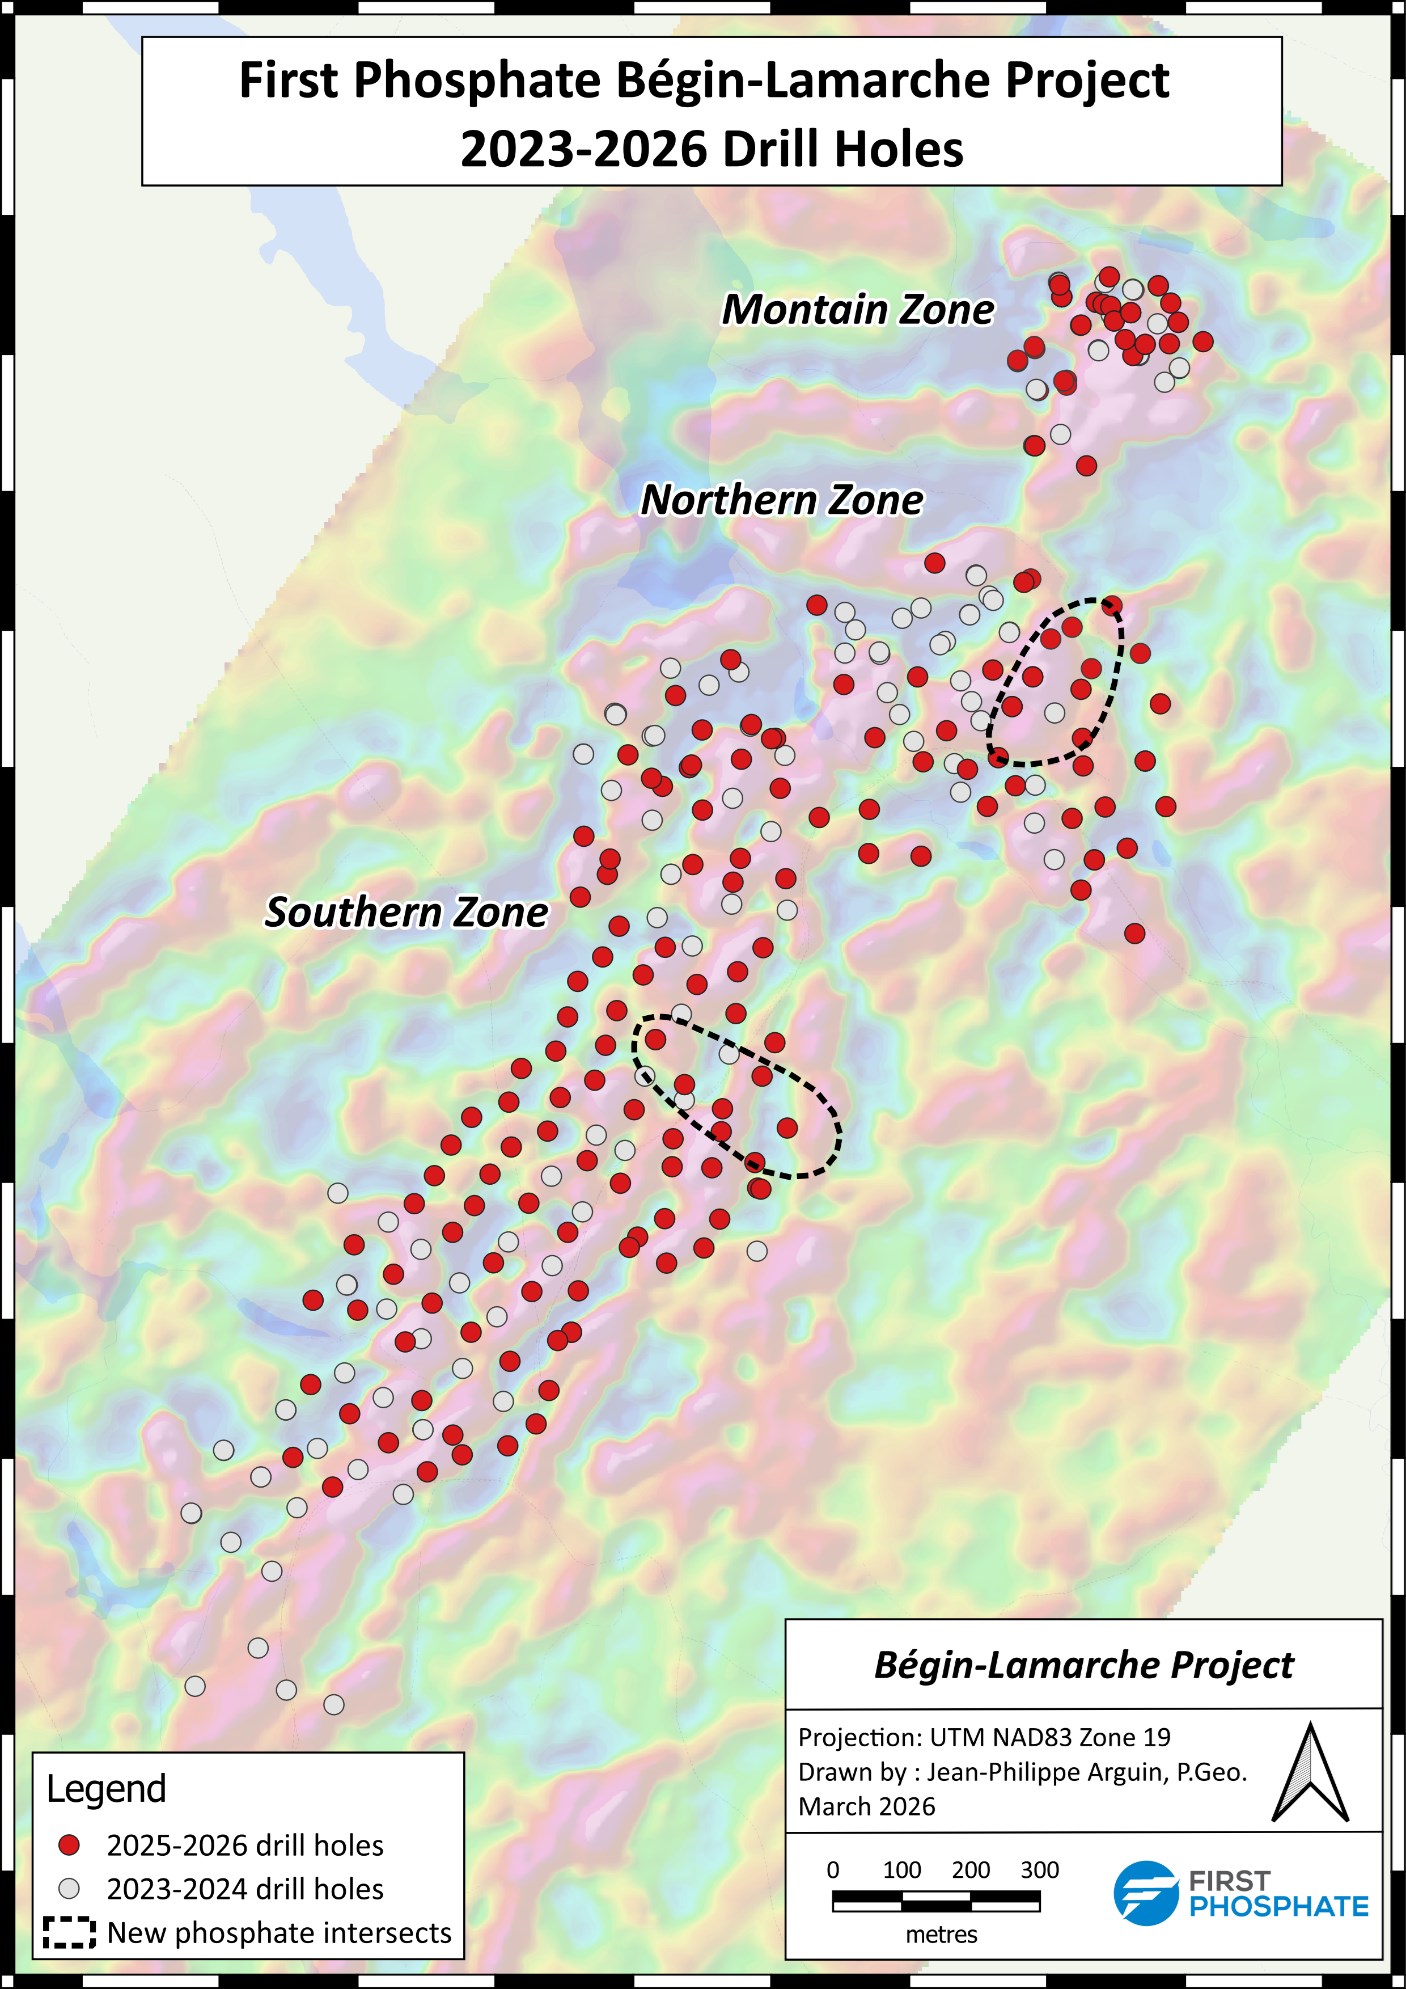