Efficient form factor delivers advanced space domain awareness directly to the warfighter in the field
SAN DIEGO, Nov. 12, 2026 (GLOBE NEWSWIRE) — Kratos Defense & Security Solutions, Inc. (Nasdaq: KTOS), a technology company in defense, national security, and global markets, today announced the release of KnownSpace® Recon+™, a portable satellite terminal that escapes the limitations of traditional Space Domain Awareness (SDA) by integrating multiple Radio Frequency (RF) SDA capabilities into a single deployable unit.
Recon+ is a commercially available product. Units have already been purchased by multiple U.S. government agencies.
KnownSpace Recon+ introduces a new approach to SDA in the field by enabling operators to assess the RF environment from any location, detect and classify satellite signals, characterize activity and support advanced SDA missions with one portable system. The collection of capabilities was previously limited to enterprise grade systems at fixed gateway locations. Its design allows rapid deployment from a single device that can be integrated through cloud or gateway systems.
Historically, SDA has been defined by optical systems and radar, both of which have severe limitations on their ability to collect useful information. The advent of modern RF signal monitoring tools from companies like Kratos has dramatically expanded the depth, breadth and availability of that data about friendly and unfriendly satellite activity and their users on the ground. With Recon+, Kratos now frees warfighters from another historical limitation, putting these capabilities in a portable unit that can be carried into the field.
For example, with Recon+ individual warfighters or teams in multiple remote locations can monitor certain types of activity that reveal which satellites are transmitting and receiving in the vicinity, obtain insights into their activity, behavior, interference and changes over time. Recon+ also provides insights into local signal behaviors conducted on the ground, such as interference or jamming sources.
Recon+ can be configured in a variety of form factors to meet a range of mission-specific goals, ranging from fly-away kits to transportable units that can be deployed at command posts or mounted on a vehicle. Built on Kratos OpenSpace® architecture, multiple Recon+ units can be networked for remote operations, extending RF awareness across dispersed locations while enabling connectivity and data sharing with other SDA systems. Its software-defined architecture also supports cloud connectivity and third-party software integration, allowing capabilities to be added and adapted as mission needs evolve. Together, these features underscore that Recon+ can be quickly tailored for mission-specific objectives while remaining highly portable.
“As the latest addition to the KnownSpace solutions family,” said Hugh White, vice president of SDA & Space Superiority at Kratos, “Recon+ helps defense and other government agencies escape the limits of traditional ground systems with a powerful, flexible way for users to understand the RF activity in space and respond in real time.”
About KnownSpace Kratos KnownSpace RF signal-based Space Domain Awareness (SDA) solutions are reinventing our understanding of space as a warfighting domain by providing deeper insights about allied, adversary and commercial operations across orbital and ground environments and the links in between. Extending beyond the limitations of traditional radar and optical technologies, KnownSpace RF SDA capabilities include enterprise applications, gateway-based products and tactical solutions such as KnownSpace Recon+ a portable, cloud-enabled SDA terminal. Kratos also delivers real-time SDA services through its global KnownSpace Network of more than 190 sensors and 20 locations, the largest commercially owned, commercially operated (COCO) RF sensor network. Services include signal survey and characterization, tracking and maneuver, interference mitigation, geolocation, and more. For more information visit www.KratosSpace.com/KnownSpace.
About Kratos Defense & Security Solutions Kratos Defense & Security Solutions, Inc. (NASDAQ: KTOS) is a technology, products, system and software company addressing the defense, national security, and commercial markets. Kratos makes true internally funded research, development, capital and other investments, to rapidly develop, produce and field solutions that address our customers’ mission critical needs and requirements. At Kratos, affordability is a technology, and we seek to utilize proven, leading-edge approaches and technology, not unproven bleeding edge approaches or technology, with Kratos’ approach designed to reduce cost, schedule and risk, enabling us to be first to market with cost effective solutions. We believe that Kratos is known as an innovative disruptive change agent in the industry, a company that is an expert in designing products and systems up front for successful rapid, large quantity, low-cost future manufacturing which is a value-add competitive differentiator for our large traditional prime system integrator partners and also to our government and commercial customers. Kratos intends to pursue program and contract opportunities as the prime or lead contractor when we believe that our probability of win (PWin) is high and any investment required by Kratos is within our capital resource comfort level. We intend to partner and team with a large, traditional system integrator when our assessment of PWin is greater or required investment is beyond Kratos’ comfort level. Kratos’ primary business areas include virtualized ground systems for satellites and space vehicles including software for command & control (C2) and telemetry, tracking and control (TT&C), jet powered unmanned aerial drone systems, hypersonic vehicles and rocket systems, propulsion systems for drones, missiles, loitering munitions, supersonic systems, space craft and launch systems, C5ISR and microwave electronic products for missile, radar, missile defense, space, satellite, counter UAS, directed energy, communication and other systems, and virtual & augmented reality training systems for the warfighter. For more information, visit www.KratosDefense.com and follow Kratos on LinkedIn and X.
Notice Regarding Forward-Looking Statements Certain statements in this press release may constitute “forward-looking statements” within the meaning of the Private Securities Litigation Reform Act of 1995. These forward-looking statements are made on the basis of the current beliefs, expectations and assumptions of the management of Kratos and are subject to significant risks and uncertainty. Investors are cautioned not to place undue reliance on any such forward-looking statements. All such forward-looking statements speak only as of the date they are made, and Kratos undertakes no obligation to update or revise these statements, whether as a result of new information, future events or otherwise. Although Kratos believes that the expectations reflected in these forward-looking statements are reasonable, these statements involve many risks and uncertainties that may cause actual results to differ materially from what may be expressed or implied in these forward-looking statements. For a further discussion of risks and uncertainties that could cause actual results to differ from those expressed in these forward-looking statements, as well as risks relating to the business of Kratos in general, see the risk disclosures in the Annual Report on Form 10-K of Kratos for the year ended December 29, 2025, and in subsequent reports on Forms 10-Q and 8-K and other filings made with the SEC by Kratos.
November 12, 2026 – Vancouver, Canada – Century Lithium Corp. (TSXV: LCE) (OTCQX: CYDVF) (Frankfurt: C1Z) (“Century Lithium” or “the Company”) is pleased to announce that the Nevada Division of Environmental Protection (“NDEP”) has issued a Water Pollution Control Permit (“WPCP”) for the Company’s Tonopah Airport Lithium Processing Demonstration Facility (the “Demonstration Plant” or “Plant”) at the Tonopah Airport in Nye County, Nevada. The Company also provides an update on progress at the site, which supports its 100%-owned Angel Island Lithium Project (“Angel Island” or the “Project”) in Esmeralda County, Nevada, USA.
“Receiving the Water Pollution Control Permit is a key step in our efforts to reconstruct and upgrade the Demonstration Plant in Tonopah,” said Bill Willoughby, President and CEO of Century Lithium. “The Plant has already demonstrated continuous operation of our patent-pending process, a combination of hydrochloric acid leaching and direct lithium extraction to produce battery-grade lithium carbonate from bulk samples of lithium clay from Angel Island. Our plan going forward with the Demonstration Plant is to complete the test work outlined in the 2026 Feasibility Study, continue to physically show the efficiency of our process, and pursue R&D initiatives, including recovery of other critical minerals from Angel Island, when funded.”
Permitting Progress
On October 28, 2026, NDEP’s Bureau of Mining Regulation and Reclamation issued Water Pollution Control Permit NEV2026117 for the Demonstration Plant to the Company’s wholly owned subsidiary, Cypress Holdings (Nevada), Ltd (“Cypress”). The WPCP authorizes the construction, operation and closure of the facility.
The WPCP covers the process building and two existing double-lined tailings ponds with leak detection on site. Before operations can begin, the WPCP requires the two ponds to be certified through hydrostatic testing of their liner and leak detection systems. That work is underway. Other pre-operational requirements include submitting updated operating plans and a notice of intent to operate; and completing an NDEP facility inspection. The Company, through its wholly owned subsidiary Cypress, also holds a Class II General Air Quality Operating Permit issued by NDEP’s Bureau of Air Pollution Control for the Tonopah Airport site.
The Demonstration Plant will be constructed on an industrial site at the Tonopah Airport, which the Company leases from Nye County and where the Company’s Nevada office is located. Because the site is airport property, the Federal Aviation Administration (“FAA”) must review and approve any new construction and non-aviation use, which includes an environmental review. The FAA’s environmental review is nearing completion, and the Company is awaiting FAA approval to construct the process building.
Demonstration Plant and Metallurgical Testing
The Company has purchased a steel building for the Demonstration Plant, with engineered modifications to suit the plant layout. The concrete foundation slab for the process building is complete and has been sealed with a chemical-resistant coating. Construction will begin upon receipt of FAA approval.
When operational, the Demonstration Plant will be used to complete the structured metallurgical testing recommended in the 2026 Feasibility Study (see Updated NI 43-101 Technical Report on the Feasibility Study of the Clayton ValleyLithium Project, Esmeralda County, Nevada, USA, January 3, 2026). This includes full test runs on claystone zones 1 and 2 and evaluating improvements to leaching, direct lithium extraction, lithium carbonate and lithium hydroxide production. The 2026 Feasibility Study also recommended further evaluation of the economic potential of rare earth element (“REE”) recovery at Angel Island.
As reported in the Company’s news releases dated December 2 and December 11, 2025, test work on primary leach solutions generated from a 500-tonne bulk sample of Angel Island claystone demonstrated recovery of REEs, including dysprosium, gadolinium, neodymium and praseodymium, without adversely affecting lithium recovery. The bulk sample assayed 0.024% total rare earth oxides (“TREO”), comprising 75% light REEs and 25% yttrium and heavy REEs. These results are representative of the bulk sample only and should not be assumed to represent the Angel Island deposit as a whole. REE recovery is not included in the 2026 Feasibility Study. The Demonstration Plant will be used to test REE recovery from Angel Island claystone at a larger scale.
Metallurgical testing for Angel Island has continued at the Company’s laboratory in Butte, Montana, independent of the Demonstration Plant schedule. Research into an enhanced chlor-alkali-based process is also underway at the Butte laboratory. This work examines alternatives to atmospheric leaching that could reduce the Project’s overall power requirements.
Qualified Person
The scientific and technical information contained in this news release has been reviewed and approved by Todd S. Fayram, MMSA-QP, Chief Technical Officer of Century Lithium, a non-independent Qualified Person as defined by National Instrument 43-101 – Standards of Disclosure for Mineral Projects.
ABOUT CENTURY LITHIUM CORP.
Century Lithium Corp. is an advanced-stage lithium development company focused on its 100%-owned Angel Island lithium project in Esmeralda County, Nevada. Angel Island hosts one of the largest known sedimentary lithium deposits in the United States and is designed with an integrated, end-to-end process for the on-site production of battery-grade lithium carbonate to support the electric vehicle and battery storage markets.
The Company has developed a patent-pending process that incorporates hydrochloric acid leaching combined with direct lithium extraction to produce battery-grade lithium carbonate. As part of the integrated chlor-alkali process, Angel Island is designed to produce sodium hydroxide as a co-product, with planned surplus sales expected to lower operating costs, reduce reliance on externally sourced reagents, and minimize environmental impacts.
Century Lithium is currently advancing Angel Island through the permitting process.
Century Lithium trades on the TSX Venture Exchange under the symbol “LCE” the OTCQX under the symbol “CYDVF”, and on the Frankfurt Stock Exchange under the symbol “C1Z”.
NEITHER THE TSX VENTURE EXCHANGE NOR ITS REGULATION SERVICES PROVIDER ACCEPTS RESPONSIBILITY FOR THE ADEQUACY OR ACCURACY OF THE CONTENT OF THIS NEWS RELEASE.
This release contains certain forward-looking statements within the meaning of applicable Canadian securities legislation. In certain cases, forward-looking statements can be identified by the use of words such as “plans”, “expects” or “does not anticipate”, or “believes”, or variations of such words and phrases or statements that certain actions, events or results “may”, “could”, “would”, “might” or “will be taken”, “occur” or “be achieved” and similar expressions suggesting future outcomes or statements regarding an outlook.
Forward-looking statements relate to any matters that are not historical facts and statements of our beliefs, intentions and expectations about developments, results and events which will or may occur in the future, without limitation, statements with respect to receipt of FAA approval, construction of the process building, the certification of the tailings ponds, satisfaction of the pre-operational requirements of the WPCP, the timing of commissioning and testing at the Demonstration Plant, the results of metallurgical testing, the potential recovery of REEs, the results of research into an enhanced chlor-alkali process, the potential development and value of the Project, and the Company’s future development plans.
These and other forward-looking statements and information are subject to various known and unknown risks and uncertainties, many of which are beyond the ability of the Company to control or predict, that may cause their actual results, performance or achievements to be materially different from those expressed or implied thereby, and are developed based on assumptions about such risks, uncertainties and other factors set out herein.These risks include those described under the heading “Risk Factors” in the Company’s most recent annual information form and its other public filings, copies of which can be under the Company’s profile at www.sedarplus.ca. The Company expressly disclaims any obligation to update-forward-looking information except as required by applicable law. No forward-looking statement can be guaranteed, and actual future results may vary materially. Accordingly, readers are advised not to place reliance on forward-looking statements or information. Furthermore, Mineral Resources that are not Mineral Reserves do not have demonstrated economic viability.
Reinforces the brand’s retail presence and commitment to an elevated in-store experience
NEW YORK–(BUSINESS WIRE)– Vince Holding Corp. (Nasdaq: VNCE), a global retail platform, today announced two new Vince store openings located in key U.S. markets, Philadelphia and Atlanta.
“We are pleased to open these new stores in Philadelphia’s Main Line and Atlanta’s Buckhead markets, two premier shopping destinations,” said Jill Norton, Chief Commercial Officer of Vince Holding Corp. “Our focus is on delivering a great in-store experience, and we look forward to welcoming new and existing customers across our stores and online as we kick off the holiday selling season.”
Opening November 13, 2026, in Ardmore, Pennsylvania, the first new store will introduce Vince to the Suburban Square shopping destination, strengthening the brand’s reach in the Philadelphia region. Following, on November 20, 2026, Vince will expand its retail presence in Atlanta, bringing the brand’s elevated approach to everyday dressing to the Buckhead Village shopping destination. With the addition of the two new locations, Vince will operate a total of 44 full-price retail stores in the U.S. and internationally, with plans to continue strategic retail expansion in 2027.
In addition to the store openings, Vince has completed three renovations to existing locations including Tysons Galleria in McLean, Virginia, Scottsdale, Arizona, and Abbot Kinney in Los Angeles, California. The investments in the in-store experience underscore a commitment to thoughtful retail growth that brings Vince’s elevated yet understated aesthetic to customers across established and new markets.
About Vince Holding Corp. Vince Holding Corp. is a global retail platform that operates the Vince brand women’s and men’s ready-to-wear business and the October’s Very Own (“OVO”) brand apparel and accessories business. Vince, established in 2002, is a leading global luxury apparel and accessories brand best known for creating elevated yet understated pieces for everyday effortless style. Vince Holding Corp. operates 44 full-price retail stores, 12 outlet stores, and its e-commerce site, vince.com, as well as through premium wholesale channels globally. OVO is a Canadian lifestyle brand originally founded in 2008 by Aubrey “Drake” Graham and a Toronto collective offering premium apparel and accessories. OVO operates 12 flagship retail stores worldwide and its e-commerce site, octobersveryown.com. Please visit www.investors.vince.com for more information.
Revenue of €62.6 million (+31%), Adj. EBITDA of €4.2 million (+45%), andGaming Win of €67.1 million (+30%) in the quarter
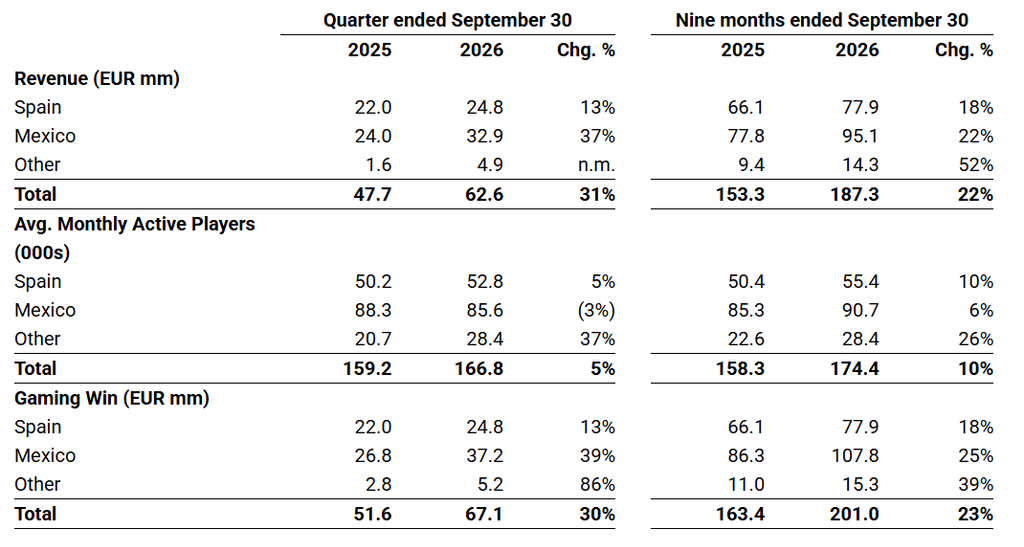
Total revenue was €62.6 mm in Q3 2026 (+31%): Spain €24.8 mm (+13%) and Mexico €32.9 mm (+37%).
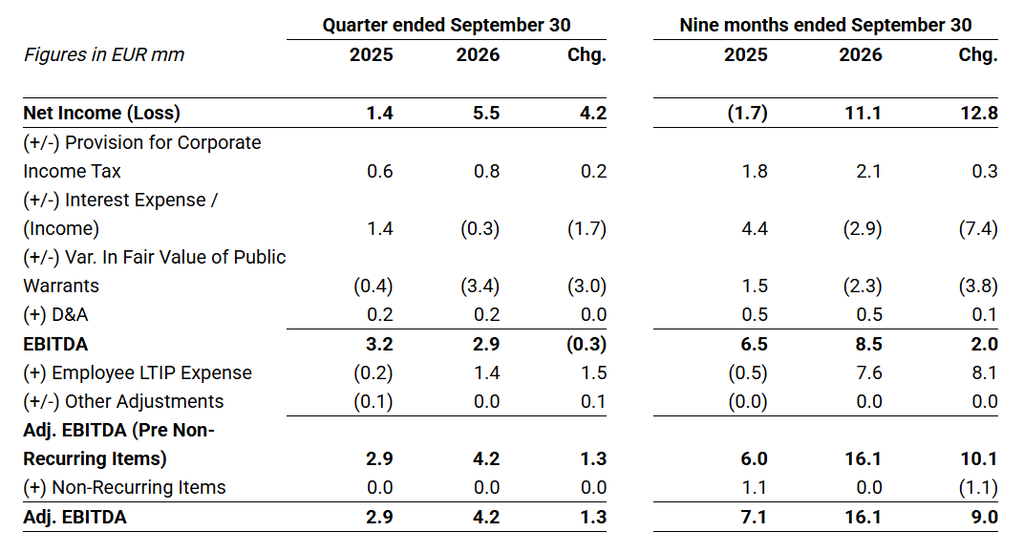
Adj. EBITDA reached €4.2 mm in Q3 2026, 45% (€1.3 mm) above Q3 2025.
Net income was €11.1 mm in 9M 2026, versus a net loss of €1.7 mm in 9M 2025.
Gaming Win1 was €67.1 mm in Q3 2026 (+30%): Spain €24.8 mm (+13%) and Mexico €37.2 mm (+39%).
Total cash position of €65.6 mm and no financial debt as of September 30, 2026.
Reiterating FY 2026 outlook of €255-265 mm of Gaming Win and €20-25 mm of Adj. EBITDA2.
Madrid, Spain and Tel Aviv, Israel, November 12, 2026 – (GLOBE NEWSWIRE) Codere Online Luxembourg, S.A. (Nasdaq: CDRO / CDROW, the “Company” or “Codere Online”), a leading online gaming operator in Spain and Latin America, has released its preliminary unaudited3 financial results for the quarter ended September 30, 2026. Below are the main financial and operating metrics of the period.
Aviv Sher, Chief Executive Officer of Codere Online, commented, “Q3 was another quarter of strong growth, with Gaming Win up 30% year-on-year, driven mainly by Mexico, up 39%, and continued growth in Spain. During the quarter we also became Official Betting Partner of the NFL in Mexico, which further strengthens our positioning in one of our most important markets.”
Marcus Arildsson, CFO of Codere Online, commented, “We delivered €62.6 million of revenue and Adjusted EBITDA of €4.2 million in the quarter, as well as €67.1 million of Gaming Win, while continuing to invest behind growth. We closed September with approximately €66 million of total cash and no financial debt.”
Mr. Arildsson further added, “Following a strong third quarter, we remain confident about meeting our full year 2026 outlook of €255 – 265 million of Gaming Win and €20 – 25 million of Adjusted EBITDA. Our third quarter benefited from the final stages of the World Cup in July and from favorable exchange rates, and against a strong fourth quarter last year, we expect growth in the coming months to be more in line with our underlying trends.”
Recent Events
Official Betting Partner of the NFL in Mexico
On September 10, 2026, Codere Online announced a multi-year agreement to become Official Betting Partner of the NFL in Mexico, strengthening its premium brand positioning in one of its largest and most strategically important markets.
The agreement includes sponsorship of the 2026 NFL Mexico City Game, to be held in Mexico City on November 22, 2026, and of Super Bowl LXI, to be held in Los Angeles in February 2027.
It also provides a year-round platform for customer engagement, including hospitality programs, VIP experiences, activations across multiple cities in Mexico and official NFL merchandise opportunities.
Transition from Net Gaming Revenue to Gaming Win
Beginning this quarter, Codere Online reports Gaming Win as a key operating metric in place of the measure previously presented as “Net Gaming Revenue”. Gaming Win is a key operating metric that measures the cash amount we retain from our customers’ wagering activity: amounts staked by customers on settled sports betting and casino wagers, less prizes and promotional credits paid to customers, before gaming taxes, value added taxes, other levies and all other costs and adjustments, as compiled by our gaming platforms and translated into euros at average monthly exchange rates (as applicable).
Historical amounts previously reported as “Net Gaming Revenue” are unchanged and Codere Online’s FY 2026 outlook is reiterated on the same basis by reference to Gaming Win.
Gaming Win is not a measure of Revenue and should not be considered an alternative to Revenue or any other financial measure determined in accordance with IFRS.
Conference Call Information
Codere Online’s management will host a conference call to discuss the results and provide a business update at 8:30 am US Eastern Time today, November 12, 2026. Access links to the audio webcast and presentation will be accessible on Codere Online’s website at www.codereonline.com. A recording of the webcast will also be available following the conference call.
Reconciliation of Net Income (IFRS) to Adj. EBITDA (non-IFRS)4
About Codere Online
Codere Online refers, collectively, to Codere Online Luxembourg, S.A. and its subsidiaries. Codere Online, launched in 2014 as part of the renowned casino operator Codere Group, offers online sports betting and online casino through its state-of-the art website and mobile applications. Codere Online currently operates in its core markets of Spain, Mexico, Colombia, Panama and Argentina; this online business is complemented by Codere Group’s physical presence in Spain and throughout Latin America, forming the foundation of the leading omnichannel gaming and casino presence.
About Codere Group Codere Group is a multinational group dedicated to entertainment and leisure. It is a leading player in the private gaming industry, with four decades of experience and with presence in seven countries in Europe (Spain and Italy) and Latin America (Argentina, Colombia, Mexico, Panama, and Uruguay).
Note on Rounding Due to rounding, numbers presented in this document may not add up precisely to the totals provided, and percentages may not precisely reflect the absolute figures.
Forward-Looking Statements This document contains “forward-looking statements” within the meaning of the safe harbor provisions of the U.S. Private Securities Litigation Reform Act of 1995, including statements regarding the expectations, beliefs, intentions or strategies of Codere Online Luxembourg, S.A. and its subsidiaries (collectively, “Codere Online”) regarding the future. Words such as “anticipate,” “believe,” “continue,” “estimate,” “expect,” “intend,” “may,” “plan,” “project,” “should,” “would” and similar expressions may identify forward-looking statements, but are not the only means of doing so. Forward-looking statements in this document include, among others, statements regarding Codere Online’s outlook, expected growth, financial performance, strategy and operations.
These statements are based on current expectations, forecasts and assumptions as of the date of this document and involve risks and uncertainties that could cause actual results to differ materially. These include, among others: (i) changes in laws, regulations and taxes applicable to online gaming; (ii) volatility in sports betting results and in the outcome of sporting events; (iii) fluctuations in exchange rates, particularly of Latin American currencies against the euro; (iv) competition and changes in the gaming industry; (v) Codere Online’s ability to execute its business plans and manage its growth; (vi) its reliance on third-party providers, including the Codere Group; (vii) its ability to obtain and maintain gaming licenses; (viii) data protection and cybersecurity risks; and (ix) political, economic and geopolitical conditions in the markets in which it operates. Additional risks are described in Codere Online’s filings with the U.S. Securities and Exchange Commission (the “SEC”), including its most recent Annual Report on Form 20-F. Codere Online’s outlook has not been audited or reviewed by its independent auditors and should not be regarded as a representation that the results will be achieved. Codere Online undertakes no obligation to update any forward-looking statement, except as required by applicable law. All forward-looking statements attributable to Codere Online are expressly qualified in their entirety by these cautionary statements.
Key Operating Metrics This document includes certain key operating metrics, such as Gaming Win and average monthly active players, which management uses to manage and assess the performance of the business. Gaming Win measures the cash amount we retain from our customers’ wagering activity: amounts staked by customers on settled sports betting and casino wagers, less prizes and promotional credits paid to customers, before gaming taxes, value added taxes, other levies and all other costs and adjustments, as compiled by our gaming platforms and translated into euros at average monthly exchange rates (as applicable). We use Gaming Win for budgeting and planning, monthly management and Board reporting, and assessing performance by market and product. Codere Online believes it is useful to investors because the taxes applicable to online gaming differ among our markets, and Gaming Win allows activity to be compared on a consistent basis. Gaming Win replaces the measure previously presented as “Net Gaming Revenue”, and historical amounts are unchanged. Gaming Win is not a measure of revenue and should not be considered an alternative to revenue or any other IFRS measure. These metrics may not be comparable to similarly titled measures used by other companies.
Financial Information and Non-IFRS Financial Measures Codere Online’s financial statements are prepared in accordance with International Financial Reporting Standards as issued by the International Accounting Standards Board (“IFRS”). This document includes certain financial measures not presented in accordance with IFRS, such as Adjusted EBITDA. Codere Online believes these measures are useful to investors in evaluating its operating results and trends, but they are subject to limitations, may exclude items that are significant to understanding its financial results, and may not be comparable to similarly titled measures used by other companies. They should not be considered in isolation or as an alternative to revenue, net income, cash flows from operations or any other measure determined in accordance with IFRS. Reconciliations to the most directly comparable IFRS measures are included in this document. Codere Online does not provide a reconciliation of forward-looking Adjusted EBITDA to net income because it cannot predict, without unreasonable effort, certain items that would be required, such as finance results, foreign exchange effects and income taxes, which could be material.
Preliminary Information The financial information and other data in this document are preliminary, unaudited and subject to change, and no independent registered public accounting firm has audited, reviewed or expressed any form of assurance on them. Adjustments, which may be material, may be identified as this information is finalized. This information is not a substitute for full financial statements prepared in accordance with IFRS, may differ from actual results and is not necessarily indicative of results for any future period.
Trademarks This document contains trademarks and trade names of Codere Online and of other companies, including the National Football League, which are the property of their respective owners.
Contacts:
Investors and Media Guillermo Lancha Director, Investor Relations and Communications [email protected]
(+34) 628.928.152
1 Gaming Win is a key operating metric that measures the cash amount we retain from customers’ wagering activity, as compiled by our gaming platforms. It replaces the measure previously presented as “Net Gaming Revenue”; historical amounts are unchanged. See “Key Operating Metrics” below.
2 Adjusted EBITDA is a non-IFRS measure; please see reconciliation of Net Income to Adjusted EBITDA to at the end of the report. The Adjusted EBITDA outlook is a forward-looking non-IFRS measure; please see important disclaimers at the end of the report. 3 See “Preliminary Information” below.
4 Interest includes realized foreign exchange results and the monetary impact of IAS 29 in Argentina. Other adjustments mainly reverse the impact of IAS 29 on operating results in Argentina and, from 2026, include shares withheld for taxes under the employee long-term incentive plan. Non-recurring items in 9M 2025 relate to excess audit-related fees. For further detail, see page 21 of our Q3 2026 Earnings Presentation, furnished on Form 6-K on November 12, 2026.
Phase 2 trial remains ongoing, withmedian PFS not reached in the 30 mg onvansertib+FOLFIRI/bev arm versus median PFS of approximately 11 months in the combined SoC arms
All patients remaining in the 30 mg onvansertib + FOLFIRI/bev arm have now exceeded 21 months on treatment
Company preparing for registrational Phase 3 trial in first-line RAS-mutatedmCRC, with potential start in Q1 2027
SAN DIEGO, Nov. 12, 2026 (GLOBE NEWSWIRE) — Cardiff Oncology, Inc. (Nasdaq: CRDF), a clinical-stage biotechnology company targeting RAS-mutated cancer by leveraging PLK1 inhibition, today announced financial results for the third quarter ended September 30, 2026, and provided a business update.
“We’re greatly encouraged by the performance of onvansertib in first-line RAS-mutated mCRC. As the data mature, the benefit of onvansertib in combination with FOLFIRI/bev is becoming more evident, with growing separation between the onvansertib and control arms,” said Mani Mohindru, PhD, President and Chief Executive Officer of Cardiff Oncology. “Building on the strength of these data, we are actively preparing for our upcoming registrational trial. There are currently no treatment options specifically approved for patients with pan-RAS-mutated mCRC in the first-line setting and we believe onvansertib has the potential to become an important new treatment for these patients.”
Clinical Highlights
Randomized Phase 2 Trial in First-Line RAS-Mutated Metastatic Colorectal Cancer (“mCRC”) Ongoing
Cardiff’s randomized Phase 2 trial evaluating onvansertib in combination with FOLFIRI/ bevacizumab (“bev”) or FOLFOX/bev as first-line therapy in patients with RAS-mutated mCRC remains ongoing. Median progression-free survival (“PFS”) has not been reached in the 30 mg onvansertib + FOLFIRI/bev arm, the Company’s proposed Phase 3 regimen.
As of September 28, 2026, 6 patients remain on the FOLFIRI/bev regimen, with 5 patients in the onvansertib (20 or 30 mg) + FOLFIRI/bev arms and 1 patient on standard-of-care (“SoC”) FOLFIRI/bev. Patients who remain in the 30 mg onvansertib + FOLFIRI/bev arm have been on treatment for at least 21 months, with the longest duration of treatment being over 29 months. For comparison, the median PFS in the combined SoC arms has been reached at approximately 11 months, consistent with what has been historically reported.
Preparing for the Registrational Phase 3 Trial in First-Line RAS-Mutated mCRC
Cardiff expects to initiate the Phase 3 trial in the first quarter of 2027, subject to securing additional financing. In preparation, the Company is establishing key vendor relationships for trial execution and clinical supply materials, as well as finalizing the companion diagnostics for RAS mutational status. The trial is designed to support potential accelerated approval based on objective response rate and full approval based on PFS.
Corporate Updates
In July, Cardiff completed a $10 million registered direct offering of common stock and warrants to support working capital and general corporate purposes. The full press release is available here.
In September, Cardiff and its licensor, Nerviano Medical Sciences S.r.l. (“NMS”), resolved all outstanding disputes regarding global rights to onvansertib and amended their 2017 exclusive license agreement. The full press release is available here.
In October, Cardiff appointed Leila Alland, MD, as interim Chief Medical Officer. Dr. Alland is a seasoned oncology executive who has served as Chief Medical Officer at several clinical-stage biotechnology companies and previously held leadership positions at AstraZeneca, Bristol Myers Squibb, Novartis and Schering-Plough, where she contributed to the development and approval of multiple oncology therapies. The full press release is available here.
In October, U.S. Food and Drug Administration (“FDA”) granted Orphan Drug Designation (“ODD”) to onvansertib for the treatment of patients with chronic myelomonocytic leukemia (“CMML”).
In November, FDA granted ODD to onvansertib for the treatment of patients with small cell lung cancer.
Upcoming Events
Cardiff management will present at the UBS Global Biopharma Conference and participate in one-on-one investor meetings on November 16–17, 2026. Dr. Mohindru’s presentation is scheduled for November 16 at 2:40 p.m. GMT. A live webcast and replay will be available in the “Events” section of the Cardiff Oncology website.
Updated data from an investigator-sponsored clinical trial in CMML will be presented at the American Society of Hematology (“ASH”) Annual Meeting on December 13, 2026.
Third Quarter 2026 Financial Results
Liquidity, cash burn, and cash runway
As of September 30, 2026, Cardiff Oncology had approximately $33.8 million in cash, cash equivalents, and short-term investments. Net cash used in operating activities for the nine months ended September 30, 2026 was approximately $33.9 million, an increase of $2.0 million from $31.9 million for the same period in 2025. In July 2026, the Company raised net proceeds of approximately $9.1 million in a registered direct offering. Based on its current expectations and projections, the Company believes its current cash resources are sufficient to fund its operations to the end of the third quarter of 2027.
Operating results
Total operating expenses were approximately $32.0 million for the nine months ended September 30, 2026, a decrease of $9.5 million from $41.5 million for the same period in 2025. R&D expenses decreased by $12.5 million, reflecting the completion of clinical trials, fewer patients on treatment in the Phase 2 mCRC trial, a reduction in preclinical activities, and completion of chemistry, manufacturing and controls (“CMC”) activities as the Company prepares for its planned Phase 3 mCRC trial. SG&A expenses increased by $3.1 million, driven by legal and professional fees related to the Company’s dispute with NMS, which was resolved on September 14, 2026, and also by employee severance costs. Net loss was $30.4 million, compared with $38.6 million for the prior year period.
About Cardiff Oncology, Inc.
Cardiff Oncology is a clinical-stage biotechnology company targeting RAS-mutated cancers via innovative cancer treatments focused on PLK1 inhibition, a validated oncology target with practice-changing potential. Our lead asset, onvansertib, is a highly specific, oral PLK1 inhibitor currently being evaluated in a Phase 2 trial for first-line treatment of RAS-mutated metastatic colorectal cancer (“mCRC”), addressing a large, underserved patient population with high unmet need. Onvansertib is also under investigation in other PLK1-driven cancers through ongoing investigator-initiated trials and has shown robust single-agent clinical activity in hard-to-treat tumors. By targeting tumor vulnerabilities, we aim to overcome treatment resistance and deliver improved clinical outcomes for patients.
Certain statements in this press release are forward-looking within the meaning of the Private Securities Litigation Reform Act of 1995. These statements may be identified using words such as “anticipate,” “believe,” “forecast,” “estimated” and “intend” or other similar terms or expressions that concern Cardiff Oncology’s expectations, strategy, plans or intentions. These forward-looking statements are based on Cardiff Oncology’s current expectations and actual results could differ materially.
There are several factors that could cause actual events to differ materially from those indicated by such forward-looking statements. These factors include, but are not limited to, uncertainties associated with clinical development and regulatory approvals; the possibility that results from earlier clinical studies may not be predictive of future results; risks related to the timing, initiation, conduct and completion of clinical trials; the Company’s need for additional financing; dependence on key personnel and third parties; competition; intellectual property risks; and other factors described in Cardiff Oncology’s filings with the Securities and Exchange Commission. There can be no assurance that onvansertib will receive regulatory approval for any indication or prove commercially successful.
Investors should read the risk factors set forth in Cardiff Oncology’s Form 10-K for the year ended December 31, 2025, and other periodic reports filed with the Securities and Exchange Commission. Forward-looking statements included herein are made as of the date hereof, and Cardiff Oncology does not undertake any obligation to update publicly such statements to reflect subsequent events or circumstances.
First quarter revenue rises 9.3% to $16.4 million; GAAP net income of $0.16 million compared with a net loss in the prior-year period
ENCINO, Calif., Nov. 12, 2026 (GLOBE NEWSWIRE) — NETSOL Technologies, Inc. (Nasdaq: NTWK), a provider of AI-enabled solutions and services powering OEMs, dealerships and financial institutions to sell, finance and lease assets, reported results for its fiscal first quarter ended September 30, 2026.
First quarter highlights
First quarter revenue increased 9.3% to $16.4 million, compared with $15.0 million in the prior-year period; subscription and support revenue increased 6.1% to $9.5 million.
First quarter gross margin expanded by more than 1,100 basis points to 50.5%, compared with 39.4% in the prior-year period; income from operations was $0.4 million, compared with an operating loss of $1.8 million.
First quarter GAAP net income attributable to NETSOL was $0.16 million, or $0.01 per diluted share, compared with a net loss of $2.36 million, or $0.21 per diluted share, in the prior-year period.
First quarter adjusted EBITDA attributable to NETSOL was $0.48 million, compared with negative $1.66 million in the prior-year period.
Net cash used in operating activities was $5.6 million, primarily attributable to working capital; cash and cash equivalents were $19.7 million at September 30, 2026.
First quarter fiscal 2027 financial results
Revenue
Total net revenues for the first quarter of fiscal 2027 increased 9.3% to $16.4 million, compared with $15.0 million in the prior-year period. On a constant currency basis, total net revenues were $16.5 million. First quarter revenue and gross margin were each the highest for a first quarter in the past five fiscal years.
Subscription (SaaS and Cloud) and support revenues increased 6.1% to $9.5 million, compared with $9.0 million in the prior-year period.
Services revenues increased 6.3% to $6.4 million, compared with $6.0 million in the prior-year period.
Gross profit and operating income
Gross profit increased to $8.3 million, or 50.5% of net revenues, compared with $5.9 million, or 39.4% of net revenues, in the prior-year period. Gross margin expanded by more than 1,100 basis points.
Gross margin benefited from revenue mix and the capitalization of approximately $1.0 million of software development costs, compared with none in the prior-year period.
Headcount was 1,272 at September 30, 2026, compared with 1,370 at June 30, 2026 and 1,442 at September 30, 2025.
Income from operations was $0.4 million, compared with a loss from operations of $1.8 million in the prior-year period, representing an operating margin of 2.5% compared with negative 12.2%.
Net income and non-GAAP results
GAAP net income attributable to NETSOL was $0.16 million, or $0.01 per diluted share, compared with a net loss of $2.36 million, or $0.21 per diluted share, in the prior-year period.
Consolidated net income was $0.53 million, compared with a consolidated net loss of $2.22 million in the prior-year period. Net income attributable to non-controlling interests was $0.37 million, compared with $0.14 million. The improvement reflects stronger gross margin performance and a significantly narrower foreign currency exchange loss of $7,000, compared with $287,000 in the prior-year period.
Non-GAAP results for the first quarter, compared with the prior-year period, were:
Non-GAAP EBITDA: $0.78 million, compared with negative $1.78 million.
Consolidated adjusted EBITDA: $0.89 million, compared with negative $1.35 million.
Adjusted EBITDA attributable to NETSOL: $0.48 million, compared with negative $1.66 million.
Cash flow and balance sheet
Net cash used in operating activities for the first quarter was $5.6 million, compared with $5.3 million provided by operating activities in the prior-year period. The change was primarily attributable to working capital: contract liabilities decreased $3.4 million, contract assets increased $2.6 million and accounts payable and accrued expenses decreased $1.5 million, partially offset by a $1.1 million decrease in accounts receivable. The company also invested approximately $2.0 million in property, equipment and capitalized software development, compared with approximately $0.5 million in the prior-year period. This included approximately $1.0 million of capitalized software development costs, compared with none in the prior-year period, which also contributed to the gross margin improvement.
Cash and cash equivalents were $19.7 million at September 30, 2026 compared with $27.1 million at June 30, 2026, reflecting the working capital movements described above. Working capital was $29.1 million at September 30, 2026.
NETSOL stockholders’ equity was $42.0 million at September 30, 2026.
On October 30, 2026, the board of NETSOL Technologies Limited, the company’s majority-owned subsidiary listed on the Pakistan Stock Exchange, recommended a buy-back of up to 4,000,000 of its shares, approximately 4.45% of its issued capital, to be held in treasury and funded from the subsidiary’s distributable profits. The proposal is subject to shareholder approval on December 3, 2026. The company is not assigning a financial benefit to the proposal at this stage.
Separately, on October 1, 2026, the Board of NETSOL Technologies Europe Limited began evaluating strategic alternatives for its subsidiary Virtual Lease Services Limited (VLS), including a potential sale or wind-down, though no plan has been approved or agreement executed. VLS revenue for the three months ended September 30, 2026 represented approximately 1.7% of consolidated revenues, and its total assets represented approximately 1.3% of total consolidated assets. If a sale or wind-down is completed, the company may recognize a loss on disposal and incur exit-related costs, which cannot be estimated at this time.
Management commentary
Najeeb Ghauri, Founder and Chief Executive Officer of NETSOL Technologies, Inc., commented:
“This quarter shows the kind of progress we set out to deliver entering fiscal 2027. Revenue, gross margin and profitability all moved in the right direction compared with a year ago, and we did it while continuing to strengthen our commercial pipeline and deepen trust with our largest customers. That combination, growth, margin improvement and deepening customer relationships, is what we mean when we talk about making this company’s performance more predictable.”
Asad Ghauri, Global Head of Sales and Group Managing Director of Europe at NETSOL Technologies, Inc., commented:
“We saw strong commercial momentum this quarter. We brought Transcend Retail live across two new U.S. dealerships, Atlanta Autos and Royal Coach RV, and BMO Equipment Finance, a 30-year customer, moved from our legacy LeasePak platform onto Transcend Finance, part of a broader pattern we’re seeing across our install base.”
Sardar Abubakr, Chief Financial Officer of NETSOL Technologies, Inc., commented:
“The first quarter marked a clear improvement from where we stood a year ago. Revenue grew 9.3%, gross margin expanded more than 1,100 basis points and we moved from an operating loss to operating income, with net income attributable to NETSOL of $0.16 million compared with a loss of $2.36 million a year ago.”
“In the fourth quarter we billed and collected ahead of delivery, and in the first quarter we delivered against those billings. That is most of the operating cash outflow. Our liquidity is fine and we can fund the business through the year.”
“Our priorities for the remainder of the year are unchanged: grow recurring revenue, build on this quarter’s year-over-year margin gains and continue converting consolidated performance into value for NETSOL shareholders.”
Conference call
NETSOL Technologies management will hold a conference call Thursday, November 12, 2026, at 9:00 am Eastern Time (6:00 am Pacific Time) to discuss its results for the first quarter of fiscal 2027 ended September 30, 2026. A question-and-answer session will follow management’s prepared remarks.
Participant dial-in: 1-877-407-0789 or 1-201-689-8562
A live webcast of the conference call will be available here. Information about the webcast will also be available on the Investor Relations section of NETSOL’s website at www.netsoltech.com.
Telephone replay:
Telephone replays will be made available approximately 3 hours after conference end time.
Replay dial-in: 1-844-512-2921 or 1-412-317-6671
Replay expiration: Thursday, November 26, 2026 at 11:59 PM ET
Access ID: 13763709
About NETSOL Technologies NETSOL Technologies delivers state-of-the-art solutions for asset finance, leasing and digital automotive retail, serving automotive and equipment OEMs, dealerships, auto captives and financial institutions across over 30 countries. Since its inception in 1997, NETSOL has been at the cutting edge of technology, pioneering innovations with its asset finance solutions, and today leverages advanced AI and cloud services to meet the complex needs of the global market. Renowned for its deep industry expertise, customer-centric approach and commitment to excellence, NETSOL fosters strong partnerships with its customers, ensuring their success in an ever-evolving landscape. With a rich history of innovation, ethical business practices and a focus on sustainability, NETSOL is dedicated to empowering businesses worldwide, securing its position as the trusted partner for leading firms around the globe.
Forward-Looking Statements This press release contains forward-looking statements within the meaning of the Private Securities Litigation Reform Act of 1995 regarding the company’s products and services, expectations for future operations, fiscal 2027 guidance for revenues, gross margin and adjusted EBITDA, contracted revenue, remaining performance obligations and revenue visibility, AI-enabled products and productivity initiatives, the company’s efficiency program, capital allocation, potential strategic partnerships and acquisitions, potential structural actions concerning non-controlling interests, and other statements that are not historical facts. These forward-looking statements may be identified by terminology such as “expects,” “anticipates,” “believes,” “intends,” “plans,” “projects,” “targets,” “guidance,” “assumes,” and similar expressions. These statements are not guarantees of future performance and are subject to a number of risks, uncertainties, and assumptions that are difficult to predict. The fiscal 2027 outlook assumes continued subscription growth, execution of contracted implementations, disciplined cost management and no material acquisitions. Factors that could cause actual results to differ materially include, but are not limited to, the timing of customer agreements, go-lives, contract signings and renewals, implementation milestones, the rate of adoption of AI-enabled product capabilities, foreign currency volatility, customer concentration and customer decisions, the timing of advance billings and collections, investment levels, competition, geopolitical and macroeconomic conditions, and other factors discussed in NETSOL’s most recent Annual Report on Form 10-K and subsequent Quarterly Reports on Form 10-Q filed with the U.S. Securities and Exchange Commission. Readers are cautioned not to place undue reliance on these forward-looking statements, which speak only as of the date hereof. NETSOL undertakes no obligation to publicly update or revise any forward-looking statement, whether as a result of new information, future events, or otherwise, except as required by law.
Use of Non-GAAP financial measures This press release includes references to non-GAAP EBITDA, non-GAAP adjusted EBITDA, gross, and non-GAAP adjusted EBITDA, net, which are non-GAAP financial measures. Non-GAAP EBITDA is net income before non-controlling interest, income taxes, depreciation and amortization, interest expense and interest income. Non-GAAP adjusted EBITDA, gross, further excludes foreign currency exchange gains and losses and non-cash stock-based compensation; non-GAAP adjusted EBITDA, net, further deducts the adjusted EBITDA attributable to non-controlling interests. Management believes these measures assist investors in evaluating operating performance and comparing results across periods. Non-GAAP measures should be considered in addition to, and not as substitutes for, the most directly comparable GAAP measures. Reconciliations of these measures to net income attributable to NETSOL, the most directly comparable GAAP measure, together with an explanation of how management uses these measures, are provided in Schedule 4 of the financial tables that follow.
Monthly subscription value of $1.83 million as of October 31, 2026, approximately $22.0 million on an annualized basis
12,532 active U.S. subscriptions as of October 31, 2026
October U.S. e-commerce total sales of $1.67 million, of which approximately $1.02 million, or 61%, was attributable to subscriptions
Approximately 19,100 orders in October from approximately 234,500 online store sessions
Continued momentum in November, with U.S. e-commerce sales continuing to grow significantly
CHICAGO, IL / ACCESS Newswire / November 11, 2026 /Cosmos Health Inc. (“Cosmos Health” or the “Company”) (NASDAQ:COSM), a diversified, vertically integrated global healthcare group, today announced that its U.S. direct-to-consumer subscription business reached $1,832,785 in monthly subscription value as of October 31, 2026, equivalent to approximately $22.0 million on an annualized basis. In October 2026, the Company’s U.S. e-commerce business recorded total sales of $1,673,004, of which $1,015,231 was attributable to subscriptions.
October 2026 Key Metrics
Metric
October 2026
Details
Monthly subscription value (as of October 31)
$1,832,785
Approximately $22.0 million annualized
Active subscriptions (as of October 31)
12,532
Net growth of 11,544 during October
Product units in active subscriptions
29,507
Approximately 2.4 per subscription
Total sales
$1,673,004
Including $1,015,231 attributable to subscriptions
Orders
Approximately 19,100
From approximately 234,500 store sessions
Conversion rate
7.72%
Share of store sessions resulting in an order
Building a Recurring Revenue Base
Cosmos Health launched its U.S. subscription model in mid-July 2026 and began scaling it in mid-September. The Company’s products are sold through its own online stores directly to customers, who can choose a subscription for recurring delivery at checkout. Active subscriptions renew on a recurring basis, so every new subscriber can represent an ongoing customer relationship rather than a single sale.
Outlook for the Fourth Quarter
The Company has allocated an increased marketing budget to continue scaling its U.S. direct-to-consumer sales through the fourth quarter of 2026, including the holiday shopping season. Cosmos Health plans to expand digital customer acquisition, grow its subscription base and introduce additional products from its portfolio to its U.S. online stores. Momentum has continued into November, with U.S. e-commerce sales continuing to grow significantly.
Greg Siokas, CEO of Cosmos Health, stated: “Since we began scaling our U.S. subscription platform in mid-September, we have built a subscription business with $1.83 million in monthly subscription value, or approximately $22 million on an annualized basis. As of October 31, more than 12,500 subscriptions were active, with an average of approximately 2.4 products per subscription.
“We believe recurring revenue is among the most valuable revenue a consumer health company can build, and we plan to continue scaling our U.S. direct-to-consumer business through the fourth quarter and beyond.”
About Cosmos Health Inc.
Cosmos Health Inc. (NASDAQ:COSM), incorporated in 2009 in Nevada, is a diversified, vertically integrated global healthcare group. The Company owns a portfolio of proprietary pharmaceutical and nutraceutical brands, including Sky Premium Life®, Mediterranation®, bio-bebe®, C-Sept® and C-Scrub®. Through its subsidiary Cana Laboratories S.A., licensed under European Good Manufacturing Practices (GMP) and certified by the European Medicines Agency (EMA), it manufactures pharmaceuticals, food supplements, cosmetics, biocides, and medical devices within the European Union. Cosmos Health also distributes a broad line of pharmaceuticals and parapharmaceuticals, including branded generics and OTC medications, to retail pharmacies and wholesale distributors through its subsidiaries in Greece and the UK. Furthermore, the Company has established R&D partnerships targeting major health disorders such as obesity, diabetes, and cancer, enhanced by artificial intelligence drug repurposing technologies, and focuses on the R&D of novel patented nutraceuticals, specialized root extracts, proprietary complex generics, and innovative OTC products. Cosmos Health has also entered the telehealth space through the acquisition of ZipDoctor, Inc., based in Texas, USA. With a global distribution platform, the Company is currently expanding throughout Europe, Asia, and North America, and has offices and distribution centers in Thessaloniki and Athens, Greece, and in Harlow, UK. More information is available at www.cosmoshealthinc.com, www.skypremiumlife.com, www.cana.gr, www.zipdoctor.co, www.cloudscreen.gr, as well as LinkedIn and X.
Forward-Looking Statements
With the exception of the historical information contained in this news release, the matters described herein may contain forward-looking statements within the meaning of Section 27A of the Securities Act of 1933, as amended, and Section 21E of the Securities Exchange Act of 1934, as amended. Words such as “believes,” “expects,” “anticipates,” “intends,” “projects,” “estimates,” “plans,” and similar expressions, or future or conditional verbs such as “will,” “should,” “would,” “may,” and “could,” generally identify forward-looking statements, although not all forward-looking statements contain these words. These statements involve risks and uncertainties that may individually or materially affect the matters discussed herein for a variety of reasons outside the Company’s control, including, but not limited to: the Company’s ability to raise sufficient financing to implement its business plan; the effectiveness of its digital asset strategies, including accumulation and yield-generating activities; the impact of the war in Ukraine and ongoing conflicts in the Middle East and other regions on the Company’s business, operations, and the economy in general; the Company’s ability to successfully develop and commercialize its proprietary products and technologies; the timing, execution, regulatory clearance, valuation, structuring, and completion of any potential asset-backed or tokenized financing program; the legal, regulatory, and technological risks associated with digital assets and blockchain-based financial structures; the conversion of contract manufacturing pipeline volumes into production and revenue, including the timing, volume and terms of orders placed under multi-year agreements; the realization of anticipated gross margins; the timing, cost and completion of planned capital investments; changes in interest rates; changes in foreign currency exchange rates, commodity or other price inflation and deflation; our ability to issue debt on terms and at rates acceptable to us; the impact and expected outcome of investigations, inquiries, claims, and litigation; the challenges of operating in international markets; the adequacy of insurance coverage; the effect of accounting charges and of adopting certain accounting standards; the impact of legal and regulatory changes, including changes to tax laws and regulations; guidance for fiscal 2026 and beyond and financial outlook. Forward-looking statements are based on currently available information and our current assumptions, expectations and projections about future events. You should not rely on our forward-looking statements. These statements are not guarantees of future performance and are subject to future events, risks and uncertainties – many of which are beyond our control, dependent on the actions of third parties, or currently unknown to us – as well as potentially inaccurate assumptions that could cause actual results to differ materially from our historical experience and our expectations and projections. These risks and uncertainties include, but are not limited to, those described from time to time in our periodic reports filed with the SEC and available at the SEC’s website (www.sec.gov). There also may be other factors that we cannot anticipate or that are not described herein, generally because we do not currently perceive them to be material. Such factors could cause results to differ materially from our expectations. Forward-looking statements speak only as of the date they are made, and we do not undertake to update these statements other than as required by law. You are advised, however, to review any further disclosures we make on related subjects in our filings with the Securities and Exchange Commission and in our other public statements.
Note: All figures are preliminary, unaudited operating data from the Company’s e-commerce and subscription platforms and may differ from amounts in its financial statements. Total sales include taxes and shipping, net of discounts, returns and fees. Monthly subscription value is the amount billable on active subscriptions in a month at standard renewal pricing as of October 31, 2026; the annualized figure is that value multiplied by twelve and is not a forecast. Subscription metrics are subject to cancellations and churn, and none of these metrics represent U.S. GAAP revenue. November statements reflect preliminary data; actual results may differ materially.
NEW YORK and NETANYA, Israel, Nov. 11, 2026 (GLOBE NEWSWIRE) — T3 Defense Inc. (Nasdaq: DFNS) (“T3 Defense” or the “Company”), a defense company that acquires and operates mission-critical defense businesses, today announced that its wholly owned subsidiary, Nimbus Drones Technologies Ltd. (“Nimbus”), has entered into an exclusive marketing and reseller agreement with Copting GmbH (“Copting”), a German developer and manufacturer of advanced unmanned aerial systems (UAS). Under the agreement, Nimbus will exclusively market and resell Copting’s Falkawn-BOS tethered drone system in Israel.
The agreement expands Nimbus’ product portfolio into persistent aerial surveillance, complementing T3 Defense’s existing drone and counter-drone capabilities. Nimbus plans to offer complete deployment packages combining system sales with integration, training and support services. This model creates opportunities to generate revenue from initial deployments and recurring services as Nimbus builds an installed customer base.
The agreement covers the Falkawn-BOS system, including its ground station, software, accessories and spare parts, for defense, homeland security, emergency response, critical infrastructure and public-safety customers in Israel.
The agreement comes as tethered drone systems attract interest internationally for defense, public safety and critical infrastructure applications. According to a recent report available through Research and Markets, the European tethered drone market was estimated at approximately $128 million in 2024 and is projected to reach approximately $723 million by 2031, supported by defense investment and broader adoption across public-safety and commercial operations. Against this broader market backdrop, Nimbus’ opportunity is to serve these types of operational needs in Israel, combining Copting’s technology with local integration, training, outdoor enclosures and ongoing maintenance and support.
“The Falkawn-BOS system expands our ability to address customers’ needs for extended aerial monitoring at fixed sites and from mobile command vehicles,” said Yehuda Harush, Chief Executive Officer of Nimbus. “Our opportunity goes beyond supplying the system. We see potential to provide the integration, training and ongoing support customers need to put it to work in their operations.”
“Our growth strategy includes broadening our subsidiaries’ product offerings to create additional revenue opportunities,” said Menny Shalom, Chairman and Chief Executive Officer of T3 Defense. “This agreement adds complementary product to Nimbus’ portfolio and provides another avenue for product sales and related services. It builds on our drone and counter-drone capabilities while expanding the range of defense and security requirements we can address. We believe this product line could become a meaningful contributor to Nimbus’ revenue in 2027, with opportunities for ongoing maintenance and support as the customer base grows.”
About Copting GmbH
Copting GmbH, headquartered in Braunschweig, Germany, develops and manufactures advanced unmanned aerial systems, including the Falkawn family of autonomous tethered drone solutions.
About Nimbus Drones Technologies
Nimbus is an Israeli aerospace robotics company established in 2024 that specializes in comprehensive UAV solutions including drone systems sales, maintenance, mapping and surveying services, aerial imaging, red-team simulation for defense exercises, counter-UAS research, and certified flight training programs. Nimbus serves a diverse customer base across defense, public sector, commercial, and agricultural industries.
About T3 Defense Inc.
T3 Defense Inc. (Nasdaq: DFNS) is a defense company that acquires and operates mission-critical defense businesses involved in national security programs. It focuses on manufacturers with strong customer relationships and solid order backlogs, often capacity- and resource-constrained, in specialized areas such as drones and autonomous vehicles, counter-drone systems, advanced manufacturing, tactical robotics, and AI software and system integration. Through disciplined acquisitions, centralized capital and strategy, and decentralized day-to-day operations, T3 Defense aims to strengthen essential defense capabilities and build long-term value. For more information, visit www.t3dfns.com.
Forward-Looking Statements
This press release contains forward-looking statements within the meaning of Section 27A of the Securities Act of 1933, as amended, and Section 21E of the Securities Exchange Act of 1934, as amended. These statements include, but are not limited to, statements regarding the anticipated benefits of the agreement between Nimbus and Copting, the expected recognition of Nimbus as an authorized training and support center, anticipated demand for tethered drone systems in Israel, projected market growth, and the potential for future orders and revenue. Forward-looking statements are based on the Company’s current expectations and assumptions regarding its business, the economy, and other future conditions. Because forward-looking statements relate to the future, they are subject to inherent uncertainties, risks, and changes in circumstances that are difficult to predict, including risks related to customer adoption of new technologies, the receipt of required Israeli import, aviation and communications approvals and German and European Union export authorizations, the renewal of the agreement beyond its initial term, competition, the Company’s ability to integrate acquired businesses, retain key customers, manage supply chain constraints, and maintain adequate funding for operations. Third-party market research cited in this release has not been independently verified by the Company. Readers are encouraged to review the Risk Factors contained in the Annual Report for the year ended December 31, 2025 filed with the Securities and Exchange Commission and the Company’s other filings with the Securities and Exchange Commission for a discussion of these and other risk factors. The Company’s actual results may differ materially from those contemplated by the forward-looking statements. The Company undertakes no obligation to publicly update or revise any forward-looking statements, whether as a result of new information, future events, or otherwise, except as required by law.
For more information
T3 Defense Inc. 575 Fifth Avenue, 14th Floor New York, NY 10017 www.t3dfns.com
Investor Relations The Equity Group Inc. Lena Cati [email protected] +1 212 836-9611
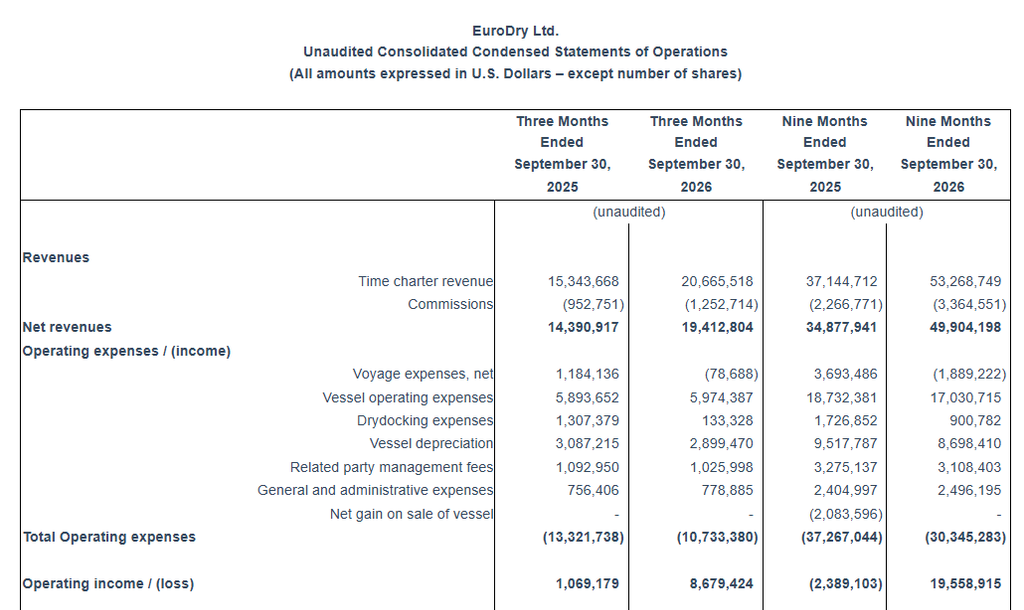
ATHENS, Greece, Nov. 11, 2026 (GLOBE NEWSWIRE) — EuroDry Ltd. (NASDAQ: EDRY, the “Company” or “EuroDry”), an owner and operator of drybulk vessels and provider of seaborne transportation for drybulk cargoes, announced today its results for the three and nine-month periods ended September 30, 2026.
Third Quarter 2026 Highlights:
Total net revenues for the quarter of $19.4 million.
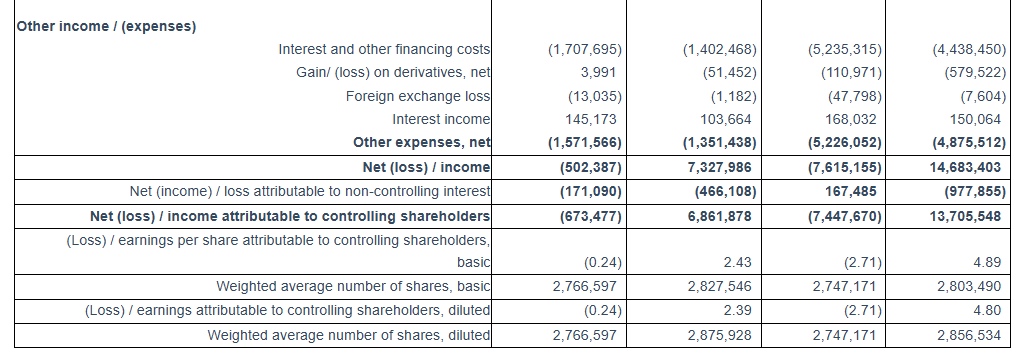
Net income attributable to controlling shareholders, of $6.9 million or $2.43 and $2.39 earnings per share attributable to controlling shareholders basic and diluted, respectively.
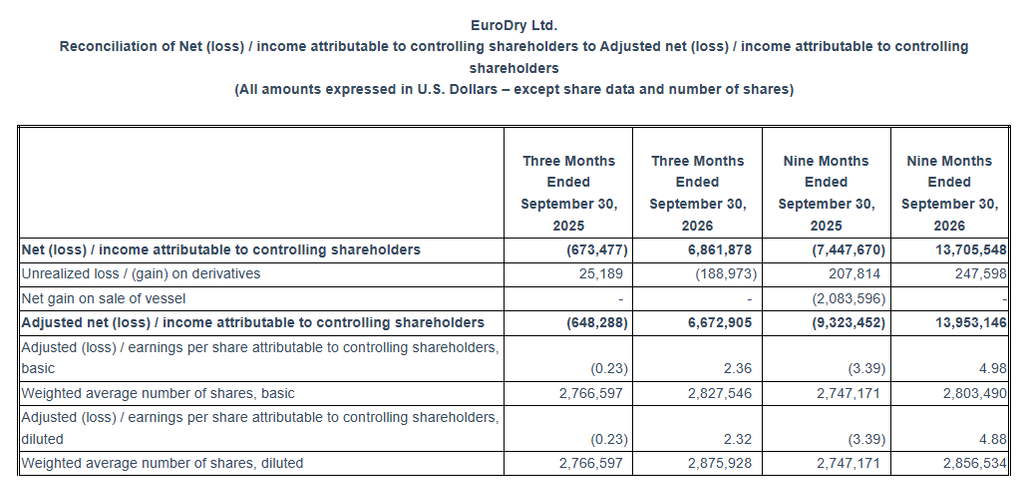
Adjusted net income1 attributable to controlling shareholders for the quarter of $6.7 million or $2.36 and $2.32 adjusted earnings per share attributable to controlling shareholders basic and diluted, respectively.
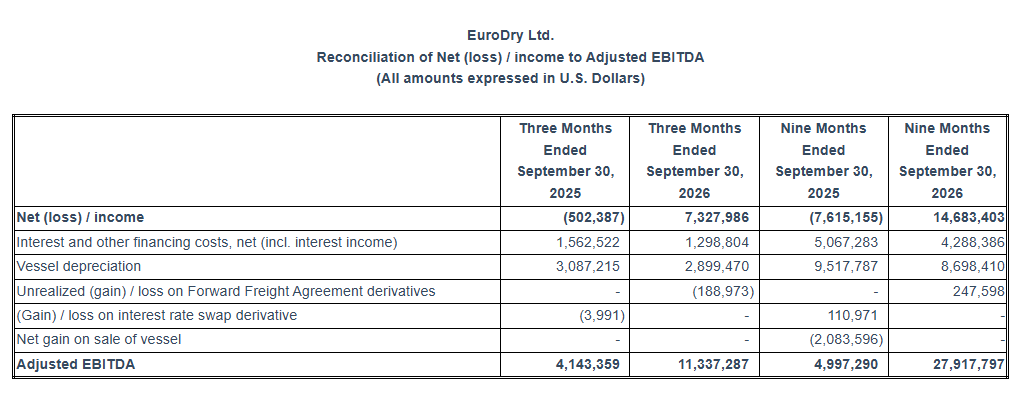
Adjusted EBITDA1 for the quarter was $11.3 million.
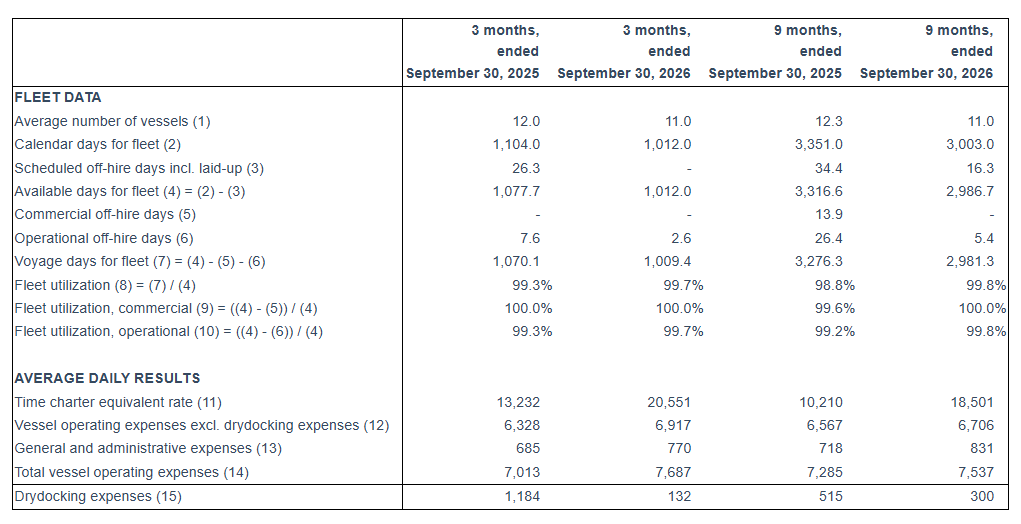
An average of 11.0 vessels were owned and operated during the third quarter of 2026 earning an average time charter equivalent rate of $20,551 per day. Refer to a subsequent section of the Press Release for the definition and method of calculation of the time charter equivalent rate.
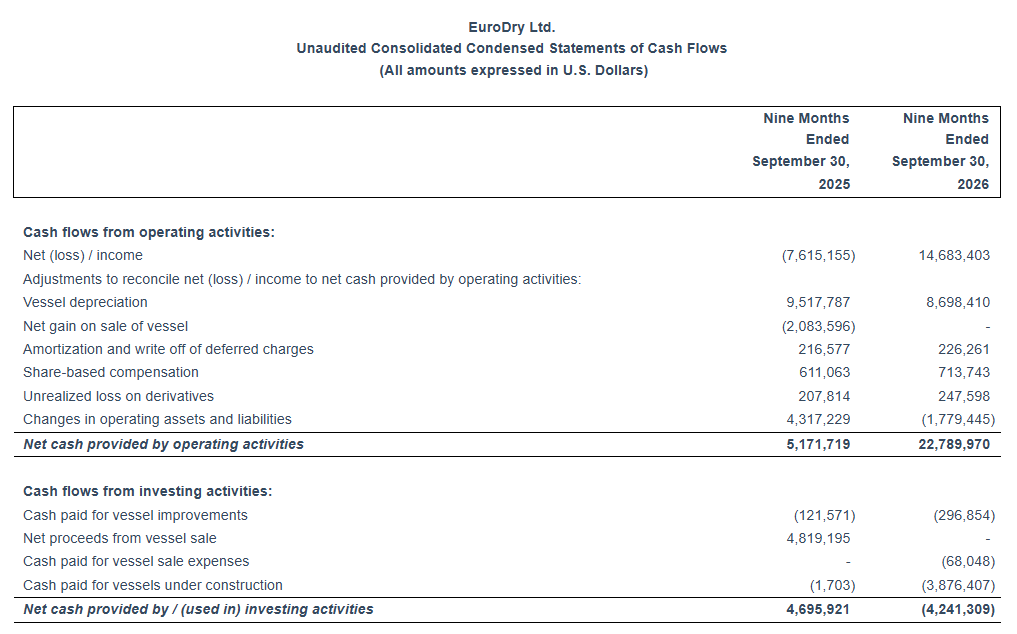
To-date, about $5.8 million has been used to repurchase 358,130 shares of the Company, under our share repurchase plan of up to $10 million, announced in August 2022. The Board approved the continuation of the share repurchase plan for a further year in August 2026 and will review it again after a period of twelve months.
Nine Months 2026 Highlights:
Total net revenues of $49.9 million.
Net income attributable to controlling shareholders was $13.7 million or $4.89 and $4.80 earnings per share attributable to controlling shareholders basic and diluted, respectively.
Adjusted net income1 attributable to controlling shareholders for the period was $14.0 million or $4.98 and $4.88 adjusted earnings per share attributable to controlling shareholders basic and diluted1, respectively.
Adjusted EBITDA1 was $27.9 million.
An average of 11.0 vessels were owned and operated during the first nine months of 2026 earning an average time charter equivalent rate of $18,501 per day. Refer to a subsequent section of the Press Release for the definition and method of calculation of the time charter equivalent rate.
Recent developments and financing arrangements:
As previously announced, the Company signed a contract with Hengli Shipbuilding (Dalian) for the construction of a third 82,000 DWT Kamsarmax bulk carrier. The vessel will be built to an eco-design specification compliant with EEDI Phase 3 standards and is scheduled to be delivered during the third quarter of 2029. The total consideration for the newbuilding contract is approximately $37.0 million and is expected to be financed with a combination of debt and equity. The contract is conditional upon receiving a refund guarantee from a bank acceptable to the Company.
During September and October 2026, the Company re-established its At-The-Market (“ATM”) program raising the amount of $10.7 million by issuing 163,753 common shares (approximately 5.4% of its outstanding shares) at an average price of $67.54.
__________________________ 1Adjusted EBITDA, Adjusted net (loss) / income attributable to controlling shareholders and Adjusted (loss) / earnings per share attributable to controlling shareholders are not recognized measurements under US GAAP (GAAP) and should not be used in isolation or as a substitute for EuroDry’s financial results presented in accordance with GAAP. Refer to a subsequent section of the Press Release for the definitions and reconciliation of these measurements to the most directly comparable financial measures calculated and presented in accordance with GAAP.
Aristides Pittas, Chairman and CEO of EuroDry, commented: “During the third quarter of 2026 market rates for the vessel segments we operate recorded recent years highs, a development that was reflected in our financial results for the quarter. While the market for our segments has softened a bit during the month of October, more so for Panamax/Kamsarmax vessels than for Ultramax ones, it is still at levels that, if maintained, will generate significant earnings for our fleet. We remain optimistic about the prospects of the drybulk market as a normal orderbook level after several years of underbuilding is put against increased vessel demand stemming from both revived drybulk trades and continuing inefficiencies in the transportation system.
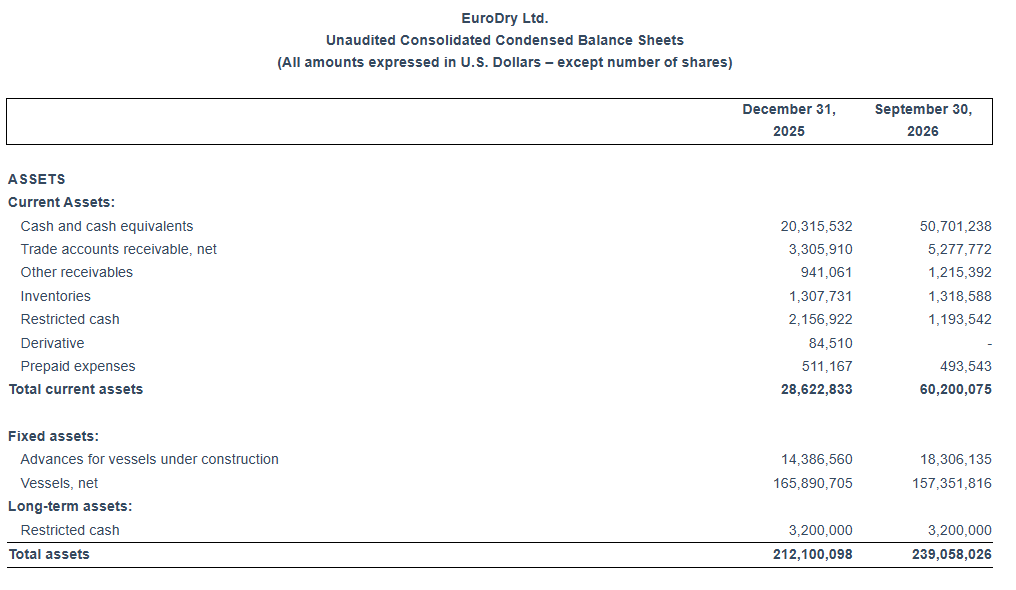
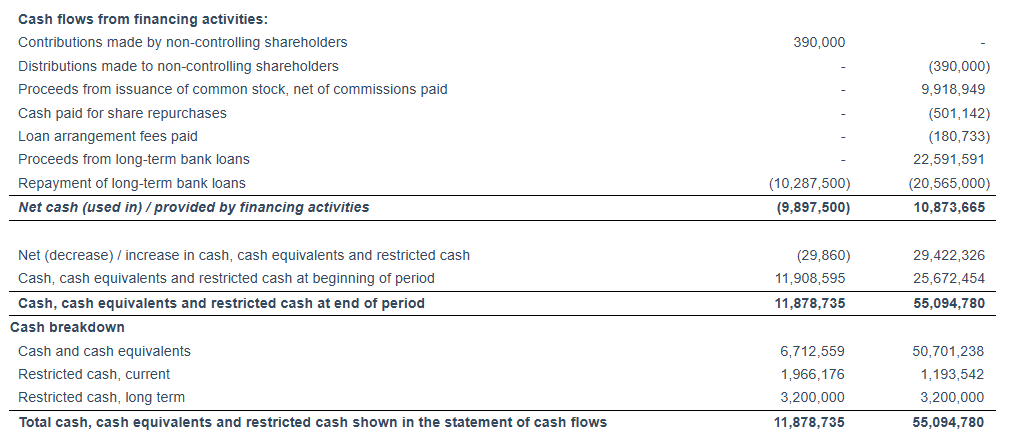
“Our share price reacted to the strength of the shipping rates reaching new highs and exceeding for a certain period our Net Asset Value per share (“NAV”). We took advantage of this development and raised about $10.7m at price levels accretive to NAV. Those funds along with funds from the recent refinancing of one of our vessels as well as funds generated by operations have resulted at cash balance at the end of the quarter of more than $50m net of any restricted cash, thus, providing us with significant liquidity to fund the equity portion of our expanded newbuilding program and invest in accretive opportunities when they appear.
“We are very pleased with these developments and with the expansion of our newbuilding program which now consists of five vessels in total after we ordered an additional Kamsarmax vessel. This program, when completed, will result in our fleet being one of the youngest amongst our peers with a minimal environmental footprint. In a period of continuing geopolitical instability, rebalancing of trade flows and adjustment of trading routes, we believe that a young and efficient fleet will ensure increased financial rewards for our shareholders.”
Tasos Aslidis, Chief Financial Officer of EuroDry, commented: “Comparing our results for the third quarter of 2026 with the same period of 2025, our net revenues increased by about $5.0 million, due to the increased time charter equivalent rates our vessels earned for the period partly offset by the lower average number of vessels owned and operated in the period as compared to the third quarter of 2025. The time charter equivalent rates our vessels earned for the period were at $20,551, 55.3% higher compared to $13,232 earned in the third quarter of 2025. On average, 11.0 vessels were owned and operated during the third quarter of 2026 compared to 12.0 vessels in the same period of 2025. Operating expenses, including management fees, increased from $6,328 per vessel per day in the third quarter of 2025 to $6,917 in the third quarter of 2026 mainly due to the depreciation of the US dollar and due to the increased cost of vessel supplies during the period, because of the war in the Middle East region, while General and Administrative expenses averaged $770 per vessel per day during the third quarter of 2026 as compared to $685 per vessel per day for the same quarter of last year due to increased cost for our stock incentive plan.
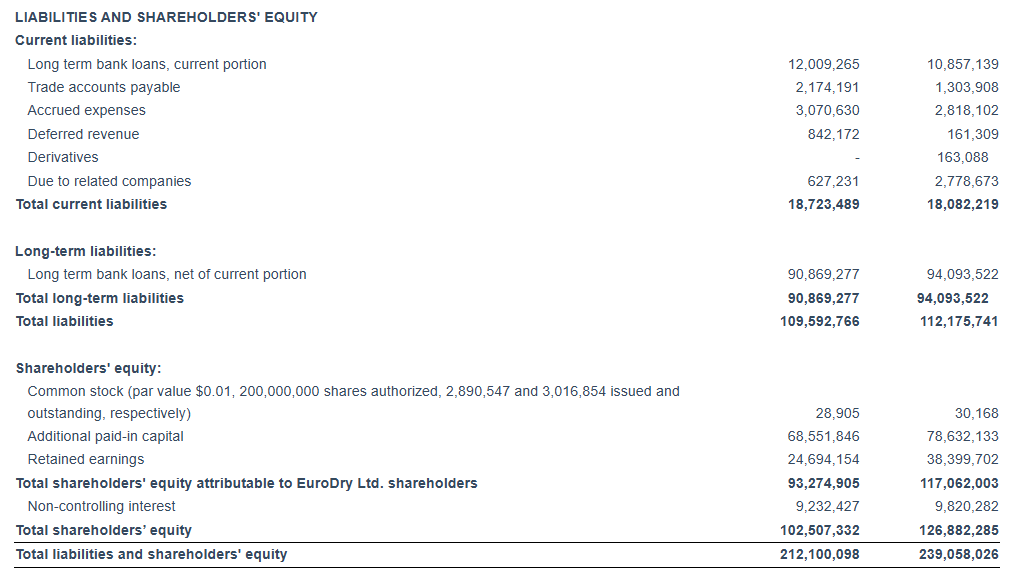
Adjusted EBITDA during the third quarter of 2026 was $11.3 million compared to $4.1 million achieved for the third quarter of last year. As of September 30, 2026, our outstanding debt (excluding the unamortized loan fees) was $105.7 million while unrestricted and restricted cash was $55.1 million. As of the same date, our scheduled debt repayments including balloon payments over the next 12 months amounted to about $11.1 million (excluding the unamortized loan fees) and all our loan covenants are satisfied.”
Third Quarter 2026 Results:
For the third quarter of 2026, the Company reported total net revenues of $19.4 million representing a 34.9% increase over total net revenues of $14.4 million during the third quarter of 2025, which was primarily the result of the increased time charter equivalent rates our vessels earned for the period partly offset by the lower average number of vessels operating in the third quarter of 2026 compared to the corresponding period of 2025. On average, 11.0 vessels were owned and operated during the third quarter of 2026 earning an average time charter equivalent rate of $20,551 per day compared to 12.0 vessels in the same period of 2025 earning on average $13,232 per day.
For the third quarter of 2026, a gain on bunkers resulted in positive voyage expenses of $0.1 million, as compared to voyage expenses of $1.2 million for the same period in 2025, mainly reflecting costs related to vessels repositioning between charters and expenses incurred during operational off-hire periods.
Vessel operating expenses increased to $6.0 million for the third quarter of 2026 from $5.9 million for the third quarter of 2025. The increase is due to the increased cost of vessel supplies during the period, because of the war in the Middle East region, partly offset by the lower average number of vessels owned and operated in the third quarter of 2026 compared to the corresponding period of 2025.
During the third quarter of 2026, one of our vessels completed her intermediate survey in-water, for a total cost of $0.1 million. During the third quarter of 2025, one of our vessels completed her special survey with drydocking which commenced in the second quarter of 2025, for a total cost of $1.1 million. The additional cost of $0.2 million for the second quarter of 2025 relates to expenses incurred in relation to an upcoming special survey with drydocking.
Vessel depreciation for the third quarter of 2026 amounted to $2.9 million, compared to $3.1 million for the same period of 2025. This decrease is again due to the lower number of vessels operating in the third quarter of 2026 as compared to the same period of 2025.
Related party management fees for the period decreased to $1.0 million compared to $1.1 million for the same period of last year. This was the result of the decreased number of vessels owned and operated in the third quarter of 2026, partly offset by the adjustment for inflation in the daily vessel management fee, effective from January 1, 2026, increasing it from 850 Euros to 875 Euros.
General and administrative expenses remained at the same level of $0.8 million in the third quarter of 2026 and 2025.
Total interest and other financing costs for the third quarter of 2026 amounted to $1.5 million, of which $0.1 million related to interest charged and capitalized in relation to our newbuilding program was, compared to $1.7 million for the same period of 2025. Interest expense during the third quarter of 2026 was lower mainly due to the decreased benchmark rates of our loans, partly offset by the increased average debt during the third quarter of 2026, as compared to the same period of last year.
For the three months ended September 30, 2026, the Company recognized a $0.24 million realized loss and a $0.19 million unrealized gain on forward freight agreement contracts. For the three months ended September 30, 2025, the Company recognized a $0.025 million unrealized loss and a $0.03 million realized gain on one interest rate swap contract.
Interest income for the third quarter of 2026 amounted to $0.10 million compared to $0.15 million interest income for the same period of 2025.
The Company reported net income for the period of $7.3 million and net income attributable to controlling shareholders of $6.9 million, as compared to a net loss of $0.5 million and a net loss attributable to controlling shareholders of $0.7 million for the same period of 2025. The net income attributable to the non-controlling interest of $0.5 million in the third quarter of 2026 represents the income attributable to the 39% ownership of the entities owning the M/V Christos K and M/V Maria represented by NRP Project Finance AS (“NRP investors”) (the “Partnership”).
Adjusted EBITDA for the third quarter of 2026 was $11.3 million compared to $4.1 million achieved during the third quarter of 2025.
Basic and diluted earnings per share attributable to controlling shareholders for the third quarter of 2026 was $2.43 and $2.39 calculated on 2,827,546 and 2,875,928 basic and diluted weighted average number of shares outstanding, compared to loss per share attributable to controlling shareholders of $0.24 calculated on 2,766,597 basic and diluted weighted average number of shares outstanding for the third quarter of 2025.
Excluding the effect on the net income attributable to controlling shareholders for the quarter of the unrealized (gain) / loss on derivatives, the adjusted earnings attributable to controlling shareholders for the quarter ended September 30, 2026 would have been $2.36 and $2.32 per share basic and diluted, compared to adjusted loss attributable to controlling shareholders of $0.23 per share basic and diluted, for the quarter ended September 30, 2025. Usually, security analysts do not include the above item in their published estimates of earnings per share.
First Nine Months 2026 Results:
For the first nine months of 2026, the Company reported total net revenues of $49.9 million representing a 43.1% increase over total net revenues of $34.9 million during the first nine months of 2025, which was mainly the result of the increased time charter equivalent rates our vessels earned for the period partly offset by the lower number of vessels operated during the nine-month period of 2026 compared to the same period of 2025. On average, 11.0 vessels were owned and operated during the first nine months of 2026 earning an average time charter equivalent rate of $18,501 per day compared to 12.3 vessels in the same period of 2025 earning on average $10,210 per day.
For the nine months of 2026, a gain on bunkers resulted in positive voyage expenses of $1.9 million. For the same period of 2025, voyage expenses, net, were $3.7 million, mainly reflecting costs related to vessels repositioning between charters and expenses incurred during operational off-hire periods.
Vessel operating expenses were $17.0 million for the nine months of 2026 as compared to $18.7 million for the same period of 2025. The decrease is mainly attributable to the decreased number of vessels operating in the first nine months of 2026, partly offset by the increased cost of vessel supplies during the period, because of the war in the Middle East region compared to the corresponding period of 2025.
In the first nine months of 2026, one of our vessels completed its special survey with drydock which commenced in the fourth quarter of 2025 and two of our vessels completed their intermediate survey in water for a total cost of $0.9 million. During the same period of 2025, one vessel completed her intermediate survey in water, and another one completed her special survey with drydocking for a total cost of $1.5 million. The additional cost of $0.2 million relates to expenses incurred in relation to an upcoming special survey with drydocking.
Vessel depreciation for the first nine months of 2026 was $8.7 million compared to $9.5 million during the same period of 2025, mainly due to the lower number of vessels operating in the same period.
Related party management fees for the first nine months of 2026 were decreased to $3.1 million from $3.3 million for the same period of 2025 due to the lower average number of vessels owned and operated in the nine month period of 2026 partly offset by the adjustment for inflation in the daily vessel management fee, effective from January 1, 2026, increasing it from 850 Euros to 875 Euros, and the unfavorable movement of the euro/dollar exchange rate during the period.
General and administrative expenses in the first nine months of 2026 were slightly increased to $2.5 million as compared to $2.4 million for the same period of last year, mainly due to increased cost for our stock incentive plan.
On January 29, 2025, the Company signed an agreement to sell M/V Tasos, a 75,100 dwt drybulk vessel, built in 2000, for demolition, for approximately $5 million. The vessel was delivered to its buyers, an unaffiliated third party, on March 17, 2025, resulting in a gain on sale of $2.1 million. No case of vessel sale exists within the first nine months of 2026.
Total interest and other financing costs for the first nine months of 2026 amounted to $4.5 million, of which $0.1 million relates to interest charged and capitalized in relation to our newbuilding program was, compared to $5.2 million for the same period of 2025. This decrease is mainly due to the decreased benchmark rates of our loans, partly offset by the increased average debt during the first nine months of 2026, as compared to the same period of last year.
For the nine months ended September 30, 2026, the Company recognized a $0.2 million unrealized loss and a $0.3 million realized loss on forward freight agreement contracts. For the nine months ended September 30, 2025, the Company recognized a $0.2 million unrealized loss and a $0.1 million realized gain on one interest rate swap.
Interest income for the first nine months of 2026 amounted to $0.15 million compared to $0.17 million interest income for the same period of 2025.
The Company reported net income for the period of $14.7 million and net income attributable to controlling shareholders of $13.7 million, as compared to a net loss of $7.6 million and a net loss attributable to controlling shareholders of $7.4 million, for the first nine months of 2025. The net income attributable to the non-controlling interest of $1.0 million in the first nine months of 2026 represents the income attributable to the 39% ownership of the Partnership.
Adjusted EBITDA for the first nine months of 2026 was $27.9 million compared to $5.0 million achieved during the first nine months of 2025.
Basic and diluted earnings per share attributable to controlling shareholders for the first nine months of 2026 was $4.89 and $4.80, calculated on 2,803,490 and 2,856,534 basic and diluted weighted average number of shares outstanding compared to loss per share attributable to controlling shareholders of $2.71, calculated on 2,747,171 basic and diluted weighted average number of shares outstanding for the same period of 2025.
Excluding the effect on the net income attributable to controlling shareholders for the first nine months of the year of the unrealized (gain) / loss on derivatives and the net gain on sale of vessel (if any), the adjusted earnings attributable to controlling shareholders for the nine-month period ended September 30, 2026, were $4.98 and $4.88, compared to adjusted loss attributable to controlling shareholders of $3.39 per share basic and diluted, for the nine-month period ended September 30, 2025. As previously mentioned, usually, security analysts do not include the above items in their published estimates of earnings per share.
Fleet Profile:
The EuroDry Ltd. fleet profile is as follows:
Note: (*) TC denotes time charter. Charter duration indicates the earliest redelivery date (**) The average Baltic Supramax S10TC Index is an index based on ten Supramax time charter routes. (***) The entity owning the vessel is 61% owned by EuroDry Ltd. and 39% by NRP Investors.
Summary Fleet Data:
(1) Average number of vessels is the number of vessels that constituted the Company’s fleet for the relevant period, as measured by the sum of the number of calendar days each vessel was a part of the Company’s fleet during the period divided by the number of calendar days in that period.
(2) Calendar days. We define calendar days as the total number of days in a period during which each vessel in our fleet was owned by us including off-hire days associated with major repairs, drydockings or special or intermediate surveys or days of vessels in lay-up. Calendar days are an indicator of the size of our fleet over a period and affect both the amount of revenues and the amount of expenses that we record during that period.
(3) The scheduled off-hire days including vessels laid-up are days associated with scheduled repairs, drydockings or special or intermediate surveys or days of vessels in lay-up.
(4) Available days. We define available days as the total number of Calendar days in a period net of scheduled off-hire days incl. laid up. We use available days to measure the number of days in a period during which vessels were available to generate revenues.
(5) Commercial off-hire days. We define commercial off-hire days as days a vessel is idle without employment.
(6) Operational off-hire days. We define operational off-hire days as days associated with unscheduled repairs or other off-hire time related to the operation of the vessels.
(7) Voyage days. We define voyage days as the total number of days in a period during which each vessel in our fleet was in our possession net of commercial and operational off-hire days, but including days our vessels were sailing for repositioning. We use voyage days to measure the number of days in a period during which vessels actually generate revenues or are sailing for repositioning purposes.
(8) Fleet utilization. We calculate fleet utilization by dividing the number of our voyage days during a period by the number of our available days during that period. We use fleet utilization to measure a company’s efficiency in finding suitable employment for its vessels and minimizing the amount of days that its vessels are off-hire for reasons such as unscheduled repairs or days waiting to find employment.
(9) Fleet utilization, commercial. We calculate commercial fleet utilization by dividing our available days net of commercial off-hire days during a period by our available days during that period.
(10) Fleet utilization, operational. We calculate operational fleet utilization by dividing our available days net of operational off-hire days during a period by our available days during that period.
(11) Average time charter equivalent rate, or average TCE, is a metric of the average daily net revenue performance of our vessels. Our method of calculating average TCE is determined by dividing time charter revenue and voyage charter revenue, if any, net of voyage expenses by voyage days for the relevant time period. Voyage expenses primarily consist of port, canal and fuel costs that are unique to a particular voyage, which would otherwise be paid by the charterer under a time charter contract or are related to repositioning the vessel for the next charter. Average TCE provides additional meaningful information in conjunction with time charter revenue and voyage charter revenue, if any, the most directly comparable GAAP measure, because it assists our management in making decisions regarding the deployment and use of our vessels and because we believe that it provides useful information to investors regarding our financial performance. Average TCE is a standard shipping industry performance metric used primarily to compare period-to-period changes in a shipping company’s performance despite changes in the mix of charter types (i.e., spot voyage charters, time charters, pool agreements and bareboat charters) under which the vessels may be employed between the periods. Our definition of average TCE may not be comparable to that used by other companies in the shipping industry.
(12) We calculate daily vessel operating expenses, which include crew costs, provisions, deck and engine stores, lubricating oil, insurance, maintenance and repairs and related party management fees by dividing vessel operating expenses and related party management fees by fleet calendar days for the relevant time period. Drydocking expenses are reported separately.
(13) Daily general and administrative expenses are calculated by us by dividing general and administrative expenses by fleet calendar days for the relevant time period.
(14) Total vessel operating expenses, or TVOE, is a measure of our total expenses associated with operating our vessels. We compute TVOE as the sum of vessel operating expenses, related party management fees and general and administrative expenses; drydocking expenses are not included. Daily TVOE is calculated by dividing TVOE by fleet calendar days for the relevant time period.
(15) Daily drydocking expenses are calculated by us by dividing drydocking expenses by the fleet calendar days for the relevant period. Drydocking expenses include expenses during drydockings that would have been capitalized and amortized under the deferral method. Drydocking expenses could vary substantially from period to period depending on how many vessels underwent drydocking during the period. The Company expenses drydocking expenses as incurred.
Conference Call and Webcast: Today, November 11, 2026 at 9:30 a.m. Eastern Time, the Company’s management will host a conference call and webcast to discuss the results.
Conference Call details: Participants should dial into the call 10 minutes before the scheduled time using the following numbers: 877-405-1226 (US Toll-Free Dial In) or +1 201-689-7823 (US and Standard International Dial In). Please quote “EuroDry” to the operator and/or conference ID 13763751. Click here for additional participant International Toll-Free access numbers.
Alternatively, participants can register for the call using the call me option for a faster connection to join the conference call. You can enter your phone number and let the system call you right away. Click here for the call me option.
Audio webcast – Slides Presentation: There will be a live and then archived webcast of the conference call and accompanying slides, available on the Company’s website. To listen to the archived audio file, visit our website http://www.eurodry.gr and click on Company Presentations under our Investor Relations page. Participants to the live webcast should register on the website approximately 10 minutes prior to the start of the webcast.
The slide presentation for the third quarter ended September 30, 2026, will also be available in PDF format 10 minutes prior to the conference call and webcast, accessible on the company’s website (www.eurodry.gr) on the webcast page. Participants to the webcast can download the PDF presentation.
Adjusted EBITDA Reconciliation: EuroDry Ltd. considers Adjusted EBITDA to represent net (loss) / income before interest and other financing costs, net (including interest income), income taxes, vessel depreciation, unrealized (gain) / loss on Forward Freight Agreement derivatives (“FFAs”), (gain) / loss on interest rate swap derivative and net gain on sale of vessel. Adjusted EBITDA does not represent and should not be considered as an alternative to net (loss) / income, as determined by United States generally accepted accounting principles, or GAAP. Adjusted EBITDA is included herein because it is a basis upon which the Company assesses its financial performance because the Company believes that this non-GAAP financial measure assists our management and investors by increasing the comparability of our performance from period to period by excluding the potentially disparate effects between periods of, financial costs, unrealized (gain) / loss on FFAs, (gain) / loss on interest rate swap derivative, net gain on sale of vessel and vessel depreciation. The Company’s definition of Adjusted EBITDA may not be the same as that used by other companies in the shipping or other industries.
Adjusted net (loss) / income attributable to controlling shareholders and Adjusted (loss) / income per share attributable to controlling shareholders Reconciliation:
EuroDry Ltd. considers Adjusted net (loss) / income attributable to controlling shareholders, to represent net (loss) / income before unrealized loss / (gain) on derivatives, which includes FFAs and interest rate swap, and net gain on sale of vessel. Adjusted net (loss) / income attributable to controlling shareholders and Adjusted (loss) / earnings per share attributable to controlling shareholders are included herein because we believe they assist our management and investors by increasing the comparability of the Company’s fundamental performance from period to period by excluding the potentially disparate effects between periods of unrealized loss / (gain) on derivatives and net gain on sale of vessel, which may significantly affect results of operations between periods.
Adjusted net (loss) / income attributable to controlling shareholders and Adjusted (loss) / earnings per share attributable to controlling shareholders do not represent and should not be considered as an alternative to net (loss) / income attributable to controlling shareholders or (loss) / earnings per share attributable to controlling shareholders, as determined by GAAP. The Company’s definition of Adjusted net (loss) / income attributable to controlling shareholders and Adjusted (loss) / earnings per share attributable to controlling shareholders may not be the same as that used by other companies in the shipping or other industries. Adjusted net (loss) / income attributable to controlling shareholders and Adjusted (loss) / earnings per share attributable to controlling shareholders are not adjusted for all non-cash income and expense items that are reflected in our statement of cash flows.
About EuroDry Ltd. EuroDry Ltd. was formed on January 8, 2018 under the laws of the Republic of the Marshall Islands to consolidate the drybulk fleet of Euroseas Ltd into a separate listed public company. EuroDry was spun-off from Euroseas Ltd on May 30, 2018; it trades on the NASDAQ Capital Market under the ticker EDRY.
EuroDry operates in the dry cargo, drybulk shipping market. EuroDry’s operations are managed by Eurobulk Ltd., an ISO 9001:2008 and ISO 14001:2004 certified affiliated ship management company and Eurobulk (Far East) Ltd. Inc., which are responsible for the day-to-day commercial and technical management and operations of the vessels. EuroDry employs its vessels on spot and period charters and under pool agreements.
The Company has a fleet of 11 vessels, including 3 Panamax drybulk carriers, 5 Ultramax drybulk carriers, 2 Kamsarmax drybulk carriers and 1 Supramax drybulk carrier. EuroDry’s 11 drybulk carriers have a total cargo capacity of 766,420 dwt. After the delivery of two Ultramax vessels in 2027 and the delivery of the three Kamsarmax vessels in 2028 and 2029, the Company’s fleet will consist of 16 vessels with a total carrying capacity of 1,139,420 dwt.
Forward Looking Statement This press release contains forward-looking statements (as defined in Section 27A of the Securities Act of 1933, as amended, and Section 21E of the Securities Exchange Act of 1934, as amended) concerning future events and the Company’s growth strategy and measures to implement such strategy; including expected vessel acquisitions and entering into further time charters. Words such as “expects,” “intends,” “plans,” “believes,” “anticipates,” “hopes,” “estimates,” and variations of such words and similar expressions are intended to identify forward-looking statements. Although the Company believes that the expectations reflected in such forward-looking statements are reasonable, no assurance can be given that such expectations will prove to have been correct. These statements involve known and unknown risks and are based upon a number of assumptions and estimates that are inherently subject to significant uncertainties and contingencies, many of which are beyond the control of the Company. Actual results may differ materially from those expressed or implied by such forward-looking statements. Factors that could cause actual results to differ materially include, but are not limited to changes in the demand for dry bulk vessels, competitive factors in the market in which the Company operates; risks associated with operations outside the United States; and other factors listed from time to time in the Company’s filings with the Securities and Exchange Commission. The Company expressly disclaims any obligations or undertaking to release publicly any updates or revisions to any forward-looking statements contained herein to reflect any change in the Company’s expectations with respect thereto or any change in events, conditions or circumstances on which any statement is based.
PDF VersionSRR supports continued systems engineering and integration activities
SAN DIEGO, Nov. 11, 2026 (GLOBE NEWSWIRE) — Kratos Defense & Security Solutions, Inc. (Nasdaq: KTOS), a technology company in the defense, national security and global markets, today announced it has successfully completed the System Requirements Review (SRR) supporting the U.S. Space Force’s (USSF) Space Systems Command (SSC) Ground Management and Integration (GMI) effort for the Resilient Missile Warning and Tracking (MWT) program.
The SRR is a technical milestone supporting continued requirements development, systems engineering, and integration planning for the GMI effort. Kratos completed the SRR within the planned review period.
Kratos used advanced digital engineering and model-based systems engineering (MBSE) tools to support the review process, including requirements development and system-integration planning. The work supports an open, interoperable approach intended to enable integration across multiple space and ground segments.
The GMI effort supports development of resilient, integrated ground architecture for the Resilient MWT program. Kratos is integrating their unique ground system with the SSC Future Operationally Resilient Ground Evolution (FORGE) platform to support evolving constellation and mission requirements.
The SRR supported continued systems engineering and integration activities for the GMI effort, ensuring that stronger missile warning and tracking capabilities will be delivered to the Joint warfighter.
About Kratos Defense & Security Solutions Kratos Defense & Security Solutions, Inc. (NASDAQ: KTOS) is a technology, products, system and software company addressing the defense, national security, and commercial markets. Kratos makes true internally funded research, development, capital and other investments, to rapidly develop, produce and field solutions that address our customers’ mission critical needs and requirements. At Kratos, affordability is a technology, and we seek to utilize proven, leading-edge approaches and technology, not unproven bleeding edge approaches or technology, with Kratos’ approach designed to reduce cost, schedule and risk, enabling us to be first to market with cost effective solutions. We believe that Kratos is known as an innovative disruptive change agent in the industry, a company that is an expert in designing products and systems up front for successful rapid, large quantity, low-cost future manufacturing which is a value-add competitive differentiator for our large traditional prime system integrator partners and also to our government and commercial customers. Kratos intends to pursue program and contract opportunities as the prime or lead contractor when we believe that our probability of win (PWin) is high and any investment required by Kratos is within our capital resource comfort level. We intend to partner and team with a large, traditional system integrator when our assessment of PWin is greater or required investment is beyond Kratos’ comfort level. Kratos’ primary business areas include virtualized ground systems for satellites and space vehicles including software for command & control (C2) and telemetry, tracking and control (TT&C), jet powered unmanned aerial drone systems, hypersonic vehicles and rocket systems, propulsion systems for drones, missiles, loitering munitions, supersonic systems, space craft and launch systems, C5ISR and microwave electronic products for missile, radar, missile defense, space, satellite, counter UAS, directed energy, communication and other systems, and virtual & augmented reality training systems for the warfighter. For more information, visit www.KratosDefense.com and follow Kratos on LinkedIn and X.
Notice Regarding Forward-Looking Statements Certain statements in this press release may constitute “forward-looking statements” within the meaning of the Private Securities Litigation Reform Act of 1995. These forward-looking statements are made on the basis of the current beliefs, expectations and assumptions of the management of Kratos and are subject to significant risks and uncertainty. Investors are cautioned not to place undue reliance on any such forward-looking statements. All such forward-looking statements speak only as of the date they are made, and Kratos undertakes no obligation to update or revise these statements, whether as a result of new information, future events or otherwise. Although Kratos believes that the expectations reflected in these forward-looking statements are reasonable, these statements involve many risks and uncertainties that may cause actual results to differ materially from what may be expressed or implied in these forward-looking statements. For a further discussion of risks and uncertainties that could cause actual results to differ from those expressed in these forward-looking statements, as well as risks relating to the business of Kratos in general, see the risk disclosures in the Annual Report on Form 10-K of Kratos for the year ended December 28, 2025, and in subsequent reports on Forms 10-Q and 8-K and other filings made with the SEC by Kratos.
Newport Beach, CA, Nov. 11, 2026 (GLOBE NEWSWIRE) — Bimergen Energy Corporation (NYSE American: BESS), a developer, owner, and operator of utility-scale and distributed battery energy storage systems, today announced that members of its management team plan to attend RE+ 2026, taking place November 16–19 at the Las Vegas Convention Center.
During RE+ 2026, Bimergen management plans to meet with existing joint venture partners, battery technology manufacturers, project financing providers, and tax equity participants, while actively pursuing additional strategic relationships with technology providers, developers, and institutional capital partners. These discussions will focus on expanding Bimergen’s strategic network, advancing existing partnerships, evaluating additional financing opportunities, and supporting the continued development and commercialization of the Company’s battery energy storage portfolio.
Bimergen reports a development portfolio of 33 battery energy storage projects representing approximately 2.0 gigawatts across U.S. electricity markets. The projects are at varying stages of development and are not all necessarily financed, under construction, or operating. The company expects its participation in RE+ to support its ongoing work with technology and capital partners as it seeks to advance projects toward commercialization.
About Bimergen Energy Corporation
Bimergen Energy Corporation (NYSE American: BESS) is a U.S.-based energy infrastructure developer, asset owner, and operator focused on utility-scale and distributed battery energy storage systems (BESS). The Company develops projects designed to enhance grid reliability, support renewable energy integration, and provide flexible energy solutions across key U.S. power markets. Bimergen works with technology providers and capital partners to advance projects through development, construction, and long-term operation. For more information about Bimergen Energy, please visit www.bimergen.com.
About RE +
RE+ is North America’s largest clean energy industry event, powered by SEIA (Solar Energy Industries Association) and SEPA (Smart Electric Power Alliance). The 2026 conference will bring together industry participants across energy storage, solar, grid, infrastructure and related technologies.
Media Contact: Dave Gentry RedChip Companies Inc. 1-407-644-4256 | 1-800-REDCHIP (733-2447) [email protected]
Reaffirms Fiscal Year 2026 Outlook Provided on October 19
CHICAGO, Nov. 09, 2026 (GLOBE NEWSWIRE) — FreightCar America, Inc. (NASDAQ: RAIL) (“FreightCar America” or the “Company”), a diversified manufacturer and supplier of railroad freight cars, railcar parts and components, today reported results for the third quarter ended September 30, 2026. Third quarter results were consistent with the preliminary results the Company announced on October 19, 2026.
Third Quarter 2026 Highlights
Revenues of $76.5 million, compared to $160.5 million in the third quarter of 2025, with railcar deliveries of 662 units compared to 1,304 units in the prior year period
Aftermarket revenues grew 65% year over year, reflecting continued organic growth in parts and components and the contribution from our recent acquisitions
Gross margin of 8.8% with gross profit of $6.7 million, compared to gross margin of 15.1% with gross profit of $24.2 million in the third quarter of 2025
Recorded a $4.7 million non-cash gain related to the change in fair market value of the warrant liability, resulting in net income of $8 thousand, or $0.00 per diluted share, and adjusted net loss of $9.5 million, or $(0.28) per diluted share, compared to adjusted net income of $7.8 million, or $0.24 per diluted share, in the prior year period
Adjusted EBITDA of $0.1 million, representing a margin of 0.2%, compared to $15.9 million and a margin of 9.9% in the third quarter of 2025
Ended the quarter with a backlog of 2,660 units valued at $284.5 million, up 28% from $222.0 million at September 30, 2025
Completed the acquisition of Trinity Equipment Company following quarter end, expanding our aftermarket platform and marking our third transaction in less than a year
“While our third quarter results reflect a challenging period for the business, they were consistent with the preliminary figures we reported in October,” said Nick Randall, President and Chief Executive Officer of FreightCar America. “We continued to make progress on our commercial priorities, with order intake through the first nine months exceeding our total for all of 2025 and backlog value up 28% year over year. Following quarter end, we completed our third aftermarket acquisition, further expanding our parts and components offering.”
Randall continued, “Looking ahead, some industry indicators are improving, although we have yet to see that translate into broader growth in railcar demand. Our backlog provides visibility into planned production, and our focus remains on disciplined execution, cost control and converting orders into profitable deliveries. We continue to integrate our acquisitions and grow our aftermarket business, while maintaining the manufacturing flexibility to respond to changes in customer demand.”
Fiscal Year 2026 Outlook
The Company is reaffirming its outlook for fiscal year 2026, as provided on October 19, 2026:
Fiscal 2026 Outlook
Railcar Deliveries
3,100 – 3,300 railcars
Revenue
$370 – $410 million
Adjusted EBITDA1
$15 – $19 million
1. The Company does not provide a reconciliation of forward-looking Adjusted EBITDA guidance due to the inherent difficulty in forecasting and quantifying adjustments necessary to calculate such non-GAAP measure without unreasonable effort. Material changes to such adjustments, including warrant liability and non-core operating items, could affect future GAAP results.
Mike Riordan, Chief Financial Officer of FreightCar America, added, “Our balance sheet remains solid, with no borrowings under our revolving credit facility. Our cost structure has improved, and our aftermarket business is contributing a growing share of our results. Integration of our acquired businesses is on track, and our most recent acquisition is expected to be immediately accretive, consistent with our capital allocation priorities. With our full-year outlook unchanged, our focus is on converting our backlog into profitable deliveries.”
Third Quarter 2026 Conference Call & Webcast Information
The Company will host a conference call and live webcast on Tuesday, November 10, 2026, at 11:00 a.m. (Eastern Time) to discuss its third quarter 2026 financial results. FreightCar America invites shareholders and other interested parties to listen to its financial results conference call. Teleconference details are as follows:
An audio replay of the conference call will be available beginning at 3:00 p.m. (Eastern Time) on Tuesday, November 10, 2026, until 11:59 p.m. (Eastern Time) on Tuesday, November 24, 2026. To access the replay, please dial (844) 512-2921 or (412) 317-6671. The replay passcode is 13763137. An archived version of the webcast will also be available on the FreightCar America Investor Relations website.
About FreightCar America
FreightCar America, headquartered in Chicago, Illinois, is a leading designer, producer and supplier of railroad freight cars, railcar parts and components. We also specialize in railcar repairs, complete railcar rebody services and railcar conversions that repurpose idled rail assets back into revenue service. Since 1901, our customers have trusted us to build quality railcars that are critical to economic growth and instrumental to the North American supply chain. To learn more about FreightCar America, visit www.freightcaramerica.com.
Forward-Looking Statements
This press release contains statements relating to our expected financial performance, financial condition, and/or future business prospects, events and/or plans that are “forward-looking statements” as defined under the Private Securities Litigation Reform Act of 1995. Forward-looking statements represent our estimates and assumptions only as of the date of this press release. Our actual results may differ materially from the results described in or anticipated by our forward-looking statements due to certain risks and uncertainties. These risks and uncertainties relate to, among other things, the cyclical nature of our business; adverse geopolitical, economic and market conditions, including inflation; material disruption in the movement of rail traffic for deliveries; fluctuating costs of raw materials, including steel and aluminum; delays in the delivery of raw materials; our ability to maintain relationships with our suppliers of railcar components; our reliance upon a small number of customers that represent a large percentage of our sales; the variable purchase patterns of our customers and the timing of completion, delivery and customer acceptance of orders; the highly competitive nature of our industry; the risk of lack of acceptance of our new railcar offerings; our ability to successfully integrate acquired businesses and realize the anticipated benefits of acquisitions; potential unexpected changes in laws, rules, and regulatory requirements, including tariffs and trade barriers (including recent United States tariffs imposed or threatened to be imposed on China, Canada, Mexico and other countries and any retaliatory actions taken by such countries); and other competitive factors. The factors listed above are not exhaustive. New factors emerge from time to time that may cause our business not to develop as we expect, and it is not possible for us to predict all of them. We expressly disclaim any duty to provide updates to any forward-looking statements made in this press release, whether as a result of new information, future events or otherwise.
Non-GAAP Financial Measures
This press release includes measures not derived in accordance with generally accepted accounting principles (“GAAP”), such as EBITDA, Adjusted EBITDA, Adjusted net income (loss), Adjusted EPS, and Free cash flow. These non-GAAP measures should not be considered in isolation or as a substitute for any measure derived in accordance with GAAP and may also be inconsistent with similar measures presented by other companies. Reconciliations of these measures to the applicable most closely comparable GAAP measures, and reasons for the Company’s use of these measures, are presented in the attached pages.
Plug-and-Play Advanced and Smart Home Technologies Expected to Be Supplied to Stone Martin Communities in Alabama and Georgia
Third Builder Program Announced by SKYX Deako Since Its Merger Closed October 13, 2026, with Approximately 210,000 Units Across More Than 2,550 Homes
MIAMI, Nov. 10, 2026 (GLOBE NEWSWIRE) — SKYX Platforms Corp. (NASDAQ: SKYX) (d/b/a SKYX Technologies) (the “Company” or “SKYX”), an award-winning, highly disruptive advanced smart home and AI platform technology company with over 120 U.S. and global pending and issued patents and with a mission to make homes and buildings advanced, safe and smart as the new standard, today announced that SKYX and its wholly owned subsidiary Deako expect to supply approximately 70,000 units of their advanced and smart home technologies to Stone Martin communities for more than 850 homes in Georgia and Alabama through 2027. The Company has also extended its exclusive agreement with the developer through 2029.
Stone Martin Builders is a prominent Southeast homebuilder that has been developing communities across Alabama and Georgia for over 20 years.
From resort-style pools and clubhouses to winding nature trails, lakeside views, playgrounds and pavilions, Stone Martin communities are designed to bring neighbors together. Every home pairs that lifestyle with Deako smart home and lighting, a full smart home package, energy-efficient spray foam insulation and personalized design selections, all backed by a 10-year structural warranty.
SKYX–Deako Homebuilder and Merger Highlights
Stone Martin is the third homebuilder program SKYX and Deako have announced since the merger closed on October 13, 2026.
Since the October 13, 2026, merger close, SKYX and Deako have announced three builder programs with approximately 210,000 units expected for more than 2,550 homes.
Stone Martin Builders: Approximately 70,000 units expected for more than 850 homes in Georgia and Alabama.
Home Creations: Approximately 60,000 units expected for more than 700 homes in Oklahoma and Texas.
Maronda Homes: Approximately 80,000 units expected for more than 1,000 homes.
The SKYX Deako combined pipeline of potential future orders estimated at approximately 4 million units, with an expected average selling price of approximately $50 per product.
Deako has shipped more than 32 million units, generated over $26 million in 2025 revenue and established relationships with more than 50 U.S. homebuilders, including D.R. Horton and Toll Brothers.
The combined SKYX–Deako portfolio is designed to provide an end-to-end smart home offering for the builder and hospitality markets.
Management believes the combined product portfolio could increase future revenue per home by up to five times; the merger is expected to reduce annual cash expenses by more than $6 million.
Derek Richardson, Founder and CEO of Deako, stated: “We are proud to grow our partnership with Stone Martin. They lead by making upgraded smart home technology standard in every home, which reflects how thoughtfully they build for their homebuyers. As our technologies are plug-and-play, home buyers can easily add products, including future products and upgrades, over the life of the home.”
Rani Kohen, Founder and Executive Chairman of SKYX Platforms, said: “Working with a community developer such as Stone Martin is another important step in expanding our presence in the U.S. homebuilder market. In the four weeks since we closed our merger with Deako, we have announced three builder programs covering more than 2,550 homes, demonstrating our value proposition for the builder segment. We believe our combined plug-and-play technologies position us to bring safer, more advanced, and smarter solutions to a growing number of homes and buildings, and we expect to continue expanding our builder programs.”
About SKYX Platforms Corp.
SKYX Platforms Corp. (NASDAQ: SKYX) is an advanced smart home, artificial intelligence (AI), and plug-and-play technology platform company with a mission to make homes and buildings safe, advanced, and smart as the new standard. Following its merger with Deako, Inc., SKYX combines complementary technologies designed to simplify the installation, integration, and upgrading of smart home and building systems across residential, commercial, builder, and hospitality markets.
The combined company offers a broad portfolio of plug-and-play platform technologies and products spanning ceiling and wall electrical infrastructure, intelligent lighting and switches, smart home and AI-enabled solutions, and other connected home and building applications. By bringing together SKYX’s ceiling-based technologies and Deako’s established wall-switch platform, the company enables a more comprehensive approach to smart homes and buildings, reducing the complexity associated with traditional wired installations while enhancing convenience, safety, and functionality.
SKYX has a combined portfolio of more than 120 issued and pending U.S. and international patents and patent applications relating to smart home and building platforms, AI, and plug-and-play technologies. Including its wholly owned subsidiary, Deako, SKYX supplies plug-and-play smart lighting technologies to more than 50 U.S. homebuilders and builders. The merger expands SKYX’s opportunities across the homebuilder, professional, commercial, and hospitality markets, while creating potential for future recurring revenue through product upgrades and interchangeability, AI-enabled services, monitoring, subscriptions, and licensing.
In addition to its technology platforms, SKYX owns a portfolio of 60 lighting and home décor websites serving retail and commercial customers. Through its combined technologies and product portfolio, SKYX is focused on advancing the adoption of smart, connected, and safer environments in homes and buildings across the United States and internationally.
Certain statements made in this press release are not based on historical facts, but are forward-looking statements. These statements can be identified by the use of forward-looking terminology such as “aim,” “anticipate,” “believe,” “can,” “could,” “continue,” “estimate,” “expect,” “evaluate,” “forecast,” “guidance,” “intend,” “likely,” “may,” “might,” “objective,” “ongoing,” “outlook,” “plan,” “potential,” “predict,” “probable,” “project,” “seek,” “should,” “target,” “view,” “will,” or “would,” or the negative thereof or other variations thereon or comparable terminology, although not all forward-looking statements contain these words. These statements reflect the Company’s reasonable judgment with respect to future events and are subject to risks, uncertainties and other factors, many of which have outcomes difficult to predict and may be outside our control, that could cause actual results or outcomes to differ materially from those in the forward-looking statements. Such risks and uncertainties include statements relating to the Company’s ability to successfully launch, commercialize, develop additional features and achieve market acceptance of its products and technologies and integrate its products and technologies with third-party platforms or technologies; the Company’s ability to achieve positive cash flows; the Company’s efforts and ability to drive the adoption of its products and technologies as a standard feature, including their use in homes, hotels, offices and cruise ships; the Company’s ability to capture market share; the Company’s estimates of its potential addressable market and demand for its products and technologies; the Company’s ability to raise additional capital to support its operations as needed, which may not be available on acceptable terms or at all; the Company’s ability to continue as a going concern; the Company’s ability to execute on any sales and licensing or other strategic opportunities; the possibility that any of the Company’s products will become National Electrical Code (NEC)-code or otherwise code mandatory in any jurisdiction, or that any of the Company’s current or future products or technologies will be adopted by any state, country, or municipality, within any specific timeframe or at all; risks arising from mergers, acquisitions, joint ventures and other collaborations; the Company’s ability to attract and retain key executives and qualified personnel; guidance provided by management, which may differ from the Company’s actual operating results; the potential impact of unstable market and economic conditions on the Company’s business, financial condition, and stock price; and other risks and uncertainties described in the Company’s filings with the Securities and Exchange Commission, including its periodic reports on Form 10-K and Form 10-Q. There can be no assurance as to any of the foregoing matters. Any forward-looking statement speaks only as of the date of this press release, and the Company undertakes no obligation to update or revise any forward-looking statements, whether as a result of new information, future events or otherwise, except as required by U.S. federal securities laws.