Established High Dose as the Maximum Tolerable Dose in Current OCU400 Clinical Trial
MALVERN, Pa., Dec. 07, 2022 (GLOBE NEWSWIRE) — Ocugen, Inc. (Ocugen or the Company) (NASDAQ: OCGN), a biotechnology company focused on discovering, developing, and commercializing novel gene and cell therapies and vaccines, today announced that the Data Safety and Monitoring Board (DSMB) for the OCU400 clinical trial recently convened and established high dose as the maximum tolerable dose (MTD) in the dose-escalation phase of the study.
“The DSMB has recommended moving forward to dose subsequent subjects with NR2E3 and RHO gene mutations associated with Retinitis Pigmentosa (RP) and CEP290 gene mutations associated with Leber Congenital Amaurosis (LCA) at the targeted dose in the expansion phase of the study,” said Dr. Peter Y. Chang, MD, FACS, Massachusetts Eye Research & Surgery Institution, DSMB Chair for the OCU400 clinical trial. “No serious adverse events (SAEs) related to OCU400 have been reported to date.”
10 patients with NR2E3 and RHO gene mutations associated with RP have been dosed in the Phase 1/2 clinical trial to date. An additional eight patients with these RP gene mutations, along with three patients with CEP290 gene mutations associated with LCA, will be dosed at MTD and enrollment is expected to be complete by the end of Q1 2023.
Data from the MTD has the potential to navigate strategy for the planned Phase 3 study in the U.S. and other major markets. The Company plans to file a Biologics License Application (BLA) for OCU400 in 2025.
Ocugen is committed to finding solutions for people with inherited retinal disease for whom no effective treatment options exist. Currently, RP is associated with mutations in more than 100 genes, affecting more than 2.5 million people globally. LCA is a rare eye disease associated with mutations in more than 25 genes, affecting more than 150,000 people globally.
About Ocugen, Inc. Ocugen, Inc. is a biotechnology company focused on discovering, developing, and commercializing novel gene and cell therapies and vaccines that improve health and offer hope for patients across the globe. We are making an impact on patient’s lives through courageous innovation—forging new scientific paths that harness our unique intellectual and human capital. Our breakthrough modifier gene therapy platform has the potential to treat multiple retinal diseases with a single product, and we are advancing research in infectious diseases to support public health and orthopedic diseases to address unmet medical needs. Discover more at www.ocugen.com and follow us on Twitter and LinkedIn.
Cautionary Note on Forward-Looking Statements This press release contains forward-looking statements within the meaning of The Private Securities Litigation Reform Act of 1995, which are subject to risks and uncertainties. We may, in some cases, use terms such as “predicts,” “believes,” “potential,” “proposed,” “continue,” “estimates,” “anticipates,” “expects,” “plans,” “intends,” “may,” “could,” “might,” “will,” “should,” or other words that convey uncertainty of future events or outcomes to identify these forward-looking statements. Such statements are subject to numerous important factors, risks, and uncertainties that may cause actual events or results to differ materially from our current expectations. These and other risks and uncertainties are more fully described in our periodic filings with the Securities and Exchange Commission (SEC), including the risk factors described in the section entitled “Risk Factors” in the quarterly and annual reports that we file with the SEC. Any forward-looking statements that we make in this press release speak only as of the date of this press release. Except as required by law, we assume no obligation to update forward-looking statements contained in this press release whether as a result of new information, future events, or otherwise, after the date of this press release.
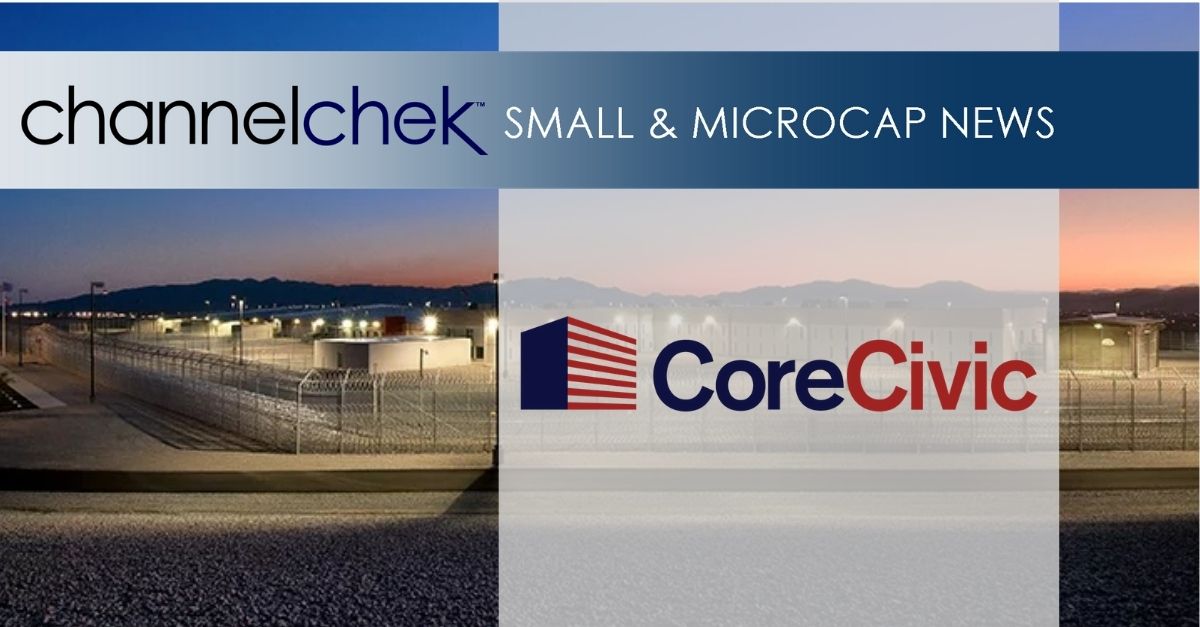
BRENTWOOD, Tenn., Dec. 06, 2022 (GLOBE NEWSWIRE) — CoreCivic, Inc. (NYSE: CXW) (CoreCivic or the Company) announced today it received notice from the California Department of Corrections and Rehabilitation (CDCR) of its intent to terminate the lease agreement for the company-owned, 2,560-bed California City Correctional Center (CCCC) by March 31, 2024, due to the state’s declining inmate population.
The lease agreement is fully funded through the current fiscal year ending June 30, 2023. Funding for the lease of the CCCC for the 2024 fiscal year, beginning July 1, 2023, will be determined in the California legislature in the first half of 2023 as part of the annual budget process. As part of this process the Company plans to engage with the state of California regarding the continued utilization of the CCCC by the CDCR due to its modern infrastructure, efficient design, and comprehensive maintenance program.
Since the lease of the CCCC commenced in 2013, the Company has continually invested in facility enhancements to ensure the CCCC is operating at its optimum performance to the benefit of the facility’s residents, the correctional professionals employed at the CCCC and CDCR. In order to support the Company’s environmental sustainability commitments, the Company recently procured a 100% renewable electricity supply for the facility. The Company believes these factors, along with the advanced age of many of the state of California’s other correctional facilities, support the continued lease of the CCCC by the CDCR.
Rental revenue generated from the CDCR at the CCCC for year ended December 31, 2021, and nine months ended September 30, 2022, was $33.3 million and $25.7 million, respectively, and is reported in the CoreCivic Properties business segment. CoreCivic is very proud of its opportunity over the past nine years to help the state of California successfully manage through its historic challenges with prison overcrowding. The Company believes its relationship with the state of California has demonstrated the value and flexibility it provides to governments across its full range of solutions, including through innovative lease agreements like the one at CCCC.
About CoreCivic
CoreCivic is a diversified, government-solutions company with the scale and experience needed to solve tough government challenges in flexible, cost-effective ways. CoreCivic provides a broad range of solutions to government partners that serve the public good through high-quality corrections and detention management, a network of residential and non-residential alternatives to incarceration to help address America’s recidivism crisis, and government real estate solutions. CoreCivic is the nation’s largest owner of partnership correctional, detention and residential reentry facilities, and believes it is the largest private owner of real estate used by government agencies in the United States. CoreCivic has been a flexible and dependable partner for government for nearly 40 years. CoreCivic’s employees are driven by a deep sense of service, high standards of professionalism and a responsibility to help government better the public good. Learn more at www.corecivic.com.
Forward-Looking Statements
This press release contains statements as to CoreCivic’s beliefs and expectations of the outcome of future events that are “forward-looking” statements within the meaning of Section 21E of the Securities Exchange Act of 1934, as amended, and the Private Securities Litigation Reform Act of 1995, as amended. These forward-looking statements are subject to risks and uncertainties that could cause actual results to differ materially from the statements made. These include, but are not limited to, the risks and uncertainties associated with the timing of the lease termination, which could potentially occur prior to March 31, 2024, and the Company’s intention to engage with the state of California regarding the continued utilization of the CCCC by the CDCR.
CoreCivic takes no responsibility for updating the information contained in this press release following the date hereof to reflect events or circumstances occurring after the date hereof or the occurrence of unanticipated events or for any changes or modifications made to this press release or the information contained herein by any third-parties, including, but not limited to, any wire or internet services.
Gold Assays as high as 2.95 ounces per ton and silver assays as high as 6.68 ounces per ton
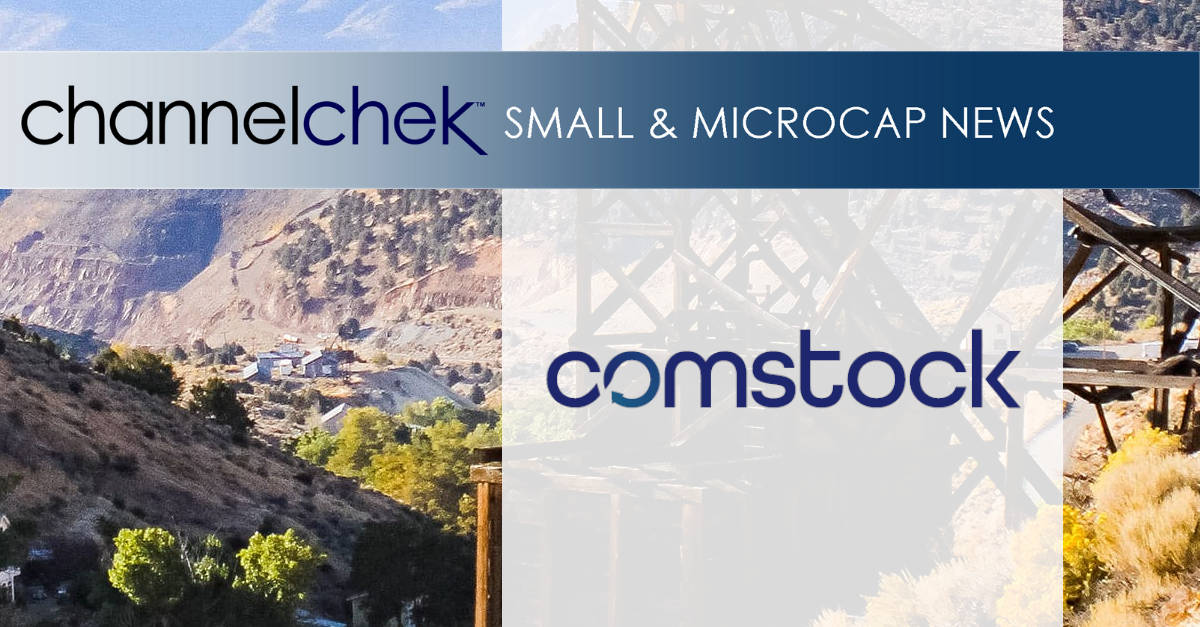
VIRGINIA CITY, NEVADA, December 6, 2022 – Comstock Inc. (NYSE: LODE) (“Comstock” or the “Company”) today announced Corrado De Gasperis, Executive Chairman and CEO, will present a company update, including recent developments in advanced technologies for mineral discoveries, during the Money, Metals & Mining Virtual Expo. Mr. De Gasperis is also a member of the moderated panel, “Energy and Precious Metals: Three Ways to Win” on Wednesday, December 7, at 2:45 pm EST. Following this panel, Mr. De Gasperis will present, “How Advanced Technologies will Transform Discovery and Extraction in All Mining Districts” at 4:00 pm EST. Please register if you want to attend: https://online.moneyshow.com/2022/december/money-metals-mining-virtual-expo/registration/
Last week, Comstock announced the publication of the initial technical report for the Company’s Dayton Consolidated Project detailing an estimated mineral resource constrained within an open pit economic shell based on a gold price of $1,800 per ounce. The estimate includes Measured and Indicated resources containing 293,000 ounces of gold and 2,120,000 ounces of silver, plus an additional Inferred resource containing 90,000 ounces of gold and 480,000 ounces of silver.
The Dayton project has long been known for high grade assays, with gold assays as high as 2.95 ounces per ton, and silver assays as high as 6.68 ounces per ton. Drilling by Comstock has also encountered significant thicknesses of mineralization, including 135 feet averaging 0.218 ounces per ton Au and 0.685 ounces per ton Ag (hole D11-21), 145 feet averaging 0.056 ounces per ton Au and 0.352 ounces per ton Ag (hole D11-33), 50 feet averaging 0.030 ounces per ton Au and 1.072 ounces per ton Ag (hole D94-17), 295 feet averaging 0.027 ounces per ton Au and 0.087 ounces per ton Ag (hole D10-01), and 235 feet averaging 0.031 ounces per ton Au and 0.102 ounces per ton Ag (hole SV12-05).
Behre Dolbear authored the independent, initial assessment of the Dayton Consolidated Project mineral resources, as of November 1, 2022, compliant with current SEC S-K 1300 guidelines.
Comstock (NYSE: LODE) innovates technologies that contribute to global decarbonization and circularity by efficiently converting under-utilized natural resources into renewable fuels and electrification products that contribute to balancing global uses and emissions of carbon. The Company intends to achieve exponential growth and extraordinary financial, natural, and social gains by building, owning, and operating a fleet of advanced carbon neutral extraction and refining facilities, by selling an array of complementary process solutions and related services, and by licensing selected technologies to qualified strategic partners. To learn more, please visit www.comstock.inc.
About Behre Dolbear
Behre Dolbear is a one of the oldest mineral industry advisory firms in the world, continuously operating since 1911. Behre Dolbear authored the Technical Report Summary, Dayton Consolidated Project, Lyon County, Nevada as an independent third-party, following the United States Security and Exchange Commission’s mining rules under subpart 1300 of Regulation S-K.
Forward-Looking Statements
This press release and any related calls or discussions may include forward-looking statements within the meaning of Section 27A of the Securities Act of 1933, as amended, and Section 21E of the Securities Exchange Act of 1934, as amended. All statements, other than statements of historical facts, are forward-looking statements. The words “believe,” “expect,” “anticipate,” “estimate,” “project,” “plan,” “should,” “intend,” “may,” “will,” “would,” “potential” and similar expressions identify forward-looking statements but are not the exclusive means of doing so. Forward-looking statements include statements about matters such as: future industry market conditions; future explorations or acquisitions; future changes in our exploration activities; future prices and sales of, and demand for, our products; land entitlements and uses; permits; production capacity and operations; operating and overhead costs; future capital expenditures and their impact on us; operational and management changes (including changes in the Board of Directors); changes in business strategies, planning and tactics; future employment and contributions of personnel, including consultants; future land sales; investments, acquisitions, joint ventures, strategic alliances, business combinations, operational, tax, financial and restructuring initiatives, including the nature, timing and accounting for restructuring charges, derivative assets and liabilities and the impact thereof; contingencies; litigation, administrative or arbitration proceedings; environmental compliance and changes in the regulatory environment; offerings, limitations on sales or offering of equity or debt securities, including asset sales and associated costs; and future working capital, costs, revenues, business opportunities, debt levels, cash flows, margins, taxes, earnings and growth. These statements are based on assumptions and assessments made by our management considering their experience and their perception of historical and current trends, current conditions, possible future developments, and other factors they believe to be appropriate. Forward-looking statements are not guarantees, representations or warranties and are subject to risks and uncertainties, many of which are unforeseeable and beyond our control and could cause actual results, developments, and business decisions to differ materially from those contemplated by such forward-looking statements. Some of those risks and uncertainties include the risk factors set forth in our filings with the SEC and the following: adverse effects of climate changes or natural disasters; adverse effects of global or regional pandemic disease spread or other crises; global economic and capital market uncertainties; the speculative nature of gold or mineral exploration, and lithium, nickel and cobalt recycling, including risks of diminishing quantities or grades of qualified resources; metal recycling, processing or mining activities; costs, hazards and uncertainties associated with precious metal based activities, including environmentally friendly and economically enhancing clean mining and processing technologies, precious metal exploration, resource development, economic feasibility assessment and cash generating mineral production; costs, hazards and uncertainties associated with metal recycling, processing or mining activities; contests over our title to properties; potential dilution to our stockholders from our stock issuances, recapitalization and balance sheet restructuring activities; potential inability to comply with applicable government regulations or law; adoption of or changes in legislation or regulations adversely affecting our businesses; permitting constraints or delays; ability to achieve the benefits of business opportunities that may be presented to, or pursued by, us, including those involving battery technology, quantum computing and advanced materials development, and development of cellulosic technology in bio-fuels and related carbon-based material production; ability to successfully identify, finance, complete and integrate acquisitions, joint ventures, strategic alliances, business combinations, asset sales, and investments that we may be party to in the future; changes in the United States or other monetary or fiscal policies or regulations; interruptions in our production capabilities due to capital constraints; equipment failures; fluctuation of prices for gold or certain other commodities (such as silver, zinc, lithium, nickel, cobalt, cyanide, water, diesel, gasoline and alternative fuels and electricity); changes in generally accepted accounting principles; adverse effects of war, mass shooting, terrorism and geopolitical events; potential inability to implement our business strategies; potential inability to grow revenues; potential inability to attract and retain key personnel; interruptions in delivery of critical supplies, equipment and raw materials due to credit or other limitations imposed by vendors; assertion of claims, lawsuits and proceedings against us; potential inability to satisfy debt and lease obligations; potential inability to maintain an effective system of internal controls over financial reporting; potential inability or failure to timely file periodic reports with the Securities and Exchange Commission; potential inability to list our securities on any securities exchange or market or maintain the listing of our securities; and work stoppages or other labor difficulties. Occurrence of such events or circumstances could have a material adverse effect on our business, financial condition, results of operations or cash flows, or the market price of our securities. All subsequent written and oral forward-looking statements by or attributable to us or persons acting on our behalf are expressly qualified in their entirety by these factors. Except as may be required by securities or other law, we undertake no obligation to publicly update or revise any forward-looking statements, whether because of new information, future events, or otherwise.
Neither this press release nor any related calls or discussions constitutes an offer to sell, the solicitation of an offer to buy or a recommendation with respect to any securities of the Company, the fund, or any other issuer.
Contact information:
Comstock Inc. P.O. Box 1118 Virginia City, NV 89440 www.comstock.inc
Corrado De Gasperis Executive Chairman & CEO Tel (775) 847-4755 [email protected]
Zach Spencer Director of External Relations Tel (775) 847-5272 Ext.151 [email protected]
MALVERN, Pa., Dec. 06, 2022 (GLOBE NEWSWIRE) — Baudax Bio, Inc. (the “Company” or “Baudax Bio”) (NASDAQ: BXRX), a pharmaceutical company focused on innovative products for hospital and related settings, today announced the closing of its previously announced public offering of an aggregate of 1,042,787 shares of its common stock (or pre-funded warrants in lieu thereof), Series A-3 warrants to purchase up to 1,042,787 shares of common stock and Series A-4 warrants to purchase 1,042,787 shares of common stock, at a combined public offering price of $4.795 per share (or pre-funded warrant) and accompanying warrants. The Series A-3 warrants have an exercise price of $4.50 per share, are exercisable immediately upon issuance and will expire five years from the date of issuance, and the Series A-4 warrants have an exercise price of $4.50 per share, are exercisable immediately upon issuance and will expire thirteen months from the date of issuance.
H.C. Wainwright & Co. acted as the exclusive placement agent for the offering.
The gross proceeds from the offering, before deducting the placement agent’s fees and other offering expenses, were approximately $5 million. The Company intends to use the net proceeds from this offering for working capital, pipeline development activities and general corporate purposes.
The securities described above were offered pursuant to a registration statement on Form S-1 (File No. 333-268251), which was declared effective by the Securities and Exchange Commission (the “SEC”) on December 2, 2022. The offering was made only by means of a prospectus which forms a part of the effective registration statement. A preliminary prospectus relating to the offering has been filed with the SEC. Electronic copies of the final prospectus may be obtained on the SEC’s website at http://www.sec.gov and may also be obtained by contacting H.C. Wainwright & Co., LLC at 430 Park Avenue, 3rd Floor, New York, NY 10022, by phone at (212) 856-5711 or e-mail at [email protected].
The Company also has agreed that certain existing warrants to purchase up to an aggregate of 374,114 shares of common stock of the Company that were previously issued to an investor in November 2020, January 2021, June 2021, December 2021, March 2022, May 2022 and September 2022, at exercise prices ranging from $21.00 to $43.60 per share and expiration dates ranging from October 2023 to September 2027, were amended effective upon the closing of the offering so that the amended warrants have a reduced exercise price of $4.50 per share and will expire five years following the closing of the offering.
This press release shall not constitute an offer to sell or a solicitation of an offer to buy any of the securities described herein, nor shall there be any sale of these securities in any state or other jurisdiction in which such offer, solicitation or sale would be unlawful prior to the registration or qualification under the securities laws of any such state or other jurisdiction.
About Baudax Bio
Baudax Bio is a pharmaceutical company focused on innovative products for hospital and related settings. The Company has a pipeline of innovative pharmaceutical assets including two clinical-stage, novel neuromuscular blocking (NMBs) agents, one in a Phase II study and an additional unique NMB in a dose escalation Phase I study, as well as a proprietary chemical reversal agent specific to these NMBs. Baudax Bio has received approval for and marketed ANJESO®, the first and only 24-hour, intravenous (IV) COX-2 preferential non-opioid, non-steroidal anti-inflammatory (NSAID) for the management of moderate to severe pain. For more information, please visit www.baudaxbio.com.
Forward Looking Statements
This press release contains forward-looking statements that involve risks and uncertainties. Such forward-looking statements reflect Baudax Bio’s expectations about its future performance and opportunities that involve substantial risks and uncertainties. When used herein, the words “anticipate,” “believe,” “estimate,” “may,” “upcoming,” “plan,” “target,” “goal,” “intend” and “expect” and similar expressions, as they relate to Baudax Bio or its management, are intended to identify such forward-looking statements. Forward-looking statements may include, without limitation, statements regarding the use of net proceeds from the offering. These forward-looking statements are based on information available to Baudax Bio as of the date of publication on this internet site, including Baudax Bio’s ability to realize any anticipated benefits from the reverse stock split, including maintaining its listing on the Nasdaq Capital Market and attracting new investors. These risks and uncertainties include, among other things, risks related to market, economic and other conditions, the ongoing economic and social consequences of the COVID-19 pandemic, Baudax Bio’s ability to advance its current product candidate pipeline through pre-clinical studies and clinical trials, Baudax Bio’s ability to raise future financing for continued development of its product candidates such as BX1000, BX2000 and BX3000, Baudax Bio’s ability to pay its debt and satisfy conditions necessary to access future tranches of debt, Baudax Bio’s ability to comply with the financial and other covenants under its credit facility, Baudax Bio’s ability to manage costs and execute on its operational and budget plans, Baudax Bio’s ability to achieve its financial goals; Baudax Bio’s ability to comply with all listing requirements of the Nasdaq Capital Market; and Baudax Bio’s ability to obtain, maintain and successfully enforce adequate patent and other intellectual property protection. These forward-looking statements should be considered together with the risks and uncertainties that may affect Baudax Bio’s business and future results included in Baudax Bio’s filings with the Securities and Exchange Commission at www.sec.gov. These forward-looking statements are based on information currently available to Baudax Bio, and Baudax Bio assumes no obligation to update any forward-looking statements except as required by applicable law.
Investor Relations Contact: Argot Partners Sam Martin / Kaela Ilami (212) 600-1902 [email protected]
Media Contact: Argot Partners David Rosen (212) 600-1902 [email protected]
Adds Great Escape in Pleasant Hill, Iowa to Growing Portfolio
RICHMOND, Va.–(BUSINESS WIRE)– Bowlero Corp., (NYSE: BOWL) the global leader in bowling entertainment, announced today that it has completed the acquisition of Great Escape in Iowa. This is the Company’s 15th completed acquisition in calendar year 2022, bringing the Company’s total center count to 326.
Great Escape, located in Pleasant Hill, a suburb of Des Moines, is a 24-lane bowling center featuring laser tag, over 50 arcade games, virtual reality, and a full-service restaurant. Great Escape marks the Company’s second acquisition in Iowa this calendar year, the first being Thunderbowl located in Council Bluffs.
Brett Parker, President & Chief Financial Officer of Bowlero Corp. stated, “The addition of Great Escape is another exciting acquisition for Bowlero. We remain committed to bringing our guests a world-class entertainment experience, and furthering our presence nationwide.”
Great Escape is expected to open under Bowlero Corp. management on December 9th.
About Bowlero Corp Bowlero Corp. is the global leader in bowling entertainment, media, and events. With more than 300 bowling centers across North America, Bowlero Corp. serves more than 27 million guests each year through a family of brands that includes Bowlero, Bowlmor Lanes, and AMF. In 2019, Bowlero Corp. acquired the Professional Bowlers Association, the major league of bowling, which boasts thousands of members and millions of fans across the globe. For more information on Bowlero Corp., please visit BowleroCorp.com
Clinical abstract focuses on value of PURE EP™’s and its groundbreaking High Frequency Algorithm (HFA) during pulmonary vein isolation
Westport, CT, Dec. 06, 2022 (GLOBE NEWSWIRE) — BioSig Technologies, Inc. (NASDAQ: BSGM) (“BioSig” or the “Company”) an advanced digital signal processing technology company delivering unprecedented accuracy and precision to intracardiac signal visualization with its proprietary PURE EP™ System, today announced that a peer-reviewed case report titled, “Confirmation of Acute Pulmonary Vein Reconnection with The Utilization of PURE EP’s High-Frequency Algorithm (HFA)” has been published in the Journal of Atrial Fibrillation & Electrophysiology. The publication is available electronically via the JAFIB-EP open access digital journal.
Co-authored by Roy Chung, MD, Clinical Cardiac Electrophysiologist at Cleveland Clinic and Zachary Koch, CCDS, CEPS, Clinical Director at BioSig Technologies, Inc., the case report describes a 65-year-old patient with a medical history of symptomatic and persistent atrial fibrillation undergoing pulmonary vein isolation (PVI). PURE EP™’s HFA signal analysis was observed alongside the simultaneous signal anno New Primary LogoNew Primary Logotation produced by a 3D mapping system. PURE EP™’s real-time HFA identified early local activation, providing a clear and precise location that served as the primary target for ablation therapy during the procedure. Results from the case study support the efficacy of PURE EP™’s HFA in identification of the pulmonary vein gap compared to the inferior annotation produced by the 3D mapping system.1
“This case study adds to the growing pipeline of clinical evidence validating the PURE EP™ System as an essential and valuable technology for today’s EP lab—particularly for challenging cases,” commented Gray Fleming, Chief Commercial Officer, BioSig Technologies, Inc. “We believe that these findings, along with other clinical applications we continue to explore in collaboration with the Cleveland Clinic, demonstrate PURE EP™’s ability to set new standards in the field of electrophysiology.”
In October, the Company signed a master research agreement with Cleveland Clinic to explore expanded applications for its digital signal processing technology.
The proprietary High Frequency Algorithm (HFA)—a proprietary feature found only in the PURE EP™ System—reclaims the specificity lost within the blended data of the traditional bipolar wave. HFA enables electrophysiologists to apply specific near-field frequency data to the treatment of even the most complex arrhythmias. By removing unnecessary distractions, the PURE EP™ System with HFA preserves the value of cardiac signals and delivers clear, actionable insights to today’s electrophysiologist.
About BioSig Technologies BioSig Technologies is an advanced digital signal processing technology company bringing never-before-seen insights to the treatment of cardiovascular arrhythmias. Through collaboration with physicians, experts, and healthcare leaders across the field of electrophysiology (EP), BioSig is committed to addressing healthcare’s biggest priorities — saving time, saving costs, and saving lives.
The Company’s first product, the PURE EP™ System, an FDA 510(k) cleared non-invasive class II device, provides superior, real-time signal visualization allowing physicians to perform insight-based, highly targeted cardiac ablation procedures with increased procedural efficiency and efficacy.
The PURE EP™ System is currently in a national commercial launch and an integral part of well-respected healthcare systems, such as Mayo Clinic, Texas Cardiac Arrhythmia Institute, Cleveland Clinic, and Kansas City Heart Rhythm Institute. In a blinded clinical study recently published in the Journal of Cardiovascular Electrophysiology, electrophysiologists rated PURE EP™ as equivalent or superior to conventional systems for 93.6% of signal samples, with 75.2% earning a superior rating.
The global EP market is projected to reach $16B in 2028 with a 11.2% growth rate.2
Forward-looking Statements This press release contains “forward-looking statements.” Such statements may be preceded by the words “intends,” “may,” “will,” “plans,” “expects,” “anticipates,” “projects,” “predicts,” “estimates,” “aims,” “believes,” “hopes,” “potential” or similar words. Forward- looking statements are not guarantees of future performance, are based on certain assumptions and are subject to various known and unknown risks and uncertainties, many of which are beyond the Company’s control, and cannot be predicted or quantified and consequently, actual results may differ materially from those expressed or implied by such forward-looking statements. Such risks and uncertainties include, without limitation, risks and uncertainties associated with (i) the geographic, social and economic impact of COVID-19 on our ability to conduct our business and raise capital in the future when needed, (ii) our inability to manufacture our products and product candidates on a commercial scale on our own, or in collaboration with third parties; (iii) difficulties in obtaining financing on commercially reasonable terms; (iv) changes in the size and nature of our competition; (v) loss of one or more key executives or scientists; and (vi) difficulties in securing regulatory approval to market our products and product candidates. More detailed information about the Company and the risk factors that may affect the realization of forward-looking statements is set forth in the Company’s filings with the Securities and Exchange Commission (SEC), including the Company’s Annual Report on Form 10-K and its Quarterly Reports on Form 10-Q. Investors and security holders are urged to read these documents free of charge on the SEC’s website at http://www.sec.gov. The Company assumes no obligation to publicly update or revise its forward-looking statements as a result of new information, future events or otherwise.
PHOENIX, Dec. 06, 2022 (GLOBE NEWSWIRE) — QuoteMedia, Inc. (OTCQB: QMCI), a leading provider of market data and financial applications, today announced that it will be presenting at the Planet MicroCap Showcase: VIRTUAL 2022 on Wednesday, December 7, 2022, at 12:30 PM EST. Dave Shworan, CEO of Quotemedia, Ltd. will be hosting the 30-minute presentation providing an overview of QuoteMedia for existing shareholders and potential shareholders.
QuoteMedia provides banks, brokerage firms, private equity firms, financial planners and sophisticated investors with a more economical, higher quality alternative source of stock market data and related research information. We compete with several larger legacy organizations and a modest community of other smaller companies. QuoteMedia provides comprehensive market data services, including streaming data feeds, on-demand request-based data (XML/JSON), web content solutions (financial content for website integration) and applications such as Quotestream Professional and Quotestream Web Trader.
To access the presentation, please use the following information:
If you would like to watch’s presentation at the Quotemedia’s Planet MicroCap Showcase 2022, please make sure you are registered here: https://planetmicrocapshowcase.com/signup
If you can’t make the live presentation, all company presentations “webcasts” will be available directly on the conference event platform on this link under the tab “Agenda”: https://planetmicrocapshowcase.com/agenda
About QuoteMedia
QuoteMedia is a leading software developer and cloud-based syndicator of financial market information and streaming financial data solutions to media, corporations, online brokerages, and financial services companies. The Company licenses interactive stock research tools such as streaming real-time quotes, market research, news, charting, option chains, filings, corporate financials, insider reports, market indices, portfolio management systems, and data feeds. QuoteMedia provides industry leading market data solutions and financial services for companies such as the Nasdaq Stock Exchange, TMX Group (TSX Stock Exchange), Canadian Securities Exchange (CSE), London Stock Exchange Group, FIS, U.S. Bank, Bank of Montreal (BMO), Broadridge Financial Systems, JPMorgan Chase, Scotiabank, CI Financial, Canaccord Genuity Corp., Hilltop Securities, HD Vest, Stockhouse, Zacks Investment Research, General Electric, Boeing, Bombardier, Telus International, Business Wire, PR Newswire, FolioFN, Regal Securities, ChoiceTrade, Cetera Financial Group, Dynamic Trend, Inc., Qtrade Financial, CNW Group, IA Private Wealth, Ally Invest, Inc., Suncor, Leede Jones Gable, Firstrade Securities, Charles Schwab, First Financial, Equisolve, Stock-Trak, Mergent, Cision, Day Trade Dash, LLC and others. Quotestream®, QMod™ and Quotestream Connect™ are trademarks of QuoteMedia. For more information, please visit www.quotemedia.com.
About Planet MicroCap
Planet MicroCap is a global multimedia and publishing financial news investor portal specifically focused on covering the MicroCap market by providing news, insights, education tools and expert commentary. We have cultivated an active and engaged community of folks that are interested in learning about and to stay ahead of the curve in the MicroCap space.
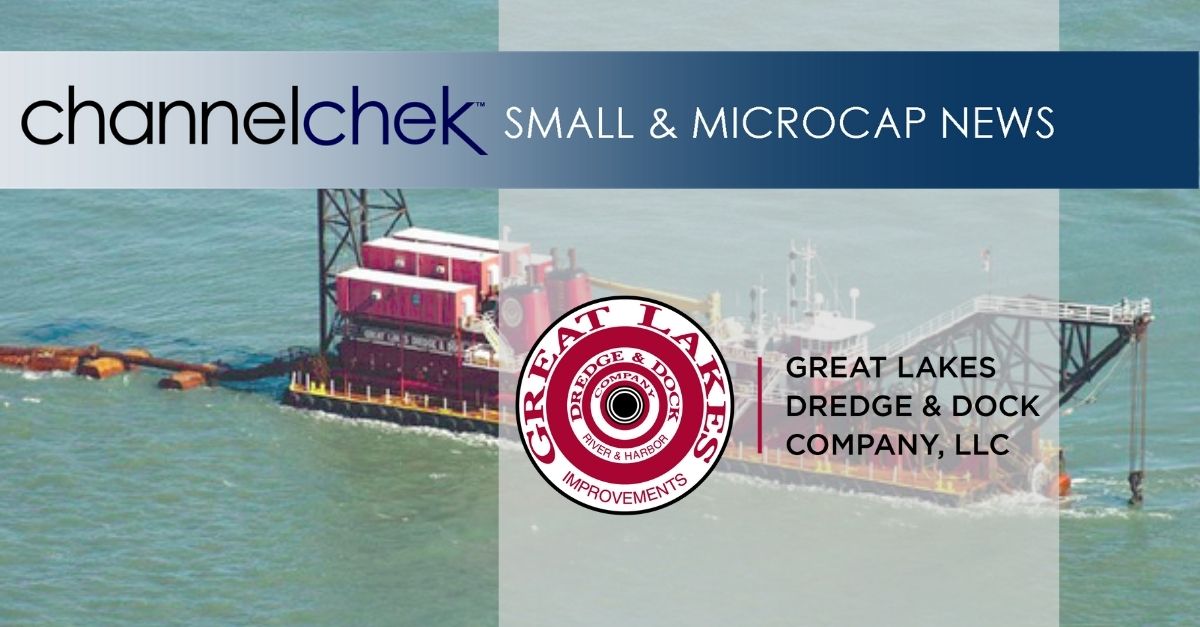
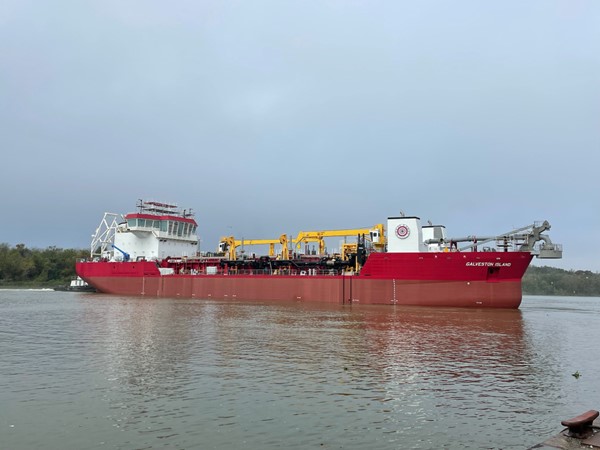
HOUSTON, Dec. 05, 2022 (GLOBE NEWSWIRE) — Great Lakes Dredge & Dock Corporation (“Great Lakes” or the “Company”) (NASDAQ: GLDD), the largest provider of dredging services in the United States, provided today an update on their fleet renewal program.
The Galveston Island, the first of two newbuild hopper dredges, is in the water and is scheduled to be in operation the first half of 2023 as planned. This new dredge is a 6,500-cubic-yard-capacity Trailing Suction Hopper Dredge which will support the modernization of Great Lakes’ dredging fleet. The dredge will be equipped with a direct high-power pump-ashore installation, dredging system automation, dynamic positioning and tracking, U.S. EPA Tier IV compliant engines, and have capabilities of running on biofuel to minimize the environmental impact. The Tier 4-compliant engines significantly reduce the vessel’s climate footprint, while other incorporated features minimize turbidity and marine species entrainment.
The upcoming delivery of the Galveston Island enables the Company to continue the rationalization of its older assets. During the fourth quarter of 2022, the Company will retire the hopper dredge Terrapin Island, which has a 42-year working history. This vessel was planned for retirement upon the Galveston Island delivery, but based on her age the Company has decided to accelerate her retirement to significantly reduce its operating, labor and maintenance costs and improve productivity for the overall fleet. Work planned for the Terrapin Island will be delayed until another hopper dredge completes its regulatory drydock at the end of December.
The retirement of the Terrapin Island will result in a non-cash write-off of approximately $8 million in the fourth quarter of 2022.
The hopper fleet renewal program will be complete in 2025 with the delivery of the sister ship to the Galveston Island, at which time Great Lakes will have the largest and most modern hopper fleet in the US.
Lasse Petterson, President and Chief Executive Officer of Great Lakes commented, “After implementing our restructuring plan in 2017, we have invested in both productivity upgrades to our best performing vessels and executed on our new build program. This has provided us with additional capacity and improved efficiencies and will allow us to retire some of our older dredges and rationalize some of our older support equipment. These strategic moves will have a positive impact to our emissions footprint and our competitiveness in the coastal protection and maintenance markets as well as address the specific needs in the growing offshore wind market.”
The Company Great Lakes Dredge & Dock Corporation (“Great Lakes” or the “Company”) is the largest provider of dredging services in the United States. In addition, Great Lakes is fully engaged in expanding its core business into the rapidly developing offshore wind energy industry. The Company has a long history of performing significant international projects. The Company employs experienced civil, ocean and mechanical engineering staff in its estimating, production and project management functions. In its over 132-year history, the Company has never failed to complete a marine project. Great Lakes owns and operates the largest and most diverse fleet in the U.S. dredging industry, comprised of approximately 200 specialized vessels. Great Lakes has a disciplined training program for engineers that ensures experienced-based performance as they advance through Company operations. The Company’s Incident-and Injury-Free® (IIF®) safety management program is integrated into all aspects of the Company’s culture. The Company’s commitment to the IIF® culture promotes a work environment where employee safety is paramount.
Cautionary Note Regarding Forward-Looking Statements Certain statements in this press release may constitute “forward-looking” statements as defined in Section 21E of the Securities Exchange Act of 1934 (the “Exchange Act”), the Private Securities Litigation Reform Act of 1995 (the “PSLRA”) or in releases made by the Securities and Exchange Commission (the “SEC”), all as may be amended from time to time. Such forward-looking statements involve known and unknown risks, uncertainties and other important factors that could cause the actual results, performance or achievements of Great Lakes and its subsidiaries, or industry results, to differ materially from any future results, performance or achievements expressed or implied by such forward-looking statements. Statements that are not historical fact are forward-looking statements. These cautionary statements are being made pursuant to the Exchange Act and the PSLRA with the intention of obtaining the benefits of the “safe harbor” provisions of such laws. Great Lakes cautions investors that any forward-looking statements made by Great Lakes are not guarantees or indicative of future events.
Although Great Lakes believes that its plans, intentions and expectations reflected in this press release are reasonable, actual events could differ materially. The forward-looking statements contained in this press release are made only as of the date hereof and Great Lakes does not have or undertake any obligation to update or revise any forward-looking statements whether as a result of new information, subsequent events or otherwise, unless otherwise required by law.
For further information contact: Tina Baginskis Director, Investor Relations 630-574-3024
SANTA MONICA, Calif.–(BUSINESS WIRE)– Entravision (NYSE: EVC), a leading global advertising solutions, media and technology company, today announced Chris Young, Chief Financial Officer and Treasurer, will present at the Singular Research Best of the Uncovered Conference to be held virtually Thursday, December 8, 2022. Management is scheduled to present at 12:15 pm PT.
The presentation will be webcast live over the Internet, and links to the live webcast and replay will be available on Entravision’s Investor Relations website at investor.entravision.com.
About Entravision Communications Corporation
Entravision is a leading global advertising, media and ad-tech solutions company connecting brands to consumers by representing top platforms and publishers. Our dynamic portfolio includes digital, television and audio offerings. Digital, our largest revenue segment, is comprised of four business units: our digital sales representation business; Smadex, our programmatic ad purchasing platform; our branding and mobile performance solutions business; and our digital audio business. Through our digital sales representation business, we connect global media companies such as Meta, Twitter, TikTok and Spotify with advertisers in primarily emerging growth markets worldwide. Smadex is our mobile-first demand side platform, enabling advertisers to execute performance campaigns using machine learning. We also offer a branding and mobile performance solutions business, which provides managed services to advertisers looking to connect with global consumers, primarily on mobile devices, and our digital audio business provides digital audio advertising solutions for advertisers in the Americas. In addition to digital, Entravision has 49 television stations and is the largest affiliate group of the Univision and UniMás television networks. Entravision also manages 45 primarily Spanish-language radio stations that feature nationally recognized, Emmy award-winning talent. Shares of Entravision Class A Common Stock trade on the NYSE under ticker: EVC. Learn more about our offerings at entravision.com or connect with us on LinkedIn and Facebook.
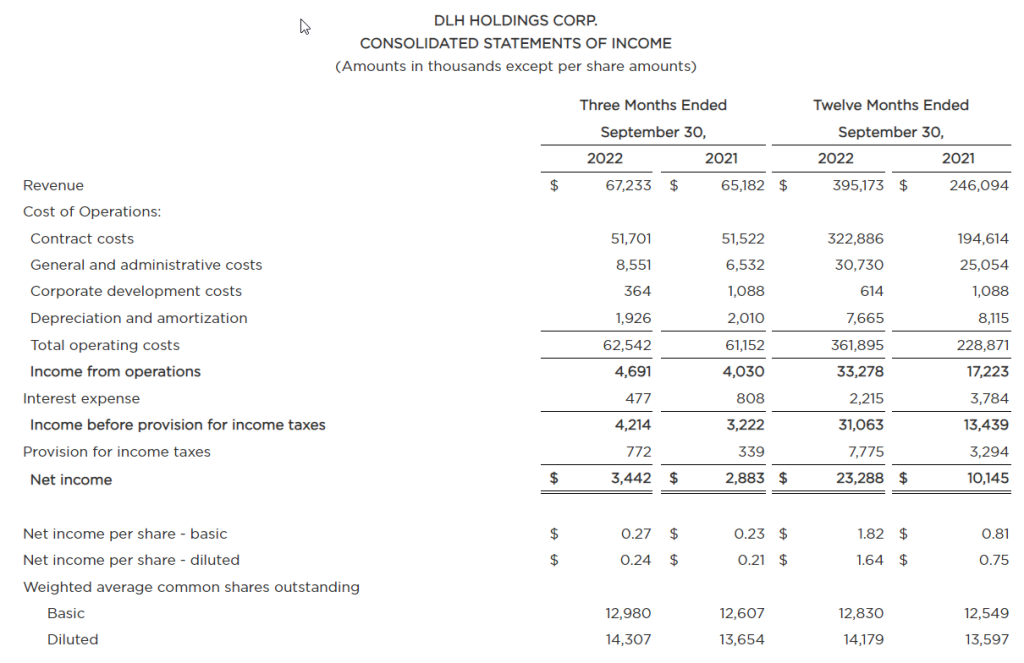
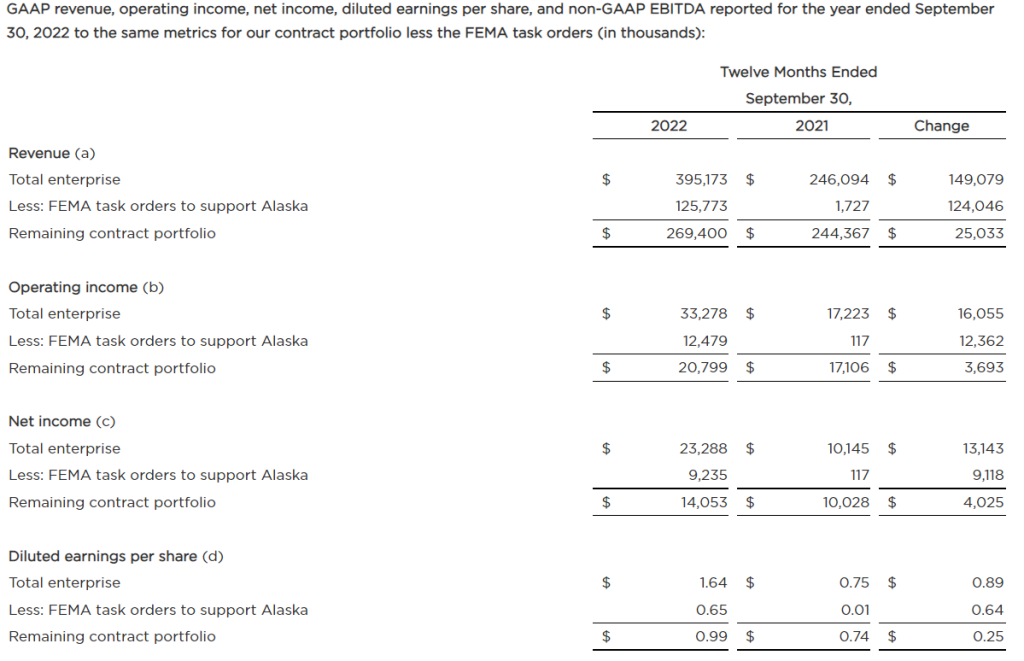
Revenue of $67.2 Million for Quarter, $395.2 Million for Fiscal Year; Debt Reduced to $22.0 Million
ATLANTA, Dec. 05, 2022 (GLOBE NEWSWIRE) — DLH Holdings Corp. (NASDAQ: DLHC) (“DLH” or the “Company”), a leading provider of innovative healthcare services and solutions to federal agencies, today announced financial results for its fiscal fourth quarter ended September 30, 2022.
Highlights
Fourth quarter revenue increased to $67.2 million in fiscal 2022 from $65.2 million in fiscal 2021, reflecting growth of 3% year-over-year
For the full fiscal year, revenue rose to $395.2 million from $246.1 million, reflecting the previously announced short term FEMA contracts to support Alaska, which contributed $125.8 million to revenue in the fiscal year
Excluding these short-term contracts, revenue grew to $269.4 million, an increase of 10% over the prior year, reflecting volume growth on existing contracts
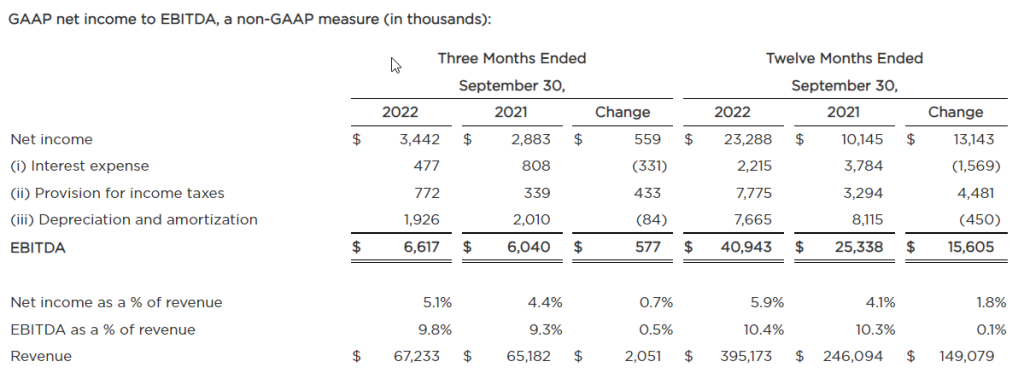
Earnings were $3.4 million, or $0.24 per diluted share, for the fiscal 2022 fourth quarter versus $2.9 million, or $0.21 per diluted share, for the fourth quarter of fiscal 2021
Earnings for the full year were $23.3 million, or $1.64 per diluted share for fiscal 2022 as compared to earnings for fiscal 2021 of $10.1 million, or $0.75 per diluted share.
Excluding the FEMA contracts, earnings on a non-GAAP basis for the full fiscal year were $14.1 million, or $0.99 per diluted share, versus $10.0 million, or $0.74 per diluted share, for fiscal 2021
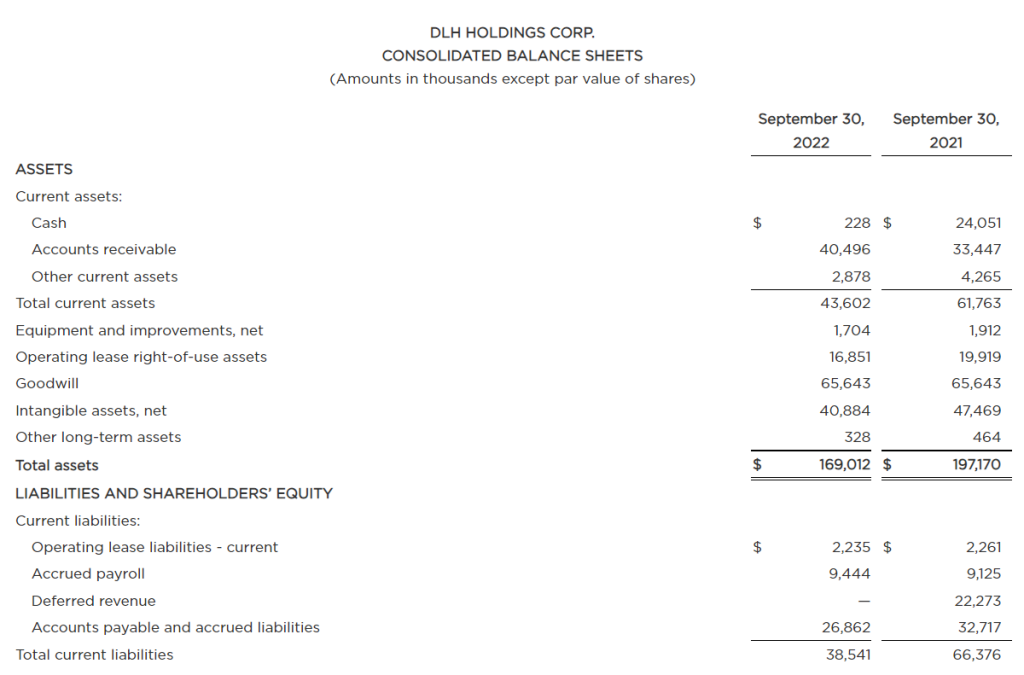
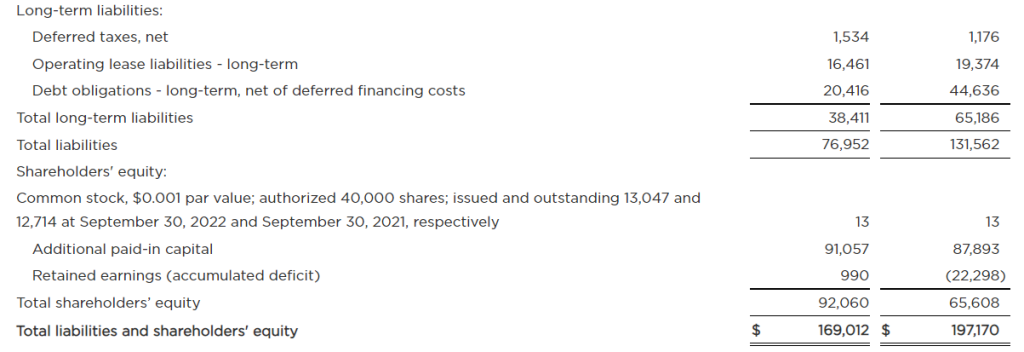
The Company’s secured term loan was reduced from $46.8 million to $22.0 million during the fiscal year
Contract backlog was $482.5 million as of September 30, 2022 versus $651.5 million at the end of the prior fiscal year, with approximately $85 million of the latter related to the FEMA contracts
Management Discussion “Fiscal 2022 was a year that, once again, demonstrated the strength of our people, the ability of our platform to deliver excellent results and the agility of the Company’s advanced technological capabilities, driving us to record performance and positioning us well for the quarters to come,” said DLH President and Chief Executive Officer Zach Parker. “We begin fiscal 2023 with a healthy backlog of $482.5 million representing our diverse programs across numerous agencies in the markets we serve. In addition, we further paid down debt, leaving the Company with a solid balance sheet and the financial flexibility to fund business growth initiatives and invest in our people. As we look towards the future, I’d like to thank our employees for a standout year as you continue to support critical efforts and programs that support our nation. Given the longstanding demand for our services, broad bipartisan support in Congress, and our innovative, data-driven solutions, we remain optimistic about the quarters to come.”
Results for the Three Months Ended September 30, 2022 Revenue for the fourth quarter of fiscal 2022 was $67.2 million versus $65.2 million in the prior-year period. The 3% increase year-over-year reflects continued growth across the Company’s existing contracts.
Income from operations was $4.7 million for the quarter versus $4.0 million in the prior-year period and, as a percent of revenue, the Company reported an operating margin of 7.0% in fiscal 2022 fourth quarter versus 6.2% in same period in fiscal 2021. Income from operations increased due to higher revenue and improved program mix, offset by investments in the human capital and business development functions and increased compliance costs.
Interest expense was $0.5 million in the fiscal fourth quarter of 2022 versus $0.8 million in the prior-year period, reflecting the decrease of debt outstanding. Income before provision for income taxes was $4.2 million this year versus $3.2 million in fiscal 2021, representing 6.3% and 5.0% of revenue, respectively, for each period.
For the three months ended September 30, 2022 and 2021, respectively, DLH recorded a $0.8 million and $0.3 million provision for income taxes. The Company reported net income of approximately $3.4 million, or $0.24 per diluted share, for the fourth quarter of fiscal 2022 versus $2.9 million, or $0.21 per diluted share, for the fourth quarter of fiscal 2021. As a percent of revenue, net income was 5.1% for the fourth quarter of fiscal 2022 versus 4.4% for the prior year period.
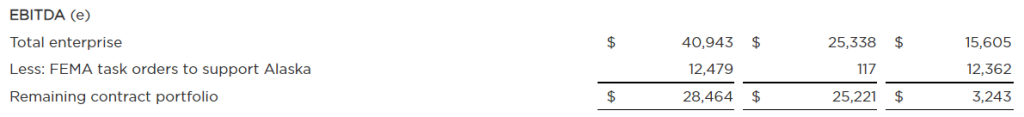
On a non-GAAP basis, EBITDA for the three months ended September 30, 2022 was approximately $6.6 million versus $6.0 million in the prior-year period, or 9.8% and 9.3% of revenue, respectively.
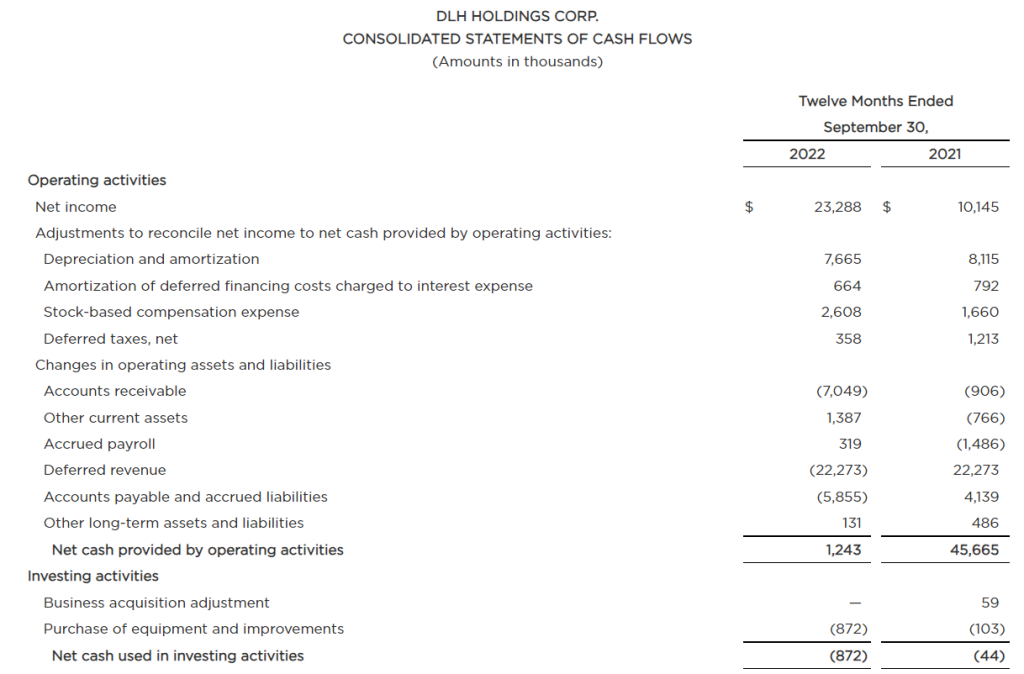
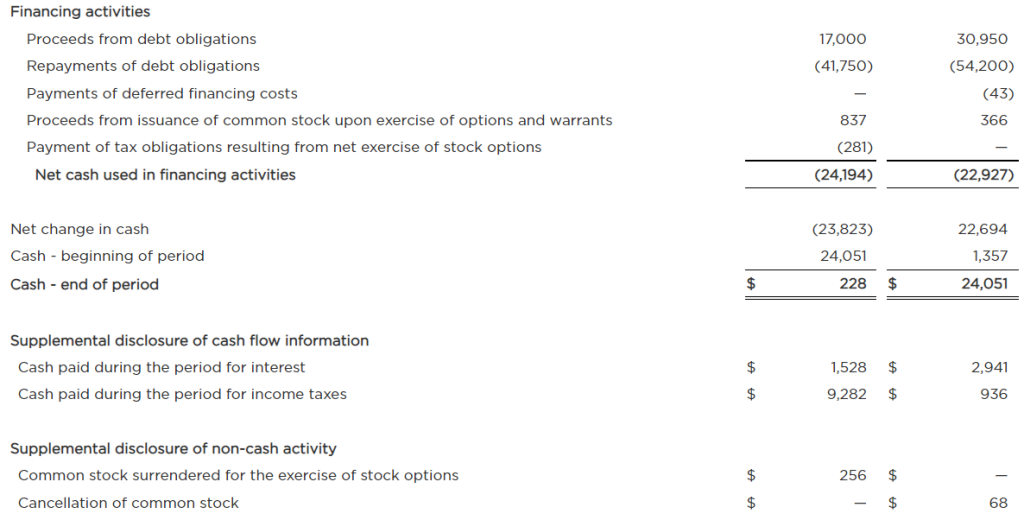
Key Financial Indicators For the 2022 fiscal year, DLH produced $1.2 million in operating cash, reflecting the impact of the $22.3 million deferred revenue on the previously-completed FEMA contracts, for which there were advance payments in the fourth quarter of fiscal 2021. The overall increase in accounts receivable versus the prior-year period reflects normal fluctuations in the timing of customer payments and growth in the overall business volume.
As of September 30, 2022, the Company had cash of $0.2 million and debt outstanding under its credit facilities of $22.0 million versus cash of $24.1 million and debt outstanding of $46.8 million as of September 30, 2021.
At September 30, 2022, total backlog was approximately $482.5 million, including funded backlog of approximately $98.9 million, and unfunded backlog of $383.5 million.
Conference Call and Webcast Details DLH management will discuss fourth quarter results and provide a general business update, including current competitive conditions and strategies, during a conference call beginning at 10:00 AM Eastern Time today, December 5, 2022. Interested parties may listen to the conference call by dialing 888-347-5290 or 412-317-5256. Presentation materials will also be posted on the Investor Relations section of the DLH website prior to the commencement of the conference call.
A digital recording of the conference call will be available for replay two hours after the completion of the call and can be accessed on the DLH Investor Relations website or by dialing 877-344-7529 and entering the conference ID 3802471.
About DLH
DLH (NASDAQ:DLHC) delivers improved health and readiness solutions for federal programs through research, development, and innovative care processes. The Company’s experts in public health, performance evaluation, and health operations solve the complex problems faced by civilian and military customers alike, leveraging digital transformation, artificial intelligence, advanced analytics, cloud-based applications, telehealth systems, and more. With over 2,400 employees dedicated to the idea that “Your Mission is Our Passion,” DLH brings a unique combination of government sector experience, proven methodology, and unwavering commitment to public health to improve the lives of millions. For more information, visit www.DLHcorp.com.
Safe Harbor Statement under the Private Securities Litigation Reform Act of 1995: This press release may contain forward-looking statements within the meaning of the Private Securities Litigation Reform Act of 1995. These statements relate to future events or DLH`s future financial performance. Any statements that refer to expectations, projections or other characterizations of future events or circumstances or that are not statements of historical fact (including without limitation statements to the effect that the Company or its management “believes”, “expects”, “anticipates”, “plans”, “intends” and similar expressions) should be considered forward looking statements that involve risks and uncertainties which could cause actual events or DLH’s actual results to differ materially from those indicated by the forward-looking statements. Forward-looking statements in this release include, among others, statements regarding estimates of future revenues, operating income, earnings and cash flow. These statements reflect our belief and assumptions as to future events that may not prove to be accurate. Our actual results may differ materially from such forward-looking statements made in this release due to a variety of factors, including: the impact of the novel coronavirus (“COVID-19”), including the measures to reduce its spread, and its impact on the economy and demand for our services, are uncertain, cannot be predicted, and may precipitate or exacerbate other risks and uncertainties; the risk that we will not realize the anticipated benefits ofacquisitions; the challenges of managing larger and more widespread operations; contract awards in connection with re-competes for present business and/or competition for new business; compliance with bank financial and other covenants; changes in client budgetary priorities; government contract procurement (such as bid and award protests, small business set asides, loss of work due to organizational conflicts of interest, etc.) and termination risks; the ability to successfully integrate the operations of acquisitions; the impact of inflation and higher interest rates; and other risks described in our SEC filings. For a discussion of such risks and uncertainties which could cause actual results to differ from those contained in the forward-looking statements, see “Risk Factors” in the Company’s periodic reports filed with the SEC, including our Annual Report on Form 10-K for the fiscal year ended September 30, 2022, as well as subsequent reports filed thereafter. The forward-looking statements contained herein are not historical facts, but rather are based on current expectations, estimates, assumptions and projections about our industry and business.
Such forward-looking statements are made as of the date hereof and may become outdated over time. The Company does not assume any responsibility for updating forward-looking statements, except as may be required by law.
DLH HOLDINGS CORP. CONSOLIDATED STATEMENTS OF INCOME (Amounts in thousands except per share amounts)
DLH HOLDINGS CORP. CONSOLIDATED BALANCE SHEETS (Amounts in thousands except par value of shares)
DLH HOLDINGS CORP. CONSOLIDATED STATEMENTS OF CASH FLOWS (Amounts in thousands)
Non-GAAP Financial Measures The Company uses EBITDA and EBITDA as a percent of revenue as supplemental non-GAAP measures of performance. We define EBITDA as net income excluding (i) interest expense, (ii) provision for or benefit from income taxes and (iii) depreciation and amortization. EBITDA as a percent of revenue is EBITDA for the measurement period divided by revenue for the same period.
The Company is presenting additional non-GAAP measures to describe the impact from two short-term FEMA task orders on its financial performance for the three and twelve months periods ended September 30, 2022. The measures presented are revenue, operating income, net income, diluted earnings per share, and EBITDA for our enterprise contract portfolio less the respective performance on the FEMA task orders. These resulting measures present the remaining contract portfolio’s quarterly financial performance compared to results delivered in the prior year period. Definitions of these additional non-GAAP measures are set forth in the footnotes to the reconciliation table below.
These non-GAAP measures of performance are used by management to conduct and evaluate its business during its review of operating results for the periods presented. Management and the Company’s Board utilize these non-GAAP measures to make decisions about the use of the Company’s resources, analyze performance between periods, develop internal projections and measure management performance. We believe that these non-GAAP measures are useful to investors in evaluating the Company’s ongoing operating and financial results and understanding how such results compare with the Company’s historical performance.
(a): Revenue for the Company’s remaining contract portfolio less the FEMA task orders represents our consolidated revenues less the revenues generated from the FEMA task orders.
(b): Operating income attributable to the remaining contract portfolio less the FEMA task orders represents the Company’s consolidated operating income, determined in accordance with GAAP, less the operating income derived from the FEMA task orders. Similarly, for the year ended September 30, 2022 operating income for the FEMA task orders is derived by subtracting from the revenue attributable to the tasks orders of $125.8 million the following amounts associated with such task orders: contract costs $112.1 million and general & administrative costs of $1.2 million.
(c): Net income attributable to the remaining contract portfolio less the FEMA task orders represents the Company’s consolidated net income, determined in accordance with GAAP, less the net income derived from the FEMA task orders. For the year ended September 30, 2022 net income for the FEMA task orders is derived by subtracting from the revenue attributable to the tasks orders of $125.8 million the following amounts associated with such task orders: contract costs of $112.1 million, general & administrative costs of $1.2 million, and provision for income taxes of $3.2 million.
(d): Diluted earnings per share (diluted EPS) for the FEMA task orders is calculated using the net income attributable to such task orders as opposed to GAAP net income. Diluted EPS for the remaining contract portfolio (total contract portfolio excluding the FEMA task orders) is calculated by subtracting the diluted EPS for the FEMA task orders from the Company’s total diluted EPS.
(e): EBITDA attributable to the FEMA task orders of $12.5 million for the year ended September 30, 2022, is arrived at through the same calculation as operating income as there are not any depreciation and amortization costs attributable to the FEMA task orders. EBITDA for the remaining contract portfolio is calculated by subtracting the EBITDA attributable to the FEMA task orders from the Company’s total EBITDA.
CHELMSFORD, MA / ACCESSWIRE / December 5, 2022 /Harte Hanks, Inc. (NASDAQ:HHS), a leading global customer experience company announced today that on December 2, 2022, the Company completed the closing of its June 30th, 2022, definitive agreement with Wipro, LLC, to repurchase all of the Company’s outstanding Series A Convertible Preferred Shares (the “Preferred Shares”) from Wipro, LLC, the sole holder of the Preferred Shares.
At closing the Preferred Shares were repurchased in exchange for (i) a cash payment equal to their liquidation value, or $9,926,000 and (ii) 100,000 shares of Harte Hanks common stock, following the reissuance of the Preferred Shares by the State of New Jersey. The full cash portion of the repurchase price had been held in escrow since June 30, 2022 and was released at the time of closing by PNC Bank. Other than the release of previously escrowed funds, no additional cash was paid by Harte Hanks at the time of closing.
“The repurchase our Preferred Shares emphasizes our ongoing commitment to improve shareholder value. The completion of this transaction eliminated the dilutive impact of the Preferred Shares and eliminated restrictions on our use of capital and our ability to borrow funds,” said Brian Linscott, Harte Hanks’ CEO. Linscott continued, “we would like to again thank Wipro for finalizing this agreement, and for Wipro’s investment in our Company”.
About Harte Hanks: Harte Hanks (NASDAQ:HHS) is a leading global customer experience company whose mission is to partner with clients to provide them with CX strategy, data-driven analytics and actionable insights combined with seamless program execution to better understand, attract, and engage their customers.
Using its unparalleled resources and award-winning talent in the areas of Customer Care, Fulfillment and Logistics, and Marketing Services, Harte Hanks has a proven track record of driving results for some of the world’s premier brands including Bank of America, GlaxoSmithKline, Unilever, Pfizer, HBOMax, Volvo, Ford, FedEx, Midea, Sony, and IBM among others. Headquartered in Chelmsford, Massachusetts, Harte Hanks has over 2,500 employees in offices across the Americas, Europe and Asia Pacific.
As used herein, “Harte Hanks” or “the Company” refers to Harte Hanks, Inc. and/or its applicable operating subsidiaries, as the context may require. Harte Hanks’ logo and name are trademarks of Harte Hanks.
Forward-Looking Statements: Certain statements in this release may constitute forward-looking statements, which involve several risks and uncertainties. Harte Hanks cautions readers that any forward-looking information is not a guarantee of future performance and that actual results could differ materially from those contained in the forward-looking information due to several factors, including those listed from time to time in reports that Harte Hanks files with the Securities and Exchange Commission, including, but not limited to, our Annual Report on Form 10-K for the year ended December 31, 2021 and our Quarterly Report on Form 10-Q for the quarter ended September 30, 2022.
Hematopoietic Stem Cell Transplantation (HCT) from Unrelated Donors is a Component of the Treatment Protocol for Several Hematologic Malignancies
GvHD Complicates Treatment and Limits the Success of Engraftment after HCT
In addition to GvHD, Tonix is Developing TNX-1500 for Prophylaxis of Organ Transplant Rejection and Treatment of Autoimmune Disorders
Phase 1 Study of TNX-1500 is Expected to Start in First Half 2023
CHATHAM, N.J., Dec. 05, 2022 (GLOBE NEWSWIRE) — Tonix Pharmaceuticals Holding Corp. (Nasdaq: TNXP) (Tonix or the Company), a clinical-stage biopharmaceutical company, today announced that it has entered into a sponsored research agreement with Boston Children’s Hospital to study TNX-15001 (Fc-modified anti-CD40L mAb) for the prevention of graft-versus-host disease (GvHD) after hematopoietic stem cell transplantation (HCT) in animals. The principal investigator is Leslie S. Kean M.D., Ph.D., Director, Stem Cell Transplantation Program, Division of Hematology/Oncology, Boston Children’s Hospital, Department of Pediatric Oncology, Dana-Farber Cancer Institute and Robert A. Stranahan Professor of Pediatrics, Harvard Medical School. The primary objective of the preclinical research study is to study the activity of TNX-1500 administered prophylactically to modify GvHD progression in animals after HCT to support an Investigational New Drug (IND) application for human studies. A Phase 1 study of TNX-1500 to assess pharmacokinetics and tolerability is expected to start in the first half of 2023.
“We are excited to work with Leslie Kean on studying the potential of TNX-1500 for preventing GvHD after HCT,” said Seth Lederman, M.D., Chief Executive Officer of Tonix Pharmaceuticals. “Stem cell transplantation is an essential component of the treatment of several blood cell or hematologic cancers, but GvHD remains the most deadly complication, and limits the success of this otherwise life-saving treatment. To date, there has not been a humanized anti-CD40L antibody that can effectively prevent transplant rejection or GvHD with acceptable levels of tolerability. TNX-1500 is a third generation anti-CD40L monoclonal antibody that has been designed by protein engineering to decrease FcγRII binding and to reduce the potential for thrombosis. We are excited to sponsor this study of testing anti-CD40L in HCT to potentially replace cyclophosphamide in the post-transplant setting. A positive result would potentially support an IND and human studies.”
Dr. Kean, the principal investigator of the sponsored research said, “GvHD remains one of the most severe complications associated with HCT. For myeloablative MHC-haploidentical HCT, the risk of GvHD is substantial, and with the most severe form of acute GvHD, as many as half of patients can die from this disease. For these high-risk transplants, there is no fully effective GvHD prevention strategy. I have studied first generation anti-CD40L antibodies previously and I’m excited to test the effects of Tonix’s Fc-modified anti-CD40L.”
Dr. Lederman continued, “The application that we envision is for post-HCT, when the GvHD-causing alloreactive T cells are at peak activation. This is the timing for post-transplant cyclophosphamide that has been shown to decrease chronic GvHD, allow for haplo-identical transplants and shorten the period of profound immunosuppression. In post-transplant cyclophosphamide therapy, the effect is targeted to the appropriate cells by the cell cycle of activated T cells. In CD40L therapy, we believe appropriate T cells may be targeted by the transient expression of CD40L. To be successful, the post-HCT indication requires prolonged engraftment. Anti-CD40L is already used in solid organ transplant tolerance models (and therapy) that only require transient chimerism.”
About TNX-1500
TNX-15001 (Fc-modified anti-CD40L mAb) is a humanized monoclonal antibody that interacts with the CD40-ligand (CD40L), which is also known as CD154. TNX-1500is being developed for the prevention of allograft and xenograft rejection, for the treatment of autoimmune diseases and for the prevention of graft-versus-host disease (GvHD) after hematopoietic stem cell transplantation (HCT). A Phase 1 study of TNX-1500 is expected to be initiated in the first half of 2023. TNX-1500 is a third generation anti-CD40L mAb that has been designed by protein engineering to decrease FcγRII binding and to reduce the potential for thrombosis. In June 2022, Tonix announced data from three oral presentations at the 2022 American Transplant Congress by faculty at the Center for Transplantation Sciences, Massachusetts General Hospital. The data involved studies of TNX-1500 in development for the prevention of organ transplant rejection. The animal studies found that TNX-1500 showed activity in preventing organ rejection and was well tolerated in non-human primates. Blockade of CD40L with TNX-1500 monotherapy consistently and safely prevented pathologic alloimmunity in non-human primate models of cardiac and kidney allograft transplantation without clinical thrombosis. Copies of the presentations are available under Scientific Presentations on the Tonix Pharmaceuticals corporate website at www.tonixpharma.com.
1TNX-1500 is a biologic at the pre-IND stage of development and has not been approved for any indication
Tonix Pharmaceuticals Holding Corp.*
Tonix is a clinical-stage biopharmaceutical company focused on discovering, licensing, acquiring and developing therapeutics to treat and prevent human disease and alleviate suffering. Tonix’s portfolio is composed of central nervous system (CNS), rare disease, immunology and infectious disease product candidates. Tonix’s CNS portfolio includes both small molecules and biologics to treat pain, neurologic, psychiatric and addiction conditions. Tonix’s lead CNS candidate, TNX-102 SL (cyclobenzaprine HCl sublingual tablet), is in mid-Phase 3 development for the management of fibromyalgia with a new Phase 3 study launched in the second quarter of 2022 and interim data expected in the second quarter of 2023. TNX-102 SL is also being developed to treat Long COVID, a chronic post-acute COVID-19 condition. Tonix initiated a Phase 2 study in Long COVID in the third quarter of 2022 and expects interim data in the second quarter of 2023. TNX-1300 (cocaine esterase) is a biologic designed to treat cocaine intoxication and has been granted Breakthrough Therapy designation by the FDA. A Phase 2 study of TNX-1300 is expected to be initiated in the first quarter of 2023. TNX-1900 (intranasal potentiated oxytocin), a small molecule in development for chronic migraine, is expected to enter the clinic with a Phase 2 study in the first quarter of 2023. TNX-601 ER (tianeptine hemioxalate extended-release tablets) is a once-daily formulation of tianeptine being developed as a potential treatment for major depressive disorder (MDD) with a Phase 2 study expected to be initiated in the first quarter of 2023. Tonix’s rare disease portfolio includes TNX-2900 (intranasal potentiated oxytocin) for the treatment of Prader-Willi syndrome. TNX-2900 has been granted Orphan Drug designation by the FDA. Tonix’s immunology portfolio includes biologics to address organ transplant rejection, autoimmunity and cancer, including TNX-1500, which is a humanized monoclonal antibody targeting CD40-ligand (CD40L or CD154) being developed for the prevention of allograft and xenograft rejection and for the treatment of autoimmune diseases. A Phase 1 study of TNX-1500 is expected to be initiated in the first half of 2023. Tonix’s infectious disease pipeline consists of a vaccine in development to prevent smallpox and monkeypox, next-generation vaccines to prevent COVID-19, and a platform to make fully human monoclonal antibodies to treat COVID-19. TNX-801, Tonix’s vaccine in development to prevent smallpox and monkeypox, also serves as the live virus vaccine platform or recombinant pox vaccine (RPV) platform for other infectious diseases. A Phase 1 study of TNX-801 is expected to be initiated in Kenya in the first half of 2023. Tonix’s lead vaccine candidate for COVID-19 is TNX-1850, a live virus vaccines based on Tonix’s recombinant pox live virus vector vaccine platform.
*All of Tonix’s product candidates are investigational new drugs or biologics and have not been approved for any indication.
This press release and further information about Tonix can be found at www.tonixpharma.com.
Forward Looking Statements
Certain statements in this press release are forward-looking within the meaning of the Private Securities Litigation Reform Act of 1995. These statements may be identified by the use of forward-looking words such as “anticipate,” “believe,” “forecast,” “estimate,” “expect,” and “intend,” among others. These forward-looking statements are based on Tonix’s current expectations and actual results could differ materially. There are a number of factors that could cause actual events to differ materially from those indicated by such forward-looking statements. These factors include, but are not limited to, risks related to the failure to obtain FDA clearances or approvals and noncompliance with FDA regulations; delays and uncertainties caused by the global COVID-19 pandemic; risks related to the timing and progress of clinical development of our product candidates; our need for additional financing; uncertainties of patent protection and litigation; uncertainties of government or third party payor reimbursement; limited research and development efforts and dependence upon third parties; and substantial competition. As with any pharmaceutical under development, there are significant risks in the development, regulatory approval and commercialization of new products. Tonix does not undertake an obligation to update or revise any forward-looking statement. Investors should read the risk factors set forth in the Annual Report on Form 10-K for the year ended December 31, 2021, as filed with the Securities and Exchange Commission (the “SEC”) on March 14, 2022, and periodic reports filed with the SEC on or after the date thereof. All of Tonix’s forward-looking statements are expressly qualified by all such risk factors and other cautionary statements. The information set forth herein speaks only as of the date thereof.
Grand Opening Event Scheduled for Wednesday, December 17th
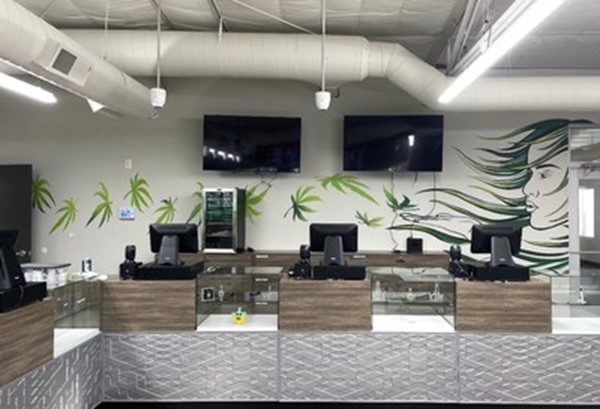
DENVER, Dec. 5, 2022 /CNW/ – Schwazze, (OTCQX: SHWZ) (NEO: SHWZ) (“Schwazze” or the “Company”), a premier vertically integrated, multi-state operating cannabis company with assets in Colorado and New Mexico, announces the grand opening of its adult-use dispensary, R.Greenleaf, located in Los Lunas, New Mexico. The new store, located at 2245 Main Street in Los Lunas, officially opened its doors for business on December 1st. Store operating hours are 10a to 10p Monday through Saturday; 10a to 8p on Sunday.
The Los Lunas R.Greenleaf store opening continues the deliberate expansion throughout the state of New Mexico and comes on the heels of the store opening just one week ago in Sunland Park which followed two store openings in Ruidoso and Clovis in the last 60 days. This brings R.Greenleaf’s total number of New Mexico retail dispensaries to 14. All locations serve the needs of medical patients as well as recreational adult-use consumers.
“We are thrilled to be opening up the second R.Greenleaf dispensary in New Mexico within one week’s time. The team has been incredibly hard at work to make this happen,” said Steve Pear, New Mexico Division President for Schwazze. “R.Greenleaf, offering a wide variety of quality products serviced by top-notch, knowledgeable staff, has grown from 10 locations to now 14 in New Mexico since Schwazze purchased the retail banner earlier this year.”
A grand opening celebration of Los Lunas R.Greenleaf will be held on Saturday, December, 17th, beginning at 10a and running until 3p. Swag bags will be available to the first 50 shoppers featuring a tote bag, branded rolling papers and other R.Greenleaf gear. DJ Sonya G will be on site during the event to provide tunes for all in attendance, and Ribs Hickory Pit BBQ will provide free pulled pork sandwiches for the first 50 customers making a purchase.
R.Greenleaf Los Lunas will also offer introductory pricing on flower, edibles, and vapes beginning on the 17th and continuing through December 24th. Enrollment in the Gratify Rewards loyalty program is already open. Gratify Rewards members that make a purchase of any amount on December 17th will automatically be entered to win a $100 R.Greenleaf gift card.
Los Lunas Store Location R.Greenleaf 2245 Main Street Los Lunas, New Mexico 87031
Grand Opening Celebration Saturday, December 17th 10a to 3p
Since April 2020, Schwazze has acquired, opened or announced the planned acquisition of 39 cannabis retail dispensaries as well as seven cultivation facilities and two manufacturing plants in Colorado and New Mexico. In May 2021, Schwazze announced its Biosciences division and in August 2021 it commenced home delivery services in Colorado.
About Schwazze Schwazze (OTCQX: SHWZ NEO: SHWZ) is building a premier vertically integrated regional cannabis company with assets in Colorado and New Mexico and will continue to take its operating system to other states where it can develop a differentiated regional leadership position. Schwazze is the parent company of a portfolio of leading cannabis businesses and brands spanning seed to sale. The Company is committed to unlocking the full potential of the cannabis plant to improve the human condition. Schwazze is anchored by a high-performance culture that combines customer-centric thinking and data science to test, measure, and drive decisions and outcomes. The Company’s leadership team has deep expertise in retailing, wholesaling, and building consumer brands at Fortune 500 companies as well as in the cannabis sector. Schwazze is passionate about making a difference in our communities, promoting diversity and inclusion, and doing our part to incorporate climate-conscious best practices.
Medicine Man Technologies, Inc. was Schwazze’s former operating trade name. The corporate entity continues to be named Medicine Man Technologies, Inc. Schwazze derives its name from the pruning technique of a cannabis plant to enhance plant structure and promote healthy growth.
Forward-Looking Statements This press release contains “forward-looking statements.” Such statements may be preceded by the words “plan,” “will,” “may,” “continue,” “predicts,” or similar words. Forward-looking statements are not guarantees of future events or performance, are based on certain assumptions, and are subject to various known and unknown risks and uncertainties, many of which are beyond the Company’s control and cannot be predicted or quantified. Consequently, actual events and results may differ materially from those expressed or implied by such forward-looking statements. Such risks and uncertainties include, without limitation, risks and uncertainties associated with (i) our inability to manufacture our products and product candidates on a commercial scale on our own or in collaboration with third parties; (ii) difficulties in obtaining financing on commercially reasonable terms; (iii) changes in the size and nature of our competition; (iv) loss of one or more key executives or scientists; (v) difficulties in securing regulatory approval to market our products and product candidates; (vi) our ability to successfully execute our growth strategy in Colorado and outside the state, (vii) our ability to consummate the acquisition described in this press release or to identify and consummate future acquisitions that meet our criteria, (viii) our ability to successfully integrate acquired businesses, including the acquisition described in this press release, and realize synergies therefrom, (ix) the ongoing COVID-19 pandemic, * the timing and extent of governmental stimulus programs, and (xi) the uncertainty in the application of federal, state and local laws to our business, and any changes in such laws. More detailed information about the Company and the risk factors that may affect the realization of forward-looking statements is set forth in the Company’s filings with the Securities and Exchange Commission (SEC), including the Company’s Annual Report on Form 10-K and its Quarterly Reports on Form 10-Q. Investors and security holders are urged to read these documents free of charge on the SEC’s website at http://www.sec.gov. The Company assumes no obligation to publicly update or revise its forward-looking statements as a result of new information, future events or otherwise except as required by law.