Iconic Burger Chain to Triple State’s Footprint By 2033
LOS ANGELES, Aug. 07, 2023 (GLOBE NEWSWIRE) — FAT (Fresh. Authentic. Tasty.) Brands Inc., parent company of Johnny Rockets and 16 other restaurant concepts, announces a new development deal set to bring 20 new franchised Johnny Rockets locations to Texas in the next 10 years with the first unit set to open in 2024.
The brand currently operates a number of restaurants in the Lone Star State. The new locations will open in partnership with Brame Holdings LLC, featuring the classic fare that put the brand on the map over 35 years ago, including juicy, made-to-order burgers and hand-spun shakes.
“Brame Holdings LLC continues to be a great growth partner in Texas across the FAT Brands portfolio,” said Taylor Wiederhorn, Chief Development Officer of FAT Brands. “They are quickly developing many Fatburger and Buffalo’s Express locations in addition to Round Table Pizza locations which is part of an 80-store development deal for the state, the first of these stores are set to open soon in San Antonio. We are thrilled to extend our relationship with an experienced operator like Brame Holdings LLC, driving further domestic growth in Texas for another beloved, iconic brand of ours, Johnny Rockets.”
The first Johnny Rockets restaurant opened June 6, 1986 on Melrose Avenue in Los Angeles. Since that time, the chain’s timeless all-American brand has connected with customers across the U.S. and in 25 other countries around the globe.
FAT Brands (NASDAQ: FAT) is a leading global franchising company that strategically acquires, markets and develops fast casual, quick-service, casual and polished casual dining restaurant concepts around the world. The Company currently owns 17 restaurant brands: Round Table Pizza, Fatburger, Marble Slab Creamery, Johnny Rockets, Fazoli’s, Twin Peaks, Great American Cookies, Hot Dog on a Stick, Buffalo’s Cafe & Express, Hurricane Grill & Wings, Pretzelmaker, Elevation Burger, Native Grill & Wings, Yalla Mediterranean and Ponderosa and Bonanza Steakhouses, and franchises and owns over 2,300 units worldwide. For more information on FAT Brands, please visit www.fatbrands.com.
About Johnny Rockets Founded in 1986 on Melrose Avenue in Los Angeles, Johnny Rockets is a world-renowned international franchise that offers high-quality, innovative menu items including Certified Angus Beef® cooked-to-order hamburgers, veggie burgers, chicken sandwiches, crispy fries, and rich, delicious hand-spun shakes and malts. With over 325 locations in over 25 countries around the globe, this dynamic lifestyle brand offers friendly service and upbeat music contributing to the chain’s signature atmosphere of relaxed, casual fun. For more information, visit www.johnnyrockets.com.
Forward Looking Statements This press release contains forward-looking statements within the meaning of the Private Securities Litigation Reform Act of 1995, including statements relating to the timing and performance of new store openings. Forward-looking statements reflect expectations of FAT Brands Inc. (“we”, “our” or the “Company”) concerning the future and are subject to significant business, economic and competitive risks, uncertainties and contingencies. These factors are difficult to predict and beyond our control, and could cause our actual results to differ materially from those expressed or implied in such forward-looking statements. We refer you to the documents that we file from time to time with the Securities and Exchange Commission, such as our reports on Form 10-K, Form 10-Q and Form 8-K, for a discussion of these and other factors. We undertake no obligation to update any forward-looking statement to reflect events or circumstances occurring after the date of this press release.
PRINCETON, N.J., Aug. 07, 2023 (GLOBE NEWSWIRE) — PDS Biotechnology Corporation (Nasdaq: PDSB), a clinical-stage immunotherapy company developing a growing pipeline of targeted cancer immunotherapies and infectious disease vaccines based on the Company’s proprietary T cell activating platforms, today announced that the Company will release financial results for the second quarter of 2023 on Monday, August 14, 2023, before the market opens. Following the release, management will host a conference call to review the financial results and provide a business update.
Monday, August 14, 2023, 8:00 AM ET Domestic: 877-407-3088 International: 201-389-0927 Conference ID: 13739270 Webcast: PDS Biotech Earnings Webcast
After the live webcast, the event will be archived on PDS Biotech’s website for six months.
About PDS Biotechnology PDS Biotech is a clinical-stage immunotherapy company developing a growing pipeline of targeted cancer and infectious disease immunotherapies based on our proprietary Versamune®, Versamune® plus PDS0301, and Infectimune® T cell-activating platforms. We believe our targeted immunotherapies have the potential to overcome the limitations of current immunotherapy approaches through the activation of the right type, quantity and potency of T cells. To date, our lead Versamune® clinical candidate, PDS0101, has demonstrated the ability to reduce and shrink tumors and stabilize disease in combination with approved and investigational therapeutics in patients with a broad range of HPV16-associated cancers in multiple Phase 2 clinical trials and will be advancing into a Phase 3 clinical trial in combination with KEYTRUDA® for the treatment of recurrent/metastatic HPV16-positive head and neck cancer in 2023. Our Infectimune® based vaccines have also demonstrated the potential to induce not only robust and durable neutralizing antibody responses, but also powerful T cell responses, including long-lasting memory T cell responses in pre-clinical studies to date. To learn more, please visit www.pdsbiotech.com or follow us on Twitter at @PDSBiotech.
Long COVID Afflicts Approximately 19% of Patients Following COVID-191, and is Expected to be a Global Health Burden
Fibromyalgia-Type Long COVID with Multi-Site Pain Affects Approximately 40% of Long COVID Patients
CHATHAM, N.J., Aug. 07, 2023 (GLOBE NEWSWIRE) — Tonix Pharmaceuticals Holding Corp. (Nasdaq: TNXP) (Tonix or the Company), a biopharmaceutical company, today announced the completion of the clinical phase of the Phase 2 proof-of-concept PREVAIL study of TNX-102 SL as a potential treatment for fibromyalgia-type Long COVID. Topline results for the PREVAIL study are expected in the third quarter of 2023.
“Approximately 40% of U.S. Long COVID patients have fibromyalgia-like multi-site pain symptoms based on our observational studies of Long COVID patients from the TriNetX claims database,”2,3 said Seth Lederman, M.D., Chief Executive Officer of Tonix Pharmaceuticals. “In addition to multi-site pain, these individuals often suffer from one or more other symptoms typically associated with fibromyalgia such as fatigue, sleep disturbance, and brain fog. We have termed this subgroup, ‘Fibromyalgia-type Long COVID.’ Given our encouraging results with TNX-102 SL as a potential treatment for fibromyalgia4, we are testing TNX-102 SL as a bedtime medicine for the management of Fibromyalgia-type Long COVID. In completing this clinical milestone, marked by the last enrolled patient finishing their final visit, we can now begin to look forward to topline results from the 63-patient PREVAIL study later this quarter.”
Dr. Lederman continued, “TNX-102 SL improves sleep quality in fibromyalgia, and we believe this is the mechanism by which TNX-102 SL improves other symptoms, like multi-site pain.5 Recently, the U.S. National Institutes of Health (NIH) has identified improving sleep quality as a target for potential therapeutics for Long COVID6,7,8, consistent with the proposed mechanism of TNX-102 SL.
“Common symptoms of Long COVID, including multi-site pain, fatigue, unrefreshing sleep, and cognitive dysfunction, or ‘brain fog,’ are also hallmarks of conditions like fibromyalgia and chronic fatigue syndrome/myalgic encephalomyelitis (CFS/ME),”9 said Herbert Harris, M.D., Ph.D., Executive Vice President and Head of Translational Medicine of Tonix Pharmaceuticals. “Defining subgroups of Long COVID patients that overlap with fibromyalgia and CFS/ME is expected to facilitate the development of new treatments.4 It can be challenging to distinguish fibromyalgia and CFS/ME clinically, given the high level of symptom overlap between them. Each of these conditions is defined by a constellation of symptoms, and there is no widely recognized diagnostic laboratory test that distinguishes them.”
Dr. Harris continued, “The recent identification of Long COVID subgroups in the National Institutes of Allergy and Infectious Diseases (NIAID)-sponsored RECOVER study10 was an important step. In their recent publication, cluster analysis of the symptom frequencies in the RECOVER study identified four subgroups of Long COVID patients. Cluster #4 represented approximately one-quarter of the population (28%) and reported the highest frequencies of pain (back pain (58%), joint pain (64%) or muscle pain (60%)), high frequencies of fatigue (94%) and ’Brain Fog,’ (94%) and a high level of impairment of Quality of Life. We believe Cluster #4 is a subgroup of Long COVID that shares many clinical features with fibromyalgia and may involve common disease mechanisms. We also believe that Cluster #3, representing another approximately 29% of the RECOVER cohort, includes many patients with fibromyalgia-type Long COVID because 100% of that group suffer from ‘Brain Fog’, 94% experience fatigue and approximately one-third experience pain (back pain (32%), joint pain (36%) or muscle pain (34%)).”
Dr. Harris concluded, “With no FDA approved treatment for Long COVID, we understand the need to better understand long COVID and to develop treatments for subgroups of this unserved population of patients. Fibromyalgia has been recognized by the U.S. Food and Drug Administration (FDA) with three approved medicines. Consequently, measuring daily pain is a validated endpoint for FDA registrational studies in fibromyalgia. We believe that daily pain has the potential to be an endpoint for registrational studies in fibromyalgia-like long COVID.”
About the Phase 2 PREVAIL Study
The Phase 2 PREVAIL study is a 14-week double-blind, randomized, multicenter, placebo-controlled study to evaluate the efficacy and safety of TNX-102 SL taken daily at bedtime in patients with multi-site pain associated with post-acute sequelae of SARS-CoV-2 infection (PASC). The trial is being conducted at approximately 30 sites in the U.S. The primary efficacy endpoint will be the change from baseline in the weekly average of daily self-reported worst pain intensity scores at the Week 14 endpoint. Key secondary efficacy endpoints include change from baseline in self-reported scores for sleep disturbance, fatigue, and cognitive function. Topline results are expected in the third quarter of 2023.
For more information, see ClinicalTrials.gov Identifier: NCT05472090.
About Long COVID or Post-Acute Sequelae of COVID-19 (PASC)
Post-acute sequelae of COVID-19, or PASC is the formal name for a condition now widely known as Long COVID. Although most people recover from COVID-19 within weeks of the acute illness, a substantial portion develops a chronic syndrome called Long COVID.11 These individuals experience a constellation of disabling symptoms long past the time of recovery from acute COVID-19. Most Long COVID patients who have been studied appear to have cleared the SARS-CoV-2 infection from their systems. The symptoms of Long COVID can include fatigue, sleep disorders, multi-site pain, fevers, shortness of breath, cognitive impairment described as “brain fog” or memory disturbance, gastrointestinal symptoms, anxiety, and depression. According to the Centers for Disease Control and Prevention (CDC), 1 in 13 adults in the U.S. (7.5%) have Long COVID symptoms.1 Long COVID is typically associated with moderate or severe COVID-19, but can occur after mild COVID-19 or even after asymptomatic SARS-CoV-2 infection. More than 40% of adults in the United States reported having COVID-19 in the past, and nearly one in five of those (19%) are currently still having symptoms of Long COVID.1 Long COVID is a chronic disabling condition that is expected to result in a significant global health and economic burden.12-15 In response to the urgent need for therapies that address Long COVID, Congress awarded $1.15 billion to the National Institutes of Health to study Long COVID in December 202016 The U.S. Department of Health and Human Services National Research Action Plan on Long COVID17, released in August 2022, addresses the overlap of Long COVID with CFS/ME, which, like fibromyalgia, is one of the overlapping chronic pain syndromes with central and peripheral sensitization.18 A published survey19 found comparable pain, fatigue, and functional impairment between Long COVID, fibromyalgia, and CFS/ME. This symptom overlap between these conditions has suggested that altered neurologic function is one of the leading hypotheses to explain them.20 While the vaccines available in the U.S., through either FDA approval or under Emergency Use Authorization, have been shown to prevent acute COVID, their ability to prevent Long COVID is unknown. There is currently no approved drug for the treatment of Long COVID. Fibromyalgia-type Long COVID, like fibromyalgia and CFS/ME, appears to be one of several chronic overlapping pain conditions that have in common the neurological process called central and peripheral sensitization, which is increasingly known by the term nociplastic pain.
About TNX-102 SL
TNX-102 SL is a patented sublingual tablet formulation of cyclobenzaprine hydrochloride which provides rapid transmucosal absorption and reduced production of a long half-life active metabolite, norcyclobenzaprine, due to bypass of first-pass hepatic metabolism. As a multifunctional agent with potent binding and antagonist activities at the 5-HT2A-serotonergic, α1-adrenergic, H1-histaminergic, and M1-muscarinic receptors, TNX-102 SL is in development as a daily bedtime treatment for fibromyalgia, Long COVID (formally known as post-acute sequelae of COVID-19 [PASC]), alcohol use disorder and agitation in Alzheimer’s disease. The United States Patent and Trademark Office (USPTO) issued United States Patent No. 9636408 in May 2017, Patent No. 9956188 in May 2018, Patent No. 10117936 in November 2018, Patent No. 10,357,465 in July 2019, and Patent No. 10736859 in August 2020. The Protectic™ protective eutectic and Angstro-Technology™ formulation claimed in the patent are important elements of Tonix’s proprietary TNX-102 SL composition. These patents are expected to provide TNX-102 SL, upon NDA approval, with U.S. market exclusivity until 2034/2035.
*TNX-102 SL is an investigational new drug and is not approved for any indication
Thaweethai T, et al. JAMA. 2023. 329(22):1934-1946
Clauw DJ, et al. Pain. 2020. 161(8):1694-1697
Briggs, A, and Vassall, A. Nature. 2021. 593(7860): 502-505
Nittas V, et al. Public Health Rev. 2022. 43:1604501
Davis, HE., et al. EClinicalMedicine. 2021. 38:101019
Martin C, et al. PLoS One. 2021. 16(12):e0260843
The NIH provision of Title III Health and Human Services, Division M–Coronavirus Response and Relief Supplemental Appropriations Act, 2021, of H.R. 133, The Consolidated Appropriations Act of 2021. The bill was enacted into law on 27 December 2020, becoming Public Law 116-260.
Maixner W, et al. J Pain. 2016. 17(9 Suppl):T93-T107
Haider S, et al. Pain. 2023. 164(2):385-401
Sutherland, S. Scientific American. 2023
Tonix Pharmaceuticals Holding Corp.*
Tonix is a biopharmaceutical company focused on commercializing, developing, discovering and licensing therapeutics to treat and prevent human disease and alleviate suffering. Tonix Medicines, our commercial subsidiary markets Zembrace® SymTouch® (sumatriptan injection) 3 mg and Tosymra® (sumatriptan nasal spray) 10 mg under a transition services agreement with Upsher-Smith Laboratories from whom the products were acquired on June 30, 2023. Zembrace SymTouch and Tosymra are each indicated for the treatment of acute migraine with or without aura in adults. Tonix’s development portfolio is composed of central nervous system (CNS), rare disease, immunology and infectious disease product candidates. Tonix’s CNS development portfolio includes both small molecules and biologics to treat pain, neurologic, psychiatric and addiction conditions. Tonix’s lead development CNS candidate, TNX-102 SL (cyclobenzaprine HCl sublingual tablet), is in mid-Phase 3 development for the management of fibromyalgia, having completed enrollment of a potentially confirmatory Phase 3 study in the third quarter of 2023, with topline data expected in the fourth quarter of 2023. TNX-102 SL is also being developed to treat fibromyalgia-type Long COVID, a chronic post-acute COVID-19 condition. Enrollment in a Phase 2 proof-of-concept study has been completed, and topline results are expected in the third quarter of 2023. TNX-601 ER (tianeptine hemioxalate extended-release tablets) is a once-daily oral formulation being developed as a treatment for major depressive disorder (MDD), that completed enrollment in a Phase 2 proof-of-concept study in the third quarter of 2023, with topline results expected in the fourth quarter of 2023. TNX-4300 (estianeptine) is a single isomer version of TNX-601, small molecule oral therapeutic in preclinical development to treat MDD, Alzheimer’s disease and Parkinson’s disease. Relative to tianeptine, estianeptine lacks activity on the µ-opioid receptor while maintaining activity in the rat Novel Object Recognition test in vivo and the ability to activate PPAR-β/δ and neuroplasticity in tissue culture. TNX-1900 (intranasal potentiated oxytocin), is in development for preventing headaches in chronic migraine, and has completed enrollment in a Phase 2 proof-of-concept study with topline data expected in the fourth quarter of 2023. TNX-1900 is also being studied in binge eating disorder, pediatric obesity and social anxiety disorder by academic collaborators under investigator-initiated INDs. TNX-1300 (cocaine esterase) is a biologic designed to treat cocaine intoxication and has been granted Breakthrough Therapy designation by the FDA. A Phase 2 study of TNX-1300 is expected to be initiated in the third quarter of 2023. Tonix’s rare disease development portfolio includes TNX-2900 (intranasal potentiated oxytocin) for the treatment of Prader-Willi syndrome. TNX-2900 has been granted Orphan Drug designation by the FDA. Tonix’s immunology development portfolio includes biologics to address organ transplant rejection, autoimmunity and cancer, including TNX-1500, which is a humanized monoclonal antibody targeting CD40-ligand (CD40L or CD154) being developed for the prevention of allograft rejection and for the treatment of autoimmune diseases. A Phase 1 study of TNX-1500 is expected to be initiated in the third quarter of 2023. Tonix’s infectious disease pipeline includes TNX-801, a vaccine in development to prevent smallpox and mpox. TNX-801 also serves as the live virus vaccine platform or recombinant pox vaccine platform for other infectious diseases. The infectious disease development portfolio also includes TNX-3900 and TNX-4000, which are classes of broad-spectrum small molecule oral antivirals.
*Tonix’s product development candidates are investigational new drugs or biologics and have not been approved for any indication.
Tonix Medicines has contracted to acquire the Zembrace SymTouch and Tosymra registered trademarks. Intravail is a registered trademark of Aegis Therapeutics, LLC, a wholly owned subsidiary of Neurelis, Inc.
This press release and further information about Tonix can be found at www.tonixpharma.com.
Forward Looking Statements
Certain statements in this press release are forward-looking within the meaning of the Private Securities Litigation Reform Act of 1995. These statements may be identified by the use of forward-looking words such as “anticipate,” “believe,” “forecast,” “estimate,” “expect,” and “intend,” among others. These forward-looking statements are based on Tonix’s current expectations and actual results could differ materially. There are a number of factors that could cause actual events to differ materially from those indicated by such forward-looking statements. These factors include, but are not limited to, risks related to the failure to obtain FDA clearances or approvals and noncompliance with FDA regulations; risks related to the failure to successfully market any of our products; risks related to the timing and progress of clinical development of our product candidates; our need for additional financing; uncertainties of patent protection and litigation; uncertainties of government or third party payor reimbursement; limited research and development efforts and dependence upon third parties; and substantial competition. As with any pharmaceutical under development, there are significant risks in the development, regulatory approval and commercialization of new products. Tonix does not undertake an obligation to update or revise any forward-looking statement. Investors should read the risk factors set forth in the Annual Report on Form 10-K for the year ended December 31, 2022, as filed with the Securities and Exchange Commission (the “SEC”) on March 13, 2023, and periodic reports filed with the SEC on or after the date thereof. All of Tonix’s forward-looking statements are expressly qualified by all such risk factors and other cautionary statements. The information set forth herein speaks only as of the date thereof.
Company to host conference call and webcast at 4:30 p.m. ET on Thursday, August 10, 2023
NEWTOWN, Pa., Aug. 03, 2023 (GLOBE NEWSWIRE) — Onconova Therapeutics, Inc. (NASDAQ: ONTX), (“Onconova” or “the Company”), a clinical-stage biopharmaceutical company focused on discovering and developing novel products for patients with cancer, today announced that the Company intends to release its second quarter 2023 financial results on Thursday, August 10, 2023. Management plans to host a conference call and live webcast at 4:30 p.m. ET on the same day to discuss these results and provide an update on its pipeline programs.
Conference Call and Webcast Information
Interested parties who wish to participate in the conference call may do so by dialing:
(800) 715-9871 for domestic and
(646) 307-1963 for international callers and
Using conference ID 9506701.
Those interested in listening to the conference call via the internet may do so by visiting the investors and media page on the Company’s website at www.onconova.com and clicking on the webcast link. In addition to the live webcast, a replay will be available on the Onconova website for 90 days following the call.
About Onconova Therapeutics, Inc. Onconova Therapeutics is a clinical-stage biopharmaceutical company focused on discovering and developing novel products for patients with cancer. The Company has proprietary targeted anti-cancer agents designed to disrupt specific cellular pathways that are important for cancer cell proliferation.
Onconova’s novel, proprietary multi-kinase inhibitor narazaciclib (formerly ON 123300) is being evaluated in a Phase 1/2 combination trial with the estrogen blocker, letrozole, in advanced low grade endometrial cancer (NCT05705505). Based on preclinical and clinical studies of CDK 4/6 inhibitors, Onconova is also evaluating opportunities for combination studies with narazaciclib in additional indications.
Onconova’s product candidate rigosertib is being studied in multiple investigator-sponsored studies. These studies include a dose-escalation and expansion Phase 1/2a study of oral rigosertib in combination with nivolumab in patients with KRAS+ non-small cell lung cancer (NCT04263090), a Phase 2 program evaluating oral or IV rigosertib monotherapy in advanced squamous cell carcinoma complicating recessive dystrophic epidermolysis bullosa (RDEB-associated SCC (NCT03786237, NCT04177498), and a Phase 2 trial evaluating rigosertib in combination with pembrolizumab in patients with metastatic melanoma(NCT05764395).
Forward Looking Statements Some of the statements in this release are forward-looking statements within the meaning of Section 27A of the Securities Act of 1933, as amended, Section 21E of the Securities Exchange Act of 1934, as amended, and the Private Securities Litigation Reform Act of 1995, and involve risks and uncertainties. These statements relate to Onconova’s expectations regarding its clinical development and trials, its product candidates and its business and financial position. Onconova has attempted to identify forward-looking statements by terminology including “believes,” “estimates,” “anticipates,” “expects,” “plans,” “intends,” “may,” “could,” “might,” “will,” “should,” “preliminary,” “encouraging,” “approximately” or other words that convey uncertainty of future events or outcomes. Although Onconova believes that the expectations reflected in such forward-looking statements are reasonable as of the date made, expectations may prove to have been materially different from the results expressed or implied by such forward-looking statements. These statements are only predictions and involve known and unknown risks, uncertainties, and other factors, including the success and timing of Onconova’s clinical trials, investigator-sponsored trials, regulatory agency and institutional review board approvals of protocols, Onconova’s collaborations, market conditions and those discussed under the heading “Risk Factors” in Onconova’s most recent Annual Report on Form 10-K and quarterly reports on Form 10-Q. Any forward-looking statements contained in this release speak only as of its date. Onconova undertakes no obligation to update any forward-looking statements contained in this release to reflect events or circumstances occurring after its date or to reflect the occurrence of unanticipated events.
SANTA MONICA, Calif.–(BUSINESS WIRE)– Entravision Communications Corporation (NYSE: EVC), a leading global advertising solutions, media and technology company, today announced financial results for the three- and six-month periods ended June 30, 2023.
Second Quarter 2023 Highlights
Record quarterly advertising revenue
Net revenue up 23% over the prior-year quarter
Net loss attributable to common stockholders of $2.0 million compared to net income attributable to common stockholders of $8.5 million in the prior-year quarter
Consolidated EBITDA down 37% compared to the prior-year quarter
Operating cash flow up 7% over the prior-year quarter
Free cash flow down 89% compared to the prior-year quarter
Quarterly cash dividend of $0.05 per share
“We delivered another strong quarter at Entravision with record quarterly revenue of $273.4 million, increasing 23% year-over-year,” said Chris Young, Chief Financial Officer. “While elevated operating expenses led to a decline in adjusted EBITDA, we remain focused on managing expenses and leveraging our strong balance sheet to ensure we are well-positioned to grow in the current macroeconomic environment. We were also excited to welcome Michael Christenson as our new CEO at the beginning of July. We look forward to continuing to drive growth under his leadership.”
Quarterly Cash Dividend
The Company announced today that its Board of Directors approved a quarterly cash dividend to shareholders of $0.05 per share on the Company’s Class A and Class U common stock, in an aggregate amount of $4.4 million. The quarterly dividend will be payable on September 29, 2023 to shareholders of record as of the close of business on September 15, 2023, and the common stock will trade ex-dividend on September 14, 2023. The Company currently anticipates that future cash dividends will be paid on a quarterly basis; however, any decision to pay future cash dividends will be subject to approval by the Board.
Non-GAAP Financial Measures
This press release contains certain non-GAAP financial measures as defined by SEC Regulation G. The GAAP financial measure most directly comparable to each of these non-GAAP financial measures, and a table reconciling each of these non-GAAP financial measures to its most directly comparable GAAP financial measure is included beginning on page 10.
Net revenue in the second quarter of 2023 totaled $273.4 million, up 23% from $221.7 million in the prior-year period. Of the overall increase, $55.5 million was attributable to our digital segment and was primarily due to advertising revenue growth from our digital commercial partnerships business, and due to various acquisitions, which did not contribute to our financial results in our digital segment in the comparable period. The overall increase was partially offset by a decrease of $2.5 million attributable to our television segment, primarily due to decreases in political advertising revenue and national advertising revenue, partially offset by increases in local advertising revenue, spectrum usage rights revenue and retransmission consent revenue. In addition, the overall increase was partially offset by a decrease of $1.4 million attributable to our audio segment, primarily due to a decrease in political advertising revenue, and decreases in local and national advertising revenue.
Cost of revenue in the second quarter of 2023 totaled $195.8 million, up 35% from $145.0 million in the prior-year period. The increase was primarily due to increased cost of revenue related to advertising revenue growth from our digital commercial partnerships business, and due to various acquisitions, which did not contribute to our financial results in our digital segment in the comparable period.
Operating expenses in the second quarter of 2023 totaled $56.6 million, up 20% from $47.4 million in the prior-year period. Of the overall increase, $7.8 million was attributable to our digital segment and was primarily due to an increase in non-cash stock-based compensation, which is mainly a result of the timing of the 2023 annual restricted stock unit (“RSU”) grant to certain employees, which was made in February 2023 compared to the 2022 annual grant, which was made in December 2022, and due to an increase in expenses associated with the increase in digital advertising revenue, an increase in salary expense, and due to various acquisitions, which did not contribute to our financial results in our digital segment in the comparable period. Additionally, of the overall increase in operating expenses, $0.1 million was attributable to our television segment primarily due to an increase in non-cash stock-based compensation, which is mainly a result of the 2023 annual RSU grant timing mentioned above, partially offset by a decrease in bad debt expense. In addition, of the overall increase in operating expenses, $1.3 million was attributable to our audio segment primarily due to an increase in non-cash stock-based compensation, which is mainly a result of the 2023 annual RSU grant timing mentioned above, and due to an increase in salaries and increased rent expense in the temporary office space until the move to our new permanent offices, which was completed in June 2023.
Corporate expenses in the second quarter of 2023 totaled $12.0 million, up 41% from $8.5 million in the prior-year period. The increase was primarily due to an increase in non-cash stock-based compensation, which is mainly a result of the 2023 annual RSU grant timing mentioned above, and increases in professional service fees.
Net revenue for the six-month period of 2023 totaled $512.4 million, up 22% from $418.9 million in the prior-year period. Of the overall increase, $98.3 million was attributable to our digital segment and was primarily due to advertising revenue growth from our digital commercial partnerships business, and due to various acquisitions, which did not contribute to our financial results in our digital segment in the comparable period. The overall increase was partially offset by a decrease of $2.9 million attributable to our television segment, primarily due to decreases in political advertising revenue and national advertising revenue, partially offset by increases in local advertising revenue, spectrum usage rights revenue and retransmission consent revenue. In addition, the overall increase was partially offset by a decrease of $1.7 million attributable to our audio segment, primarily due to a decrease in political advertising revenue, and decreases in local and national advertising revenue.
Cost of revenue for the six-month period of 2023 totaled $363.6 million, up 32% from $274.9 million in the prior-year period. The increase was primarily due to increased cost of revenue related to advertising revenue growth from our digital commercial partnerships business, and due to various acquisitions, which did not contribute to our financial results in our digital segment in the comparable period.
Operating expenses for the six-month period of 2023 totaled $109.3 million, up 20% from $91.2 million in the prior-year period. Of the overall increase, $14.1 million was attributable to our digital segment and was primarily due to an increase in non-cash stock-based compensation, which is mainly a result of the 2023 annual RSU grant timing mentioned above, and due to an increase in expenses associated with the increase in digital advertising revenue, an increase in salary expense, and due to various acquisitions, which did not contribute to our financial results in our digital segment in the comparable period. Additionally, of the overall increase in operating expenses, $1.0 million was attributable to our television segment primarily due to an increase in non-cash stock-based compensation, which is mainly a result of the 2023 annual RSU grant timing mentioned above. In addition, of the overall increase in operating expenses, $2.9 million was attributable to our audio segment primarily due to an increase in non-cash stock-based compensation, which is mainly a result of the 2023 annual RSU grant timing mentioned above, and due to an increase in salaries and increased rent expense in the temporary office space until the move to our new permanent offices, which was completed in June 2023.
Corporate expenses for the six-month period of 2023 totaled $22.5 million, up 31% from $17.2 million in the prior-year period. The increase was primarily due to an increase in non-cash stock-based compensation, which is mainly a result of the 2023 annual RSU grant timing mentioned above, and increases in professional service fees, audit fees and rent expense.
Balance Sheet and Related Metrics
Cash and marketable securities as of June 30, 2023 totaled $126.5 million. Total debt under the Company’s credit agreement was $210.3 million. Net of $50 million of cash and marketable securities, total leverage as defined in the Company’s credit agreement was 1.8 times as of June 30, 2023. Net of total cash and marketable securities, total leverage was 1.0 times.
Notice of Conference Call
Entravision Communications Corporation will hold a conference call to discuss its second quarter 2023 results on Thursday, August 3, 2023 at 5:00 p.m. Eastern Time. To access the conference call, please dial (844) 836-8739 (U.S.) or (412) 317-5440 (Int’l) ten minutes prior to the start time and reference Conference ID number 10180063. The call will also be available via live webcast on the investor relations portion of the Company’s website located at www.entravision.com.
About Entravision Communications Corporation
Entravision is a global advertising solutions, media and technology company. Over the past three decades, we have strategically evolved into a digital powerhouse, expertly connecting brands to consumers in the U.S., Latin America, Europe, Asia and Africa. Our digital segment, the company’s largest by revenue, offers a full suite of end-to-end advertising services in 40 countries. We have commercial partnerships with Meta, X Corp. (formerly known as Twitter), TikTok, and Spotify, and marketers can use our Smadex and other platforms to deliver targeted advertising to audiences around the globe. In the U.S., we maintain a diversified portfolio of television and radio stations that target Hispanic audiences and complement our global digital services. Entravision remains the largest affiliate group of the Univision and UniMás television networks. Shares of Entravision Class A Common Stock trade on the NYSE under ticker: EVC. Learn more about our offerings at entravision.com or connect with us on LinkedIn and Facebook.
Forward-Looking Statements
This press release contains certain forward-looking statements. These forward-looking statements, which are included in accordance with the safe harbor provisions of the Private Securities Litigation Reform Act of 1995, may involve known and unknown risks, uncertainties and other factors that may cause the Company’s actual results and performance in future periods to be materially different from any future results or performance suggested by the forward-looking statements in this press release. Although the Company believes the expectations reflected in such forward-looking statements are based upon reasonable assumptions, it can give no assurance that actual results will not differ materially from these expectations, and the Company disclaims any duty to update any forward-looking statements made by the Company. From time to time, these risks, uncertainties and other factors are discussed in the Company’s filings with the Securities and Exchange Commission.
Christopher T. Young Chief Financial Officer and Treasurer Entravision Communications Corporation 310-447-3870
Second Quarter 2023 Revenues of $256.9 Million Increased 14.6 Percent Over Second Quarter 2022 Revenues of $224.2 Million, Including 17.1 Percent Organic Growth in Kratos Government Solutions Segment
Second Quarter 2023 and Last Twelve Months Ended June 25, 2023 Consolidated Book to Bill Ratio of 1.1 to 1
Affirms Full Year 2023 Financial Forecast
SAN DIEGO, Aug. 03, 2023 (GLOBE NEWSWIRE) — Kratos Defense & Security Solutions, Inc. (Nasdaq: KTOS), a Technology Company in the Defense, National Security and Global Markets, today reported its second quarter 2023 financial results. For the second quarter of 2023, Kratos reported Revenues of $256.9 million, Operating Income of $6.7 million, Net Loss of $2.7 million, Adjusted EBITDA of $21.6 million and a consolidated book to bill ratio of 1.1 to 1.0.
Included in second quarter 2023 Net Loss and Operating Income is non-cash stock compensation expense of $6.0 million and Company-funded Research and Development (R&D) expense of $9.9 million, primarily reflecting significant ongoing development efforts being made, including in our Space and Satellite business to develop our virtual, software-based OpenSpace command & control (C2), telemetry tracking & control (TT&C) and other ground system solutions. The second quarter 2023 Net Loss includes a $2.3 million loss attributable to a non-controlling interest, which includes a $2.0 million adjustment recorded to reflect the estimated increase in the value of the redeemable non-controlling interest to the estimated redemption amount by Kratos based upon current forecasted financial performance.
Kratos reported a second quarter 2023 GAAP Net Loss of $2.7 million and a GAAP Net Loss per share of $0.02, compared to a GAAP Net Loss of $4.7 million and a GAAP Net Loss per share of $0.04 for the second quarter of 2022. Adjusted earnings per share (EPS) was $0.09 for the second quarter of 2023, compared to $0.07 for the second quarter of 2022.
Second quarter 2023 Revenues of $256.9 million increased $32.7 million, or 14.6 percent, from second quarter 2022 Revenues of $224.2 million. Second quarter 2023 Revenues include contribution of $13.1 million of Revenue from the acquisition of the Engineering Division of Southern Research Institute (SRE), consolidated organic Revenue growth of 10.7 percent and organic Revenue growth of 17.1 percent in our KGS Segment, reflecting organic growth in each of the KGS businesses, with the most notable increases in our Space, Satellite and Cyber, C5ISR, and Turbine Technologies businesses.
Second quarter 2023 Cash Flow Generated from Operations was $23.6 million, reflecting the achievement of favorable billing milestones on certain contracts, offset partially by working capital requirements related to revenue growth and continued advanced inventory purchases in an effort to mitigate supply chain disruptions. Free Cash Flow Generated from Operations was $20.7 million after funding of $11.2 million of capital expenditures and receipt of $8.3 million of proceeds for sale of Valkyries that were built as Kratos capital assets.
For the second quarter of 2023, Kratos’ Unmanned Systems Segment (KUS) generated Revenues of $52.1 million, as compared to $56.4 million in the second quarter of 2022, primarily reflecting reduced tactical drone related activity as compared to 2022. KUS’s Operating Income was $1.2 million in the second quarter of 2023 compared to Operating Loss of $5.0 million in the second quarter of 2022, which included a litigation related settlement charge of $5.5 million.
KUS’s Adjusted EBITDA for the second quarter of 2023 was $3.6 million, compared to second quarter 2022 KUS Adjusted EBITDA of $2.9 million, reflecting a more favorable mix.
KUS’s book-to-bill ratio for the second quarter of 2023 was 1.2 to 1.0 and 1.3 to 1.0 for the last twelve months ended June 25, 2023, with bookings of $64.7 million for the three months ended June 25, 2023, and bookings of $266.2 million for the last twelve months ended June 25, 2023. Total backlog for KUS at the end of the second quarter of 2023 was $256.7 million compared to $244.1 million at the end of the first quarter of 2023.
For the second quarter of 2023, Kratos’ Government Solutions Segment (KGS) Revenues of $204.8 million increased 22.1 percent from Revenues of $167.8 million in the second quarter of 2022. The increased Revenues includes the contribution of approximately $13.1 million of Revenues from the SRE acquisition, and organic revenue growth in our Space, Satellite and Cyber, Turbine Technologies, C5ISR, Microwave Products and Defense Rocket Systems businesses. Excluding the SRE acquisition, KGS revenues grew organically 17.1 percent in the second quarter of 2023 as compared to the second quarter of 2022.
KGS reported operating income of $11.6 million in the second quarter of 2023 compared to $9.5 million in the second quarter of 2022, primarily reflecting the increased revenue volume. Second quarter 2023 KGS Adjusted EBITDA was $18.0 million, compared to second quarter 2022 KGS Adjusted EBITDA of $14.8 million, primarily reflecting the increased revenue volume.
Kratos’ Space, Satellite and Cyber business generated Revenues of $98.4 million in the second quarter of 2023 compared to $88.5 million in the second quarter of 2022, reflecting a 11.2 percent organic growth rate.
For the second quarter of 2023, KGS reported a book-to-bill ratio of 1.1 to 1.0, a book to bill ratio of 1.1 to 1.0 for the last twelve months ended June 25, 2023 and bookings of $217.1 million and $807.4 million for the three and last twelve months ended June 25, 2023, respectively. KGS includes Kratos’ Space, Training and Cyber business, which reported a book to bill ratio of 0.9 to 1.0 for the second quarter of 2023 and a book to bill ratio of 1.1 to 1.0 for the last twelve months ended June 25, 2023. Bookings for Kratos’ Space, Training and Cyber business for the three months and last twelve months ended June 25, 2023 were $95.6 million and $412.0 million, respectively. KGS’s total backlog at the end of the second quarter of 2023 was $900.6 million, as compared to $888.3 million at the end of the first quarter of 2023.
For the second quarter of 2023, Kratos reported consolidated bookings of $281.9 million and a book-to-bill ratio of 1.1 to 1.0, with consolidated bookings of $1.07 billion and a book-to-bill ratio of 1.1 to 1.0 for the last twelve months ended June 25, 2023. Consolidated backlog was $1.16 billion on June 25, 2023 and $1.13 billion on March 26, 2023. Kratos’ bid and proposal pipeline was $10 billion at June 25, 2023 and March 26, 2023. Backlog at June 25, 2023 was comprised of funded backlog of $863.9 million and unfunded backlog of $293.4 million.
Eric DeMarco, Kratos’ President and CEO, said, “For Q2, Kratos generated consolidated organic revenue growth of 10.7%, Adjusted EBITDA of $21.6 million, cash flow from operations of $23.6 million and free cash flow from operations of $20.7 million. Kratos’ Unmanned Systems book to bill ratio for Q2 was 1.2 to 1.0 and Kratos’ overall book to bill ratio both for the second quarter and year to date was 1.1 to 1.0. Additionally, we have a record backlog and a bid and proposal pipeline of approximately $10 billion, including hypersonic, space, propulsion system, satellite communications and drone opportunities, with several where multiple Kratos business units are collaborating in a company-wide Kratos cross-divisional pursuit.”
Mr. DeMarco continued, “Since our last quarterly report, we have successfully launched a customer’s new hypersonic system, ground tested Kratos’ new Zeus 1 solid rocket motor, including as related to Kratos’ Erinyes and Dark Fury hypersonic vehicles, received new space and satellite system program awards, including Kratos’ OpenSpace virtualized software C2 and TT&C System, reached customer agreement on a significant propulsion system program award and received a $95 million target drone system award. Kratos’ Tactical drone business also continues to progress, with multiple initiatives and customers, including bringing artificial intelligence driven combat drones to the warfighter.”
Mr. DeMarco concluded, “Kratos is a product, technology, system and software company. Kratos’ priorities include winning new program awards where Kratos offerings are disruptive differentiators, operational execution, organic growth and continued year over year increased revenue, profitability and cash flow. We will make certain, targeted investments, in areas where Kratos can be disruptive and first to market, with no significant acquisitions planned. A primary operational challenge remains obtaining and retaining qualified personnel to execute existing and expected program awards, including individuals willing and able to obtain National Security Clearances, and the significantly increased cost of these individuals, all of which every Kratos business is collaborating and working closely together to address.”
Financial Guidance
We are providing our initial 2023 third quarter financial guidance and affirming our full year 2023 guidance today, which includes our current forecasted business mix, and our assumptions, including as related to: employee sourcing, hiring and retention; manufacturing, production and supply chain disruptions; parts shortages and related continued potential significant cost and price increases, including for employees, materials and components that are impacting the industry and Kratos. The range of our expected third quarter 2023 revenues includes assumptions of forecasted execution, including the number of qualified personnel expected to be obtained and retained to successfully execute on our programs and contracts, as well as expected contract awards.
Our third quarter and full year 2023 guidance ranges are as follows:
Current Guidance Range
$M
Q323
FY23
Revenues
$240 – $260
$980 – $1,000
R&D
$9 – $10
$38 – $39
Operating Income
$3 – $6
$24 – $28
Depreciation
$7 – $8
$27 – $28
Amortization
$2 – $3
$8 – $10
Stock Based Compensation
$6 – $7
$24 – $26
Adjusted EBITDA
$18 – $22
$85 – $89
Operating Cash Flow
$55 – $65
Capital Expenditures
$45 – $50
Free Cash Flow Generation
$10 – $20
Management will discuss the Company’s financial results, on a conference call beginning at 2:00 p.m. Pacific (5:00 p.m. Eastern) today. The call will be available at www.kratosdefense.com. Participants may register for the call using this Online Form. Upon registration, all telephone participants will receive the dial-in number along with a unique PIN that can be used to access the call. For those who cannot access the live broadcast, a replay will be available on Kratos’ website.
About Kratos Defense & Security Solutions Kratos Defense & Security Solutions, Inc. (NASDAQ: KTOS) is a Technology Company that develops and fields transformative, affordable systems, products and solutions for United States National Security, our allies and global commercial enterprises. At Kratos, Affordability is a Technology, and Kratos is changing the way breakthrough technology is rapidly brought to market – at a low cost – with actual products, systems, and technologies rather than slide decks or renderings. Through proven commercial and venture capital backed approaches, including proactive, internally funded research and streamlined development processes, Kratos is focused on being First to Market with our solutions, well in advance of competition. Kratos is the recognized Technology Disruptor in our core market areas, including Space and Satellite Communications, Cyber Security and Warfare, Unmanned Systems, Rocket and Hypersonic Systems, Next-Generation Jet Engines and Propulsion Systems, Microwave Electronics, C5ISR and Virtual and Augmented Reality Training Systems. For more information, visit www.KratosDefense.com.
Notice RegardingForward-LookingStatements This news release contains certain forward-looking statements that involve risks and uncertainties, including, without limitation, express or implied statements concerning the Company’s expectations regarding its future financial performance, including the Company’s expectations for its third quarter and full year 2023 revenues, R&D, operating income (loss), depreciation, amortization, stock based compensation expense, and Adjusted EBITDA, and full year 2023 operating cash flow, capital expenditures and other investments, and free cash flow, the Company’s future growth trajectory and ability to achieve improved revenue mix and profit in certain of its business segments and the expected timing of such improved revenue mix and profit, including the Company’s ability to achieve sustained year over year increasing revenues, profitability and cash flow, the Company’s expectation of ramp on projects and that investments in its business, including Company funded R&D expenses and ongoing development efforts, will result in an increase in the Company’s market share and total addressable market and position the Company for significant future organic growth, profitability, cash flow and an increase in shareholder value, the Company’s bid and proposal pipeline and backlog, including the Company’s ability to timely execute on its backlog, demand for its products and services, including the Company’s alignment with today’s National Security requirements and the positioning of its C5ISR and other businesses, ability to successfully compete and expected new customer awards, including the magnitude and timing of funding and the future opportunity associated with such awards, including in the target and tactical drone and satellite communication areas, performance of key contracts and programs, including the timing of production and demonstration related to certain of the Company’s contracts and product offerings, the impact of the Company’s restructuring efforts and cost reduction measures, including its ability to improve profitability and cash flow in certain business units as a result of these actions and to achieve financial leverage on fixed administrative costs, the ability of the Company’s advanced purchases of inventory to mitigate supply chain disruptions and the timing of converting these investments to cash through the sales process, benefits to be realized from the Company’s net operating loss carry forwards, the availability and timing of government funding for the Company’s offerings, including the strength of the future funding environment, the short-term delays that may occur as a result of Continuing Resolutions or delays in DoD budget approvals, timing of LRIP and full rate production related to the Company’s unmanned aerial target system offerings, as well as the level of recurring revenues expected to be generated by these programs once they achieve full rate production, market and industry developments, and the current estimated impact of COVID-19 and employee absenteeism, supply chain disruptions, availability of an experienced skilled workforce, inflation and increased costs, and delays in our financial projections, industry, business and operations, including projected growth. Such statements are only predictions, and the Company’s actual results may differ materially from the results expressed or implied by these statements. Investors are cautioned not to place undue reliance on any such forward-looking statements. All such forward-looking statements speak only as of the date they are made, and the Company undertakes no obligation to update or revise these statements, whether as a result of new information, future events or otherwise. Factors that may cause the Company’s results to differ include, but are not limited to: risks to our business and financial results related to the reductions and other spending constraints imposed on the U.S. Government and our other customers, including as a result of sequestration and extended continuing resolutions, the Federal budget deficit and Federal government shut-downs; risks of adverse regulatory action or litigation; risks associated with debt leverage and cost savings and cash flow improvements expected as a result of the refinancing of our Senior Notes; risks that our cost-cutting initiatives will not provide the anticipated benefits; risks that changes, cutbacks or delays in spending by the U.S. Department of Defense, or DoD, may occur, which could cause delays or cancellations of key government contracts; risks of delays to or the cancellation of our projects as a result of protest actions submitted by our competitors; risks that changes may occur in Federal government (or other applicable) procurement laws, regulations, policies and budgets; risks of the availability of government funding for the Company’s products and services due to performance, cost growth, or other factors, changes in government and customer priorities and requirements (including cost-cutting initiatives, the potential deferral of awards, terminations or reduction of expenditures to respond to the priorities of Congress and the Administration, or budgetary cuts resulting from Congressional committee recommendations or automatic sequestration under the Budget Control Act of 2011, as amended); risks that the unmanned aerial systems and unmanned ground sensor markets do not experience significant growth; risks that products we have developed or will develop will become programs of record; risks that we cannot expand our customer base or that our products do not achieve broad acceptance which could impact our ability to achieve our anticipated level of growth; risks of increases in the Federal government initiatives related to in-sourcing; risks related to security breaches, including cyber security attacks and threats or other significant disruptions of our information systems, facilities and infrastructures; risks related to our compliance with applicable contracting and procurement laws, regulations and standards; risks related to the new DoD Cybersecurity Maturity Model Certification; risks relating to the ongoing conflict in Ukraine; risks related to contract performance; risks related to failure of our products or services; risks associated with our subcontractors’ or suppliers’ failure to perform their contractual obligations, including the appearance of counterfeit or corrupt parts in our products; changes in the competitive environment (including as a result of bid protests); failure to successfully integrate acquired operations and compete in the marketplace, which could reduce revenues and profit margins; risks that potential future goodwill impairments will adversely affect our operating results; risks that anticipated tax benefits will not be realized in accordance with our expectations; risks that a change in ownership of our stock could cause further limitation to the future utilization of our net operating losses; risks that we may be required to record valuation allowances on our net operating losses which could adversely impact our profitability and financial condition; risks that the current economic environment will adversely impact our business, including with respect to our ability to recruit and retain sufficient numbers of qualified personnel to execute on our programs and contracts, as well as expected contract awards and risks related to increasing interest rates and risks related to the interest rate swap contract to hedge Term SOFR associated with the Company’s Term Loan A; currently unforeseen risks associated with COVID-19 and risks related to natural disasters or severe weather. These and other risk factors are more fully discussed in the Company’s Annual Report on Form 10-K for the period ended December 25, 2022, and in our other filings made with the Securities and Exchange Commission.
Note Regarding Use of Non-GAAP Financial Measures and Other Performance Metrics This news release contains non-GAAP financial measures, including Adjusted EPS (computed using income from continuing operations before income taxes, excluding income (loss) from discontinued operations, excluding income (loss) attributable to non-controlling interest, excluding depreciation, amortization of intangible assets, amortization of capitalized contract and development costs, stock-based compensation expense, acquisition and restructuring related items and other, which includes, but is not limited to, legal related items, non-recoverable rates and costs, and foreign transaction gains and losses, less the estimated impact to income taxes) and Adjusted EBITDA (which includes net income (loss) attributable to noncontrolling interest and excludes, among other things, losses and gains from discontinued operations, acquisition and restructuring related items, stock compensation expense, foreign transaction gains and losses, and the associated margin rates). Additional non-GAAP financial measures include Free Cash Flow from Operations computed as Cash Flow from Operations less Capital Expenditures plus proceeds from sale of assets and Adjusted EBITDA related to our KUS and KGS businesses. Kratos believes this information is useful to investors because it provides a basis for measuring the Company’s available capital resources, the actual and forecasted operating performance of the Company’s business and the Company’s cash flow, excluding non-recurring items and non-cash items that would normally be included in the most directly comparable measures calculated and presented in accordance with GAAP. The Company’s management uses these non-GAAP financial measures, along with the most directly comparable GAAP financial measures, in evaluating the Company’s actual and forecasted operating performance, capital resources and cash flow. Non-GAAP financial measures should not be considered in isolation from, or as a substitute for, financial information presented in compliance with GAAP, and investors should carefully evaluate the Company’s financial results calculated in accordance with GAAP and reconciliations to those financial results. In addition, non-GAAP financial measures as reported by the Company may not be comparable to similarly titled amounts reported by other companies. As appropriate, the most directly comparable GAAP financial measures and information reconciling these non-GAAP financial measures to the Company’s financial results prepared in accordance with GAAP are included in this news release.
Another Performance Metric the Company believes is a key performance indicator in our industry is our Book to Bill Ratio as it provides investors with a measure of the amount of bookings or contract awards as compared to the amount of revenues that have been recorded during the period and provides an indicator of how much of the Company’s backlog is being burned or utilized in a certain period. The Book to Bill Ratio is computed as the number of bookings or contract awards in the period divided by the revenues recorded for the same period. The Company believes that the rolling or last twelve months’ Book to Bill Ratio is meaningful since the timing of quarter-to-quarter bookings can vary.
Unaudited Reconciliation of GAAP to Non-GAAP Measures
Note: (1) Adjusted EBITDA is a non-GAAP measure defined as GAAP net loss attributable to Kratos adjusted for net income attributable to noncontrolling interest, income from discontinued operations, net interest expense, provision (benefit) for income taxes, depreciation and amortization expense of intangible assets, amortization of capitalized contract and development costs, stock-based compensation, acquisition and restructuring related items and other, and foreign transaction loss.
Adjusted EBITDA as calculated by us may be calculated differently than Adjusted EBITDA for other companies. We have provided Adjusted EBITDA because we believe it is a commonly used measure of financial performance in comparable companies and is provided to help investors evaluate companies on a consistent basis, as well as to enhance understanding of our operating results. Adjusted EBITDA should not be construed as either an alternative to net income (loss) or as an indicator of our operating performance or an alternative to cash flows as a measure of liquidity. The adjustments to calculate this non-GAAP financial measure and the basis for such adjustments are outlined below. Please refer to the following table below that reconciles GAAP net loss to Adjusted EBITDA.
The adjustments to calculate this non-GAAP financial measure, and the basis for such adjustments, are outlined below:
Interest income and interest expense, net. The Company receives interest income on investments and incurs interest expense on loans, capital leases and other financing arrangements, including the amortization of issue discounts and deferred financing costs. These amounts may vary from period to period due to changes in cash and debt balances.
Income taxes. The Company’s tax expense can fluctuate materially from period to period due to tax adjustments that may not be directly related to underlying operating performance or to the current period of operations and may not necessarily reflect the impact of utilization of our NOLs.
Depreciation. The Company incurs depreciation expense (recorded in cost of revenues and in operating expenses) related to capital assets purchased, leased or constructed to support the ongoing operations of the business. The assets are recorded at cost or fair value and are depreciated over the estimated useful lives of individual assets.
Amortization of intangible assets. The Company incurs amortization of intangible expense related to acquisitions it has made. These intangible assets are valued at the time of acquisition and are amortized over the estimated useful lives.
Amortization of capitalized contract and development costs. The Company incurs amortization of previously capitalized software development and non-recurring engineering costs related to certain targets in its Unmanned Systems and ballistic missile target businesses as these units are sold.
Stock-based compensation expense. The Company incurs expense related to stock-based compensation included in its GAAP presentation of selling, general and administrative expense. Although stock-based compensation is an expense of the Company and viewed as a form of compensation, these expenses vary in amount from period to period, and are affected by market forces that are difficult to predict and are not within the control of management, such as the market price and volatility of the Company’s shares, risk-free interest rates and the expected term and forfeiture rates of the awards. Management believes that exclusion of these expenses allows comparison of operating results to those of other companies that disclose non-GAAP financial measures that exclude stock-based compensation.
Foreign transaction (gain) loss. The Company incurs transaction gains and losses related to transactions with foreign customers in currencies other than the U.S. dollar. In addition, certain intercompany transactions can give rise to realized and unrealized foreign currency gains and losses.
Acquisition and transaction related items. The Company incurs transaction related costs, such as legal and accounting fees and other expenses, related to acquisitions and divestiture activities. Management believes these items are outside the normal operations of the Company’s business and are not indicative of ongoing operating results.
Restructuring costs. The Company incurs restructuring costs for cost reduction actions which include employee termination costs, facility shut-down related costs and lease commitment costs for unused, excess or exited facilities. Management believes that these costs are not indicative of ongoing operating results as they are either non-recurring and/or not expected when full capacity and volumes are achieved.
Non-recoverable rates and costs. In fiscal 2022, the Company incurred non-recoverable rates and costs as a result of its inability to hire the required direct labor base to execute on its backlog due to a challenging environment in hiring and retaining skilled personnel. In addition, in 2022 the Company incurred non-recoverable rate growth resulting from a smaller than planned direct labor base due to delays in customer program execution and awards.
Legal related items. The Company incurs costs related to pending legal settlements and other legal related matters. Management believes these items are outside the normal operations of the Company’s business and are not indicative of ongoing operating results.
Adjusted EBITDA is a non-GAAP financial measure and should not be considered in isolation or as a substitute for financial information provided in accordance with GAAP. This non-GAAP financial measure may not be computed in the same manner as similarly titled measures used by other companies. The Company expects to continue to incur expenses similar to the Adjusted EBITDA financial adjustments described above, and investors should not infer from the Company’s presentation of this non-GAAP financial measure that these costs are unusual, infrequent, or non-recurring.
Note: Unallocated corporate expense, net includes costs for certain stock-based compensation programs (including stock-based compensation costs for stock options, employee stock purchase plan and restricted stock units), the effects of items not considered part of management’s evaluation of segment operating performance, and acquisition and restructuring related items, corporate costs not allocated to the segments, legal related items, and other miscellaneous corporate activities.
Vancouver, British Columbia–(Newsfile Corp. – August 3, 2023) – Maple Gold Mines Ltd. (TSXV: MGM) (OTCQB: MGMLF) (FSE: M3G) (“Maple Gold” or the “Company“) is pleased to report complete gold assay results from the first phase of deep drilling at the Douay Gold Project (“Douay”) located in Québec, Canada, which is held by a 50/50 joint venture (the “JV”) between the Company and Agnico Eagle Mines Limited. The Company is also pleased to announce the appointment of Jocelyn (Josh) Pelletier, M.Sc., P.geo. as its Chief Geologist. Mr. Pelletier is both a structural geologist and a specialist in metallogeny who brings more than 20 years of progressive exploration experience primarily focused on the formation of gold deposits and porphyry copper-gold systems. The Company also announces that Joness Lang and Fred Speidel have left the Company to pursue other opportunities.
At Douay, the JV completed a total of 5,793 metres (“m”) in three new holes and two extension holes during the first half of 2023. Four drill holes were designed as deep conceptual exploration holes to test for mineralization extensions at greater depths (up to ~1,600 m vertical depth) beneath Douay’s currently defined Mineral Resources, and the fifth drill hole was a shallower step-out hole to the east of the NW Zone (see Figure 1 for a plan view map depicting drill hole locations and key results, Figure 2 for a composite longitudinal section and Table 1 for a detailed summary of assay results). This first phase of widely spaced (from ~500 m to ~3,000 m between holes) deep drilling returned 10 separate intercepts >2.5 gold grams per tonne (“g/t Au”) and four broad intervals (from ~59 to ~221 m in length) of low-grade (mostly >0.1 g/t Au) gold mineralization, demonstrating that a deep-rooted gold system is present to the current limits of drilling. Pending multi-element assays from the first phase of deep drilling will be incorporated into ongoing vectoring efforts to develop follow up targets to continue testing the depth potential at Douay from successful proof-of-concept towards potentially economic gold intercepts in undrilled zones over more than six kilometers of strike length.
Highlighted Results and Key Takeaways:
All five drill holes intersected gold mineralization >1 g/t Au, with 10 intercepts >2.5 g/t Au and several broad (from ~59 m to ~221 m in length) low-grade intervals (averaging 0.1 to 0.3 g/t Au), demonstrating continuity of the gold system down to at least ~1,600 m vertical depth.
DO-23-332 and DO-23-326X both tested beneath the Porphyry Zone and returned the most compelling visual core observations with broad intervals of alteration and elevated fine grained pyrite mineralization. Such broad low-grade haloes, with multiple >1 g/t Au intercepts, are typical of the more peripheral parts of the Porphyry Zone.
DO-23-332 intersected 10 distinct intercepts of >1 g/t Au over at least 1.0 m. A broad (121 m) mineralized envelope with anomalous gold (0.31 g/t Au average) included intercepts of 3.6 g/t Au over 1 m, and 1.2 g/t Au over 10 m, including 3.3 g/t Au over 2 m. Additional 4.9 and 2.5 g/t Au intercepts over 1 m were obtained further up hole.
DO-23-326X returned eight intercepts grading >1 g/t Au over at least 1 m. Furthermore, this hole did not appear to intersect the full width of the potential zone and, importantly, bottomed in mineralization (see cross section in Figure 3). Visible gold was also identified at 1,826 m down-hole.
DO-23-331 was collared ~500 m south of the 531 Zone conceptual pit and returned 2.85 g/t Au over 1.6 m, including 6.2 g/t Au over 0.7 m, with a broader interval of 0.25 g/t Au over 50.8 m further up-hole.
“This deep drilling program was developed to test the potential for a much larger gold system at Douay while also demonstrating continuity of mineralization beneath currently defined Mineral Resources,” stated Matthew Hornor, President and CEO of Maple Gold. “The average vertical depth of all previous drilling at Douay is roughly 300 m, with limited data below 500 m, so this first pass of deeper drilling was discovery-focused with the aim of bringing us one step closer to uncovering a new zone at depth. The program was successful from a proof-of-concept standpoint in demonstrating mineralization continuity up to four times deeper than Douay’s currently defined Mineral Resources. Given what we’ve encountered in the JV’s first deep drill holes, the Company remains highly encouraged and confident that our detailed interpretation and vectoring work will lead to promising follow-up targets to incorporate into future drill campaigns at Douay. To support these ongoing initiatives, I am delighted to welcome Josh Pelletier as the Company’s new Chief Geologist and believe that his strong structural geology and metallogeny background will help unlock value at our strategically located and district-scale project portfolio within Quebec’s Abitibi greenstone belt.”
Technical Observations, Key Takeaways and Next Steps
The JV’s first phase deep drilling program delivered several key geological findings related to the potential depth continuity of gold mineralization at Douay:
From top-to-bottom (~2,000 m vertical depth), gold mineralization appears to be spatially associated with a porphyry-style intrusive complex and also appears in quartz-carbonate veins associated with shearing in the Casa Berardi Deformation Zone (“CBDZ”) that may be related to a separate orogenic gold system along this E-W regional structure.
Gold mineralization was identified within the contact zone between the two main lithologic sequences (Cartwright Hills Grp. volcanic sequences and Taibi Grp. sedimentary rocks) located along the crustal-scale CBDZ North structural corridor.
There are key structural corridors that appear to crosscut the auriferous porphyry-style mineralization, which provides potential for gold remobilization and reconcentration.
At Douay, two types of gold mineralization have been recognized: 1) gold that is spatially associated with porphyritic intrusive phases and 2) gold that is spatially associated with shear zones in the CBDZ. Both styles of mineralization may have formed in different conditions and time frames. The porphyry-style gold displays similarities to low-grade gold zones formed in magmatic-hydrothermal systems, while the gold related to shear zones is similar to other orogenic gold deposits that represent the majority of gold mines in the Abitibi gold belt. Therefore, it is important to distinguish both mineralization events, and to define their spatial distributions and orientations. The JV will be completing additional metallogenic interpretations and analysis to generate optimal targeting at Douay for future drill testing.
Figure 1: Plan view showing completed 2023 drill traces at Douay. Note DO-23-332 was drilled to 1,453 m but appears shorter due to subvertical inclination.
Multi-element analysis to define geochemical zonation and possible tracers to gold mineralization in order to improve vectoring within the mineralized system.
Paragenesis of gold mineralization based on mineralogical studies of the alteration patterns, gold deposition phases and other hydrothermal events.
Structural controls study to better constrain the geometry of known zones and improve targeting of structural traps.
Lithological studies to distinguish the different intrusive phases and evaluate their relationship with gold mineralization.
The Company will continue its vectoring work to refine the next set of priority drill targets at Douay, including follow-up on the first phase of deep drilling, as well as revisiting areas where the JV previously had successes (e.g. 531 and Western Porphyry zones). The Company is concurrently refining targets along its 100%-controlled Eagle Mine Project and in the Telbel Mine area within the JV’s Joutel Gold Project in preparation for anticipated fall and winter drilling campaigns, which are expected to be announced in the coming weeks. The Company’s VMS-focused exploration work is also ongoing with the aim of defining new drill targets, which are anticipated to be tested in early 2024.
Table 1: Complete Assay Results from the First Phase of Deep Drilling at Douay
Hole
UTME
UTMN
Azimuth
Plunge
Length (m)
From
To
Interval
Au g/t
DO-23-324X
704278
5490900
32
-66.5
779
1385.6
1397.0
11.4
0.28
including
1389.0
1391.0
2.0
0.95
DO-23-324X
1455.3
1457.5
2.2
0.74
DO-23-324X
1560.0
1568.3
8.3
0.83
including
1561.0
1561.9
0.9
2.76
including
1561.0
1565.9
4.9
1.28
including
1564.0
1565.9
1.9
1.50
DO-22-326
706400
5491650
172
-54
98
Master hole – reported on 11/30/22
DO-23-326XW1
706400
5491650
176.92
-50
1111
869.0
874.0
5.0
0.21
DO-23-326XW1
973.0
974.0
1.0
3.55
DO-23-326XW1
1213.0
1214.0
1.0
4.85
DO-23-326XW1
1276.0
1277.0
1.0
0.62
DO-23-326XW1
1641.0
1642.0
1.0
0.58
DO-23-326XW1
1664.8
1885.9
221.1
0.16
including
1670.0
1672.0
2.0
0.76
including
1695.0
1697.0
2.0
0.66
including
1706.0
1714.0
8.0
0.81
including
1711.0
1713.0
2.0
1.28
including
1739.0
1781.0
42.0
0.17
including
1790.0
1791.0
1.0
0.51
including
1826.0
1827.0
1.0
1.78
including
1833.3
1834.2
0.9
2.12
including
1850.5
1853.0
2.5
1.46
including
1852.0
1853.0
1.0
2.86
including
1861.0
1876.0
15.0
0.18
DO-23-326XW1
1945.4
1959.2
13.8
0.23
DO-23-331
706400
5491650
172
-54
2044
1869.0
1870.0
1.0
1.04
DO-23-331
1901.0
1951.8
50.8
0.25
including
1901.0
1902.0
1.0
1.15
including
1925.4
1927.0
1.6
2.85
including
1925.4
1926.1
0.7
6.17
including
1950.3
1950.8
0.5
2.96
DO-23-332
706820
5489915
340
-79.5
1453
135.0
136.0
1.0
1.10
DO-23-332
498.7
499.7
1.0
4.94
DO-23-332
653.7
664.7
11.0
0.29
including
657.0
659.0
2.0
0.74
DO-23-332
789.0
809.0
20.0
0.18
including
805.0
805.5
0.5
2.11
DO-23-332
845.2
852.0
6.8
0.29
DO-23-332
864.2
865.2
1.0
2.53
DO-23-332
953.0
953.5
0.5
1.26
DO-23-332
991.0
1112.0
121.0
0.31
including
1020.0
1021.0
1.0
3.61
including
1034.0
1044.0
10.0
1.16
including
1035.0
1037.0
2.0
3.31
including
1043.0
1044.0
1.0
1.01
including
1058.0
1059.0
1.0
1.25
including
1075.0
1077.0
2.0
1.12
including
1075.0
1076.0
1.0
1.49
including
1111.0
1112.0
1.0
1.07
DO-23-332
1205.0
1329.0
124.0
0.13
including
1295.0
1297.0
2.0
0.61
DO-23-333
705950
5492140.3
360
-55
297
248.0
252.8
4.8
0.69
including
251.3
252.8
1.5
1.55
Note: All reported intercepts are downhole core lengths. Estimated true widths are unknown at this time due to the limited data at the depths drilled.
Corporate Updates
Maple Gold is pleased to announce the appointment of Jocelyn (Josh) Pelletier as the Company’s new Chief Geologist. Mr. Pelletier is a structural geologist and a specialist in metallogeny with over 20 years of exploration experience primarily focused on the formation of gold deposits and porphyry copper-gold systems. He holds an M.Sc. degree in geology (UQAM – Montreal), a BSc in management and is a Fellow of the SEG as a Professional Geologist (OGQ). Mr. Pelletier has significant experience exploring Canada’s greenstone belts, including the Abitibi, Timmins, Red Lake, Beardmore and Rankin Inlet. He will work closely with the Company’s geological team, highly experienced Technical Committee and the JV to support the next phase of drill targets across the Company’s project portfolio.
The Company also announces that Joness Lang and Fred Speidel have left the Company to pursue other opportunities. The Company wishes both Mr. Lang and Mr. Speidel every success in their future endeavors.
Option Issuance
The Company has approved the grant to an employee and officer of stock options (“Options”) to purchase an aggregate of 400,000 common shares of the Company at an exercise price of $0.17 per common share. The Options have a 5-year term and vest 1/3 immediately, 1/3 in 12 months and 1/3 in 24 months from the date of grant until fully vested.
Qualified Person
The scientific and technical data contained in this press release was reviewed and prepared under the supervision of Jocelyn Pelletier, M.Sc., P.geo., Chief Geologist of Maple Gold. Mr. Pelletier has verified the data related to the exploration information disclosed in this press release through his direct participation in the work performed. Mr. Pelletier is a Qualified Person under National Instrument 43-101 Standards of Disclosure for Mineral Projects.
Quality Assurance (QA) and Quality Control (QC)
The Company implements strict Quality Assurance (“QA”) and Quality Control (“QC”) protocols at Douay and Telbel covering the planning and placing of drill holes in the field; drilling and retrieving the NQ-sized drill core; drill hole surveying; core transport; core logging by qualified personnel; sampling and bagging of core for analysis; transport of core from site to the Val d’Or, Québec ALS laboratory; sample preparation for assaying; and analysis, recording and final statistical vetting of results. Check assays for gold will be done on a sample subset at AGAT laboratory in Val d’Or. For a complete description of protocols, please visit the Company’s QA/QC webpage at www.maplegoldmines.com.
About Maple Gold
Maple Gold Mines Ltd. is a Canadian advanced exploration company in a 50/50 joint venture with Agnico Eagle Mines Limited to jointly advance the district-scale Douay and Joutel gold projects located in Québec’s prolific Abitibi Greenstone Gold Belt. The projects benefit from exceptional infrastructure access and boast ~400 km2 of highly prospective ground including an established gold resource at Douay (SLR 2022) that holds significant expansion potential as well as the past-producing Eagle, Telbel and Eagle West mines at Joutel. In addition, the Company holds an exclusive option to acquire 100% of the Eagle Mine Property.
The district-scale property package also hosts a significant number of regional exploration targets along a 55 km strike length of the Casa Berardi Deformation Zone that have yet to be tested through drilling, making the project ripe for new gold and polymetallic discoveries. The Company is well capitalized and is currently focused on carrying out exploration and drill programs to grow resources and make new discoveries to establish an exciting new gold district in the heart of the Abitibi. For more information, please visit www.maplegoldmines.com.
ON BEHALF OF MAPLE GOLD MINES LTD.
“Matthew Hornor”
B. Matthew Hornor, President & CEO
For Further Information Please Contact:
Mr. Matthew Hornor President, CEO & Director Cell: 778.955.6133 Email: [email protected]
NEITHER THE TSX VENTURE EXCHANGE NOR ITS REGULATION SERVICES PROVIDER (AS THAT TERM IS DEFINED IN THE POLICIES OF THE TSX VENTURE EXCHANGE) ACCEPTS RESPONSIBILITY FOR THE ADEQUACY OR ACCURACY OF THIS PRESS RELEASE.
Forward Looking Statements:
This press release contains “forward-looking information” and “forward-looking statements” (collectively referred to as “forward-looking statements”) within the meaning of applicable Canadian securities legislation in Canada, including statements about exploration work and results from current and future work programs. Forward-looking statements are based on assumptions, uncertainties and management’s best estimate of future events. Actual events or results could differ materially from the Company’s expectations and projections. Investors are cautioned that forward-looking statements involve risks and uncertainties. Accordingly, readers should not place undue reliance on forward-looking statements. For a more detailed discussion of such risks and other factors that could cause actual results to differ materially from those expressed or implied by such forward-looking statements, refer to Maple Gold Mines Ltd.’s filings with Canadian securities regulators available on www.sedar.com or the Company’s website at www.maplegoldmines.com. The Company does not intend, and expressly disclaims any intention or obligation to, update or revise any forward-looking statements whether as a result of new information, future events or otherwise, except as required by law.
Quarterly Revenue Over $100 Million; Active Pipeline of Opportunities to Accelerate Growth in Fiscal 2024
ATLANTA, Aug. 02, 2023 (GLOBE NEWSWIRE) — DLH Holdings Corp. (NASDAQ: DLHC) (“DLH” or the “Company”), a leading provider of research and development, systems engineering and integration, and digital transformation solutions to federal agencies, today announced financial results for its fiscal third quarter ended June 30, 2023.
Highlights
Third quarter revenue was $102.2 million in fiscal 2023 versus $66.4 million in fiscal 2022; the prior-year period included an adjustment of $(5.1) million related to the short-term FEMA task orders in Alaska, without which revenue was $71.6 million.
Operating and net income for the third quarter were $7.1 million and $1.7 million, respectively, as compared to $7.1 million and $4.9 million in the prior-year period. Operating income for the fiscal 2022 quarter included $0.6 million from the FEMA task orders.
Earnings before interest, taxes, depreciation and amortization (“EBITDA”) was $11.4 million for the third quarter as compared to $9.0 million in fiscal 2022. The prior-year period included $0.6 million of EBITDA from the FEMA task orders.
Total debt at the end of the third quarter was $195.8 million compared to $204.2 million as of March 31, 2023.
Contract backlog was $817.8 million as of June 30, 2023 versus $940.6 million at the end of the fiscal second quarter.
Management Discussion “Third quarter performance once again highlighted the Company’s ability to produce strong underlying results,” said Zach Parker, DLH President and Chief Executive Officer. “We passed the $100 million revenue run rate, improved margins sequentially from the second quarter, used cash flow to continue paying down debt and successfully accomplished several milestones in the GRSi integration. The contract award environment continues to experience some headwinds, reflecting certain contract protests and extensive procurement cycles. The Company remains in excellent position to capitalize on current market dynamics and execute on new business development initiatives, resulting in an active bid environment. Our expanded health IT suite of solutions — leveraging unique applications and our highly-credentialed staff — provides us access to penetrate new programs within the key government agencies we serve. At the same time, with our ability to generate healthy cash from operations, we remain on track to de-lever the balance sheet in the coming quarters, which we expect will result in increased returns to our shareholders.
“In addition, we recently announced that DLH had been awarded a contract to expand our role at the National Heart, Lung and Blood Institute within the National Institutes of Health. The multiple-award contract has a total ceiling value of up to $85 million over five years, and we’ll be responsible for driving key digital transformation goals for the agency. Overall, we continue to see numerous opportunities to accelerate growth going forward, leveraging our expanded set of technology solutions, and are well prepared for further improved performance.”
Results for the Three Months Ended June 30, 2023 Revenue for the third quarter of fiscal 2023 was $102.2 million versus $66.4 million in fiscal 2022, with the prior-year period including an adjustment of $(5.1) million related to the Company’s short-term FEMA contracts in Alaska. Comparing this quarter’s revenue performance to the same period in the prior fiscal year, excluding the impact from the FEMA contracts, revenue increased $30.6 million, including contributions of $34.4 million from GRSi.
Income from operations was $7.1 million for the quarter versus $7.1 million in the prior-year period, which included $0.6 million from the FEMA task orders. Comparing this quarter’s operating income performance to the same period in the prior fiscal year, excluding the impact from the FEMA contracts, operating income increased $0.6 million. As a percentage of revenue, the Company reported an operating margin of 7.0% in the fiscal 2023 third quarter versus 10.7% in fiscal 2022, with the year-over-year decline primarily due to higher non-cash amortization expense as a result of the GRSi acquisition.
Interest expense was $4.9 million in the fiscal third quarter of 2023 versus $0.5 million in the prior-year period, reflecting higher debt outstanding due to the acquisition of GRSi and increased interest rates. Income before income taxes was $2.2 million this year versus $6.6 million in fiscal 2022, representing 2.1% and 9.9% of revenue, respectively, for each period.
For the three months ended June 30, 2023 and 2022, respectively, DLH recorded a $0.5 million and $1.7 million of income tax expense. The Company reported net income of approximately $1.7 million, or $0.12 per diluted share, for the third quarter of fiscal 2023 versus $4.9 million or $0.34 per diluted share, for the third quarter of fiscal 2022. As a percentage of revenue, net income was 1.7% for the third quarter of fiscal 2023 versus 7.3% for the prior-year period.
On a non-GAAP basis, EBITDA for the three months ended June 30, 2023 was approximately $11.4 million versus $9.0 million in the prior-year period, or 11.1% and 13.5% of revenue, respectively. Adjusted EBITDA1 was $11.4 million versus $8.4 million for the prior-year period, or 11.1% and 11.7% of adjusted revenue, respectively.
Key Financial Indicators For fiscal 2023, DLH has produced $15.0 million in operating cash. As of June 30, 2023, the Company had cash of $0.5 million and debt outstanding under its credit facilities of $195.8 million versus cash of $1.1 million and debt outstanding of $22.0 million as of September 30, 2022. The Company is on pace to reduce its total debt balance to between $185.0 million and $187.0 million by the end of this fiscal year.
At June 30, 2023, total backlog was approximately $817.8 million, including funded backlog of approximately $147.3 million and unfunded backlog of $670.5 million.
Conference Call and Webcast Details DLH management will discuss third quarter results and provide a general business update, including current competitive conditions and strategies, during a conference call beginning at 10:00 AM Eastern Time tomorrow, August 3, 2023. Interested parties may listen to the conference call by dialing 888-347-5290 or 412-317-5256. Presentation materials will also be posted on the Investor Relations section of the DLH website prior to the commencement of the conference call.
A digital recording of the conference call will be available for replay two hours after the completion of the call and can be accessed on the DLH Investor Relations website or by dialing 877-344-7529 and entering the conference ID 5343381.
About DLH DLH (NASDAQ:DLHC) enhances public health and national security readiness missions through science, technology, cyber, and engineering solutions and services. Our experts solve some of the most complex and critical missions faced by federal customers, leveraging digital transformation, artificial intelligence, advanced analytics, cloud-based applications, telehealth systems, and more. With over 3,200 employees dedicated to the idea that “Your Mission is Our Passion,” DLH brings a unique combination of government sector experience, proven methodology, and unwavering commitment to innovative solutions to improve the lives of millions. For more information, visit www.DLHcorp.com.
Safe Harbor Statement under the Private Securities Litigation Reform Act of 1995: This press release may contain forward-looking statements within the meaning of the Private Securities Litigation Reform Act of 1995. These statements relate to future events or DLH`s future financial performance. Any statements that refer to expectations, projections or other characterizations of future events or circumstances or that are not statements of historical fact (including without limitation statements to the effect that the Company or its management “believes”, “expects”, “anticipates”, “plans”, “intends” and similar expressions) should be considered forward looking statements that involve risks and uncertainties which could cause actual events or DLH’s actual results to differ materially from those indicated by the forward-looking statements. Forward-looking statements in this release include, among others, statements regarding estimates of future revenues, operating income, earnings and cash flow. These statements reflect our belief and assumptions as to future events that may not prove to be accurate. Our actual results may differ materially from such forward-looking statements made in this release due to a variety of factors, including: the risk that we will not realize the anticipated benefits ofouracquisition of GRSi or any other acquisitions (including anticipated future financial performance and results); the diversion of management’s attention from normal daily operations of the business and the challenges of managing larger and more widespread operations resulting from our recent acquisition; the inability to retain employees and customers; contract awards in connection with re-competes for present business and/or competition for new business; our ability to manage our increased debt obligations; compliance with bank financial and other covenants; changes in client budgetary priorities; government contract procurement (such as bid and award protests, small business set asides, loss of work due to organizational conflicts of interest, etc.) and termination risks; the ability to successfully integrate the operations of GRSi or any future acquisitions; the impact of inflation and higher interest rates; and other risks described in our SEC filings. For a discussion of such risks and uncertainties which could cause actual results to differ from those contained in the forward-looking statements, see “Risk Factors” in the Company’s periodic reports filed with the SEC, including our Annual Report on Form 10-K for the fiscal year ended September 30, 2022, as well as subsequent reports filed thereafter. The forward-looking statements contained herein are not historical facts, but rather are based on current expectations, estimates, assumptions and projections about our industry and business.
Such forward-looking statements are made as of the date hereof and may become outdated over time. The Company does not assume any responsibility for updating forward-looking statements, except as may be required by law.
Non-GAAP Financial Measures The Company uses EBITDA and EBITDA Margin on Revenue as supplemental non-GAAP measures of performance. We define EBITDA as net income excluding (i) interest expense, (ii) provision for or benefit from income taxes and (iii) depreciation and amortization. EBITDA Margin on Revenue is EBITDA for the measurement period divided by revenue for the same period.
The Company is presenting additional non-GAAP measures regarding its financial performance for the three and nine months ended June 30, 2023. The measures presented are Adjusted Revenue, Adjusted Operating Income, Adjusted EBITDA, and Adjusted EBITDA Margin on Adjusted Revenue. In calculating these measures, we have added the corporate development costs associated with completing the GRSi acquisition to our results for fiscal year 2023 and we have removed the contribution from the FEMA task orders from the results for fiscal year 2022. These resulting measures present the quarterly financial performance compared to results delivered in the prior year period. Definitions of these additional non-GAAP measures are set forth below.
We have prepared these additional non-GAAP measures to eliminate the impact of items that we do not consider indicative of ongoing operating performance due to their inherent unusual or extraordinary nature. These non-GAAP measures of performance are used by management to conduct and evaluate its business during its review of operating results for the periods presented. Management and the Company’s Board utilize these non-GAAP measures to make decisions about the use of the Company’s resources, analyze performance between periods, develop internal projections and measure management performance. We believe that these non-GAAP measures are useful to investors in evaluating the Company’s ongoing operating and financial results and understanding how such results compare with the Company’s historical performance.
These supplemental performance measurements may vary from and may not be comparable to similarly titled measures by other companies in our industry. Adjusted Revenue, Adjusted Operating Income, EBITDA, Adjusted EBITDA, EBITDA Margin on Revenue, and Adjusted EBITDA Margin on Adjusted Revenue are not recognized measurements under accounting principles generally accepted in the United States, or GAAP, and when analyzing our performance investors should (i) evaluate each adjustment in our reconciliation to the nearest GAAP financial measures and (ii) use the aforementioned non-GAAP measures in addition to, and not as an alternative to, revenue, operating income, net income or diluted EPS, as measures of operating results, each as defined under GAAP. We have defined these non-GAAP measures as follows:
“Adjusted Revenue” represents revenue less the contribution to revenue from the short-term FEMA task orders
“Adjusted Operating Income” represents operating income plus the corporate development costs associated with completing the GRSi acquisition incurred in fiscal 2023 less the contribution from the FEMA task orders, which occurred in fiscal 2022.
“Adjusted EBITDA” represents net income before income taxes, interest, depreciation and amortization and the corporate costs associated with completing the acquisition, less the contribution from FEMA task orders. “Adjusted EBITDA Margin on Adjusted Revenue” is calculated as Adjusted EBITDA divided by Adjusted Revenue.
Below is a reconciliation of Adjusted Revenue, Adjusted Operating Income, EBITDA, Adjusted EBITDA, EBITDA Margin on Revenue and Adjusted EBITDA Margin on Adjusted Revenue reported for the three and six months ended June 30, 2023 and 2022 compared to the most directly comparable financial measure calculated and presented in accordance with GAAP (in thousands except for per share amounts):
(a): Represents revenue adjusted to exclude revenue from the short-term FEMA task orders during the three and nine months ended June 30, 2022.
(b): Represents corporate development costs we incurred to complete the GRSi transaction. These costs primarily include legal counsel, financial due diligence, customer market analysis and representation and warranty insurance premiums.
(c): Adjusted operating income represents the Company’s consolidated operating income, determined in accordance with GAAP, adjusted to add the corporate development costs associated with the GRSi acquisition for fiscal year 2023 and adjusted to exclude the operating income derived from the FEMA task orders. Operating income for the FEMA task orders is derived by subtracting contract costs of ($5.7) million from the revenue attributable to such task orders during the three months ended June 30, 2022 of ($5.1) million. Similarly, for the nine months ended June 30, 2022 operating income for the FEMA task orders is derived by subtracting from the revenue attributable to the tasks orders of $125.8 million the following amounts associated with such task orders: contract costs $112.1 million and general & administrative costs of $1.2 million.
_______________________________ 1 Adjusted Operating Income, EBITDA, Adjusted EBITDA, EBITDA Margin on Revenue, and Adjusted EBITDA Margin on Adjusted Revenue are non-GAAP financial measures. See “Non-GAAP Financial Measures” below for additional detail.
IRVING, Texas–(BUSINESS WIRE)– Salem Media Group, Inc. (NASDAQ: SALM) announced today that it plans to report its second quarter 2023 financial results after the market closes on August 8, 2023.
The company also plans to host a teleconference to discuss its results on August 8, 2023, at 4:00 PM Central Time. To access the teleconference, please dial (888) 770-7291, and then ask to be joined to the Salem Media Group Second Quarter 2023 call or listen to the webcast.
A replay of the teleconference will be available through August 22, 2023, and can be heard by dialing (800) 770-2030 – replay pin number 2413416, or on the investor relations portion of the company’s website, located at investor.salemmedia.com.
ABOUT SALEM MEDIA GROUP:
Salem Media Group is America’s leading multimedia company specializing in Christian and conservative content, with media properties comprising radio, digital media and book and newsletter publishing. Each day Salem serves a loyal and dedicated audience of listeners and readers numbering in the millions nationally. With its unique programming focus, Salem provides compelling content, fresh commentary and relevant information from some of the most respected figures across the Christian and conservative media landscape. Learn more about Salem Media Group, Inc. at www.salemmedia.com, Facebook and Twitter.
PRINCETON, N.J., Aug. 02, 2023 (GLOBE NEWSWIRE) — PDS Biotechnology Corporation (Nasdaq: PDSB), a clinical-stage immunotherapy company developing a growing pipeline of targeted cancer immunotherapies and infectious disease vaccines based on the Company’s proprietary T cell activating platforms, today announced that Dr. Frank Bedu-Addo, Chief Executive Officer, will participate in a fireside chat at the BTIG Virtual Biotechnology Conference 2023 being held August 7-8, 2023. Details for the event are as follows:
BTIG Virtual Biotechnology Conference 2023 Presentation Date: Tuesday, August 8, 2023 Event: Fireside chat Time: 11:30 AM EDT
For more information about the conference or to schedule one-on-one meetings, please contact your BTIG representative directly.
About PDS Biotechnology PDS Biotech is a clinical-stage immunotherapy company developing a growing pipeline of targeted cancer and infectious disease immunotherapies based on our proprietary Versamune®, Versamune® plus PDS0301, and Infectimune® T cell-activating platforms. We believe our targeted immunotherapies have the potential to overcome the limitations of current immunotherapy approaches through the activation of the right type, quantity and potency of T cells. To date, our lead Versamune® clinical candidate, PDS0101, has demonstrated the ability to reduce and shrink tumors and stabilize disease in combination with approved and investigational therapeutics in patients with a broad range of HPV16-associated cancers in multiple Phase 2 clinical trials and will be advancing into a Phase 3 clinical trial in combination with KEYTRUDA® for the treatment of recurrent/metastatic HPV16-positive head and neck cancer in 2023. Our Infectimune® based vaccines have also demonstrated the potential to induce not only robust and durable neutralizing antibody responses, but also powerful T cell responses, including long-lasting memory T cell responses in pre-clinical studies to date. To learn more, please visit www.pdsbiotech.com or follow us on Twitter at @PDSBiotech.
Strong quarterly revenues of $262 million, up 4.5% year-over-year EPS of $0.30, adjusted EBITDA of $20.8 million or 7.9% of revenue Continued strategy execution and operational excellence driving improved results
NEW ALBANY, Ohio, Aug. 01, 2023 (GLOBE NEWSWIRE) — CVG (NASDAQ: CVGI), a diversified industrial products and services company, today announced financial results for its second quarter ended June 30, 2023.
Second Quarter 2023Highlights(Compared with prior year, where comparisons are noted)
Revenues of $262.2 million, up 4.5% primarily driven by strong price realization.
Operating income of $15.9 million, up 156.0%; adjusted operating income of $16.7 million, up 106.2%. Improved operating income was driven primarily by improved pricing and cost management.
Net income of $10.1 million, or $0.30 per diluted share. Adjusted net income of $10.7 million, or $0.32 per diluted share.
Adjusted EBITDA of $20.8 million, up 67.7% with an adjusted EBITDA margin of 7.9%, tracking further towards the Company’s long-term profitability target.
Net new business wins year-to-date are $124 million. The majority of the new business awards continue to be in the Electrical Systems segment.
Our cost reduction program continues to deliver cost savings through process improvements, footprint changes and organizational streamlining.
Robert C. Griffin, Chairman of the Board and Interim President and Chief Executive Officer, said, “CVG delivered solid second quarter results and we continued to execute well on our long-term strategy. The team’s efforts to drive the Company’s strategic plan are delivering improved financial results, highlighted by strong improvements in revenue, operating income, adjusted EBITDA and free cash flow during the quarter. Additionally, I am pleased to report that our Electrical Systems plant expansions are on track and the Aldama, Mexico plant is open and ramping up production. We remain on track to deliver record revenues in 2023 and continue to expect our full year Adjusted EBITDA margins to show significant expansion versus last year, based on the current vehicle production outlook for the second half of the year. We also believe we continue to be on track to deliver our 2027 targets of $1.5 billion in revenue and 9% EBITDA margin.”
Mr. Griffin concluded, “I would like to thank our team of employees who helped us improve CVG this quarter and continue to execute our strategy of growing and diversifying our revenue, optimizing our cost structure through process automation and cost reduction, and increasing our margins to become a bigger, more profitable company.”
Andy Cheung, Chief Financial Officer, added, “The continued execution of our strategy is delivering improved financial results for CVG. Our focus on winning new business, improved price realization and cost reduction has allowed us to continue to improve our margins and profit. Additionally, we remain heavily focused on optimizing working capital, increasing cash flows, and paying down our debt.”
Consolidated Results
Second Quarter 2023 Results
Second quarter 2023 revenues were $262.2 million, compared to $250.8 million in the prior year period, an increase of 4.5%. The increase in revenues was primarily driven by increased pricing and volume from new Electrical Systems business, partially offset by lower volumes in the Industrial Automation segment. Foreign currency translation also favorably impacted second quarter 2023 revenues by $0.7 million, or 0.3%.
Operating income in the second quarter 2023 was $15.9 million compared to $6.2 million in the prior year period. The increase in operating income was attributable to higher margins, partially offset by higher SG&A. The second quarter 2023 adjusted operating income was $16.7 million, excluding special charges.
Interest associated with debt and other expenses was $2.8 million and $2.1 million for the second quarter 2023 and 2022, respectively.
Net income was $10.1 million, or $0.30 per diluted share, for the second quarter 2023 compared to net income of $2.5 million, or $0.08 per diluted share, in the prior year period.
At June 30, 2023, the Company had $9.0 million of outstanding borrowings on its U.S. revolving credit facility and $4.1 million outstanding on its China credit facility, $42.4 million of cash and $148.1 million of availability from the credit facilities, resulting in total liquidity of $190.5 million.
Second Quarter 2023 Segment Results
Vehicle Solutions Segment
Revenues were $152.7 million compared to $142.8 million for the prior year period, an increase of 7.0%, primarily resulting from increased pricing.
Operating income was $14.1 million, compared to $1.5 million in the prior year period, an increase of 836.7%, primarily attributable to price increases with customers and cost reduction initiatives. Adjusted operating income was $14.5 million.
Electrical Systems Segment
Revenues were $63.6 million compared to $47.3 million in the prior year period, an increase of 34.4%, primarily resulting from increased sales volume and pricing.
Operating income was $7.7 million compared to $5.9 million in the prior year period, an increase of 28.9%. The increase in operating income was primarily attributable to increased sales volume and pricing.
Aftermarket & Accessories Segment
Revenues were $36.8 million compared to $32.2 million in the prior year period, an increase 14.5%, primarily resulting from increased pricing.
Operating income was $5.5 million compared to $1.1 million in the prior year period, an increase of 388.2%. The increase in operating income was primarily attributable to increased pricing and cost reduction.
IndustrialAutomation Segment
Revenues were $9.0 million compared to $28.5 million in the prior year period, a decrease of 68.4%, primarily due to decreased customer demand which is expected to continue in the third quarter.
Operating loss was $2.1 million compared to operating income of $1.3 million in the prior year period. The decrease in operating income was primarily attributable to volume reduction and an inventory charge of $1.6 million. Adjusted operating loss was $1.7 million.
2023 Demand Outlook
According to ACT Research, 2023 North American Class 8 truck production levels are expected to be at 339,000 units and Class 5-7 production levels are expected to be at 258,000 units. Estimates from FTR for 2023 are 325,000 units, slightly lower than ACT Research for Class 8 truck builds. The 2022 actual Class 8 truck builds according to the ACT Research was 315,128 units.
The global commercial and automotive vehicle wire harness market is growing at approximately 4.5%. The global electric truck market expected to grow approximately 15% CAGR.
According to Interact Analysis, the Global Off-Highway vehicle market is expected to increase approximately 4% to 6.2 million units in 2023 from 5.9 million units in 2022. Beyond 2023, the Off-Highway vehicle market is expected to grow in the 4-5% range. We expect our legacy business growth rates to be in line with this outlook.
Industry forecasts are expecting at least 4% growth in 2023 for North American aftermarket truck parts. Compounded annual growth of at least 4% is forecasted for 2023-2027.
GAAP to Non-GAAP Reconciliation
A reconciliation of GAAP to non-GAAP financial measures referenced in this release is included as Appendix A to this release.
Conference Call
A conference call to discuss this press release is scheduled for Wednesday, August 2, 2023, at 10:00 a.m. ET. Management intends to reference the Q2 2023 Earnings Call Presentation during the conference call. To participate, dial (888) 259-6580 using conference code 34051647. International participants dial (416) 764-8624 using conference code 34051647.
This call is being webcast and can be accessed through the “Investors” section of CVG’s website at ir.cvgrp.com, where it will be archived for one year.
A telephonic replay of the conference call will be available for a period of two weeks following the call. To access the replay, dial (877) 674-7070 using access code 051647 and international callers can dial (416) 764-8692 using access code 051647.
Company Contact Andy Cheung Chief Financial Officer CVG [email protected]
Investor Relations Contact Ross Collins or Stephen Poe Alpha IR Group [email protected]
About CVG
At CVG, we deliver real solutions to complex design, engineering and manufacturing problems while creating positive change for our customers, industries and communities we serve. Information about the Company and its products is available on the internet at www.cvgrp.com.
Forward-Looking Statements
This press release contains forward-looking statements that are subject to risks and uncertainties. These statements often include words such as “believe”, “anticipate”, “plan”, “expect”, “intend”, “will”, “should”, “could”, “would”, “project”, “continue”, “likely”, and similar expressions. In particular, this press release may contain forward-looking statements about the Company’s expectations for future periods with respect to its plans to improve financial results, the future of the Company’s end markets, changes in the Class 8 and Class 5-7 North America truck build rates, performance of the global construction equipment business, the Company’s prospects in the wire harness, warehouse automation and electric vehicle markets, the Company’s initiatives to address customer needs, organic growth, the Company’s strategic plans and plans to focus on certain segments, competition faced by the Company, volatility in and disruption to the global economic environment and the Company’s financial position or other financial information. These statements are based on certain assumptions that the Company has made in light of its experience as well as its perspective on historical trends, current conditions, expected future developments and other factors it believes are appropriate under the circumstances. Actual results may differ materially from the anticipated results because of certain risks and uncertainties, including those included in the Company’s filings with the SEC. There can be no assurance that statements made in this press release relating to future events will be achieved. The Company undertakes no obligation to update or revise forward-looking statements to reflect changed assumptions, the occurrence of unanticipated events or changes to future operating results over time. All subsequent written and oral forward-looking statements attributable to the Company or persons acting on behalf of the Company are expressly qualified in their entirety by such cautionary statements.
Use of Non-GAAP Measures
This earnings release contains financial measures that are not calculated in accordance with U.S. generally accepted accounting principles (“GAAP”). In general, the non-GAAP measures exclude items that (i) management believes reflect the Company’s multi-year corporate activities; or (ii) relate to activities or actions that may have occurred over multiple or in prior periods without predictable trends. Management uses these non-GAAP financial measures internally to evaluate the Company’s performance, engage in financial and operational planning and to determine incentive compensation.
Management provides these non-GAAP financial measures to investors as supplemental metrics to assist readers in assessing the effects of items and events on the Company’s financial and operating results and in comparing the Company’s performance to that of its competitors and to comparable reporting periods. The non-GAAP financial measures used by the Company may be calculated differently from, and therefore may not be comparable to, similarly titled measures used by other companies.
The non-GAAP financial measures disclosed by the Company should not be considered a substitute for, or superior to, financial measures calculated in accordance with GAAP. The financial results calculated in accordance with GAAP and reconciliations to those financial statements set forth above should be carefully evaluated.
CHATHAM, N.J., Aug. 01, 2023 (GLOBE NEWSWIRE) — Tonix Pharmaceuticals Holding Corp. (Nasdaq: TNXP) (“Tonix” or the “Company”), a biopharmaceutical company, today announced the closing of its public offering of 7,000,000 shares of its common stock (or common stock equivalents in lieu thereof) and warrants to purchase up to an aggregate of 7,000,000 shares of common stock in a public offering at a combined offering price of $1.00 per share (or common stock equivalents in lieu thereof) and accompanying warrant. The warrants have an exercise price of $1.00 per share, became exercisable upon issuance, and will expire five years following the issuance date.
The gross proceeds of the offering were $7 million before deducting placement agent fees and other offering expenses payable by the Company. The Company intends to use the net proceeds from the offering for working capital and general corporate purposes, the build out of the Company’s manufacturing and research and development facilities, and the acquisition or licensing of approved products and products in development.
A.G.P./Alliance Global Partners acted as lead placement agent for the offering.
Brookline Capital Markets, a division of Arcadia Securities, LLC, acted as co-placement agent for the offering.
This offering was made pursuant to an effective shelf registration statement on Form S-3 (File No. 333-254975) previously filed with the U.S. Securities and Exchange Commission (the “SEC”). The offering was made only by means of a prospectus supplement and accompanying base prospectus. A final prospectus supplement and accompanying prospectus describing the terms of the offering have been filed with the SEC and are available on the SEC’s website located at http://www.sec.gov. Electronic copies of the final prospectus supplement may be obtained from A.G.P./Alliance Global Partners, 590 Madison Avenue, 28th Floor, New York, NY 10022, or by telephone at (212) 624-2060, or by email at [email protected].
This press release shall not constitute an offer to sell or the solicitation of an offer to buy nor shall there be any sale of these securities in any state or jurisdiction in which such offer, solicitation or sale would be unlawful prior to registration or qualification under the securities laws of any such state or jurisdiction.
Tonix Pharmaceuticals Holding Corp.*
Tonix is a biopharmaceutical company focused on commercializing, developing, discovering and licensing therapeutics to treat and prevent human disease and alleviate suffering. Tonix markets Zembrace® SymTouch® (sumatriptan injection) 3 mg and Tosymra® (sumatriptan nasal spray) 10 mg. Zembrace SymTouch and Tosymra are each indicated for the treatment of acute migraine with or without aura in adults. Tonix’s development portfolio is composed of central nervous system (CNS), rare disease, immunology and infectious disease product candidates. Tonix’s CNS development portfolio includes both small molecules and biologics to treat pain, neurologic, psychiatric and addiction conditions. Tonix’s lead CNS candidate, TNX-102 SL (cyclobenzaprine HCl sublingual tablet), is in mid-Phase 3 development for the management of fibromyalgia, having completed enrollment in a potentially registration-enabling study, and with topline data expected in the fourth quarter of 2023. TNX-102 SL is also being developed to treat Long COVID, a chronic post-acute COVID-19 condition. Enrollment in a Phase 2 study has been completed, and topline results are expected in the third quarter of 2023. TNX-601 ER (tianeptine hemioxalate extended-release tablets), a once-daily formulation being developed as a treatment for major depressive disorder (MDD). Enrollment is now complete in the UPLIFT trial of TNX-601 ER in MDD and topline results are expected in the fourth quarter of 2023. TNX-4300 (estianeptine) is a small molecule oral therapeutic in preclinical development to treat MDD, Alzheimer’s disease and Parkinson’s disease. TNX-1900 (intranasal potentiated oxytocin), in development for chronic migraine, has completed enrollment with topline data expected in the fourth quarter of 2023. TNX-1300 (cocaine esterase) is a biologic designed to treat cocaine intoxication and has been granted Breakthrough Therapy designation by the FDA. A Phase 2 study of TNX-1300 is expected to be initiated in the third quarter of 2023. Tonix’s rare disease development portfolio includes TNX-2900 (intranasal potentiated oxytocin) for the treatment of Prader-Willi syndrome. TNX-2900 has been granted Orphan Drug designation by the FDA. Tonix’s immunology development portfolio includes biologics to address organ transplant rejection, autoimmunity and cancer, including TNX-1500, which is a humanized monoclonal antibody targeting CD40-ligand (CD40L or CD154) being developed for the prevention of allograft rejection and for the treatment of autoimmune diseases. A Phase 1 study of TNX-1500 is expected to be initiated in the third quarter of 2023. Tonix’s infectious disease pipeline includes TNX-801, a vaccine in development to prevent smallpox and mpox. TNX-801 also serves as the live virus vaccine platform or recombinant pox vaccine platform for other infectious diseases. The infectious disease development portfolio also includes TNX-3900 and TNX-4000, classes of broad-spectrum small molecule oral antivirals.
* Tonix’s product development candidates are investigational new drugs or biologics and have not been approved for any indication.
Tonix Medicines has contracted to acquire the Zembrace SymTouch and Tosymra registered trademarks. Intravail is a registered trademark of Aegis Therapeutics, LLC, a wholly owned subsidiary of Neurelis, Inc.
Forward Looking Statements
Certain statements in this press release are forward-looking within the meaning of the Private Securities Litigation Reform Act of 1995, including the intended use of proceeds from the public offering and other statements that are predictive in nature. These statements may be identified by the use of forward-looking words such as “anticipate,” “believe,” “forecast,” “estimate,” “expect,” and “intend,” among others. These forward-looking statements are based on Tonix’s current expectations and actual results could differ materially. There are a number of factors that could cause actual events to differ materially from those indicated by such forward-looking statements. These factors include, but are not limited to, risks related to the failure to obtain FDA clearances or approvals and noncompliance with FDA regulations; risks related to the failure to successfully market any of our products; risks related to the timing and progress of clinical development of our product candidates; our need for additional financing; uncertainties of patent protection and litigation; uncertainties of government or third party payor reimbursement; limited research and development efforts and dependence upon third parties; and substantial competition. As with any pharmaceutical under development, there are significant risks in the development, regulatory approval and commercialization of new products. Tonix does not undertake an obligation to update or revise any forward-looking statement. Investors should read the risk factors set forth in the Annual Report on Form 10-K for the year ended December 31, 2022, as filed with the Securities and Exchange Commission (the “SEC”) on March 13, 2023, and periodic reports filed with the SEC on or after the date thereof. All of Tonix’s forward-looking statements are expressly qualified by all such risk factors and other cautionary statements. The information set forth herein speaks only as of the date thereof.
VANCOUVER, BC, Aug. 1, 2023 /CNW/ – Defense Metals Corp. (“Defense Metals” or the “Company“; (TSXV: DEFN) (OTCQB: DFMTF) (FSE: 35D) is pleased to confirm that it has engaged Hatch Ltd. (“Hatch“) and SRK Consulting (Canada) Inc. (“SRK“) as principal consultants for the completion of a preliminary feasibility study (“PFS“) regarding its Wicheeda Rare Earth Element (REE) Project located near Prince George, Canada.
SRK is one of four key consultants chosen by Defense Metals to facilitate the PFS and will take the lead role as overall coordinator of the National Instrument 43-101 PFS report, as well as handling the mining and tailings scope of work with support from APEX Geoscience Ltd., Defense Metals’ exploration, geology, and resource consultants. Hatch will focus on rare earth element (“REE“) concentrating and hydrometallurgical processes and plant facilities, and both capital and operating costs. One-eighty Consulting Group Inc. (“One-eighty“) will be responsible for the environmental studies, permitting, and social or community impact scope.
Hatch and SRK, as directed by Defense Metals, have agreed to a partition of responsibilities that allows each group to focus on their strengths.
SRK is uniquely positioned to advance the Wicheeda Project given their prior involvement in both an extensive scenario analysis evaluation conducted in 2021 and the preliminary economic assessment (“PEA“) completed by them in 2021 and published in 2022. SRK will build upon the knowledge gained in these studies and improve upon the analyses completed then, to create an optimal development plan for the Wicheeda Project. SRK will focus on resource estimation, geotechnical engineering, mining engineering, tailings management, and economic analysis. Added scope for SRK in the PFS includes the project lead, risk assessment, surface water management, contact water treatment and environmental geochemistry.
Hatch will be responsible for the process design including the concentrator and hydrometallurgical plants as well as the infrastructure for mining, tailings, and other processing areas.
SRK and Hatch both have extensive experience and knowledge of working in the REE sector.
About Hatch Ltd.
Hatch is an employee-owned, multidisciplinary professional services firm that delivers a comprehensive array of technical and strategic services, including consulting, information technology, engineering, process development, and project and construction management to the Mining, Metallurgical, Energy, and Infrastructure sectors. Hatch has served clients for over six decades with corporate roots extending over 100 years and has project experience in more than 150 countries around the world. Find out more on www.hatch.com.
About SRK Consulting (Canada) Inc.
SRK Consulting is an independent, international group providing specialised consultancy services.
Among SRK’s clients are many of the world’s mining companies, exploration companies, financial institutions, EPCM and construction firms and government bodies. Formed in Johannesburg in 1974, the SRK Group now employs more than 1600 staff internationally in over 45 permanent offices in 20 countries on 6 continents. A broad range of internationally recognised associate consultants complements the core staff. SRK provides specialist consulting services in the areas of geology, resources and exploration, geotechnical services, mine waste management, environmental, water management and mining and project evaluation.
Qualified Person
The scientific and technical information contained in this news release as it relates to the Wicheeda REE Project has been reviewed and approved by Kristopher J. Raffle, P.Geo. (B.C.), Principal and Consultant of APEX Geoscience Ltd. of Edmonton, Alberta, who is a director of Defense Metals and a “Qualified Person” as defined in NI 43-101.
About the Wicheeda REE Property
Defense Metals 100% owned, 6,759-hectare (~16,702-acre) Wicheeda Project is located approximately 80 km northeast of the city of Prince George, British Columbia; population 77,000. The Wicheeda REE Project is readily accessible by all-weather gravel roads and is near infrastructure, including hydro power transmission lines and gas pipelines. The nearby Canadian National Railway and major highways allow easy access to the port facilities at Prince Rupert, the closest major North American port to Asia.
The 2021 Wicheeda REE Project Preliminary Economic Assessment technical report outlined a robust after-tax net present value (NPV@8%) of $517 million and an 18% IRR1. This PEA contemplated an open pit mining operation with a 1.75:1 (waste:mill feed) strip ratio providing a 1.8 Mtpa (“million tonnes per year”) mill throughput producing an average of 25,423 tonnes REO annually over a 16 year mine life. A Phase 1 initial pit strip ratio of 0.63:1 (waste:mill feed) would yield rapid access to higher grade surface mineralization in year 1 and payback of $440 million initial capital within 5 years.
__________________________________________ 1 Independent Preliminary Economic Assessment for the Wicheeda Rare Earth Element Project, British Columbia, Canada, dated January 6, 2022, with an effective date of November 7, 2021, and prepared by SRK Consulting (Canada) Inc. is filed under Defense Metals Corp.’s Issuer Profile on SEDAR (www.sedarplus.ca).
About Defense Metals Corp.
Defense Metals Corp. is a mineral exploration and development company focused on the development of its 100% owned Wicheeda Rare Earth Element Deposit located near Prince George, British Columbia, Canada. Defense Metals Corp. trades on the TSX Venture Exchange under the symbol “DEFN”, in the United States, trading symbol “DFMTF” on the OTCQB and in Germany on the Frankfurt Exchange under “35D”.
Defense Metals is a proud member of Discovery Group. For more information please visit: http://www.discoverygroup.ca/
Neither the TSX Venture Exchange nor its Regulation Services Provider (as that term is defined in the policies of the TSX Venture Exchange) accepts responsibility for the adequacy or accuracy of this news release.
Cautionary Statement Regarding “Forward-Looking” Information
This news release contains “forward‐looking information or statements” within the meaning of applicable securities laws, which may include, without limitation, statements relating to advancing the Wicheeda REE Project, the expected completion of the PFS, the technical, financial and business prospects of the Company, its project and other matters. All statements in this news release, other than statements of historical facts, that address events or developments that the Company expects to occur, are forward-looking statements. Although the Company believes the expectations expressed in such forward-looking statements are based on reasonable assumptions, such statements are not guarantees of future performance and actual results may differ materially from those in the forward-looking statements. Such statements and information are based on numerous assumptions regarding present and future business strategies and the environment in which the Company will operate in the future, including the price of rare earth elements, the anticipated costs and expenditures, accuracy of assay results, performance of available laboratory and other related services, future operating costs, interpretation of geological and metallurgical data, the ability to achieve its goals, that general business and economic conditions will not change in a material adverse manner, that financing will be available if and when needed and on reasonable terms. Such forward-looking information reflects the Company’s views with respect to future events and is subject to risks, uncertainties and assumptions, including the risks and uncertainties relating to the interpretation of exploration and metallurgical results, risks related to the inherent uncertainty of exploration, metallurgy and development and cost estimates, the potential for unexpected costs and expenses and those other risks filed under the Company’s profile on SEDAR at www.sedarplus.ca. While such estimates and assumptions are considered reasonable by the management of the Company, they are inherently subject to significant business, economic, competitive and regulatory uncertainties and risks. Factors that could cause actual results to differ materially from those in forward looking statements include, but are not limited to, continued availability of capital and financing and general economic, market or business conditions, adverse weather and climate conditions, failure to maintain or obtain all necessary government permits, approvals and authorizations, failure to maintain community acceptance (including First Nations), risks relating to unanticipated operational difficulties (including failure of equipment or processes to operate in accordance with specifications or expectations, cost escalation, unavailability of personnel, materials and equipment, government action or delays in the receipt of government approvals, industrial disturbances or other job action, and unanticipated events related to health, safety and environmental matters), risks relating to inaccurate geological, metallurgical and engineering assumptions, decrease in the price of rare earth elements, the impact of Covid-19 or other viruses and diseases on the Company’s ability to operate, an inability to predict and counteract the effects of COVID-19 and other viruses and diseases on the business of the Company, the price of commodities, capital market conditions, restriction on labour and international travel and supply chains, loss of key employees, consultants, or directors, increase in costs, delayed results, litigation, and failure of counterparties to perform their contractual obligations. The Company does not undertake to update forward‐looking statements or forward‐looking information, except as required by law.


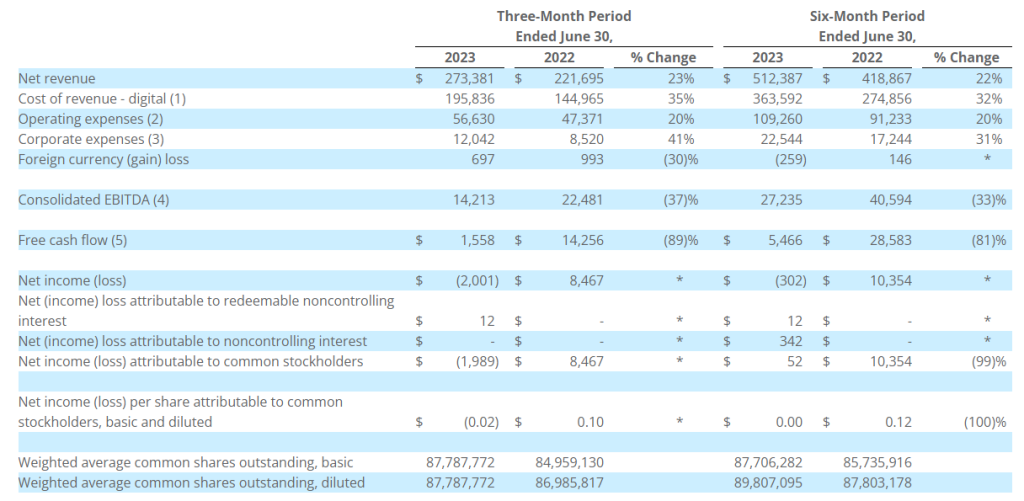
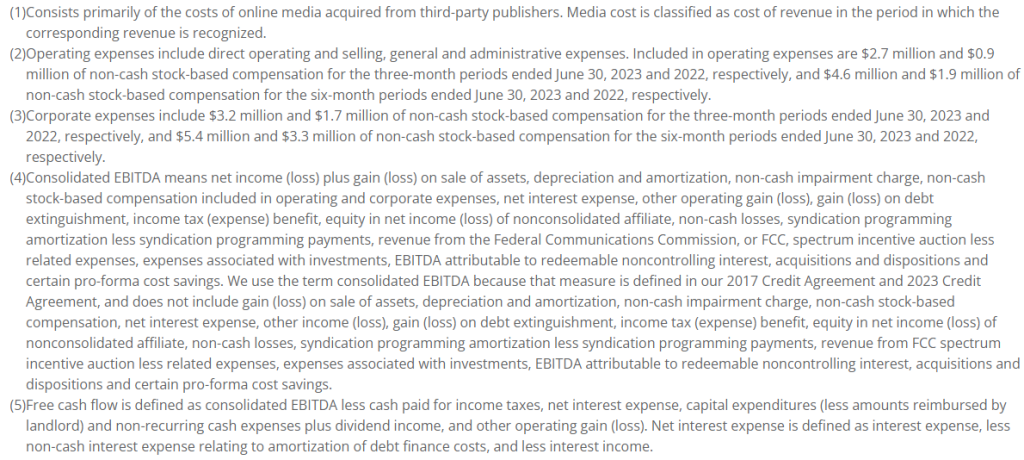
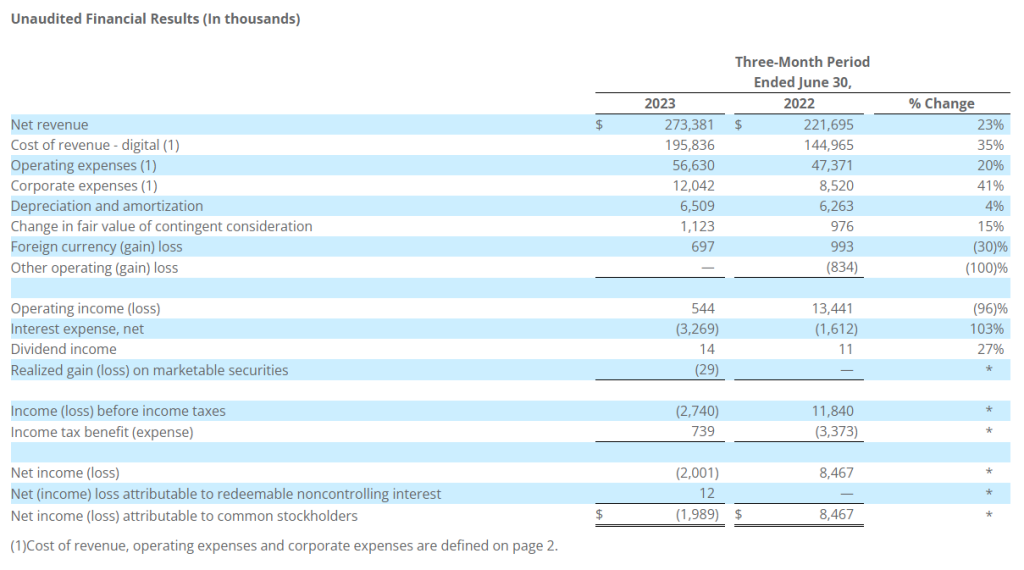
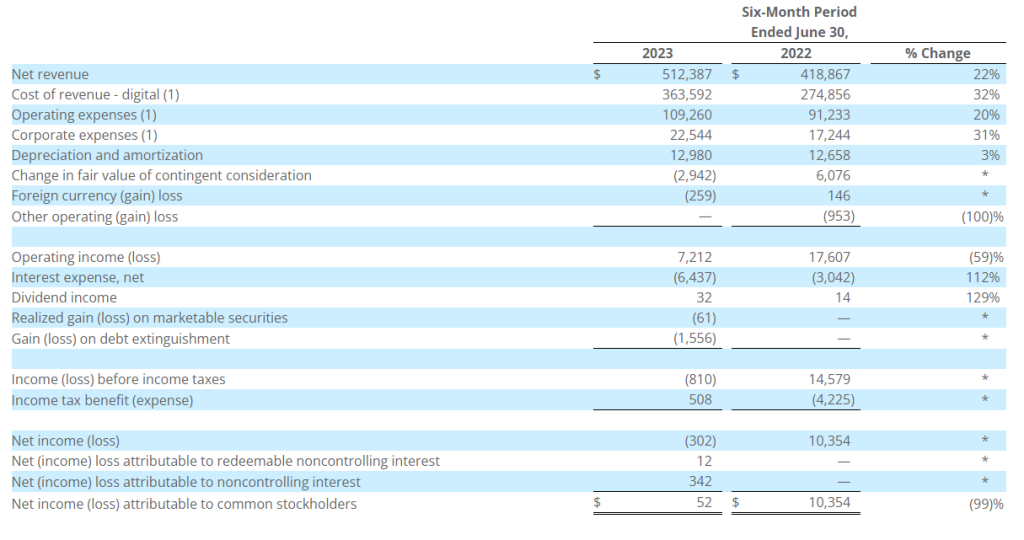
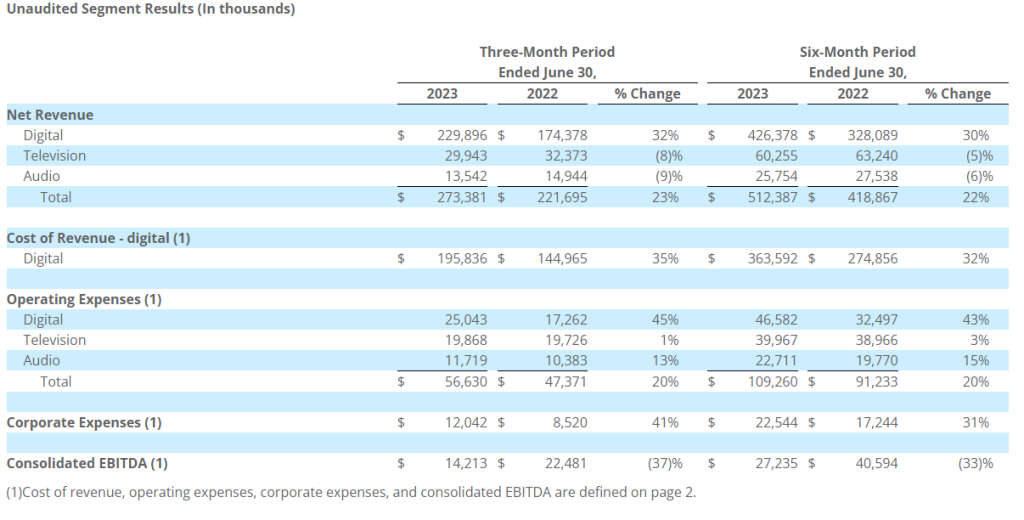
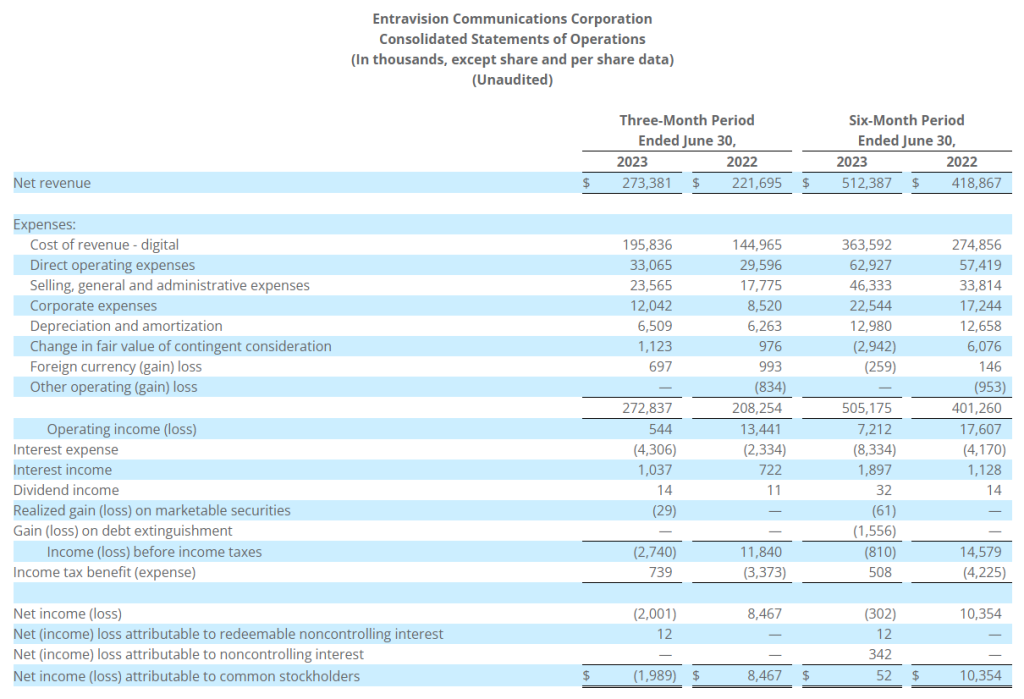
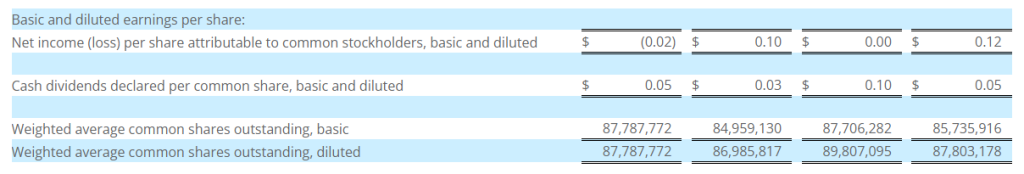
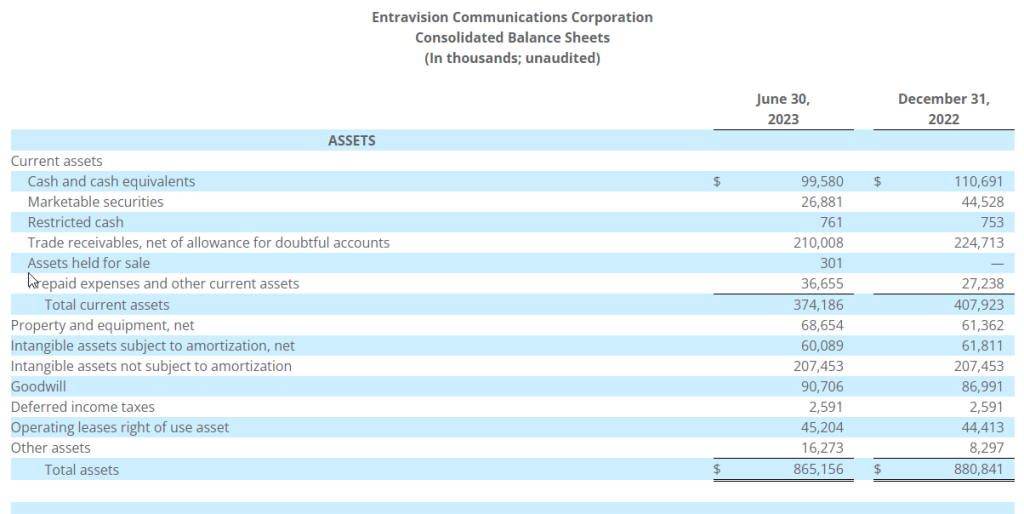
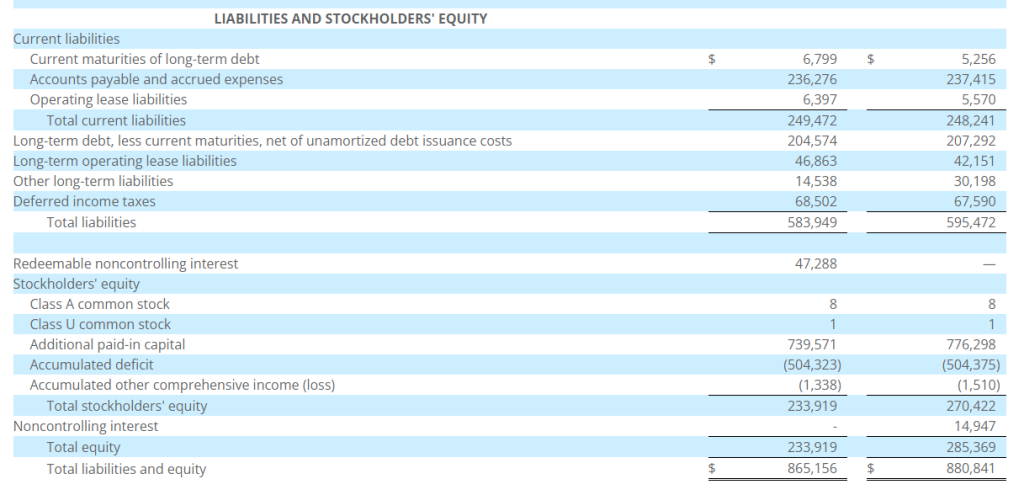
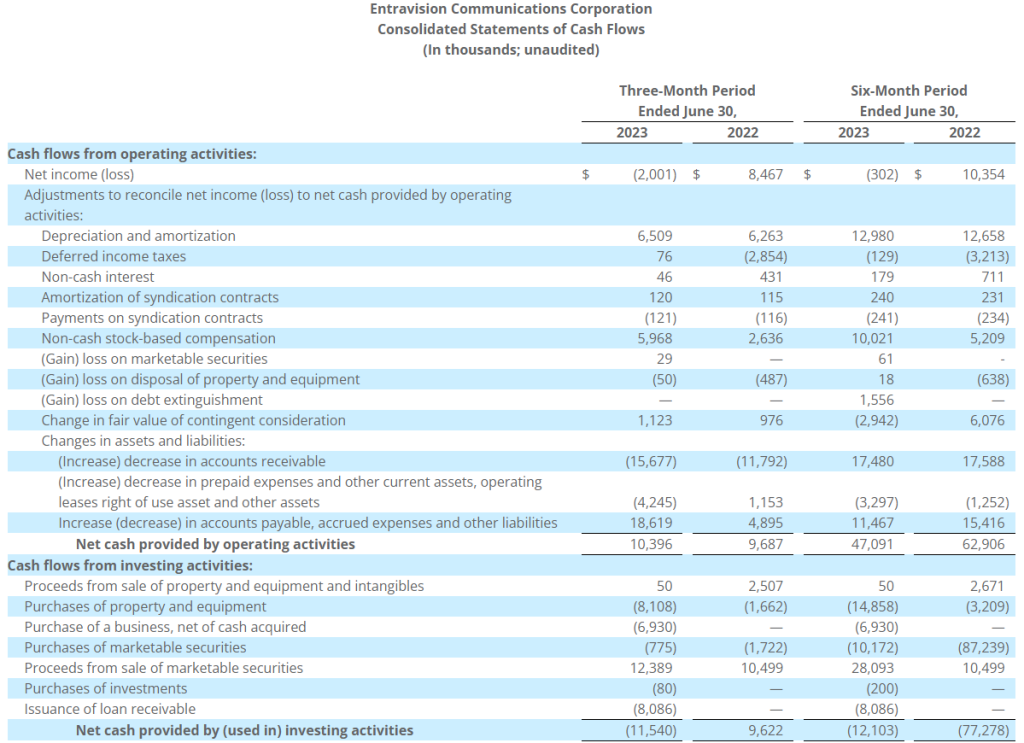
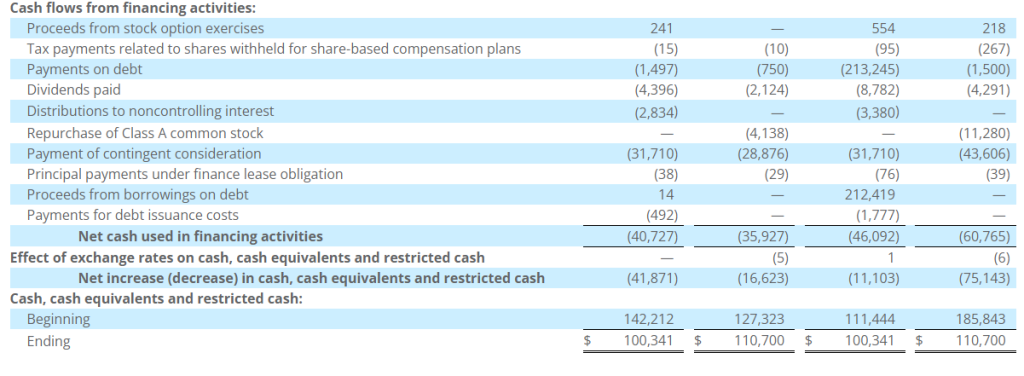
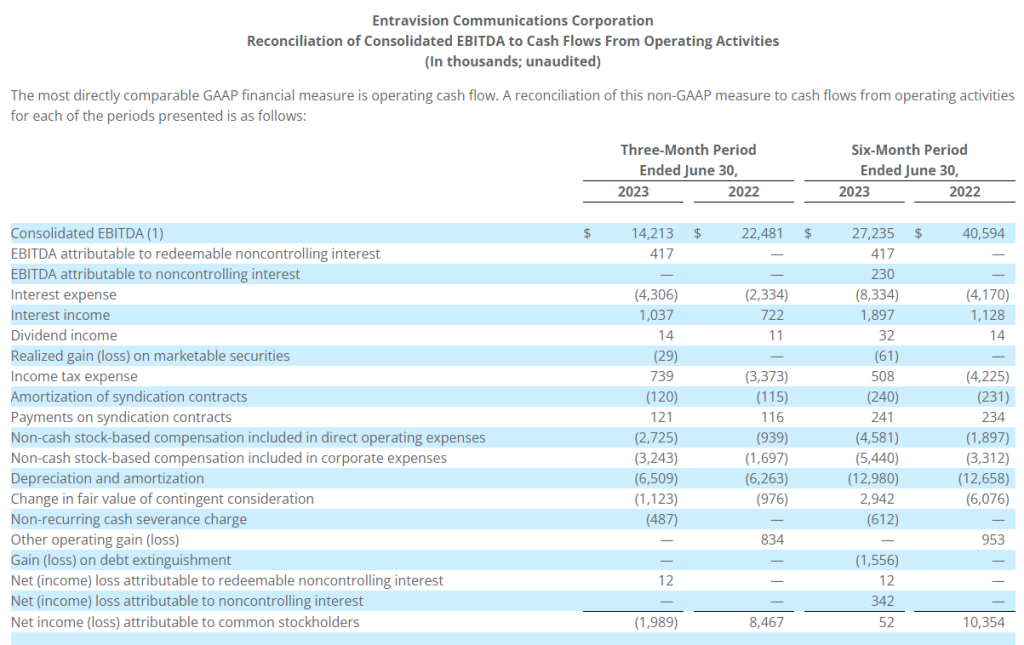
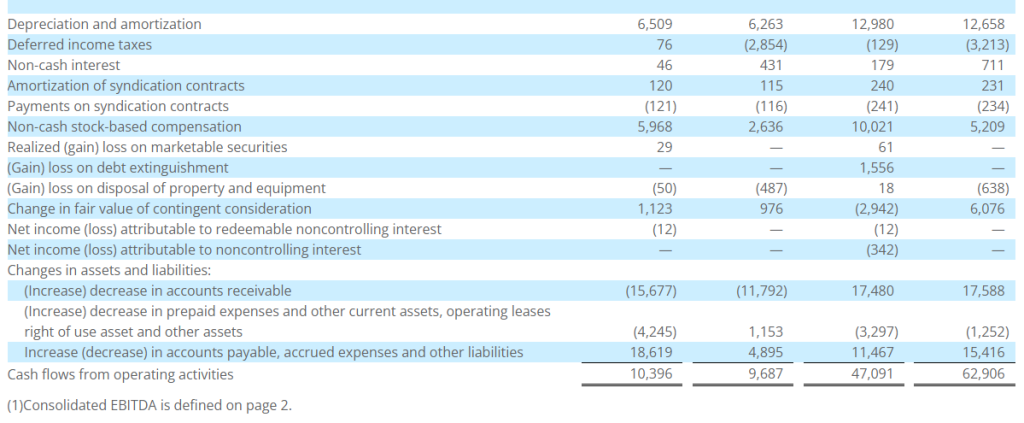
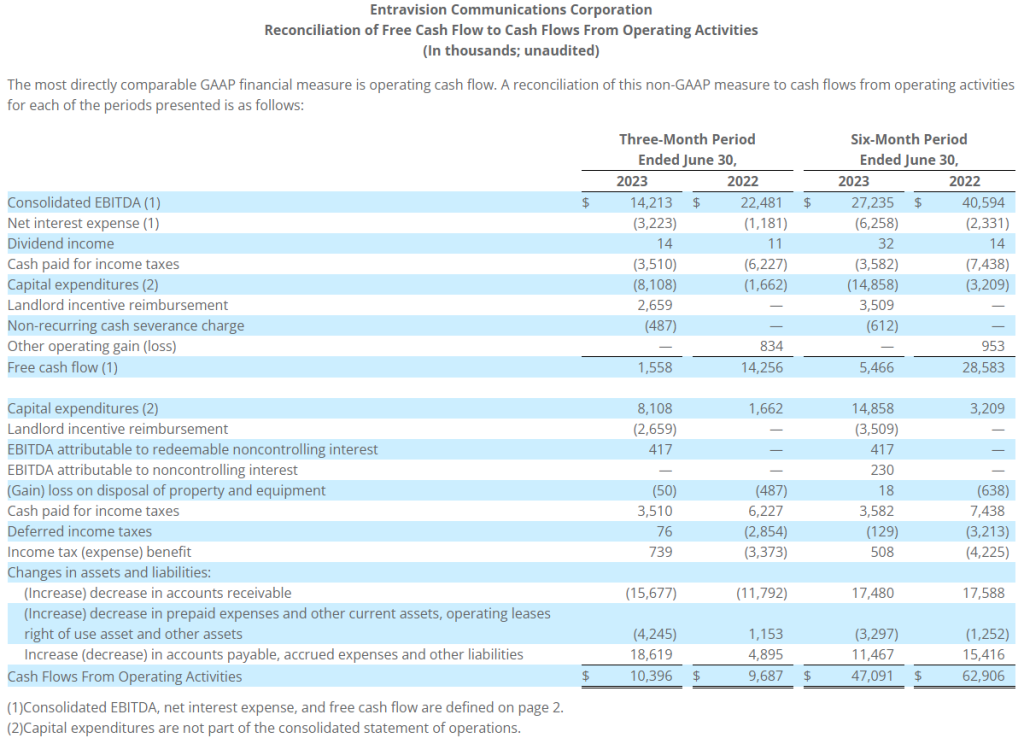
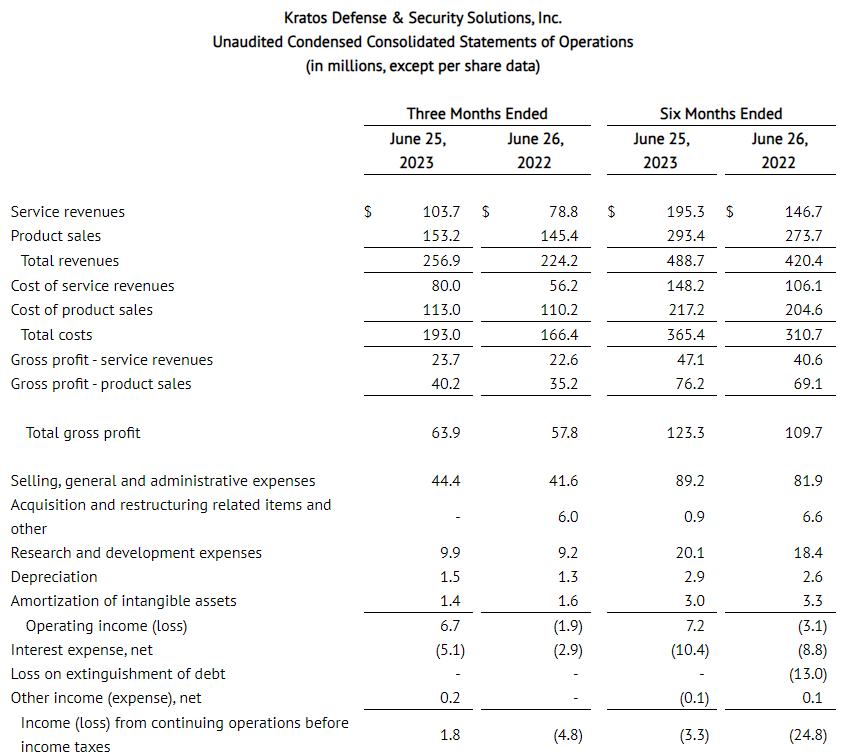
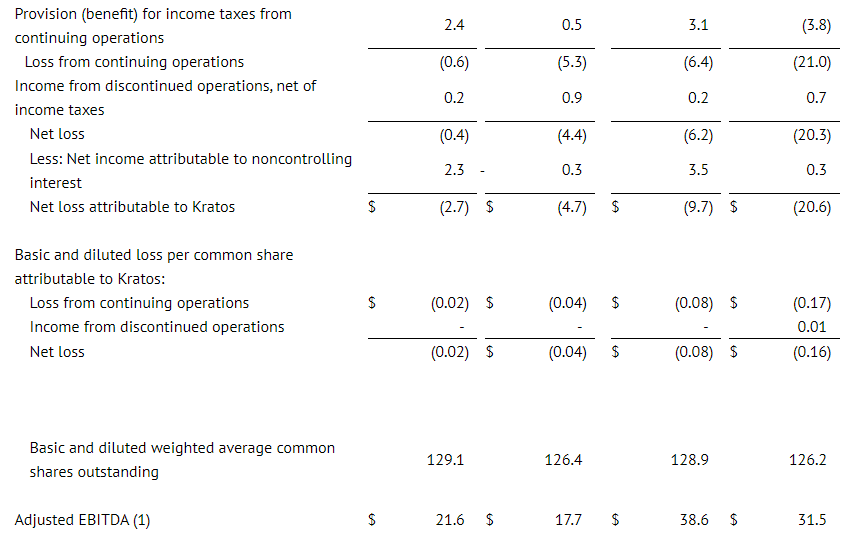
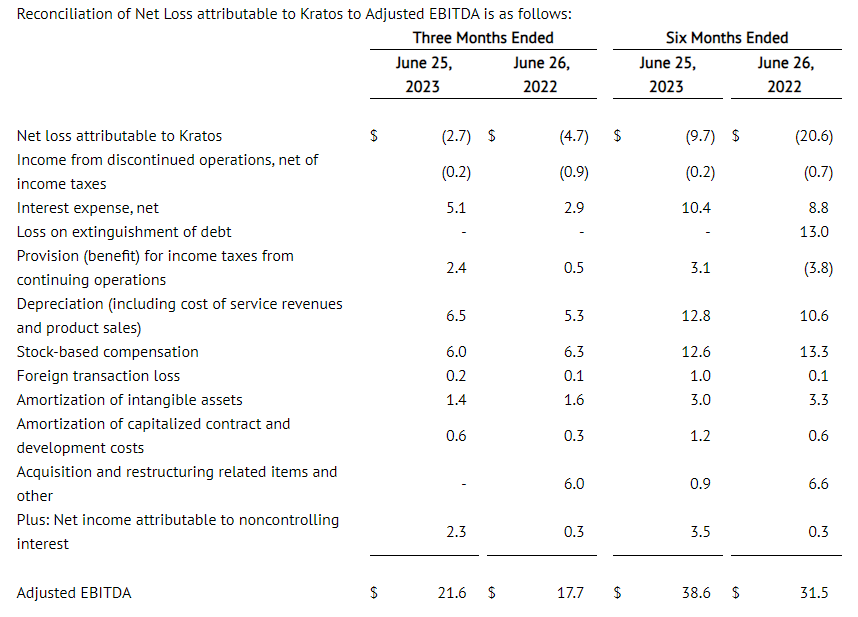
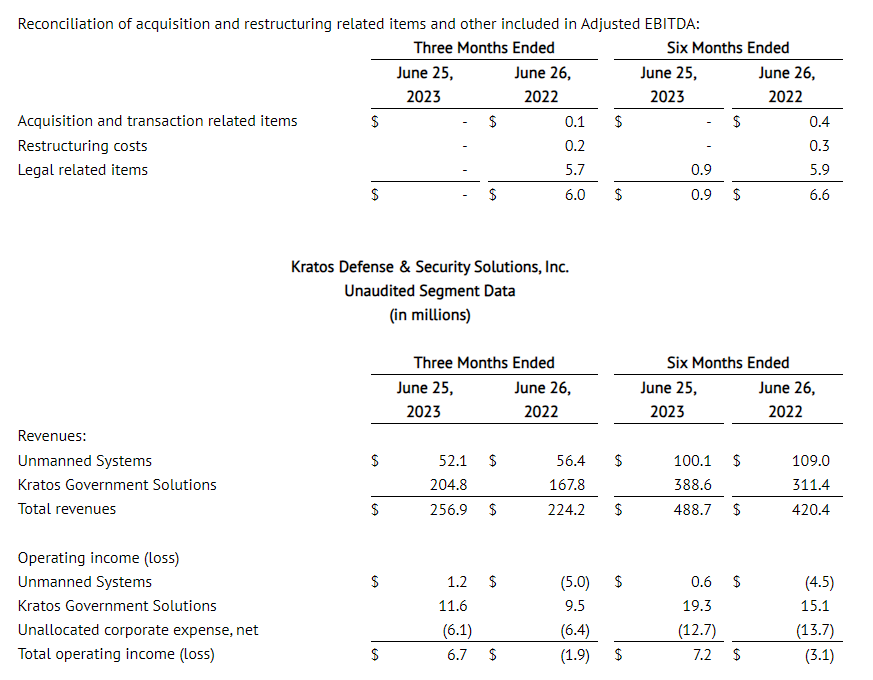
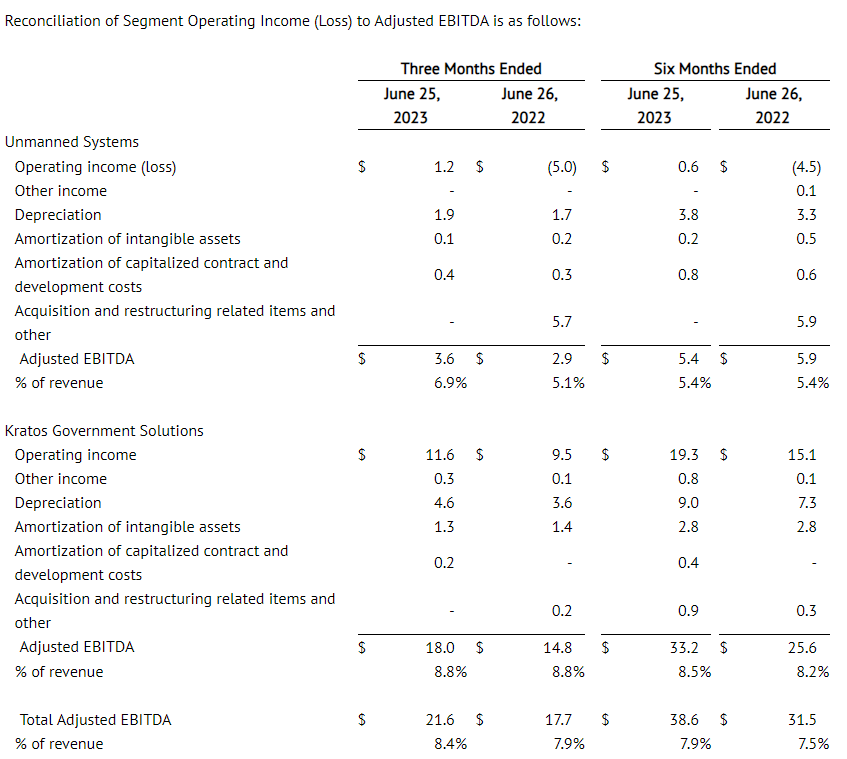
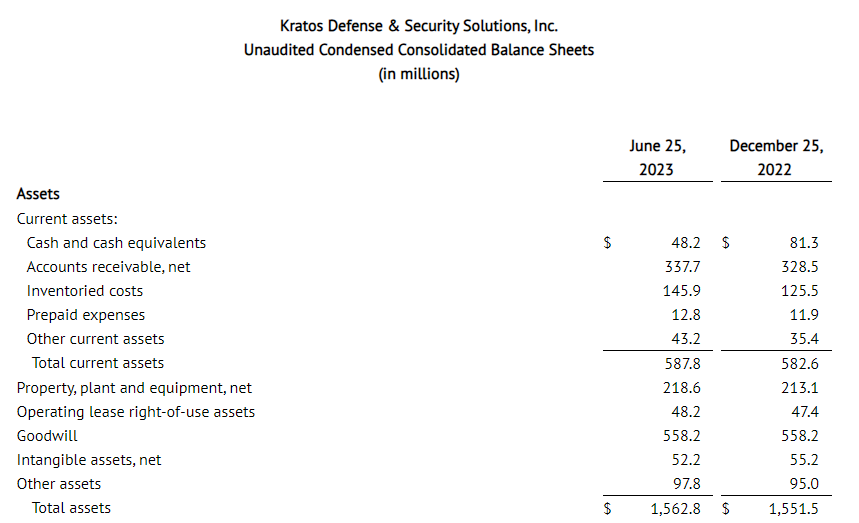
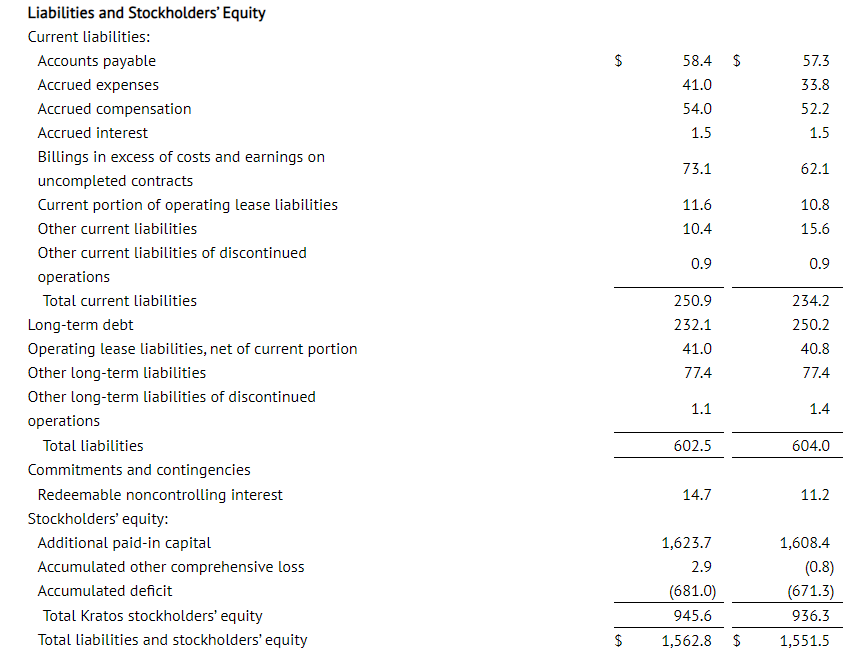
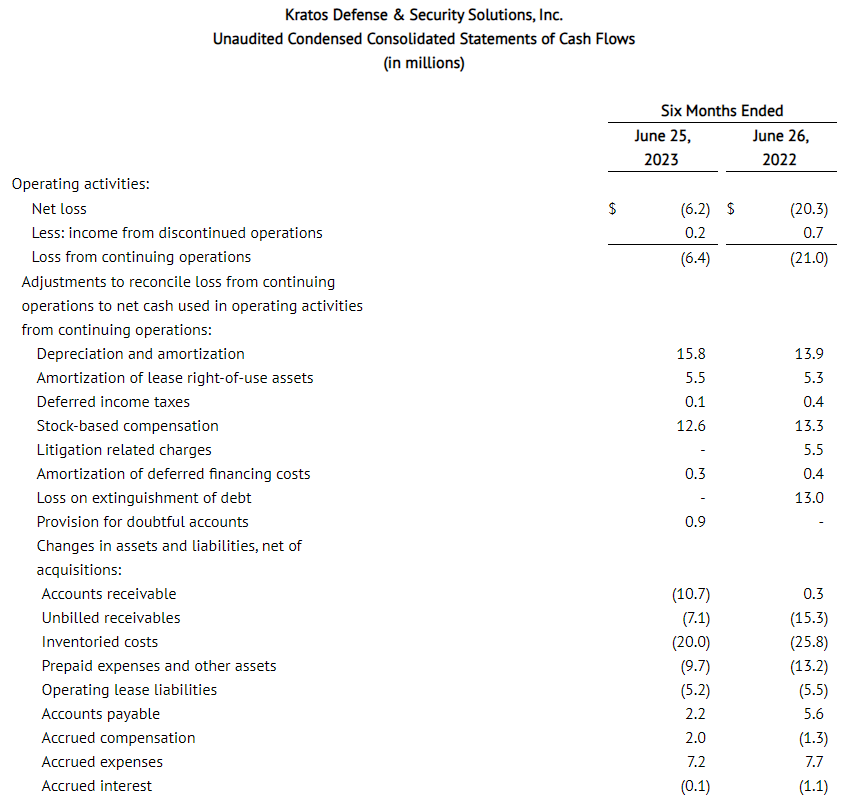

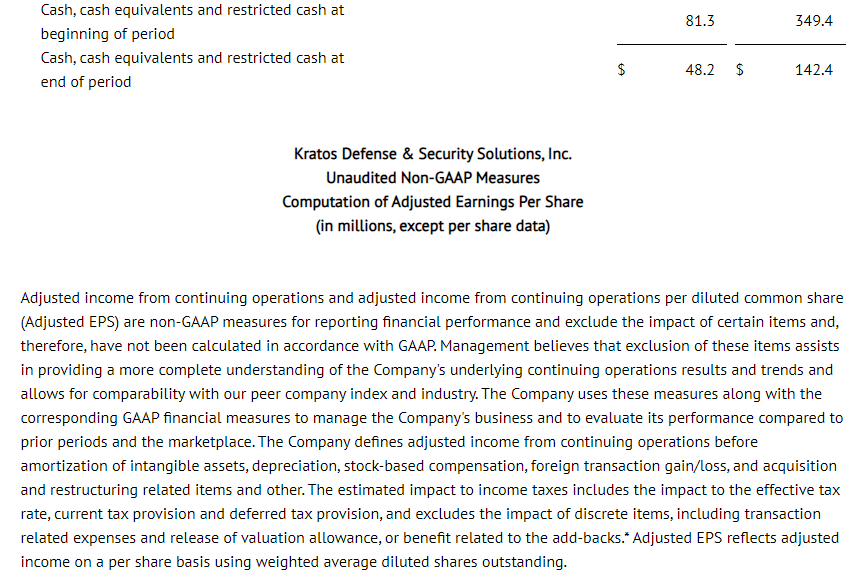
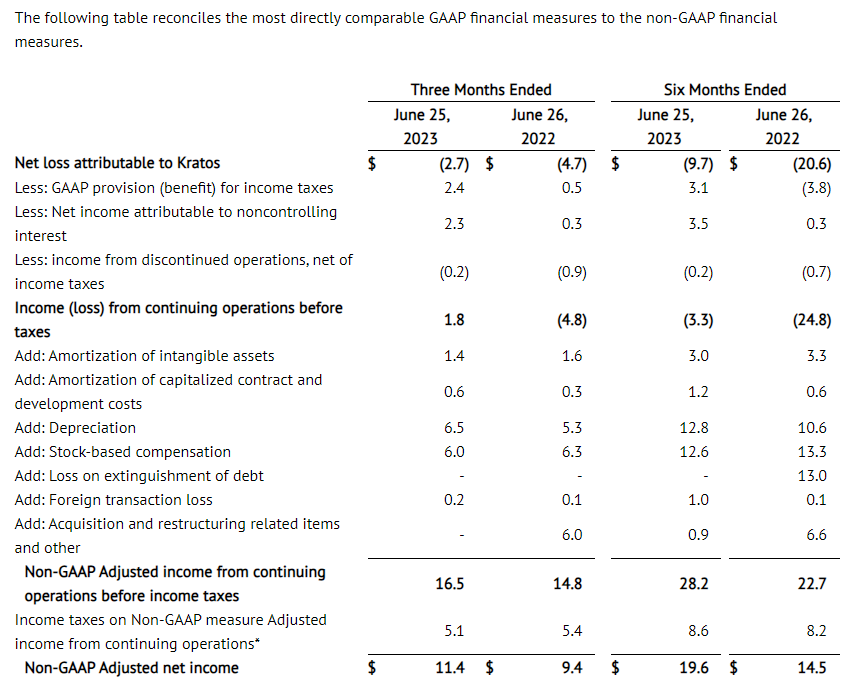
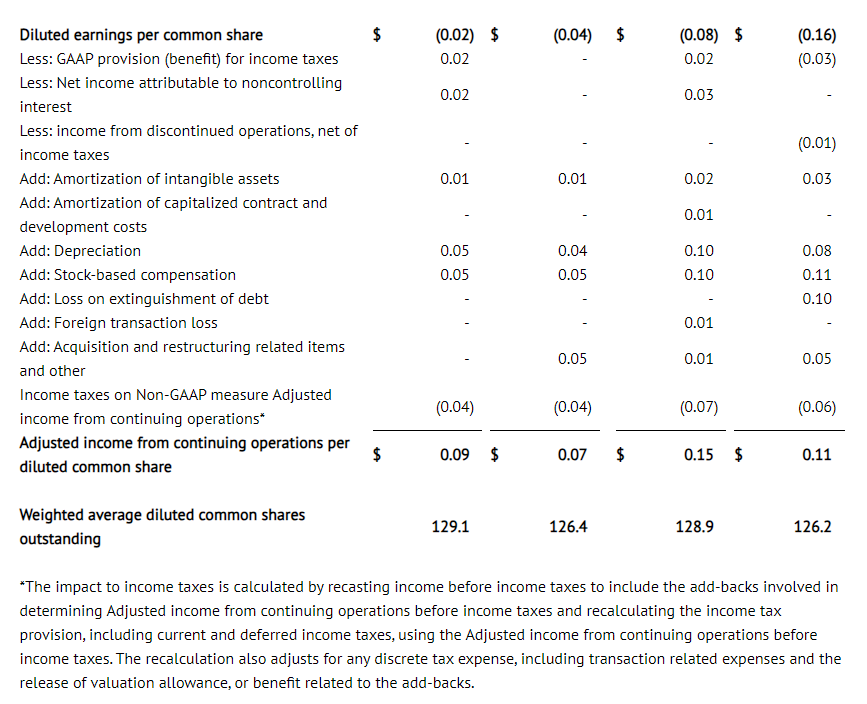

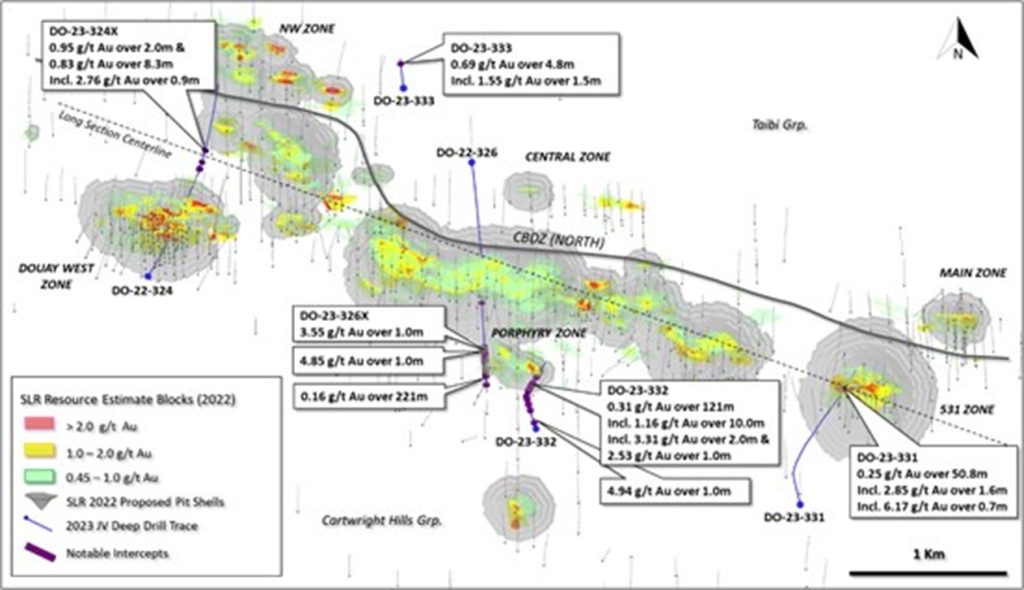
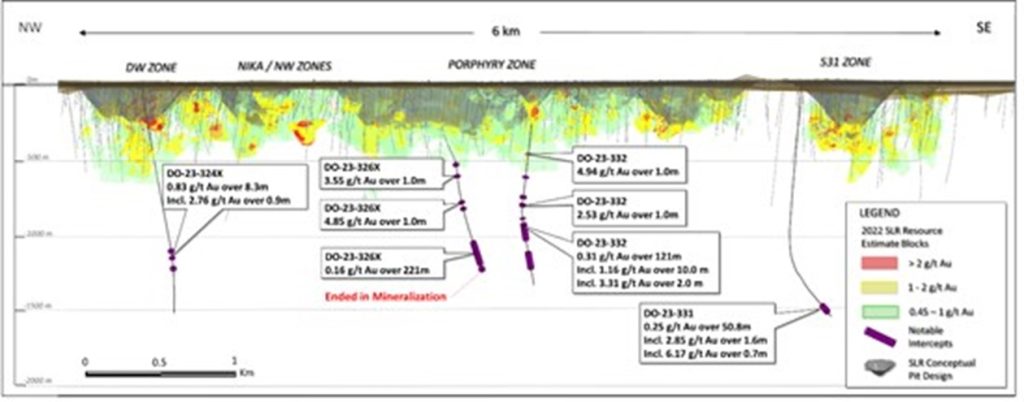
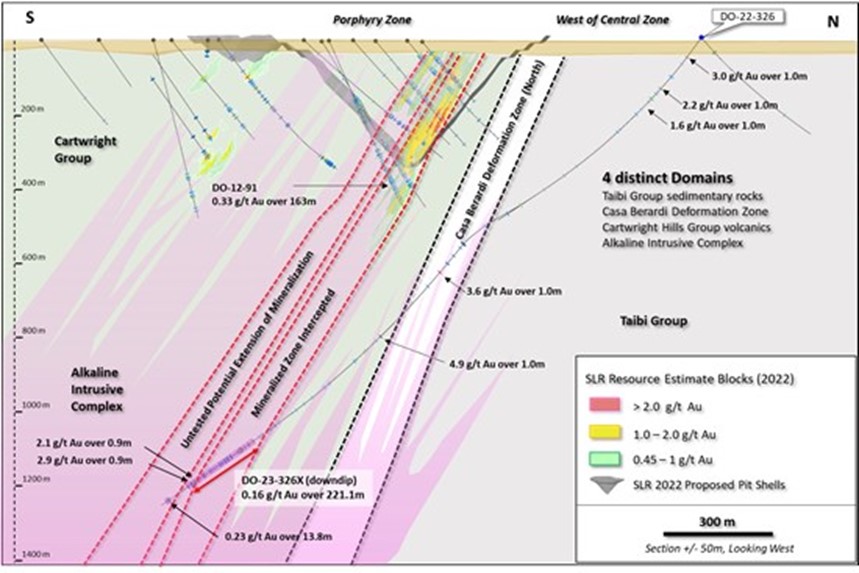

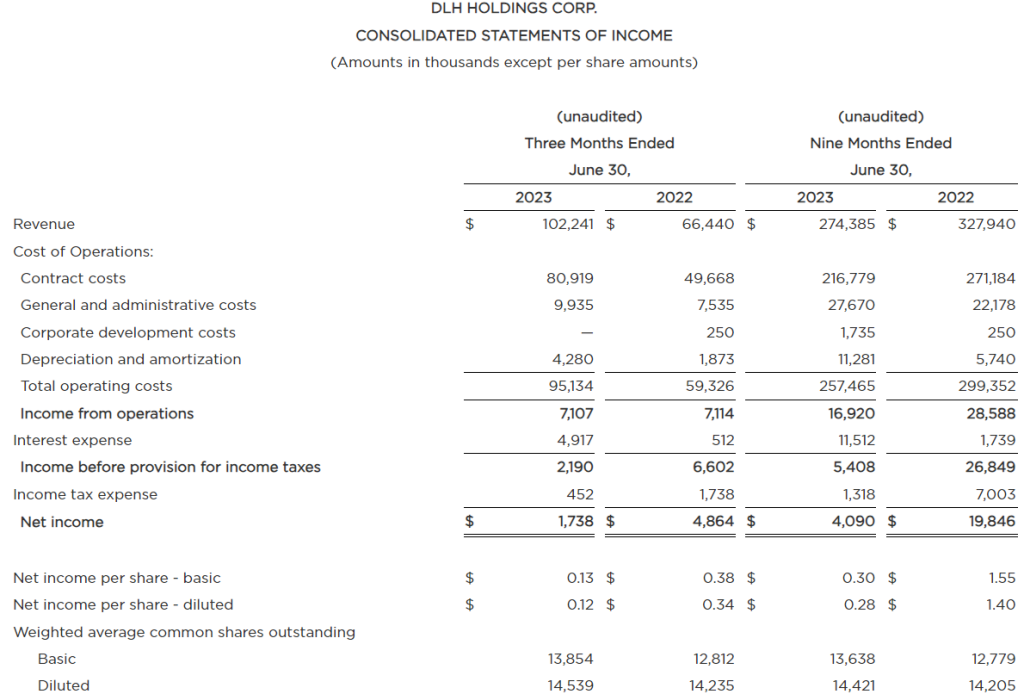

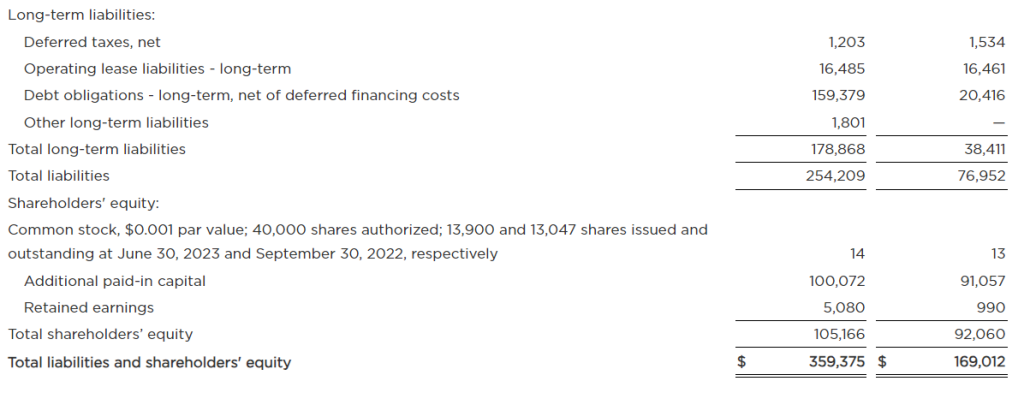
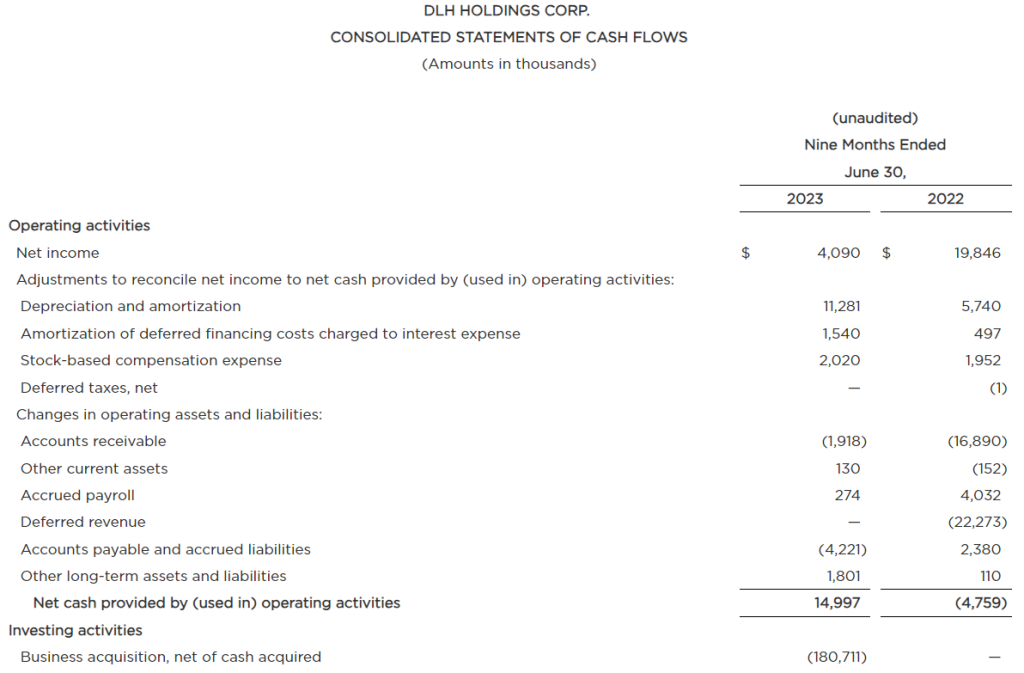


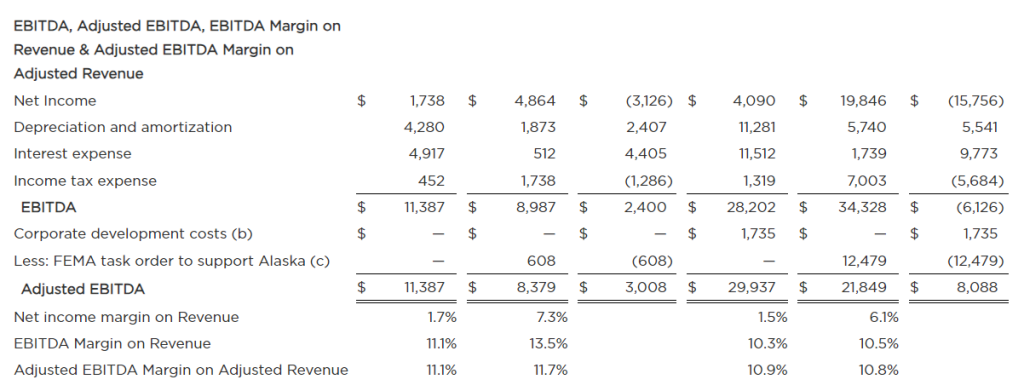


