CALGARY AB, March. 3, 2025 /CNW/ – InPlay Oil Corp. (TSX: IPO) (OTCQX: IPOOF) (“InPlay” or the “Company”) is pleased to confirm that its Board of Directors has declared a monthly cash dividend of $0.015 per common share payable on March 31, 2025, to shareholders of record at the close of business on March 14, 2025. The monthly cash dividend is expected to be designated as an “eligible dividend” for Canadian federal and provincial income tax purposes.
About InPlay Oil Corp.
InPlay is a junior oil and gas exploration and production company with operations in Alberta focused on light oil production. The company operates long-lived, low-decline properties with drilling development and enhanced oil recovery potential as well as undeveloped lands with exploration possibilities. The common shares of InPlay trade on the Toronto Stock Exchange under the symbol IPO and the OTCQX Exchange under the symbol IPOOF.
For further information please contact: Doug Bartole, President and Chief Executive Officer, InPlay Oil Corp., Telephone: (587) 955-0632; Darren Dittmer, Chief Financial Officer, InPlay Oil Corp., Telephone: (587) 955-0634
FORT WORTH, Texas, March 3, 2025 /PRNewswire/ — AZZ Inc. (NYSE: AZZ), the leading independent provider of hot-dip galvanizing and coil coating solutions in North America, today announced the completion of repricing its $400 million Senior Secured Revolving Line of Credit. The repricing decreased the interest rate margin applicable to the Revolving Credit Loans from margins ranging from 275 basis points to 350 basis points (subject to leverage ratio step-downs) to margins ranging from 175 basis points to 275 basis points (subject to leverage ratio step-downs); (b) reduced the Commitment Fee applicable to the Revolving Credit Loans from fees ranging from 25 basis points to 37.5 basis points (subject to leverage ratio step-downs) to fees ranging from 20 basis points to 30 basis points (subject to leverage ratio step-downs); and (c) reduced the Letter of Credit Fees from 425 basis points to fees ranging from 175 basis points to 275 basis points (subject to leverage ratio step-downs).
Jason Crawford, Chief Financial Officer commented, “We are pleased to announce the successful completion of our revolver repricing. The repricing will result in significantly lower interest costs through the maturity of the facility and demonstrates our ongoing commitment to interest expense reduction.”
About AZZ Inc. AZZ Inc. is the leading independent provider of hot-dip galvanizing and coil coating solutions to a broad range of end-markets. Collectively, our business segments provide sustainable, unmatched metal coating solutions that enhance the longevity and appearance of buildings, products and infrastructure that are essential to everyday life.
Safe Harbor Statement Certain statements herein about our expectations of future events or results constitute forward-looking statements for purposes of the safe harbor provisions of The Private Securities Litigation Reform Act of 1995. You can identify forward-looking statements by terminology such as “may,” “could,” “should,” “expects,” “plans,” “will,” “might,” “would,” “projects,” “currently,” “intends,” “outlook,” “forecasts,” “targets,” “anticipates,” “believes,” “estimates,” “predicts,” “potential,” “continue,” or the negative of these terms or other comparable terminology. Such forward-looking statements are based on currently available competitive, financial, and economic data and management’s views and assumptions regarding future events. Such forward-looking statements are inherently uncertain, and investors must recognize that actual results may differ from those expressed or implied in the forward-looking statements. Forward-looking statements speak only as of the date they are made and are subject to risks that could cause them to differ materially from actual results. Certain factors could affect the outcome of the matters described herein. This press release may contain forward-looking statements that involve risks and uncertainties including, but not limited to, changes in customer demand for our products and solutions, including demand by the construction markets, the industrial markets, and the metal coatings markets. We could also experience additional increases in labor costs, components and raw materials including zinc and natural gas, which are used in our hot-dip galvanizing process; supply-chain vendor delays; customer requested delays of our products or solutions; delays in additional acquisition opportunities; an increase in our debt leverage and/or interest rates on our debt, of which a significant portion is tied to variable interest rates; availability of experienced management and employees to implement AZZ’s growth strategy; a downturn in market conditions in any industry relating to the products we inventory or sell or the solutions that we provide; economic volatility, including a prolonged economic downturn or macroeconomic conditions such as inflation or changes in the political stability in the United States and other foreign markets in which we operate; acts of war or terrorism inside the United States or abroad; and other changes in economic and financial conditions. AZZ has provided additional information regarding risks associated with the business, including in Part I, Item 1A. Risk Factors, in AZZ’s Annual Report on Form 10-K for the fiscal year ended February 29, 2024, and other filings with the SEC, available for viewing on AZZ’s website at www.azz.com and on the SEC’s website at www.sec.gov. You are urged to consider these factors carefully when evaluating the forward-looking statements herein and are cautioned not to place undue reliance on such forward-looking statements, which are qualified in their entirety by this cautionary statement. These statements are based on information as of the date hereof and AZZ assumes no obligation to update any forward-looking statements, whether as a result of new information, future events, or otherwise.
Investor Relations and Company Contact: David Nark, Senior Vice President of Marketing, Communications, and Investor Relations AZZ Inc. (817) 810-0095 www.azz.com
Investor Contact: Sandy Martin / Phillip Kupper Three Part Advisors (214) 616-2207 www.threepa.com
OKLAHOMA CITY, OKLAHOMA – FEBRUARY 28, 2025 – Comstock Inc. (NYSE: LODE) today announced a new investment and strategic collaboration with Marathon Petroleum Corporation (NYSE: MPC) to advance its lignocellulosic biomass refining solutions to commercial maturity. Comstock Fuels Corporation (“Comstock Fuels”), a subsidiary of Comstock Inc., has entered into a series of definitive agreements with subsidiaries of Marathon Petroleum Corporation (“Marathon”), involving the purchase of $14,000,000 in Comstock Fuels equity (“Investment”).
The Investment includes $1,000,000 in cash and $13,000,000 in payment-in-kind assets (“Payment-In-Kind Assets”) by Marathon, comprised of equipment, related intellectual properties, and other materials located at a Marathon renewable fuel demonstration facility in Madison, Wisconsin (“Madison Facility”). Comstock Fuels will use the Madison Facility to increase Comstock Fuels’ current pilot production capabilities in Wausau, Wisconsin.
Comstock Fuels’ advanced lignocellulosic biomass refining solutions are designed to align with oil producers by converting massive supplies of historically inaccessible biomass feedstock into “drop-in” hydrocarbon fuels for use in existing petroleum-based infrastructure.
Most current forms of renewable fuel draw from the same pool of conventional feedstocks, including corn, soy and various vegetable oils in the U.S., and the entire universe of those feedstocks only represents a tiny fraction of the domestic fuel demand. In contrast, the U.S. Department of Energy has previously estimated that America can produce upwards of one billion tons per year of biomass for conversion into fuel. That’s enough untapped feedstock to produce more than 3 billion barrels of fuel per year with Comstock Fuels’ refining solutions.
“We’re excited to collaborate with Marathon’s team as we work to integrate the Madison Facility and advance our unique renewable fuels technology to commercial maturity,” said Kevin Kreisler, Comstock Fuels’ chief technology officer.
The transaction documents included Comstock Fuels’ board observation rights for Marathon and reiterated the parties’ commitment to finalize an offtake agreement, joint development agreement, and warrant agreement on or before May 31, 2025.
Additional information on the transaction documents is available online in Comstock’s February 28, 2025, Current Report on Form 8-K.
About Comstock Fuels Corporation
Comstock Fuels Corporation (“Comstock Fuels”) delivers advanced lignocellulosic biomass refining solutions that set industry benchmarks for production of cellulosic ethanol, gasoline, renewable diesel, sustainable aviation fuel (“SAF”), and other renewable Bioleum™ fuels, with extremely low carbon intensity scores of 15 and market-leading yields of up to 140 gallons per dry metric ton of feedstock (on a gasoline gallon equivalent basis, or “GGE”), depending on feedstock, site conditions, and other process parameters. Comstock Fuels additionally holds the exclusive rights to intellectual properties developed by Hexas Biomass Inc. (“Hexas”) for production of purpose grown energy crops in liquid fuels applications with proven yields exceeding 25 to 30 dry metric tons per acre per year. The combination of Comstock Fuels’ high yield Bioleum refining platform and Hexas’ high yield energy crops allows for the production of enough feedstock to produce upwards of 100 barrels of fuel per acre per year, effectively transforming marginal agricultural lands with regenerative practices into perpetual “drop-in sedimentary oilfields” with the potential to dramatically boost regional energy security and rural economies.
Comstock Fuels plans to contribute to domestic energy dominance by directly building, owning, and operating a network of Bioleum Refineries in the U.S. to produce about 200 million barrels of renewable fuel per year by 2035, starting with its planned first 400,000 barrel per year commercial demonstration facility in Oklahoma. Comstock Fuels also licenses its advanced feedstock and refining solutions to third parties for additional production in the U.S. and global markets, including several recently announced and other pending projects. To learn more, please visit www.comstockfuels.com.
About Comstock Inc.
Comstock Inc. (NYSE: LODE) innovates and commercializes technologies that are deployable across entire industries to contribute to energy abundance by efficiently extracting and converting under-utilized natural resources, such as waste and other forms of woody biomass into renewable fuels, and end-of-life electronics into recovered electrification metals. Comstock’s innovations group is also developing and using artificial intelligence technologies for advanced materials development and mineral discovery for sustainable mining. To learn more, please visit www.comstock.inc.
Comstock Social Media Policy
Comstock Inc. has used, and intends to continue using, its investor relations link and main website at www.comstock.inc in addition to its X.com, LinkedIn and YouTube accounts, as means of disclosing material non-public information and for complying with its disclosure obligations under Regulation FD.
Contacts
For investor inquiries: RB Milestone Group LLC Tel (203) 487-2759 [email protected]
For media inquiries or questions: Colby Korsun Comstock Fuels Corporation [email protected]
Forward-Looking Statements
This press release and any related calls or discussions may include forward-looking statements within the meaning of Section 27A of the Securities Act of 1933, as amended, and Section 21E of the Securities Exchange Act of 1934, as amended. All statements, other than statements of historical facts, are forward-looking statements. The words “believe,” “expect,” “anticipate,” “estimate,” “project,” “plan,” “should,” “intend,” “may,” “will,” “would,” “potential” and similar expressions identify forward-looking statements but are not the exclusive means of doing so. Forward-looking statements include statements about matters such as: future market conditions; future explorations or acquisitions; future changes in our research, development and exploration activities; future financial, natural, and social gains; future prices and sales of, and demand for, our products and services; land entitlements and uses; permits; production capacity and operations; operating and overhead costs; future capital expenditures and their impact on us; operational and management changes (including changes in the Board of Directors); changes in business strategies, planning and tactics; future employment and contributions of personnel, including consultants; future land and asset sales; investments, acquisitions, joint ventures, strategic alliances, business combinations, operational, tax, financial and restructuring initiatives, including the nature, timing and accounting for restructuring charges, derivative assets and liabilities and the impact thereof; contingencies; litigation, administrative or arbitration proceedings; environmental compliance and changes in the regulatory environment; offerings, limitations on sales or offering of equity or debt securities, including asset sales and associated costs; business opportunities, growth rates, future working capital, needs, revenues, variable costs, throughput rates, operating expenses, debt levels, cash flows, margins, taxes and earnings. These statements are based on assumptions and assessments made by our management in light of their experience and their perception of historical and current trends, current conditions, possible future developments and other factors they believe to be appropriate. Forward-looking statements are not guarantees, representations or warranties and are subject to risks and uncertainties, many of which are unforeseeable and beyond our control and could cause actual results, developments, and business decisions to differ materially from those contemplated by such forward-looking statements. Some of those risks and uncertainties include the risk factors set forth in our filings with the SEC and the following: adverse effects of climate changes or natural disasters; adverse effects of global or regional pandemic disease spread or other crises; global economic and capital market uncertainties; the speculative nature of gold or mineral exploration, and lithium, nickel and cobalt recycling, including risks of diminishing quantities or grades of qualified resources; operational or technical difficulties in connection with exploration, metal recycling, processing or mining activities; costs, hazards and uncertainties associated with precious and other metal based activities, including environmentally friendly and economically enhancing clean mining and processing technologies, precious metal exploration, resource development, economic feasibility assessment and cash generating mineral production; costs, hazards and uncertainties associated with metal recycling, processing or mining activities; contests over our title to properties; potential dilution to our stockholders from our stock issuances, recapitalization and balance sheet restructuring activities; potential inability to comply with applicable government regulations or law; adoption of or changes in legislation or regulations adversely affecting our businesses; permitting constraints or delays; challenges to, or potential inability to, achieve the benefits of business opportunities that may be presented to, or pursued by, us, including those involving battery technology and efficacy, quantum computing and generative artificial intelligence supported advanced materials development, development of cellulosic technology in bio-fuels and related material production; commercialization of cellulosic technology in bio-fuels and generative artificial intelligence development services; ability to successfully identify, finance, complete and integrate acquisitions, joint ventures, strategic alliances, business combinations, asset sales, and investments that we may be party to in the future; changes in the United States or other monetary or fiscal policies or regulations; interruptions in our production capabilities due to capital constraints; equipment failures; fluctuation of prices for gold or certain other commodities (such as silver, zinc, lithium, nickel, cobalt, cyanide, water, diesel, gasoline and alternative fuels and electricity); changes in generally accepted accounting principles; adverse effects of war, mass shooting, terrorism and geopolitical events; potential inability to implement our business strategies; potential inability to grow revenues; potential inability to attract and retain key personnel; interruptions in delivery of critical supplies, equipment and raw materials due to credit or other limitations imposed by vendors; assertion of claims, lawsuits and proceedings against us; potential inability to satisfy debt and lease obligations; potential inability to maintain an effective system of internal controls over financial reporting; potential inability or failure to timely file periodic reports with the Securities and Exchange Commission; potential inability to list our securities on any securities exchange or market or maintain the listing of our securities; and work stoppages or other labor difficulties. Occurrence of such events or circumstances could have a material adverse effect on our business, financial condition, results of operations or cash flows, or the market price of our securities. All subsequent written and oral forward-looking statements by or attributable to us or persons acting on our behalf are expressly qualified in their entirety by these factors. Except as may be required by securities or other law, we undertake no obligation to publicly update or revise any forward-looking statements, whether as a result of new information, future events, or otherwise. Neither this press release nor any related calls or discussions constitutes an offer to sell, the solicitation of an offer to buy or a recommendation with respect to any securities of the Company, the fund, or any other issuer.
New resource provides a structured framework to help organizations assess, prepare, and govern data for high-quality AI inputs
HOUSTON, Feb. 27, 2025 /PRNewswire/ — Direct Digital Holdings, Inc. (Nasdaq: DRCT) (“Direct Digital Holdings” or the “Company”), a leading advertising and marketing technology platform operating through its companies Colossus Media, LLC (“Colossus SSP”) and Orange 142, LLC (“Orange 142”), today announced the release of The Role of Data in AI Quality, a comprehensive guide developed by Direct Digital Holdings’ AI Council to help organizations enhance the quality and integrity of data used in AI systems.
As artificial intelligence drives innovation across industries, organizations face a fundamental challenge: ensuring they have high-quality data to achieve consistently reliable AI outcomes. Businesses risk inaccurate predictions, biased models, and security vulnerabilities without structured, well-defined instructions and high-integrity data. The Role of Data in AI Quality equips business leaders with the insights needed to establish effective data management practices, ensuring AI solutions produce meaningful and trustworthy results. Additionally, it helps organizations make informed decisions about resource allocation, timelines, and investment in data preparation—critical first steps before embarking on any AI initiative.
Setting a Standard for AI Data Readiness
“AI systems are only as good as the data that powers them,” said Anu Pillai, Chief Technology Officer at Direct Digital Holdings. “Businesses investing in AI must first prioritize data quality, ensuring that information is accurate, complete, and ethically sourced. Our guide provides a practical approach for organizations looking to refine their data management strategies, identify gaps that can affect AI performance, and set a strong foundation for AI success.”
The “The Role of Data in AI Quality” guide offers key insights into:
Understanding the impact of data quality on AI performance
Best practices for data assessment, preparation, and governance
Managing compliance and privacy risks in AI-driven environments
Strategies for eliminating bias and enhancing data integrity
Leveraging data enrichment techniques to optimize AI outputs
“Many organizations are eager to adopt AI but struggle with the foundational step of data readiness,” added Christy Nolan, VP of Delivery Solutions at Direct Digital Holdings. “This guide goes beyond theory and provides actionable steps to help businesses effectively clean, structure, and manage their data. By following these best practices, companies can ensure their AI systems deliver accurate and meaningful insights.”
By addressing the complete data lifecycle and establishing rigorous controls for accuracy and security, the comprehensive resource enables organizations to build the strong data foundation essential for successful AI implementation.
Direct Digital Holdings (Nasdaq: DRCT) combines cutting-edge sell-side and buy-side advertising solutions, providing data-driven digital media strategies that enhance reach and performance for brands, agencies, and publishers of all sizes. Our sell-side platform, Colossus SSP, offers curated access to premium, growth-oriented media properties throughout the digital ecosystem. On the buy-side, Orange 142 delivers customized, audience-focused digital marketing and advertising solutions that enable mid-market and enterprise companies to achieve measurable results across a range of platforms, including programmatic, search, social, CTV, and influencer marketing. With extensive expertise in high-growth sectors such as Energy, Healthcare, Travel & Tourism, and Financial Services, our teams deliver performance strategies that connect brands with their ideal audiences.
At Direct Digital Holdings, we prioritize personal relationships by humanizing technology, ensuring each client receives dedicated support and tailored digital marketing solutions regardless of company size. This empowers everyone to thrive by generating billions of monthly impressions across display, CTV, in-app, and emerging media channels through advanced targeting, comprehensive data insights, and cross-platform activation. DDH is “Digital advertising built for everyone.”
CHICAGO–(BUSINESS WIRE)– MAIA Biotechnology, Inc., (NYSE American: MAIA) (“MAIA”, the “Company”), a clinical-stage biopharmaceutical company developing targeted immunotherapies for cancer, today announced plans to initiate a Phase 3 pivotal trial in 2025, named THIO-104, to evaluate the efficacy of THIO administered in sequence with a checkpoint inhibitor (CPI) in third-line non-small cell lung cancer (NSCLC) patients who are resistant to checkpoint inhibitors and chemotherapy. The multicenter, open-label, pivotal Phase 3 trial is designed to provide a direct comparison to chemotherapy in a 1:1 randomization of up to 300 patients.
“THIO has consistently and substantially outperformed standard treatment options in our THIO-101 Phase 2 trial to date. THIO-104 will give us direct comparative data from a randomized study in patients in third line of treatment,” said Vlad Vitoc, M.D., CEO of MAIA. “We expect that the results from this study will further illuminate THIO’s unmatched benefits for advanced stage NSCLC patients.
“Our initiation of THIO-104 will mark an important milestone along our goal for THIO’s FDA commercial approval,” Dr. Vitoc added.
MAIA expects to begin enrolling patients in THIO-104 in the second half of 2025 in select countries in Asia, Europe and in the U.S.
The primary endpoint of the clinical trial is overall survival for THIO sequenced with a CPI compared to investigator’s choice of chemotherapy in a third line setting. The secondary endpoints include disease control rate, overall response rate, duration of response, progression-free survival and safety.
About THIO
THIO (6-thio-dG or 6-thio-2’-deoxyguanosine) is a first-in-class investigational telomere-targeting agent currently in clinical development to evaluate its activity in Non-Small Cell Lung Cancer (NSCLC). Telomeres, along with the enzyme telomerase, play a fundamental role in the survival of cancer cells and their resistance to current therapies. The modified nucleotide 6-thio-2’-deoxyguanosine (THIO) induces telomerase-dependent telomeric DNA modification, DNA damage responses, and selective cancer cell death. THIO-damaged telomeric fragments accumulate in cytosolic micronuclei and activates both innate (cGAS/STING) and adaptive (T-cell) immune responses. The sequential treatment with THIO followed by PD-(L)1 inhibitors resulted in profound and persistent tumor regression in advanced, in vivo cancer models by induction of cancer type–specific immune memory. THIO is presently developed as a third line of treatment for NSCLC for patients that are resistant to checkpoint inhibitors and chemotherapy.
About MAIA Biotechnology, Inc.
MAIA is a targeted therapy, immuno-oncology company focused on the development and commercialization of potential first-in-class drugs with novel mechanisms of action that are intended to meaningfully improve and extend the lives of people with cancer. Our lead program is THIO, a potential first-in-class cancer telomere targeting agent in clinical development for the treatment of NSCLC patients with telomerase-positive cancer cells. For more information, please visit www.maiabiotech.com.
Forward Looking Statements
MAIA cautions that all statements, other than statements of historical facts contained in this press release, are forward-looking statements. Forward-looking statements are subject to known and unknown risks, uncertainties, and other factors that may cause our or our industry’s actual results, levels or activity, performance or achievements to be materially different from those anticipated by such statements. The use of words such as “may,” “might,” “will,” “should,” “could,” “expect,” “plan,” “anticipate,” “believe,” “estimate,” “project,” “intend,” “future,” “potential,” or “continue,” and other similar expressions are intended to identify forward looking statements. However, the absence of these words does not mean that statements are not forward-looking. For example, all statements we make regarding (i) the initiation, timing, cost, progress and results of our preclinical and clinical studies and our research and development programs, (ii) our ability to advance product candidates into, and successfully complete, clinical studies, (iii) the timing or likelihood of regulatory filings and approvals, (iv) our ability to develop, manufacture and commercialize our product candidates and to improve the manufacturing process, (v) the rate and degree of market acceptance of our product candidates, (vi) the size and growth potential of the markets for our product candidates and our ability to serve those markets, and (vii) our expectations regarding our ability to obtain and maintain intellectual property protection for our product candidates, are forward looking. All forward-looking statements are based on current estimates, assumptions and expectations by our management that, although we believe to be reasonable, are inherently uncertain. Any forward-looking statement expressing an expectation or belief as to future events is expressed in good faith and believed to be reasonable at the time such forward-looking statement is made. However, these statements are not guarantees of future events and are subject to risks and uncertainties and other factors beyond our control that may cause actual results to differ materially from those expressed in any forward-looking statement. Any forward-looking statement speaks only as of the date on which it was made. We undertake no obligation to publicly update or revise any forward-looking statement, whether as a result of new information, future events or otherwise, except as required by law. In this release, unless the context requires otherwise, “MAIA,” “Company,” “we,” “our,” and “us” refers to MAIA Biotechnology, Inc. and its subsidiaries.
MALVERN, Pa., Feb. 27, 2025 (GLOBE NEWSWIRE) — Ocugen, Inc. (Ocugen or the Company) (NASDAQ: OCGN), a pioneering biotechnology leader in gene therapies for blindness diseases, today announced that alignment has been reached with the U.S. Food and Drug Administration (FDA) to move forward with a Phase 2/3 pivotal confirmatory clinical trial for OCU410ST which, if positive, can be the basis of a biologics license application (BLA) submission.
The GARDian trial for OCU410ST demonstrated:
A favorable safety and tolerability profile with no serious adverse events related to OCU410ST, including no cases of ischemic optic neuropathy, vasculitis, intraocular inflammation, endophthalmitis or choroidal neovascularization and no adverse events of special interest
Considerably slower lesion growth (52%) from baseline in treated eyes versus untreated fellow eyes at 6-month follow-up from the Phase 1 study
Clinically meaningful 2-line (10-letter) improvement in visual function (BCVA) at 6-month follow-up from the Phase 1 study, which is statistically significant (p=0.02) in treated eyes
“I am very pleased that the FDA has recognized the promise of Ocugen’s modifier gene therapy for Stargardt disease and accelerated the regulatory pathway for OCU410ST,” said Dr. Shankar Musunuri, Chairman, CEO, and Co-founder of Ocugen. “This new development allows us to initiate a pivotal confirmatory trial for this game-changing, one-time treatment for life in the next few months and prepare for a potential BLA filing by 2027. Now patients suffering from Stargardt disease have a new hope where previously none existed. This achievement furthers our mission to cure blindness diseases.”
Stargardt disease affects 100,000 people in the U.S. and Europe combined, and there is no treatment. OCU410ST received orphan drug designations from the FDA and the European Medicines Agency (EMA) in 2023 and 2024, respectively.
“Getting approval for a Phase 2/3 trial is a pivotal milestone, as this approach has never been explored in clinical trials for Stargardt disease. The FDA’s decision underscores the potential of OCU410ST to meet a critical unmet medical need for the approximately 44,000 Stargardt patients in the U.S.,” said Lejla Vajzovic, MD, FASRS, Director, Duke Surgical Vitreoretinal Fellowship Program, Professor of Ophthalmology, Pediatrics and Biomedical Engineering with Tenure, Adult and Pediatric Vitreoretinal Surgery and Disease, Duke University Eye Center, and Retina Scientific Advisory Board Chair of Ocugen.
The Phase 2/3 clinical trial will randomize 51 subjects, 34 of whom will receive a single, subretinal, 200-μL injection of OCU410ST at a concentration of 1.5 x 10¹¹ vector genomes (vg)/mL in the eye with worse visual acuity, and 17 of whom will serve as untreated controls. The primary endpoint in the clinical trial is change in atrophic lesion size. Secondary endpoints include visual acuity as measured by best corrected visual acuity (BCVA) and low luminance visual acuity (LLVA) compared to untreated controls. One-year data will be utilized for the BLA filing.
“This approval pathway, established in collaboration with the FDA, has made it possible to expedite the clinical development of OCU410ST by two to three years and has aided in bringing an innovative gene therapy to patients desperate for a treatment option,” said Dr. Huma Qamar, Chief Medical Officer at Ocugen. “Recent data from the OCU410ST clinical trial have shown significant improvements in both structural and functional outcomes. Additionally, OCU410ST has consistently demonstrated a very favorable safety and tolerability profile.”
Accelerating the clinical timeline of OCU410ST will save significant costs in addressing disease burden even sooner than anticipated.
About OCU410ST OCU410ST utilizes an AAV delivery platform for the retinal delivery of the RORA (RAR-Related Orphan Receptor A) gene. It represents Ocugen’s modifier gene therapy approach, which is based on Nuclear Hormone Receptor (NHR) RORA that regulates pathophysiological pathways linked to Stargardt disease, such as lipofuscin formation, oxidative stress, complement formation, inflammation, and cell survival networks.
About Stargardt Disease Stargardt disease is a genetic eye disorder that causes retinal degeneration and vision loss. Stargardt disease is the most common form of inherited macular degeneration. The progressive vision loss associated with Stargardt disease is caused by the degeneration of photoreceptor cells in the central portion of the retina called the macula.
Decreased central vision due to loss of photoreceptors in the macula is the hallmark of Stargardt disease. Some peripheral vision is usually preserved. Stargardt disease typically develops during childhood or adolescence, but the age of onset and rate of progression can vary. The retinal pigment epithelium (RPE), a layer of cells supporting photoreceptors, is also affected in people with Stargardt disease.
About Ocugen, Inc. Ocugen, Inc. is a biotechnology company focused on discovering, developing, and commercializing novel gene and cell therapies, biologics, and vaccines that improve health and offer hope for patients across the globe. We are making an impact on patient’s lives through courageous innovation—forging new scientific paths that harness our unique intellectual and human capital. Our breakthrough modifier gene therapy platform has the potential to treat multiple retinal diseases with a single product, and we are advancing research in infectious diseases to support public health and orthopedic diseases to address unmet medical needs. Discover more at www.ocugen.com and follow us on X and LinkedIn.
Cautionary Note on Forward-Looking Statements Thispressreleasecontainsforward-lookingstatementswithinthemeaningofThePrivateSecuritiesLitigationReformActof1995,including,butnot limited to, statements regarding qualitative assessments of available data, potential benefits, expectations for ongoing clinical trials, anticipated regulatory filings and anticipated development timelines,whicharesubjecttorisksanduncertainties.Wemay,insomecases,usetermssuchas “predicts,” “believes,” “potential,” “proposed,” “continue,” “estimates,” “anticipates,” “expects,” “plans,” “intends,” “may,” “could,” “might,” “will,” “should,” or other words that convey uncertainty of future events or outcomes to identify these forward-looking statements. Such statements are subject to numerous important factors, risks, and uncertainties that may cause actual events or results to differ materially from our current expectations, including,butnotlimitedto,therisksthatpreliminary,interimandtop-lineclinicaltrialresultsmaynotbeindicativeof,andmaydifferfrom,finalclinical data;the ability of OCU410ST to perform in humans in a manner consistent with nonclinical, preclinical or previous clinical study data;thatunfavorablenewclinicaltrialdatamayemergeinongoingclinicaltrialsorthroughfurtheranalysesofexistingclinicaltrialdata;thatearlier non-clinicalandclinicaldataandtestingofmaynotbepredictiveoftheresultsorsuccessoflaterclinicaltrials;andthatthatclinicaltrialdataare subject to differing interpretations and assessments, including by regulatory authorities.Theseandotherrisksanduncertaintiesaremorefully describedinourperiodicfilingswiththeSecuritiesandExchangeCommission(SEC),includingtheriskfactorsdescribedinthesectionentitled“Risk Factors”inthequarterlyandannualreportsthatwefilewiththeSEC.Anyforward-lookingstatementsthatwemakeinthispressreleasespeakonlyas ofthedateofthispressrelease.Exceptasrequiredbylaw,weassumenoobligationtoupdateforward-lookingstatementscontainedinthispress release whether as a result of new information, future events, or otherwise, after the date of this press release.
Contact: Tiffany Hamilton AVP, Head of Communications [email protected]
BRENTWOOD, Tenn., Feb. 27, 2025 (GLOBE NEWSWIRE) — CoreCivic, Inc. (NYSE: CXW) (“CoreCivic”) announced today that it has entered into contract modifications to add capacity for up to a total of 784 detainees from U.S. Immigration and Customs Enforcement (“ICE”) at its 2,016-bed Northeast Ohio Correctional Center, its 1072-bed Nevada Southern Detention Center, and its 1,600-bed Cimarron Correctional Facility in Oklahoma. In addition, CoreCivic has obtained a contract modification to specify that ICE may use up to 252 beds at its 2,672-bed Tallahatchie County Correctional Facility in Mississippi.
CoreCivic currently cares for approximately 650 residents under a contract with the U.S. Marshals Service (“USMS”), as well as 925 residents under a contract with the Ohio Department of Rehabilitation and Correction at the Northeast Ohio Correctional Center. CoreCivic currently cares for approximately 800 residents under a contract with the USMS at the Nevada Southern Detention Center, and approximately 1,100 residents under a contract with the USMS at the Cimarron Correctional Facility. CoreCivic currently cares for approximately 1,400 residents at the Tallahatchie County Correctional Facility under contracts with eight different customers.
Damon T. Hininger, CoreCivic’s Chief Executive Officer, commented, “We are pleased to provide U.S. Immigration and Customs Enforcement with this additional capacity. We have an extensive supply of available beds that provides our government partners the flexibility to satisfy their immediate and long-term needs in a cost-effective manner. I am particularly proud of our dedicated team of professionals at each of these three facilities who are capable of managing these diverse customer requirements. We are entering a period where our government partners, particularly our federal government partners, are expected to have increased demand. We anticipate additional contracting activity that will help satisfy their growing needs.”
About CoreCivic
CoreCivic is a diversified, government-solutions company with the scale and experience needed to solve tough government challenges in flexible, cost-effective ways. We provide a broad range of solutions to government partners that serve the public good through high-quality corrections and detention management, a network of residential and non-residential alternatives to incarceration to help address America’s recidivism crisis, and government real estate solutions. We are the nation’s largest owner of partnership correctional, detention and residential reentry facilities, and believe we are the largest private owner of real estate used by government agencies in the United States. We have been a flexible and dependable partner for government for more than 40 years. Our employees are driven by a deep sense of service, high standards of professionalism and a responsibility to help government better the public good. Learn more at www.corecivic.com.
This press release includes forward-looking statements as to our beliefs and expectations of the outcome of future events including increasing demand from our government partners, particularly our federal government partners, and the prospects of growth in CoreCivic’s business. These forward-looking statements may include such words as “anticipate,” “estimate,” “expect,” “project,” “plan,” “intend,” “believe,” “may,” “will,” “should,” “can have,” “likely,” and other words and terms of similar meaning in connection with any discussion of the timing or nature of future operating or financial performance or other events. Such forward-looking statements may be affected by risks and uncertainties in CoreCivic’s business and market conditions. These forward-looking statements are subject to risks and uncertainties that could cause actual results to differ materially from the statements made. Important factors that could cause actual results to differ are described in the filings made from time to time by CoreCivic with the Securities and Exchange Commission (“SEC”) and include the risk factors described in CoreCivic’s Annual Report on Form 10-K for the fiscal year ended December 31, 2024, filed with the SEC on February 21, 2025. Except as required by applicable law, CoreCivic undertakes no obligation to update forward-looking statements made by it to reflect events or circumstances occurring after the date hereof or the occurrence of unanticipated events.
Contact:
Investors: Michael Grant – Managing Director, Investor Relations – (615) 263-6957 Media: Steve Owen – Vice President, Communications – (615) 263-3107
CHICAGO, Feb. 27, 2025 (GLOBE NEWSWIRE) — GoHealth, Inc. (NASDAQ: GOCO) (“GoHealth” or the “Company”), a leading health insurance marketplace and Medicare-focused digital health company, today announced financial results for the three and twelve months ended December 31, 2024.
Fourth Quarter Highlights
Achieved net revenues of $389.1 million, a substantial 41% increase compared to the prior year period.
Submissions grew to 481,445, representing a 67% increase compared to the prior year period.
Net income of $58.0 million, a substantial improvement of $60.3 million compared to the prior year period.
Adjusted EBITDA1 surged to $117.8 million, a significant 107% increase compared to the prior year period.
Compared to the prior year period, Direct Operating Cost per Submission2 improved 27%, to an industry leading $501.
The integration and transformation of e-TeleQuote Insurance, Inc. (“e-TeleQuote”) has driven growth and efficiency gains, delivering significant performance improvements in the 2024 Annual Enrollment Period.
Full-Year 2024 Highlights
Full-year net revenues reached $798.9 million, reflecting 9% growth compared to the prior year.
Submissions were 1,016,182, a 23% increase compared to the prior year.
Net loss of $7.3 million, an improvement of $144.0 million compared to the prior year.
Adjusted EBITDA1 of $120.3 million, a 60% increase compared to the prior year.
Successfully refinanced our credit facility with new five-year term and lender group.
Supported nearly 3 million Medicare consumers in assessing benefit options in 2024.
Implemented the PlanFit Save initiative and began receiving health plan compensation for membership retention.
Remained top partner to health plans based on Submission volume.
“GoHealth’s strong 2024 performance highlights our market-leading, technology-driven approach in the digital Medicare marketplace. While we predicted favorable market dynamics, we were even more pleased by the velocity of our efficiency improvements and the immediate impact of our technology initiatives on profitability. We are energized by the opportunities ahead and are already executing on them,” said Vijay Kotte, CEO of GoHealth. “The successful onboarding and optimization of e-TeleQuote, expansion of our health plan partnerships, and continued investment in artificial intelligence and advanced analytics have further strengthened GoHealth’s position as a leading digital Medicare marketplace. As we move into 2025, we continue to focus on driving sustainable, profitable growth, enhancing the consumer experience, and reinforcing our market leadership through continued innovation and operational excellence.”
“Our 2024 financial results demonstrate GoHealth’s capacity to achieve exceptional performance through disciplined execution and strategic investment,” said Brendan Shanahan, CFO of GoHealth. “The substantial year-over-year growth in net income and the 107% year-over-year growth in Adjusted EBITDA1 during Q4, coupled with significant gains in operating efficiency, reinforces the strength of our strategy. As we begin 2025, we are optimistic that the favorable market dynamics we experienced will persist through at least the first three quarters with cautious optimism for similar favorable dynamics for the fourth quarter, enabling us to build on this solid financial foundation.”
(1)
Adjusted EBITDA is a non-GAAP measure. For a definition of Adjusted EBITDA and a reconciliation to the most comparable GAAP measure, please see below.
(2)
Direct Operating Cost per Submission is an operating metric. For a definition of Direct Operating Cost per Submission and an explanation of its calculation, please see below.
Conference Call Details
The Company will host a conference call today, Thursday, February 27, 2025 at 8:00 a.m. (ET) to discuss its financial results. A live audio webcast of the conference call will be available via GoHealth’s Investor Relations website, https://investors.gohealth.com/. A replay of the call will be available via webcast for on-demand listening shortly after the completion of the call.
About GoHealth, Inc.
GoHealth is a leading health insurance marketplace and Medicare-focused digital health company whose purpose is to compassionately ensure consumers’ peace of mind when making healthcare decisions so they can focus on living life. For many of these consumers, enrolling in a health insurance plan is confusing and difficult, and seemingly small differences between health plans may lead to significant out-of-pocket costs or lack of access to critical providers and medicines. GoHealth’s proprietary technology platform leverages modern machine-learning algorithms, powered by over two decades of insurance purchasing behavior, to reimagine the process of matching a health plan to a consumer’s specific needs. Its unbiased, technology-driven marketplace coupled with highly skilled licensed agents has facilitated the enrollment of millions of consumers in Medicare plans since GoHealth’s inception. For more information, visit https://www.gohealth.com.
This press release contains forward-looking statements within the meaning of Section 27A of the Securities Act of 1933, as amended, (the “Securities Act”) and Section 21E of the Securities Exchange Act of 1934, as amended (the “Exchange Act”). These forward-looking statements are made in reliance upon the safe harbor provision of the Private Securities Litigation Reform Act of 1995. All statements other than statements of historical facts contained in this press release may be forward-looking statements. Statements regarding our future results of operations and financial position, business strategy and plans and objectives of management for future operations, including, among others, statements regarding our expected growth, future capital expenditures, debt service obligations, adoption and use of artificial intelligence technologies, the impact on our business from the acquisition of e-TeleQuote and our ability to successfully integrate e-TeleQuote’s operations, technologies and employees into our business, are forward-looking statements.
In some cases, you can identify forward-looking statements by terms such as “may,” “will,” “should,” “aims,” “expects,” “plans,” “anticipates,” “could,” “intends,” “targets,” “projects,” “contemplates,” “believes,” “estimates,” “predicts,” “potential,” “likely,” “future” or “continue” or the negative of these terms or other similar expressions. The forward-looking statements in this press release are only predictions, projections and other statements about future events that are based on current expectations and assumptions. Accordingly, we caution you that any such forward-looking statements are not guarantees of future performance and are subject to risks, assumptions and uncertainties that are difficult to predict. Although we believe that the expectations reflected in these forward-looking statements are reasonable as of the date made, actual results may prove to be materially different from the results expressed or implied by the forward-looking statements.
These forward-looking statements speak only as of the date of this press release and are subject to a number of important factors that could cause actual results to differ materially from those in the forward-looking statements, including the factors described in the sections titled “Summary Risk Factors,” “Risk Factors” and “Management’s Discussion and Analysis of Financial Condition and Results of Operations” in our Annual Report on Form 10-K for the fiscal year ended December 31, 2023 (“2023 Annual Report on Form 10-K”) and our forthcoming Annual Report on Form 10-K for the fiscal year ended December 31, 2024 (“2024 Annual Report on Form 10-K”), as well as our other filings with the Securities and Exchange Commission. The factors described in our 2023 Annual Report on Form 10-K and our forthcoming 2024 Annual Report on Form 10-K should not be construed as exhaustive and should be read together with the other cautionary statements included in this press release, as well as the cautionary statements and other risk factors set forth in the Quarterly Report on Form 10-Q for the first fiscal quarter ended March 31, 2024, the Quarterly Report on Form 10-Q for the second fiscal quarter ended June 30, 2024, the Quarterly Report on Form 10-Q for the third quarter ended September 30, 2024 and in our other filings with the Securities and Exchange Commission.
You should read this press release and the documents that we reference in this press release completely and with the understanding that our actual future results may be materially different from what we expect. We qualify all of our forward-looking statements by these cautionary statements. Except as required by applicable law, we do not plan to publicly update or revise any forward-looking statements contained herein, whether as a result of any new information, future events, changed circumstances or otherwise.
BOCA RATON, Fla.–(BUSINESS WIRE)–Feb. 27, 2025– The GEO Group, Inc. (NYSE: GEO) (“GEO” or the “Company”) announced today that it has been awarded a 15-year, fixed-price contract by U.S. Immigration and Customs Enforcement (“ICE”) to provide support services for the establishment of a federal immigration processing center at the company-owned, 1,000-bed Delaney Hall Facility (the “Facility”) in Newark, New Jersey. GEO’s support services include the exclusive use of the Facility by ICE, along with security, maintenance, and food services, as well as access to recreational amenities, medical care, and legal counsel.
The new support services contract is expected to generate in excess of $60 million in annualized revenues for GEO in the first full year of operations, with margins consistent with GEO’s company-owned Secure Services facilities. GEO estimates the 15-year value of the contract with normal cost of living adjustments to be approximately $1 billion. GEO expects to reactivate the Facility in the second quarter of 2025 with revenues and earnings from the new contract normalizing during the second half of 2025.
George C. Zoley, Executive Chairman of GEO, said, “Our company-owned Delaney Hall Facility will play an important role in providing needed detention bedspace and support services for ICE in the Northeast. We are continuing to prepare for what we believe is an unprecedented opportunity to help the federal government meet its expanded immigration enforcement priorities. We are taking several important steps to meet this opportunity, including making a previously announced $70 million investment in capital expenditures to strengthen our capabilities to deliver expanded detention capacity, secure transportation, and electronic monitoring and related services to ICE and the federal government.”
About The GEO Group The GEO Group, Inc. (NYSE: GEO) is a leading diversified government service provider, specializing in design, financing, development, and support services for secure facilities, processing centers, and community reentry centers in the United States, Australia, South Africa, and the United Kingdom. GEO’s diversified services include enhanced in-custody rehabilitation and post-release support through the award-winning GEO Continuum of Care®, secure transportation, electronic monitoring, community-based programs, and correctional health and mental health care. GEO’s worldwide operations include the ownership and/or delivery of support services for 99 facilities totaling approximately 79,000 beds, including idle facilities and projects under development, with a workforce of up to approximately 18,000 employees.
Use of forward-looking statements This news release may contain “forward-looking statements” within the meaning of Section 21E of the Securities Exchange Act of 1934, as amended, and the U.S. Private Securities Litigation Reform Act of 1995. Readers are cautioned not to place undue reliance on these forward-looking statements and any such forward-looking statements are qualified in their entirety by reference to the cautionary statements and risk factors contained in GEO’s filings with the U.S. Securities and Exchange Commission including its Form 10-K, 10-Q and 8-K reports. All forward-looking statements speak only as of the date of this news release and are based on current expectations and involve a number of assumptions, risks and uncertainties that could cause the actual results to differ materially from such forward-looking statements. Readers are strongly encouraged to read the full cautionary statements and risk factors contained in GEO’s filings with the U.S. Securities and Exchange Commission, including those referenced above. GEO disclaims any obligation to update or revise any forward-looking statements, except as required by law.
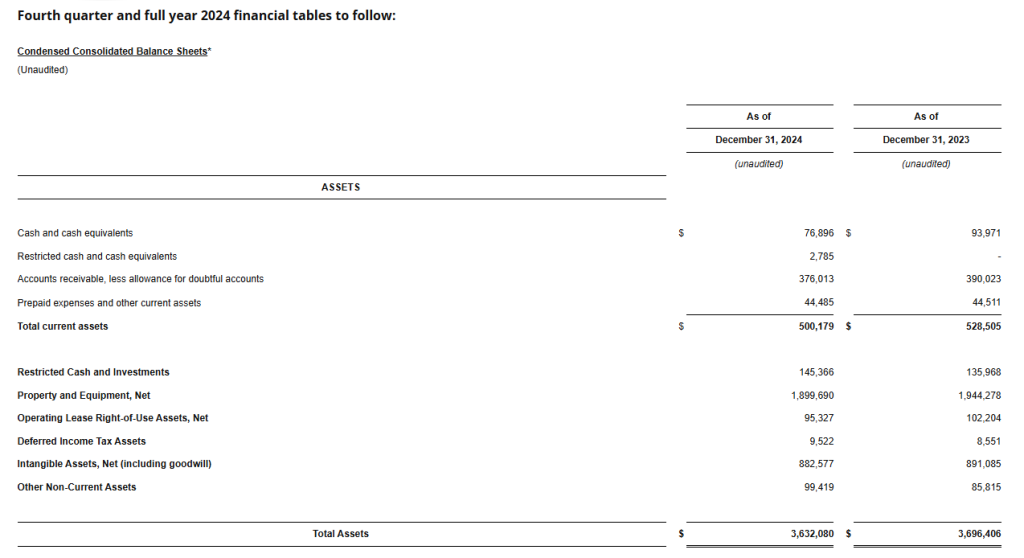
BOCA RATON, Fla.–(BUSINESS WIRE)–Feb. 27, 2025– The GEO Group, Inc. (NYSE: GEO) (“GEO”), a leading provider of contracted support services for secure facilities, processing centers, and reentry centers, as well as enhanced in-custody rehabilitation, post-release support, and electronic monitoring programs, reported today its financial results for the fourth quarter and full year 2024.
Fourth Quarter 2024 Highlights
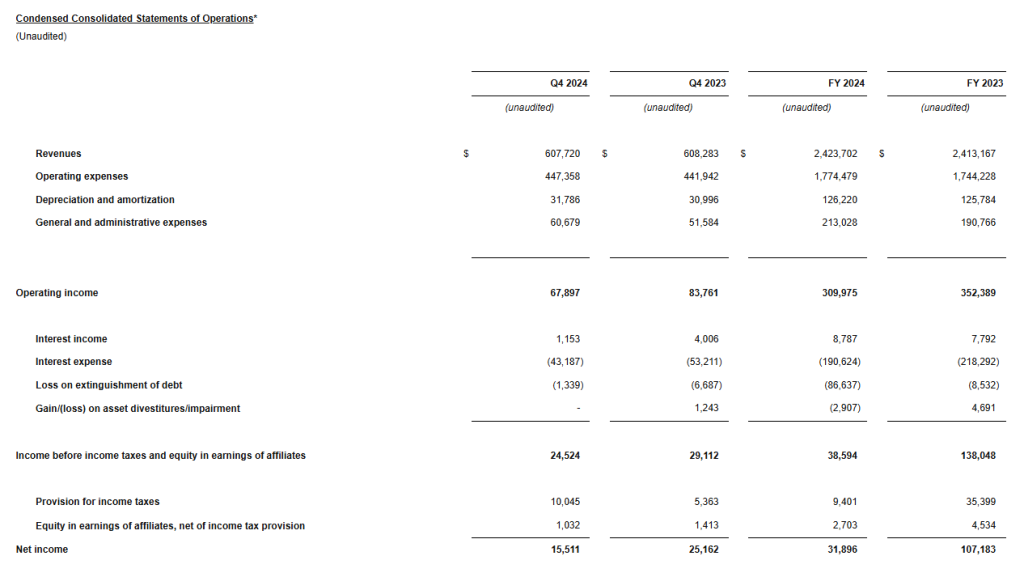
Total revenues of $607.7 million
Net Income of $15.5 million
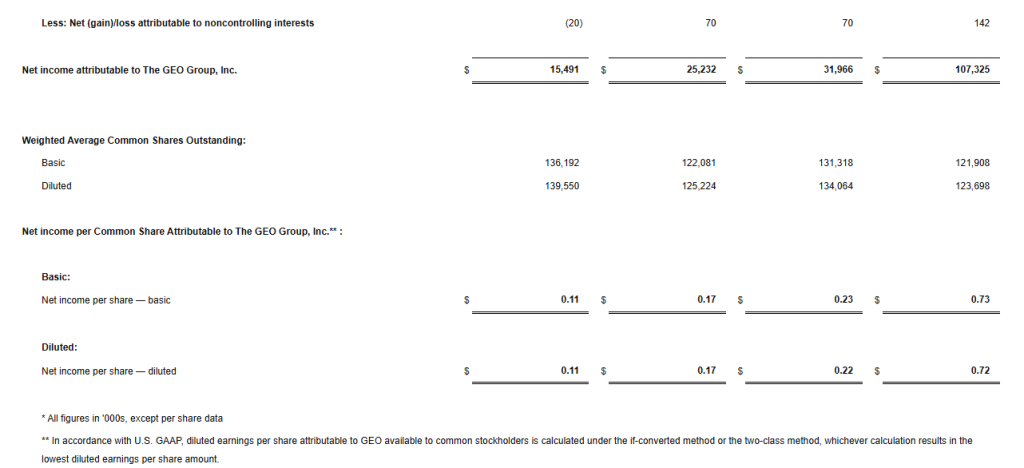
Net Income Attributable to GEO of $0.11 per diluted share
Adjusted Net Income of $0.13 per diluted share
Adjusted EBITDA of $108.0 million
For the fourth quarter 2024, we reported net income attributable to GEO of $15.5 million, or $0.11 per diluted share, compared to net income attributable to GEO of $25.2 million, or $0.17 per diluted share, for the fourth quarter 2023.
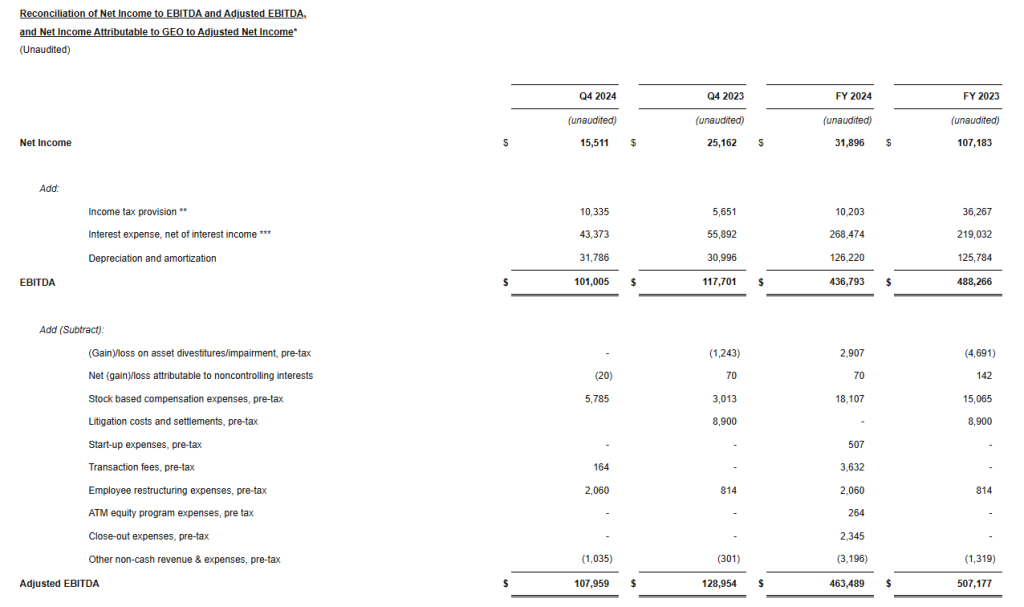
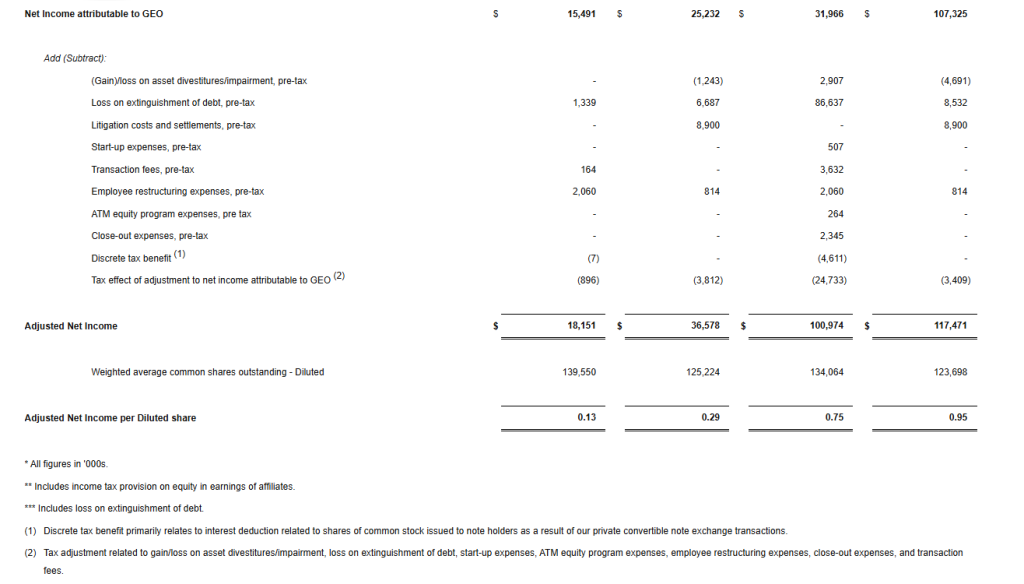
Fourth quarter 2024 results reflect costs associated with the extinguishment of debt of $1.3 million, pre-tax, $0.2 million in transaction fees, pre-tax, and $2.1 million in employee restructuring expenses, pre-tax. Excluding these unusual items, we reported adjusted net income for the fourth quarter 2024 of $18.2 million, or $0.13 per diluted share, compared to $36.6 million, or $0.29 per diluted share, for the fourth quarter 2023.
We reported total revenues for the fourth quarter 2024 of $607.7 million compared to $608.3 million for the fourth quarter 2023. We reported fourth quarter 2024 Adjusted EBITDA of $108.0 million, compared to $129.0 million for the fourth quarter 2023.
Our fourth quarter of 2024 results reflect higher general and administrative expenses, which were partly the result of the previously announced reorganization of our management team and additional professional fees we incurred in anticipation of future growth projects and related operational activity during 2025.
Our revenues for the fourth quarter of 2024 increased sequentially from the third quarter of 2024 and were in line with our previous guidance; however, our earnings and Adjusted EBITDA were below our previous expectations, primarily due to the higher general and administrative expenses incurred during the fourth quarter of 2024.
George C. Zoley, Executive Chairman of GEO, said, “During the fourth quarter of 2024, we completed the previously announced reorganization of our senior management team and incurred additional professional fees in anticipation of what we expect to be unprecedented future growth opportunities and significant operational activity during 2025. In 2024, we also incurred $9 million of our previously announced $70 million investment to strengthen our capabilities to deliver expanded detention capacity, secure transportation, and electronic monitoring services to U.S. Immigration and Customs Enforcement (“ICE”) and the federal government.
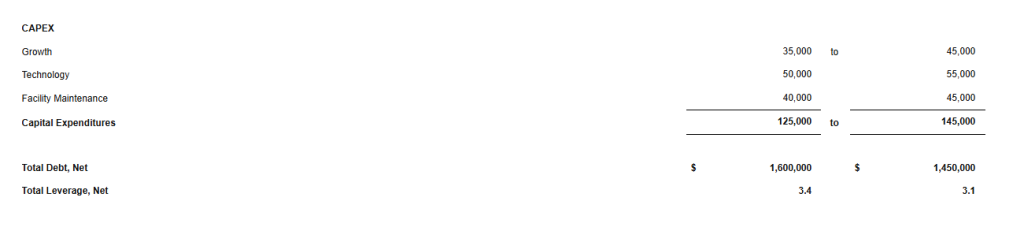
In addition to taking these important steps, we remain focused on reducing our net debt, deleveraging our balance sheet, and exploring options to return capital to shareholders in the future. In 2025, we expect to further reduce our total net debt by approximately $150 million to $175 million, bringing our total net debt to approximately $1.55 billion.”
Full Year 2024 Highlights
Total revenues of $2.42 billion
Net Income of $31.9 million
Net Income Attributable to GEO of $0.22 per diluted share, reflects costs associated with the extinguishment of debt of $86.6 million, pre-tax
Adjusted Net Income of $0.75 per diluted share
Adjusted EBITDA of $463.5 million
For the full year 2024, we reported net income attributable to GEO of $32.0 million, or $0.22 per diluted share, compared to net income attributable to GEO of $107.3 million, or $0.72 per diluted share, for the full year 2023. Results for the full year 2024 reflect costs associated with the extinguishment of debt of $86.6 million, pre-tax.
Excluding the costs associated with the extinguishment of debt and other unusual items, we reported adjusted net income for the full year 2024 of $101.0 million, or $0.75 per diluted share, compared to $117.5 million, or $0.95 per diluted share, for the full year 2023.
We reported total revenues for the full year 2024 of $2.42 billion compared to $2.41 billion for the full year 2023. We reported Adjusted EBITDA for the full year 2024 of $463.5 million, compared to $507.2 million for the full year 2023.
Financial Guidance
Today, we issued our initial financial guidance for 2025. Consistent with our long-standing practice, our initial guidance does not include the impact of any new contract awards that have not been previously announced.
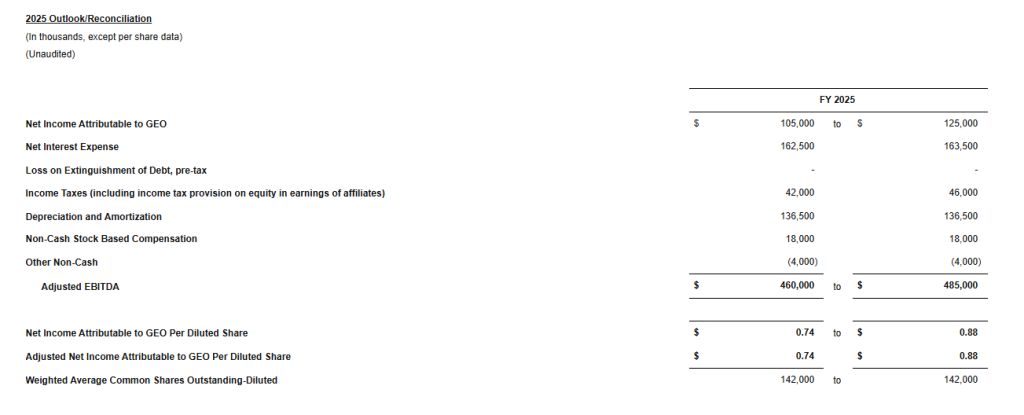
For the full year 2025, we expect Net Income Attributable to GEO to be in a range of 74 cents to 88 cents per diluted share, on revenues of approximately $2.5 billion and based on an effective tax rate of approximately 28 percent, inclusive of known discrete items. We expect our full year 2025 Adjusted EBITDA to be between $460 million and $485 million.
While our initial financial guidance for 2025 does not include an assumption for any new contract awards that have not been previously announced, we anticipate several additional opportunities could materialize during the year, which would provide significant upside to our current forecast. As we progress through the year and the likelihood and timing of these opportunities become clearer, we will adjust our 2025 financial guidance accordingly.
We expect total Capital Expenditures for the full year 2025 to be between $125 million and $145 million, including the impact of the $70 million investment we announced in December of 2024 to strengthen our capabilities to deliver expanded detention capacity, secure transportation, and electronic monitoring services to ICE and the federal government. This incremental $70 million investment is comprised of $47 million to renovate existing Secure Services facilities, $9 million of which was already spent in 2024; $16 million to ramp up the production of additional GPS tracking devices; and $7 million to expand our secure transportation assets.
Recent Developments
We announced today that we have been awarded a 15-year, fixed-price contract by ICE to provide support services for the establishment of a federal immigration processing center at the company-owned, 1,000-bed Delaney Hall Facility (the “Facility”) in Newark, New Jersey. GEO’s support services include the exclusive use of the Facility by ICE, along with security, maintenance, and food services, as well as access to recreational amenities, medical care, and legal counsel.
The new support services contract is expected to generate in excess of $60 million in annualized revenues for GEO in the first full year of operations, with margins consistent with GEO’s company-owned Secure Services facilities. GEO estimates the 15-year value of the contract with normal cost of living adjustments to be approximately $1 billion. GEO expects to reactivate the Facility in the second quarter of 2025 with revenues and earnings from the new contract normalizing during the second half of 2025.
Balance Sheet
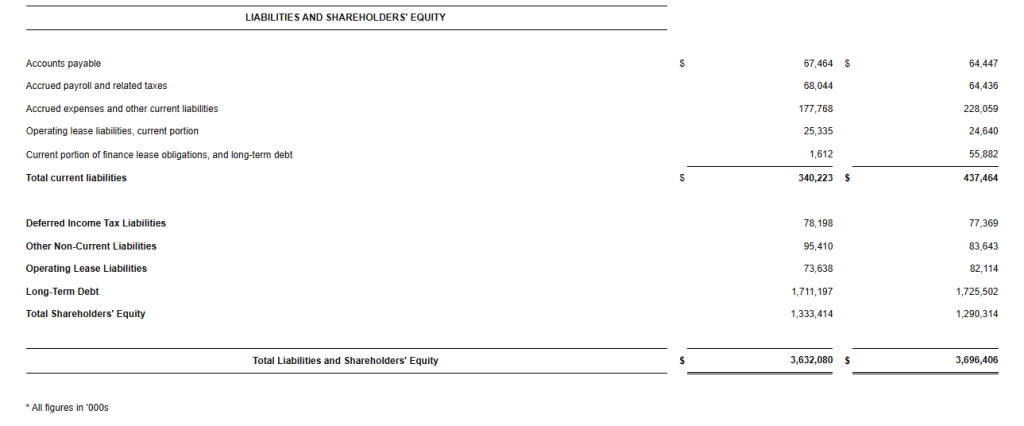
At the end of the fourth quarter 2024, our net debt totaled approximately $1.7 billion, and our net leverage was approximately 3.7 times Adjusted EBITDA. We ended the fourth quarter of 2024 with approximately $77 million in cash and cash equivalents and approximately $214 million in total available liquidity.
Conference Call Information
We have scheduled a conference call and webcast for today at 11:00 AM (Eastern Time) to discuss our fourth quarter and full year 2024 financial results as well as our outlook. The call-in number for the U.S. is 1-877-250-1553 and the international call-in number is 1-412-542-4145. In addition, a live audio webcast of the conference call may be accessed on the Webcasts section under the News, Events and Reports tab of GEO’s investor relations webpage at investors.geogroup.com. A replay of the webcast will be available on the website for one year. A telephonic replay of the conference call will be available through March 6, 2025, at 1-877-344-7529 (U.S.) and 1-412-317-0088 (International). The participant passcode for the telephonic replay is 3882673.
About The GEO Group
The GEO Group, Inc. (NYSE: GEO) is a leading diversified government service provider, specializing in design, financing, development, and support services for secure facilities, processing centers, and community reentry centers in the United States, Australia, South Africa, and the United Kingdom. GEO’s diversified services include enhanced in-custody rehabilitation and post-release support through the award-winning GEO Continuum of Care®, secure transportation, electronic monitoring, community-based programs, and correctional health and mental health care. GEO’s worldwide operations include the ownership and/or delivery of support services for 99 facilities totaling approximately 79,000 beds, including idle facilities and projects under development, with a workforce of up to approximately 18,000 employees.
Reconciliation Tables and Supplemental Information
GEO has made available Supplemental Information which contains reconciliation tables of Net Income Attributable to GEO to Adjusted Net Income, and Net Income to EBITDA and Adjusted EBITDA, along with supplemental financial and operational information on GEO’s business and other important operating metrics. The reconciliation tables are also presented herein. Please see the section below titled “Note to Reconciliation Tables and Supplemental Disclosure – Important Information on GEO’s Non-GAAP Financial Measures” for information on how GEO defines these supplemental Non-GAAP financial measures and reconciles them to the most directly comparable GAAP measures. GEO’s Reconciliation Tables can be found herein and in GEO’s Supplemental Information available on GEO’s investor webpage at investors.geogroup.com.
Note to Reconciliation Tables and Supplemental Disclosure – Important Information on GEO’s Non-GAAP Financial Measures
Adjusted Net Income, EBITDA, and Adjusted EBITDA are non-GAAP financial measures that are presented as supplemental disclosures. GEO has presented herein certain forward-looking statements about GEO’s future financial performance that include non-GAAP financial measures, including Net Debt, Net Leverage, and Adjusted EBITDA.
The determination of the amounts that are included or excluded from these non-GAAP financial measures is a matter of management judgment and depends upon, among other factors, the nature of the underlying expense or income amounts recognized in a given period.
While we have provided a high level reconciliation for the guidance ranges for full year 2025, we are unable to present a more detailed quantitative reconciliation of the forward-looking non-GAAP financial measures to their most directly comparable forward-looking GAAP financial measures because management cannot reliably predict all of the necessary components of such GAAP measures.
The quantitative reconciliation of the forward-looking non-GAAP financial measures will be provided for completed annual and quarterly periods, as applicable, calculated in a consistent manner with the quantitative reconciliation of non-GAAP financial measures previously reported for completed annual and quarterly periods.
Net Debt is defined as gross principal debt less cash from restricted subsidiaries. Net Leverage is defined as Net Debt divided by Adjusted EBITDA.
EBITDA is defined as net income adjusted by adding provisions/(benefit) for income tax, interest expense, net of interest income, and depreciation and amortization. Adjusted EBITDA is defined as EBITDA adjusted for (gain)/loss on asset divestitures/impairment, pre-tax, net loss attributable to non-controlling interests, stock-based compensation expenses, pre-tax, litigation costs and settlements, pre-tax, start-up expenses, pre-tax, transaction fees, pre-tax, one-time employee restructuring expenses, pre-tax, ATM equity program expenses, pre-tax, close-out expenses, pre-tax, other non-cash revenue and expenses, pre-tax, and certain other adjustments as defined from time to time.
Given the nature of our business as a real estate owner and operator, we believe that EBITDA and Adjusted EBITDA are helpful to investors as measures of our operational performance because they provide an indication of our ability to incur and service debt, to satisfy general operating expenses, to make capital expenditures, and to fund other cash needs or reinvest cash into our business.
We believe that by removing the impact of our asset base (primarily depreciation and amortization) and excluding certain non-cash charges, amounts spent on interest and taxes, and certain other charges that are highly variable from year to year, EBITDA and Adjusted EBITDA provide our investors with performance measures that reflect the impact to operations from trends in occupancy rates, per diem rates and operating costs, providing a perspective not immediately apparent from net income.
The adjustments we make to derive the non-GAAP measures of EBITDA and Adjusted EBITDA exclude items which may cause short-term fluctuations in income from continuing operations and which we do not consider to be the fundamental attributes or primary drivers of our business plan and they do not affect our overall long-term operating performance.
EBITDA and Adjusted EBITDA provide disclosure on the same basis as that used by our management and provide consistency in our financial reporting, facilitate internal and external comparisons of our historical operating performance and our business units and provide continuity to investors for comparability purposes.
Adjusted Net Income is defined as net income/(loss) attributable to GEO adjusted for certain items which by their nature are not comparable from period to period or that tend to obscure GEO’s actual operating performance, including for the periods presented (gain)/loss on asset divestitures/impairment, pre-tax, loss on the extinguishment of debt, pre-tax, litigation costs and settlements, pre-tax, start-up expenses, pre-tax, transaction fees, pre-tax, one-time employee restructuring expenses, pre-tax, ATM equity program expenses, pre-tax, close-out expenses, pre-tax, discrete tax benefit, and tax effect of adjustments to net income attributable to GEO.
Safe-Harbor Statement
This press release contains forward-looking statements regarding future events and future performance of GEO that involve risks and uncertainties that could materially and adversely affect actual results, including statements regarding GEO’s financial guidance for the full year of 2025, statements regarding GEO’s focus on reducing net debt, deleveraging its balance sheet, positioning itself to explore options to return capital to shareholders in the future, making investments to strengthen GEO’s capabilities and deliver expanded detention capacity, secure transportation, and electronic monitoring services, pursuing unprecedented future growth opportunities and significant operational activity, and the upside this could have on GEO’s future financial results and financial guidance, and GEO’s ability to scale up the delivery of diversified services to support the future needs of its government agency partners. Forward-looking statements generally can be identified by the use of forward-looking terminology such as “may,” “will,” “expect,” “anticipate,” “intend,” “plan,” “believe,” “seek,” “estimate,” or “continue” or the negative of such words and similar expressions. Risks and uncertainties that could cause actual results to vary from current expectations and forward-looking statements contained in this press release include, but are not limited to: (1) GEO’s ability to meet its financial guidance for 2025 given the various risks to which its business is exposed; (2) GEO’s ability to deleverage and repay, refinance or otherwise address its debt maturities in an amount and on terms commercially acceptable to GEO, and on the timeline it expects or at all; (3) GEO’s ability to identify and successfully complete any potential sales of company-owned assets and businesses or potential acquisitions of assets or businesses on commercially advantageous terms on a timely basis, or at all; (4) changes in federal and state government policy, orders, directives, legislation and regulations that affect public-private partnerships with respect to secure, correctional and detention facilities, processing centers and reentry centers; (5) changes in federal immigration policy; (6) public and political opposition to the use of public-private partnerships with respect to secure correctional and detention facilities, processing centers and reentry centers; (7) any continuing impact of the COVID-19 global pandemic on GEO and GEO’s ability to mitigate the risks associated with COVID-19; (8) GEO’s ability to sustain or improve company-wide occupancy rates at its facilities; (9) fluctuations in GEO’s operating results, including as a result of contract terminations, contract renegotiations, changes in occupancy levels and increases in GEO’s operating costs; (10) general economic and market conditions, including changes to governmental budgets and its impact on new contract terms, contract renewals, renegotiations, per diem rates, fixed payment provisions, and occupancy levels; (11) GEO’s ability to address inflationary pressures related to labor related expenses and other operating costs; (12) GEO’s ability to timely open facilities as planned, profitably manage such facilities and successfully integrate such facilities into GEO’s operations without substantial costs; (13) GEO’s ability to win management contracts for which it has submitted proposals and to retain existing management contracts; (14) risks associated with GEO’s ability to control operating costs associated with contract start-ups; (15) GEO’s ability to successfully pursue growth opportunities and continue to create shareholder value; (16) GEO’s ability to obtain financing or access the capital markets in the future on acceptable terms or at all; and (17) other factors contained in GEO’s Securities and Exchange Commission periodic filings, including its Form 10-K, 10-Q and 8-K reports, many of which are difficult to predict and outside of GEO’s control.
SAN DIEGO, Feb. 26, 2025 (GLOBE NEWSWIRE) — Kratos Defense & Security Solutions, Inc. (Nasdaq: KTOS), a technology company in the defense, national security and global markets, and RAFAEL Advanced Defense Systems Ltd., today announced an approximate 50/50 partnership for the establishment of a U.S.-based merchant supplier of solid rocket motors (SRMs) and other energetics. The new joint venture, named Prometheus Energetics (“Prometheus”), is set to be headquartered on an approximate 500-acre site near the United States Navy and Army facility in Crane, Indiana.
Kratos and RAFAEL (through its U.S. based subsidiary RAFAEL USA) have jointly committed up to $175 million in capital for the establishment of Prometheus and required property, plant, equipment and personnel needed for the new, state-of-the-art energetics manufacturing campus and facilities. After construction of the plant and once RAFAEL’s technology transfer is completed and certified for operations, Prometheus is projected to begin production in 2027 of SRMs.
RAFAEL is the developer and manufacturer of unique, world-renowned systems such as the Iron Dome and the TROPHY APS which are in service in the Israeli Defense Forces as well as the David’s Sling which provides the middle layer of air defense for the state of Israel. The company, originally established as the IDF Science Corps, has developed groundbreaking technologies like high energy laser solutions like the Iron Beam which are expected to be operational by the end of 2025. The company functions through a vertical integration structure that enables a unique ability to meet the demands and overcome the challenges of the global market and supply chain. RAFAEL offers a diverse portfolio from new space to the ground battlespace with battle-proven technologies.
Kratos is a leader in hypersonic or advanced systems, strategic systems, ballistic missile targets, sub-orbital research vehicles, sounding rockets, and solid rocket motors. Kratos has served the U.S. advanced systems and missile defense communities for decades, delivering numerous novel systems and vehicle flight tests. Kratos is the only company today delivering both propulsion and advanced flight systems, with Kratos advanced systems including the low-cost Erinyes Glide Vehicle, Dark Fury, Zeus and Oriole Solid Rocket Motors, and other Kratos systems and technologies. Kratos provides unmatched innovation, disruptive capabilities, mission responsiveness and affordability to our customers across our portfolio of systems.
Eric DeMarco, President and CEO of Kratos Defense, said, “We believe Prometheus, once up and running at full rate production, will be a step function catalyst in value creation for Kratos’ stakeholders and the U.S. defense industrial base, similar to Kratos’ recent MACH-TB contract award—the largest single-award contract in Kratos history. Like other major Kratos investments such as Oriole, Zeus, and Erinyes, Prometheus responds to a critical need to strengthen the U.S. Industrial Base and will also provide tens of thousands of SRMs and casted warheads supporting both America’s most reliable partner in the Middle East and United States national security related demand from a true SRM and energetics merchant supplier.”
Kratos will reflect Prometheus in its consolidated financial statements on the Equity Method of Accounting, under which Kratos will record approximately 50 percent of Prometheus Net Income on a single line “Net Income from Prometheus Energetics” in its income statement, and Kratos will annually receive approximately 50 percent of the Free Cash Flow generated from Prometheus. Kratos intends to continue to report Kratos Operating Income, Net Income, Adjusted EBITDA and other financial matrices separate from the Prometheus results, in order for all Kratos stakeholders to be able to follow the progress of each Company, the investment made in Prometheus and the future return on Kratos’ investment in Prometheus.
RAFAEL Advanced Defense Systems Ltd., one of Israel’s largest defense contractors, develops, manufactures, and sustains combat-proven technologies, products, and systems-of-systems for air, land, naval, space and digital applications. RAFAEL’s delivery of combat-proven systems is supported by vertically integrated facilities and engineering teams servicing the development and production of SRMs and warhead (WH) products that play a critical role in Israel’s Iron Dome, the world’s premier air defense system designed to intercept and destroy short-range rockets, artillery shells, UAVs, and other aerial threats. This vertical integration has made RAFAEL a leading expert in SRMs and WH development and production, allowing it to continuously expand capabilities and push the envelope in technology, performance, and fielding of effective systems. RAFAEL’s multi-dimensional portfolio and unique innovative capabilities have enabled the development of world-leading technologies across all spheres.
Yoav Tourgeman, President and CEO of RAFAEL Advanced Defense Systems Ltd., said: “The establishment of Prometheus Energetics is a strategic leap forward, reinforcing RAFAEL’s commitment to strengthening the U.S. defense industrial base while ensuring our allies and partners have access to the most advanced, combat-proven energetics solutions. This step constitutes a strategic vector that combines business considerations in the American market with the increasing demand for energetic products, while significantly enhancing our ability to deliver resilient and reliable supply solutions to our customers. Through this joint venture, we are deepening our longstanding partnership with the United States, strengthening supply chain independence, and bolstering the critical capabilities needed to address evolving national security challenges.”
About Kratos Defense & Security Solutions Kratos Defense & Security Solutions, Inc. (NASDAQ: KTOS) is a technology, products, system and software company addressing the defense, national security, and commercial markets. Kratos makes true internally funded research, development, capital and other investments, to rapidly develop, produce and field solutions that address our customers’ mission critical needs and requirements. At Kratos, affordability is a technology, and we seek to utilize proven, leading edge approaches and technology, not unproven bleeding edge approaches or technology, with Kratos’ approach designed to reduce cost, schedule and risk, enabling us to be first to market with cost effective solutions. We believe that Kratos is known as an innovative disruptive change agent in the industry, a company that is an expert in designing products and systems up front for successful rapid, large quantity, low-cost future manufacturing which is a value add competitive differentiator for our large traditional prime system integrator partners and also to our government and commercial customers. Kratos intends to pursue program and contract opportunities as the prime or lead contractor when we believe that our probability of win (PWin) is high and any investment required by Kratos is within our capital resource comfort level. We intend to partner and team with a large, traditional system integrator when our assessment of PWin is greater or required investment is beyond Kratos’ comfort level. Kratos’ primary business areas include virtualized ground systems for satellites and space vehicles including software for command & control (C2) and telemetry, tracking and control (TT&C), jet powered unmanned aerial drone systems, advanced vehicles and rocket systems, propulsion systems for drones, missiles, loitering munitions, supersonic systems, space craft and launch systems, C5ISR and microwave electronic products for missile, radar, missile defense, space, satellite, counter UAS, directed energy, communication and other systems, and virtual & augmented reality training systems for the warfighter. For more information, visit www.KratosDefense.com.
About RAFAEL Advanced Defense Systems Ltd. Established in 1948, RAFAEL Advanced Defense Systems Ltd. develops, manufactures, and sustains combat-proven technologies, products, and systems-of-systems for air, land, naval, space and digital applications. As the developer of two integral layers of Israel’s multi-layered air defense array and the developer of the world’s only operation active protection system TROPHY APS, the company offers innovative and proven solutions for the global market. RAFAEL’s air defense portfolio has achieved international recognition from Iron Dome to David’s Sling and is expected to provide the first ever operational high-energy laser weapon system to the IDF by 2025. The company has bolstered its international standing as a top-tier defense manufacturer by through an innovative approach of vertical integration enabling seamless technology transfer and local production, making it a trusted partner for defense solutions in global markets, particularly in the U.S. where its systems strengthen national security priorities. Leveraging its technological ingenuity, operational experience, and unparalleled understanding of evolving combat requirements, RAFAEL provides global warfighters with today’s most advanced technologies and life-saving defense solutions that ensure operational superiority. RAFAEL’s strategy includes strategic international partnerships and localization to ensure customer sovereignty. For more information on RAFAEL, please visit https://www.rafael.co.il/
Notice Regarding Forward-Looking Statements Certain statements in this press release may constitute “forward-looking statements” within the meaning of the Private Securities Litigation Reform Act of 1995. These forward-looking statements are made on the basis of the current beliefs, expectations and assumptions of the management of Kratos and are subject to significant risks and uncertainty. Investors are cautioned not to place undue reliance on any such forward-looking statements. All such forward-looking statements speak only as of the date they are made, and Kratos undertakes no obligation to update or revise these statements, whether as a result of new information, future events or otherwise. Although Kratos believes that the expectations reflected in these forward-looking statements are reasonable, these statements involve many risks and uncertainties that may cause actual results to differ materially from what may be expressed or implied in these forward-looking statements. For a further discussion of risks and uncertainties that could cause actual results to differ from those expressed in these forward-looking statements, as well as risks relating to the business of Kratos in general, see the risk disclosures in the Annual Report on Form 10-K of Kratos for the year ended December 29, 2024, and in subsequent reports on Forms 10-Q and 8-K and other filings made with the SEC by Kratos.
NEW ALBANY, Ohio, Feb. 26, 2025 (GLOBE NEWSWIRE) — Commercial Vehicle Group (the “Company” or “CVG”) (NASDAQ: CVGI) will hold its quarterly conference call on Tuesday, March 11, 2025, at 8:30 a.m. ET, to discuss fourth quarter and full year 2024 financial results. CVG will issue a press release and presentation prior to the conference call.
Toll-free participants dial (800) 549-8228 using conference code 45919. International participants dial (289) 819-1520 using conference code 45919. This call is being webcast and can be accessed through the “Investors” section of CVG’s website at ir.cvgrp.com where it will be archived for one year.
A telephonic replay of the conference call will be available until March 25, 2025. To access the replay, toll-free callers can dial (+1) 888 660 6264 using access code 45919#, and toll callers in North America and other locations can dial (+1) 289 819 1325.
About CVG
At CVG, we deliver real solutions to complex design, engineering and manufacturing problems while creating positive change for our customers, industries, and communities we serve. Information about the Company and its products is available on the internet at www.cvgrp.com.
Investor Relations Contact: Ross Collins or Stephen Poe Alpha IR Group [email protected]
Full Year 2024 Revenues of $1.136 Billion Reflect 9.6 Percent Growth and 9.1 Percent Organic Growth, Respectively, Over Full Year 2023 Revenues of $1.037 Billion
Full Year 2024 Unmanned Systems Revenues of $270.5 Million Reflect 27.5 Percent Growth and 25.1 Percent Organic Growth Over Full Year 2023 Revenues of $212.2 Million
Full Year 2024 KGS Revenues of $865.8 Million Reflect 5.0 Percent Organic Growth of $40.9 Million Over Full Year 2023 Revenues of $824.9 Million
Full Year 2024 Net Income of $16.3 Million and GAAP EPS of $0.11 Per Share
Fourth Quarter 2024 Revenues of $283.1 Million Reflect 3.4 Percent Growth Over Fourth Quarter 2023 Revenues of $273.8 Million
Fourth Quarter 2024 Cash Flow Generated from Operations and Free Cash Flow of $45.6 million and $32.0 million, Respectively
Fourth Quarter 2024 Consolidated Book to Bill Ratio of 1.5 to 1 and Bookings of $434.2 Million
Last Twelve Months Ended December 29, 2024 Consolidated Book to Bill Ratio of 1.2 to 1 and Bookings of $1.354 Billion
2025 Financial Forecast Includes 10 Percent Organic Revenue Growth and 2026 Initial Revenue Growth Forecast of 13 to 15 Percent over 2025 Forecast Based on Recent Program Awards
SAN DIEGO, Feb. 26, 2025 (GLOBE NEWSWIRE) — Kratos Defense & Security Solutions, Inc. (Nasdaq: KTOS), a Technology Company in the Defense, National Security and Commercial Markets, today reported its fourth quarter 2024 financial results, including Revenues of $283.1 million, Operating Income of $3.0 million, Net Income attributable to Kratos of $3.9 million, Adjusted EBITDA of $25.2 million and a consolidated book to bill ratio of 1.5 to 1.0.
Fourth quarter 2024 Net Income and Operating Income includes non-cash stock compensation expense of $6.8 million, Company-funded Research and Development (R&D) expense of $10.6 million, including efforts in our Space, Satellite, Unmanned Systems and Microwave Electronic businesses, and expense to accrue $3.2 million related to an employee benefit plan assumed by the Company in an acquisition completed in 2011.
Kratos reported fourth quarter 2024 GAAP Net Income attributable to Kratos of $3.9 million and GAAP Net Income per share of $0.03, compared to GAAP Net Income attributable to Kratos of $2.4 million and GAAP Net Income per share of $0.02, for the fourth quarter of 2023. Adjusted earnings per share (EPS) was $0.13 for the fourth quarter of 2024, compared to $0.12 for the fourth quarter of 2023.
Fourth quarter 2024 Revenues of $283.1 million increased $9.3 million, reflecting 3.4 percent organic growth from fourth quarter 2023 Revenues of $273.8 million. Organic revenue growth was reported in both our Unmanned Systems and KGS segments, with KGS growth including increased revenues in Kratos Turbine Technologies, Defense Rocket Systems, Microwave Products, and C5ISR, offset by the previously reported and expected decline of approximately $16.1 million in the Space and Satellite business, including the industry related impact from OEM delays in the manufacture and delivery of software defined satellites.
Fourth quarter 2024 Cash Flow Generated from Operations was $45.6 million, primarily reflecting the receipt of accelerated favorable customer milestone payments, and increases in deferred revenues or customer advanced payments to $76.3 million at the end of the fourth quarter of 2024, up from $61.9 million at the end of the third quarter of 2024. Free Cash Flow Generated from Operations for the Fourth Quarter of 2024 was $32.0 million after funding of $13.6 million of capital expenditures.
For the fourth quarter of 2024, Kratos’ Unmanned Systems (KUS) segment generated Revenues of $61.1 million and organic revenue growth of 10.3 percent, as compared to $55.4 million in the fourth quarter of 2023, primarily reflecting increased target drone sales. KUS’s Operating Loss was $0.7 million in the fourth quarter of 2024, compared to Operating Income of $1.0 million in the fourth quarter of 2023. KUS’s Adjusted EBITDA for the fourth quarter of 2024 was $2.6 million, compared to $4.0 million for the fourth quarter 2023, reflecting revenue mix, the impact of increased material and subcontractor costs on multi-year fixed price contracts and increased R&D costs.
KUS’s book-to-bill ratio for the fourth quarter of 2024 was 1.3 to 1.0 and 1.2 to 1.0 for the twelve months ended December 29, 2024, with bookings of $82.4 million for the three months ended December 29, 2024, and bookings of $326.8 million for the twelve months ended December 29, 2024. Total backlog for KUS at the end of the fourth quarter of 2024 was $295.2 million compared to $273.9 million at the end of the third quarter of 2024 and $239.0 million at the end of the fourth quarter of 2023.
For the fourth quarter of 2024, Kratos’ Government Solutions (KGS) segment Revenues of $222.0 million increased from Revenues of $218.4 million in the fourth quarter of 2023, reflecting a 1.6 percent growth and organic growth rate. The increased Revenues includes organic revenue growth in our Turbine Technologies, C5ISR, Defense Rocket Support and Microwave Products businesses of $19.7 million, offset by the previously reported and expected decline of approximately $16.1 million in the Space and Satellite business.
KGS reported Operating Income of $11.0 million in the fourth quarter of 2024 compared to $17.5 million in the fourth quarter of 2023, primarily reflecting the mix in revenues and resources as well as the expense to accrue $3.2 million in the fourth quarter of 2024 related to a benefit plan assumed by the Company in a previous acquisition. Fourth quarter 2024 KGS Adjusted EBITDA was $22.6 million, compared to fourth quarter 2023 KGS Adjusted EBITDA of $25.1 million, primarily reflecting the mix in revenues and resources.
KGS reported a book-to-bill ratio of 1.6 to 1.0 for the fourth quarter of 2024, a book to bill ratio of 1.2 to 1.0 for the last twelve months ended December 29, 2024 and bookings of $351.8 million and $1.028 billion for the three and last twelve months ended December 29, 2024, respectively. KGS’s total backlog at the end of the fourth quarter of 2024 was $1.150 billion, as compared to $1.020 billion at the end of the third quarter of 2024, and $988.0 million at the end of the fourth quarter of 2023.
Kratos reported consolidated bookings of $434.2 million and a book-to-bill ratio of 1.5 to 1.0 for the fourth quarter of 2024, and consolidated bookings of $1.354 billion and a book-to-bill ratio of 1.2 to 1.0 for the last twelve months ended December 29, 2024. Consolidated backlog was $1.445 billion on December 29, 2024, as compared to $1.294 billion at September 29, 2024 and $1.227 billion on December 31, 2023. Kratos’ bid and proposal pipeline was $12.4 billion at December 29, 2024, as compared to $11.0 billion at December 31, 2023. Backlog at December 29, 2024 included funded backlog of $1.090 billion and unfunded backlog of $355.0 million.
Full Year 2024 Results
Kratos reported its full year 2024 financial results, including Revenues of $1.136 billion, Operating Income of $29.0 million, Net Income attributable to Kratos of $16.3 million, Adjusted EBITDA of $105.7 million and a consolidated book to bill ratio of 1.2 to 1.0.
Included in the full year 2024 Net Income and Operating Income is non-cash stock compensation expense of $29.8 million, Company-funded Research and Development (R&D) expense of $40.3 million, including ongoing development efforts in our Space and Satellite Communications business to develop our first to market, virtual, software-based OpenSpace command & control (C2), telemetry tracking & control (TT&C) and other ground system solutions and ongoing development efforts in our Unmanned Systems and Microwave Products businesses, and an expense to accrue $3.2 million related to an employee benefit plan assumed by the Company in an acquisition completed in 2011.
Kratos reported full year 2024 GAAP Net Income of $16.3 million and GAAP Net Income per share of $0.11, compared to a GAAP Net Loss attributable to Kratos of $8.9 million and a GAAP Net Loss per share of $0.07, for the full year 2023. Adjusted earnings per share (EPS) was $0.49 for the full year 2024, compared to $0.42 for the full year 2023.
Full year 2024 Revenues of $1.136 billion increased $99.2 million, reflecting 9.6 percent growth and 9.1 percent organic growth, including the impact of the Sierra Technical Services, Inc. (STS) acquisition on a pro forma basis as if acquired at the beginning of 2023, respectively, from full year 2023 Revenues of $1.037 billion. Full year 2024 Cash Flow Generated from Operations was $49.7 million, including the receipt of accelerated favorable customer milestone payments, offset partially by working capital uses including increases in inventories, prepaid assets and investments in other assets and reduction of deferred revenues or advanced customer payments. Free Cash Flow Used in Operations was $8.5 million after funding of $58.2 million of capital expenditures. Full year 2024 capital expenditures were elevated due primarily to the manufacture of the two production lots of Valkyries prior to contract award to meet anticipated customer orders and requirements and due to investments related to the expansion and addition of production facilities.
For full year 2024, KUS generated Revenues of $270.5 million, as compared to $212.2 million in the full year 2023, reflecting 27.5 percent growth and 25.1 percent organic growth, including the impact of the STS acquisition on a pro forma basis as if acquired at the beginning of 2023, primarily reflecting increased domestic and international drone activity. KUS’s Operating Income was $2.9 million in full year 2024 compared to $4.2 million in full year 2023. KUS’s Adjusted EBITDA for full year 2024 was $16.3 million, compared to full year 2023 Adjusted EBITDA of $14.8 million, reflecting the increased volume partially offset by increased material and subcontractor costs on multi-year fixed price contracts and increased R&D costs.
For full year 2024, KGS Revenues of $865.8 million increased $40.9 million, reflecting 5.0 percent organic growth from Revenues of $824.9 million in full year 2023. The increased Revenues includes organic revenue growth in our Turbine Technologies, C5ISR, Microwave Products, Defense Rocket Support and Training Solutions businesses aggregating $88.7 million, offset by a reduction of $47.8 million in offset by the Space and Satellite business described previously.
KGS reported operating income of $56.6 million in full year 2024 compared to $52.7 million in full year 2023, primarily reflecting the increased revenue volume. Full year 2024 KGS Adjusted EBITDA was $89.4 million, compared to full year 2023 KGS Adjusted EBITDA of $80.6 million, primarily reflecting the increased revenue.
Eric DeMarco, Kratos’ President and CEO, said, “Kratos’ full year 2024 and fourth quarter demonstrated once again that we can significantly organically grow the business, and make sizable internally funded investments, positioning the Company for accelerating future growth, while also generating significant, positive operating cash flow. We have recently received several large new program and contract awards, including in the hypersonic, target drone, jet engine, rocket, and satellite system areas, enabling us to increase our expected revenue growth rate for 2026 to a range of 13 percent to 15 percent above our current 2025 financial forecast that we provided today, which includes 10 percent growth over 2024. Kratos’ fourth quarter 1.5 to 1.0 book to bill ratio and our $12.4 Billion opportunity pipeline also provides confidence in our expected accelerating future growth trajectory, with increased margins.”
Mr. DeMarco continued, “The Trump Administration has increased emphasis on reducing cost, rapidly fielding new technology and systems and getting more for less, all which are and have been pillars of Kratos’ Mission. At Kratos, “Affordability is a Technology” and “Better is the Enemy of Good Enough Ready to Field Today”, as represented in our Erinyes, Dark Fury and other hypersonic vehicles, our Zeus, Oriole and other rocket systems, and our jet drones, jet engines and propulsion systems. We believe Kratos’ alignment with the new Administration’s objectives will be recognized in increased bookings, increased expected future growth rates and increased future profitability, including as based on recent meetings and discussions with certain of our customers.”
Mr. DeMarco concluded, “After decades of focus on fighting terrorism and asymmetric warfare, the United States has begun a generational rebuild of its industrial base and the ability to deter and defeat Nation State adversaries. The Axis of Resistance and the threat to the U.S. and its Allies is real, and Kratos is a key element of the proven Peace through Overwhelming Strength approach to Global Security and stability. As a result, we expect a future, multiyear, up and to the right organic growth trajectory with increased margins and profitability, and Kratos making the necessary investments in, among other things, property, plant, and equipment, to successfully execute for our customers and country.”
Financial Guidance
We are providing our initial 2025 first quarter and full year 2025 financial guidance range, which includes our assumptions, including as related to: current forecasted business mix, employee sourcing, hiring and retention; manufacturing, production and supply chain disruptions; parts shortages and related continued significant cost and price increases in each of these areas, that are impacting the industry and Kratos. Additionally, a U.S. Government budget was not passed by October 1, 2024, the beginning of Federal Fiscal Year 2025, and as a result, Kratos and others in our industry are operating under a Continuing Resolution Authorization (CRA), which currently expires March 14, 2025, under which no new contracts and no increases in existing contracts production or funding, among other stipulations, is permitted. If the current CRA is not resolved by March 14, 2025, the industry and Kratos will have operated under CRAs, without a DoD Budget, for approximately 12 of the previous 18 months. Kratos has a number of new and existing programs and contracts which are directly being impacted by the current CRA. Kratos’ 2025 financial forecast and guidance provided today assumes that the current CRA will be resolved by March 14, 2025, and that a U.S. Federal and DoD budget which includes no unexpected funding cuts impacting our business occurs. If the current CRA goes substantially beyond the existing March 14, 2025 date, or if there are significant reductions or changes to programs, contracts or initiatives that Kratos is or expects to be involved with, we will evaluate Kratos’ 2025 and future financial forecasts at that time, based on the existing facts, circumstances and expectations and make any adjustments required.
Kratos’ 2025 financial forecast and guidance includes elevated investments for capital expenditures for property, plant and equipment, including the expansion of our manufacturing and production facilities and related inventory builds in our Rocket Systems and Hypersonic businesses, primarily related to the recent MACH-TB 2.0 contract award, the continued manufacture of two production lots of Valkyries prior to contract award, to meet anticipated customer orders and requirements, the expansion and build-out of the Company’s Microwave Products production facilities, the expansion and build-out of our small jet engine production and test cell facilities, and the build-out of additional secure facilities for our federal secured space communications business, in accordance with contract and customer requirements. Kratos’ operating cash flow guidance also assumes certain investments in our rocket systems and unmanned systems businesses.
Management will discuss the Company’s financial results, on a conference call beginning at 2:00 p.m. Pacific (5:00 p.m. Eastern) today. The call will be available at www.kratosdefense.com. Participants may register for the call using this Online Form. Upon registration, all telephone participants will receive the dial-in number along with a unique PIN that can be used to access the call. For those who cannot access the live broadcast, a replay will be available on Kratos’ website.
About Kratos Defense & Security Solutions
Kratos Defense & Security Solutions, Inc. (NASDAQ: KTOS) is a technology, products, system and software company addressing the defense, national security, and commercial markets. Kratos makes true internally funded research, development, capital and other investments, to rapidly develop, produce and field solutions that address our customers’ mission critical needs and requirements. At Kratos, affordability is a technology, and we seek to utilize proven, leading edge approaches and technology, not unproven bleeding edge approaches or technology, with Kratos’ approach designed to reduce cost, schedule and risk, enabling us to be first to market with cost effective solutions. We believe that Kratos is known as an innovative disruptive change agent in the industry, a company that is an expert in designing products and systems up front for successful rapid, large quantity, low cost future manufacturing which is a value add competitive differentiator for our large traditional prime system integrator partners and also to our government and commercial customers. Kratos intends to pursue program and contract opportunities as the prime or lead contractor when we believe that our probability of win (PWin) is high and any investment required by Kratos is within our capital resource comfort level. We intend to partner and team with a large, traditional system integrator when our assessment of PWin is greater or required investment is beyond Kratos’ comfort level. Kratos’ primary business areas include virtualized ground systems for satellites and space vehicles including software for command & control (C2) and telemetry, tracking and control (TT&C), jet powered unmanned aerial drone systems, hypersonic vehicles and rocket systems, propulsion systems for drones, missiles, loitering munitions, supersonic systems, space craft and launch systems, C5ISR and microwave electronic products for missile, radar, missile defense, space, satellite, counter UAS, directed energy, communication and other systems, and virtual & augmented reality training systems for the warfighter. For more information, visit www.KratosDefense.com
Notice RegardingForward–LookingStatements This news release contains certain forward-looking statements that involve risks and uncertainties, including, without limitation, express or implied statements concerning the Company’s expectations regarding its future financial performance, including the Company’s expectations for its first quarter and full year 2025 revenues, 2026 revenue growth rates and expected contributors to 2026 projected revenue growth, organic revenue growth rates, R&D, operating income (loss), depreciation, amortization, stock based compensation expense, and Adjusted EBITDA, and full year 2025 operating cash flow, capital expenditures and other investments, and free cash flow, the Company’s future growth trajectory and ability to achieve improved revenue mix and profit in certain of its business segments and the expected timing of such improved revenue mix and profit, including the Company’s ability to achieve sustained year over year increasing revenues, profitability and cash flow, the Company’s expectation of ramp on projects and that investments in its business, including Company funded R&D expenses and ongoing development efforts, will result in an increase in the Company’s market share and total addressable market and position the Company for significant future organic growth, profitability, cash flow and an increase in shareholder value, the Company’s bid and proposal pipeline and backlog, including the Company’s ability to timely execute on its backlog, demand for its products and services, including the Company’s alignment with today’s National Security requirements and the positioning of its C5ISR and other businesses, planned 2025 investments, including in the tactical drone and satellite areas, and the related potential for additional growth in 2025 and beyond, ability to successfully compete and expected new customer awards, including the magnitude and timing of funding and the future opportunity associated with such awards, including in the target and tactical drone and satellite communication areas, performance of key contracts and programs, including the timing of production and demonstration related to certain of the Company’s contracts and control (TT&C) product offerings, the impact of the Company’s restructuring efforts and cost reduction measures, including its ability to improve profitability and cash flow in certain business units as a result of these actions and to achieve financial leverage on fixed administrative costs, the ability of the Company’s advanced purchases of inventory to mitigate supply chain disruptions and the timing of converting these investments to cash through the sales process, benefits to be realized from the Company’s net operating loss carry forwards, the availability and timing of government funding for the Company’s offerings, including the strength of the future funding environment, the short-term delays that may occur as a result of Continuing Resolutions or delays in U.S. Department of Defense (DoD) budget approvals, timing of LRIP and full rate production related to the Company’s unmanned aerial target system offerings, as well as the level of recurring revenues expected to be generated by these programs once they achieve full rate production, market and industry developments, and any unforeseen risks associated with any public health crisis, supply chain disruptions, availability of an experienced skilled workforce, inflation and increased costs, risks related to potential cybersecurity events or disruptions of our information technology systems, and delays in our financial projections, industry, business and operations, including projected growth. Such statements are only predictions, and the Company’s actual results may differ materially from the results expressed or implied by these statements. Investors are cautioned not to place undue reliance on any such forward-looking statements. All such forward-looking statements speak only as of the date they are made, and the Company undertakes no obligation to update or revise these statements, whether as a result of new information, future events or otherwise. Factors that may cause the Company’s results to differ include, but are not limited to: risks to our business and financial results related to the reductions and other spending constraints imposed on the U.S. Government and our other customers, including as a result of sequestration and extended continuing resolutions, the Federal budget deficit and Federal government shut-downs; risks of adverse regulatory action or litigation; risks associated with debt leverage; risks that our cost-cutting initiatives will not provide the anticipated benefits; risks that changes, cutbacks or delays in spending by the DoD may occur, which could cause delays or cancellations of key government contracts; risks of delays to or the cancellation of our projects as a result of protest actions submitted by our competitors; risks that changes may occur in Federal government (or other applicable) procurement laws, regulations, policies and budgets; risks of the availability of government funding for the Company’s products and services due to performance, cost growth, or other factors, changes in government and customer priorities and requirements (including cost-cutting initiatives, the potential deferral of awards, terminations or reduction of expenditures to respond to the priorities of Congress and the Administration, or budgetary cuts resulting from Congressional committee recommendations or automatic sequestration under the Budget Control Act of 2011, as amended); risks that the unmanned aerial systems and unmanned ground sensor markets do not experience significant growth; risks that products we have developed or will develop will become programs of record; risks that we cannot expand our customer base or that our products do not achieve broad acceptance which could impact our ability to achieve our anticipated level of growth; risks of increases in the Federal government initiatives related to in-sourcing; risks related to security breaches, including cyber security attacks and threats or other significant disruptions of our information systems, facilities and infrastructures; risks related to our compliance with applicable contracting and procurement laws, regulations and standards; risks related to the new DoD Cybersecurity Maturity Model Certification; risks relating to the ongoing conflict in Ukraine and the Israeli-Palestinian military conflict; risks to our business in Israel; risks related to contract performance; risks related to failure of our products or services; risks associated with our subcontractors’ or suppliers’ failure to perform their contractual obligations, including the appearance of counterfeit or corrupt parts in our products; changes in the competitive environment (including as a result of bid protests); failure to successfully integrate acquired operations and compete in the marketplace, which could reduce revenues and profit margins; risks that potential future goodwill impairments will adversely affect our operating results; risks that anticipated tax benefits will not be realized in accordance with our expectations; risks that a change in ownership of our stock could cause further limitation to the future utilization of our net operating losses; risks that we may be required to record valuation allowances on our net operating losses which could adversely impact our profitability and financial condition; risks that the current economic environment will adversely impact our business, including with respect to our ability to recruit and retain sufficient numbers of qualified personnel to execute on our programs and contracts, as well as expected contract awards and risks related to increasing interest rates and risks related to the interest rate swap contract to hedge Term SOFR associated with the Company’s Term Loan A; currently unforeseen risks associated with any public health crisis, and risks related to natural disasters or severe weather. These and other risk factors are more fully discussed in the Company’s Annual Report on Form 10-K for the period ended December 29, 2024, and in our other filings made with the Securities and Exchange Commission.
Note Regarding Use of Non-GAAP Financial Measures and Other Performance Metrics This news release contains non-GAAP financial measures, including organic revenue growth rates, Adjusted EPS (computed using income from continuing operations before income taxes, excluding income (loss) from discontinued operations, excluding income (loss) attributable to non-controlling interest, excluding depreciation, amortization of intangible assets, amortization of capitalized contract and development costs, stock-based compensation expense, acquisition and restructuring related items and other, which includes, but is not limited to, legal related items, non-recoverable rates and costs, and foreign transaction gains and losses, less the estimated impact to income taxes) and Adjusted EBITDA (which includes net income (loss) attributable to noncontrolling interest and excludes, among other things, losses and gains from discontinued operations, acquisition and restructuring related items, stock compensation expense, foreign transaction gains and losses, and the associated margin rates). Additional non-GAAP financial measures include Free Cash Flow from Operations computed as Cash Flow from Operations less Capital Expenditures plus proceeds from sale of assets and Adjusted EBITDA related to our KUS and KGS businesses. Kratos believes this information is useful to investors because it provides a basis for measuring the Company’s available capital resources, the actual and forecasted operating performance of the Company’s business and the Company’s cash flow, excluding non-recurring items and non-cash items that would normally be included in the most directly comparable measures calculated and presented in accordance with GAAP. The Company’s management uses these non-GAAP financial measures, along with the most directly comparable GAAP financial measures, in evaluating the Company’s actual and forecasted operating performance, capital resources and cash flow. Non-GAAP financial measures should not be considered in isolation from, or as a substitute for, financial information presented in compliance with GAAP, and investors should carefully evaluate the Company’s financial results calculated in accordance with GAAP and reconciliations to those financial results. In addition, non-GAAP financial measures as reported by the Company may not be comparable to similarly titled amounts reported by other companies. As appropriate, the most directly comparable GAAP financial measures and information reconciling these non-GAAP financial measures to the Company’s financial results prepared in accordance with GAAP are included in this news release.
Another Performance Metric the Company believes is a key performance indicator in our industry is our Book to Bill Ratio as it provides investors with a measure of the amount of bookings or contract awards as compared to the amount of revenues that have been recorded during the period and provides an indicator of how much of the Company’s backlog is being burned or utilized in a certain period. The Book to Bill Ratio is computed as the number of bookings or contract awards in the period divided by the revenues recorded for the same period. The Company believes that the rolling or last twelve months’ Book to Bill Ratio is meaningful since the timing of quarter-to-quarter bookings can vary.
")