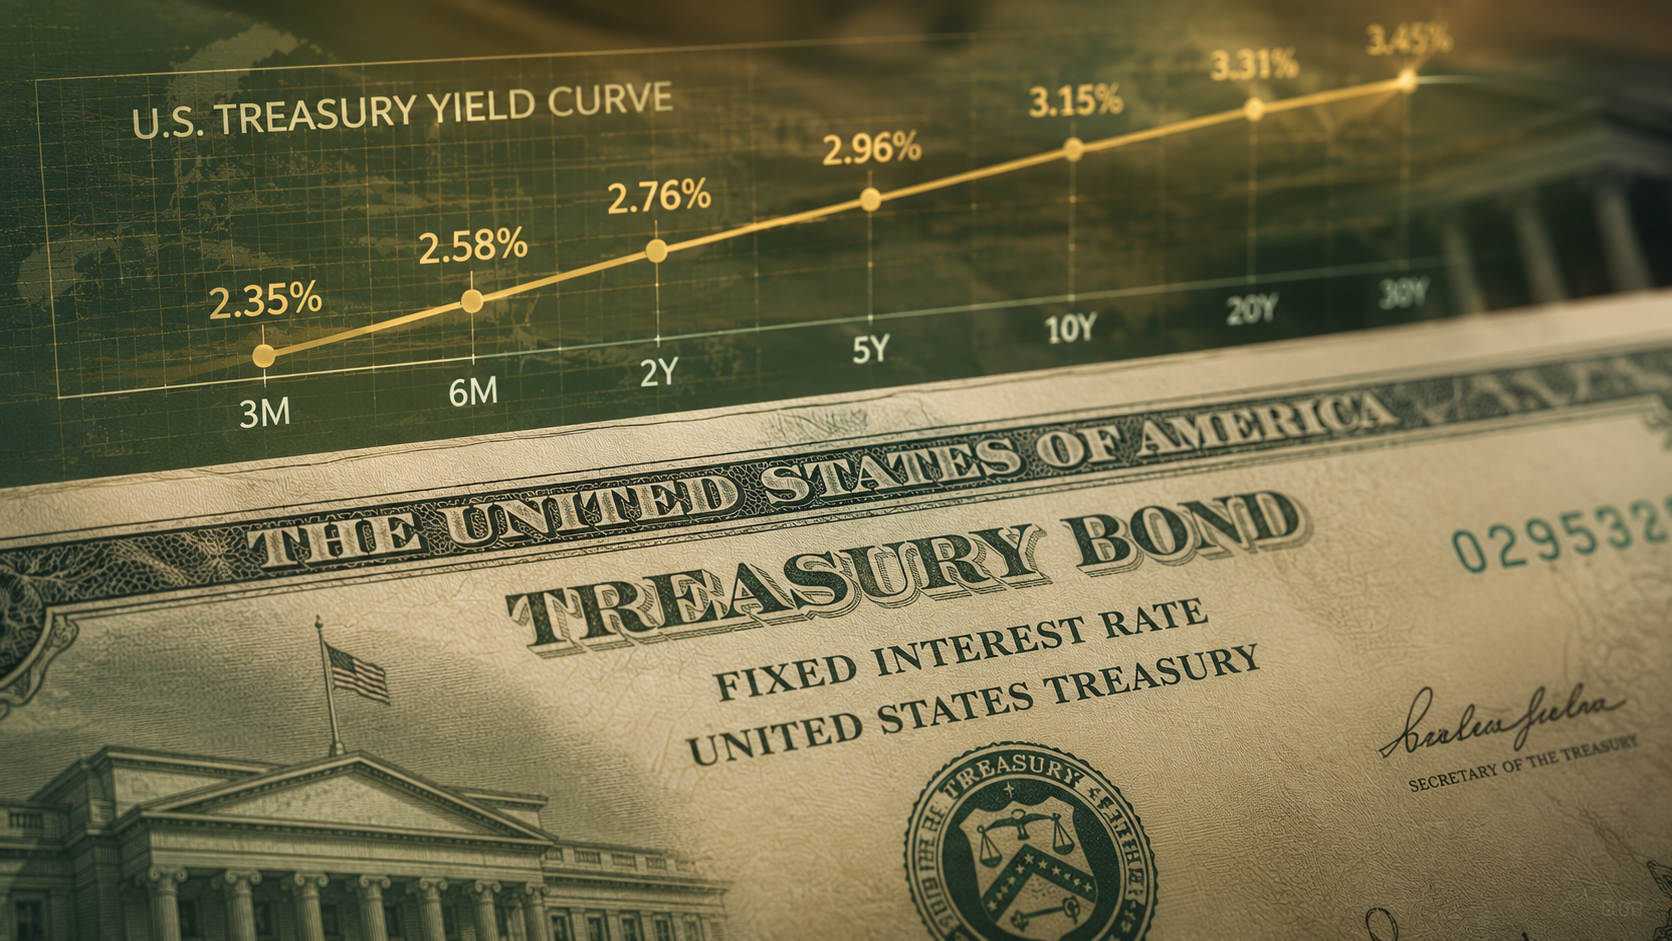
The 30-Year Treasury Just Paid Its Highest Yield Since 2007. Here’s What the Auction Actually Showed

The U.S. government sold $25 billion of 30-year Treasury bonds yesterday at a yield of 5.058%, the richest rate on a long bond auction since 2007. That headline number is drawing attention, but the full picture from this week’s auctions is more balanced than the yield alone suggests.

Start with the demand side. Pre-auction trading had the 30-year yield sitting at 5.061% just before the bidding deadline, meaning the final result actually came in slightly better than the market was pricing, a sign that buyers stepped in rather than stepped back. That is generally read as a healthy outcome, not a warning sign. Context matters here too. Existing 30-year bonds have already traded as high as 5.20% earlier this year, so yesterday’s print sits within a range the market has already absorbed rather than representing new, uncharted territory.

A day earlier, the Treasury auctioned $42 billion of 10-year notes, and that result was cleaner still. The auction cleared at 4.58% with a bid-to-cover ratio of 2.59, comfortably above the 2.5 level traders typically use as a benchmark for solid demand. No stress signals, no last-minute yield spike, no indication that investors are hesitant to hold U.S. government debt at current levels. Between the two auctions, the government raised $67 billion this week alone as part of a broader $119 billion week of coupon issuance, and both sales found willing buyers.

The interesting nuance is why the 30-year yield moved more than the 10-year. When the long end of the curve carries a higher premium relative to shorter maturities, it typically reflects investors asking for more compensation to hold debt across multiple decades rather than any concern about near-term credit risk. That’s consistent with straightforward supply and demand dynamics: more long-duration issuance generally requires a higher yield to clear the market, independent of the government’s underlying fiscal position.

The practical relevance for investors runs in a few directions. The 10-year yield is the direct reference point for 30-year mortgage rates, so a 4.58% clearing yield keeps the housing affordability conversation roughly where it has been. For companies that borrow against Treasury benchmarks, and smaller, more leveraged businesses in particular tend to feel rate moves more directly, the cost of long-term borrowing is shaped as much by auction dynamics like these as by anything the Federal Reserve decides at its policy meetings. The Fed sets the front end of the curve through its rate decisions. The long end responds to a separate set of forces, including how much duration the market is being asked to absorb and at what price investors are willing to hold it.

Taken together, this week’s auctions showed a market that is functioning and finding demand, just at a higher price for long-duration debt than it has required in nearly two decades. Whether that becomes a durable new range or eases as issuance patterns shift is something the next several auction cycles will help clarify.
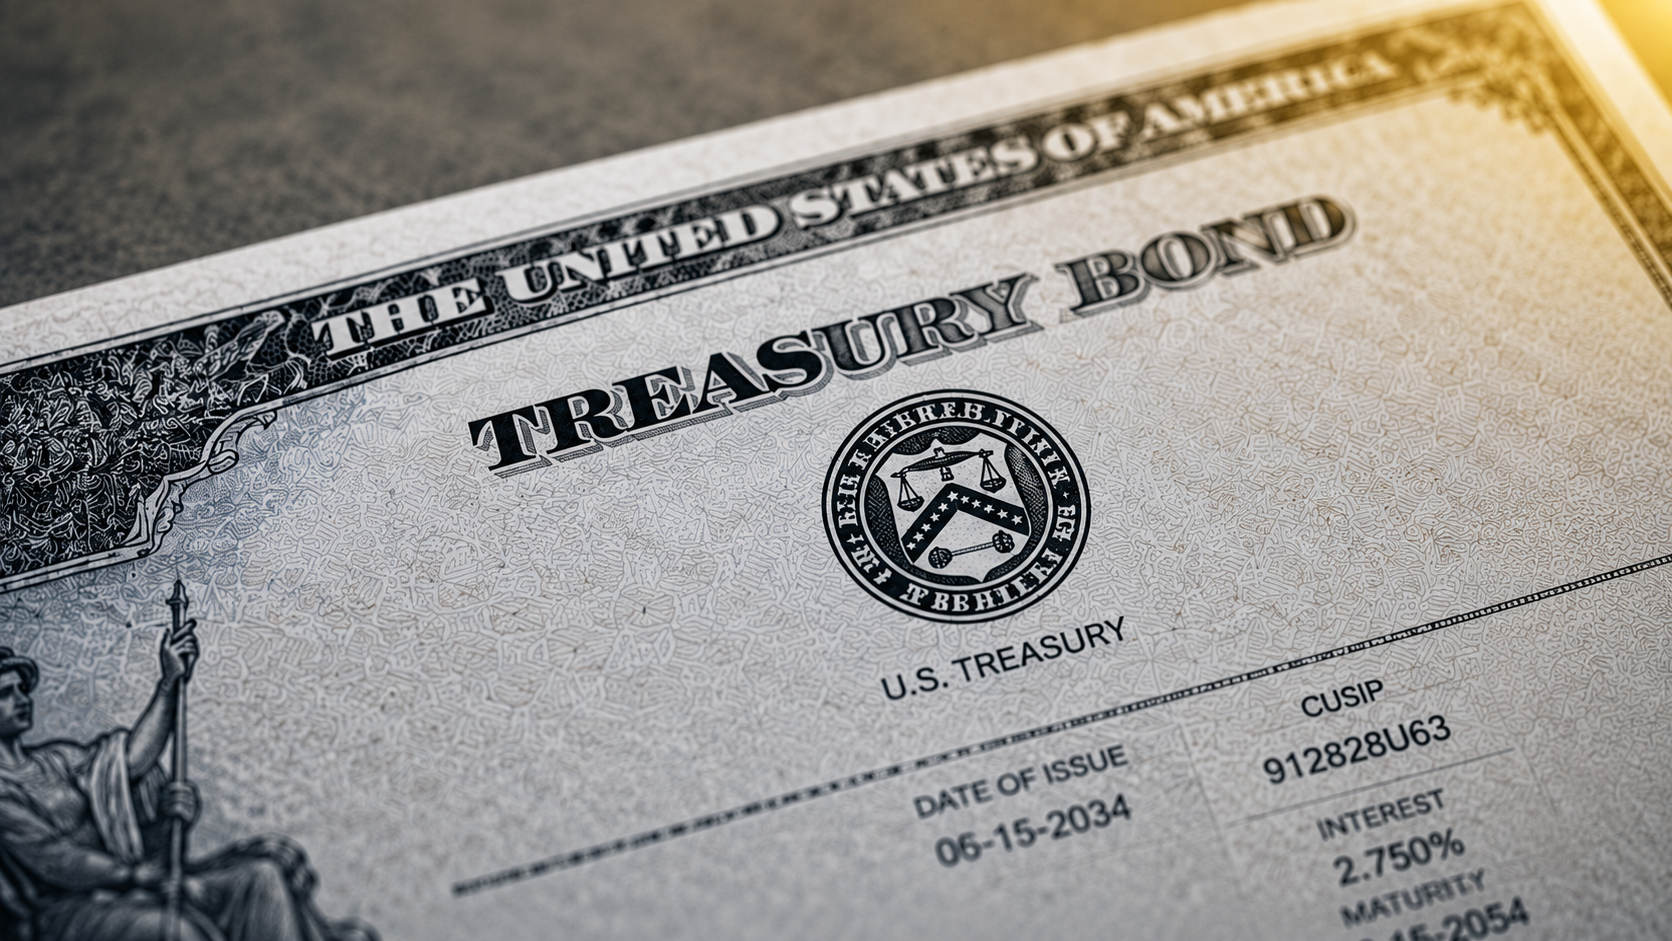

The 30-Year Treasury Just Hit a 19-Year High

The bond market just sent one of its loudest warnings in nearly two decades. The 30-year US Treasury yield climbed to 5.12% on Friday — its highest level since June 2007 — while the 10-year benchmark yield rose to 4.57%, breaching the key 4.5% psychological threshold for the first time since May 2025. For equity investors, and small cap investors in particular, this is not background noise. It is a direct threat to valuations, borrowing costs, and earnings growth at the exact segment of the market least equipped to absorb the pressure.

What’s Driving the Move

The Treasury selloff is the product of several converging forces, all pointing in the same inflationary direction. Consumer prices rose 3.8% year over year in April according to the latest CPI print, driven heavily by surging energy costs tied to the ongoing US-Iran war. The Producer Price Index followed a day later, showing wholesale prices climbed 6% annually — a number that signals upstream cost pressures have not peaked and are still working their way through the supply chain.

The Trump-Xi summit, which many investors had hoped would produce pressure on Iran to reopen the Strait of Hormuz, ended without a concrete agreement on the conflict. Oil prices rose Friday as Trump departed Beijing, removing one of the few potential near-term relief valves for energy-driven inflation. The result: bond traders are not just pricing out Fed rate cuts — they are beginning to price in rate hikes. According to CME’s FedWatch tool, traders now see nearly a 50% chance the Fed raises rates before year-end, with a June hold near certain.

This is a significant repricing of the rate environment, and it happened fast.

Why Small Caps Bear the Most Risk

The 5% zone on the 30-year Treasury has historically acted as a tightening mechanism for financial conditions — and the companies that feel that tightening first and hardest are small and microcap names. Unlike large caps with investment-grade credit ratings and access to long-term fixed-rate financing, smaller companies disproportionately carry variable-rate debt. When rates rise, their interest expense rises with them — directly and immediately compressing earnings.

Beyond debt costs, rising yields create a valuation headwind. Higher risk-free rates reduce the present value of future cash flows, and smaller growth companies — many of which trade on forward earnings expectations — see multiple compression accelerate in high-yield environments. The Russell 2000 fell 1.63% Friday, underperforming the broader market in a pattern that is consistent with what history shows when long yields spike.

A Global Problem

The bond selloff is not isolated to US markets. Japan’s 30-year yield hit 4% Friday and the UK 10-year gilt climbed to 5.14%, signaling that the inflationary and fiscal pressures driving yields higher are a global phenomenon. Coordinated tightening of financial conditions across major economies raises recession risk and historically compresses small cap valuations more severely than large cap equivalents.

The 5% level on the long bond is not just a number. It is a threshold that has historically forced portfolio reallocation away from equities and toward fixed income — and when that rotation happens, small caps are rarely the last ones standing.

Investors in the sub-$2 billion market cap space should be watching yields as closely as earnings right now. The bond market is telling a story that equity markets haven’t fully priced yet.

Treasury’s Latest Rate Move Brings Fresh Attention to I Bonds

The U.S. Treasury has announced a new 4.03% rate for Series I savings bonds, effective from November 1, 2025, through April 30, 2026. The rate marks a modest increase from the previous 3.98%, offering investors a slightly higher return on one of the government’s most secure, inflation-linked assets.

The new composite rate is made up of two parts — a variable rate of 3.12% based on recent inflation data and a fixed rate of 0.90%, which will remain constant for the life of the bond. Together, they form the 4.03% annualized yield. While the fixed rate is slightly lower than the 1.10% offered in May, the uptick in the inflation component helped push the total return higher.

I Bonds surged in popularity in 2022 when the rate peaked at a record 9.62%, drawing massive inflows from investors looking for a safe hedge against inflation. Though inflation has since cooled, many savers have continued to hold onto their bonds, while new buyers have taken advantage of the relatively high fixed-rate portion compared to previous years.

For many households, I Bonds remain an appealing middle ground — providing government-backed security while outpacing many savings accounts and CDs. The interest compounds semiannually, and investors can hold the bonds for up to 30 years, though early redemptions before five years forfeit the last three months of interest.

The Treasury adjusts I Bond rates twice a year — in May and November — based on the Consumer Price Index. Each investor’s bond earns the announced variable rate for six months from the purchase date, regardless of subsequent changes. The fixed rate, however, is locked in for the full duration of ownership.

For example, an investor who bought I Bonds in March 2025 would have earned a 1.90% variable rate for the first six months and automatically shifted to 2.86% this September, creating a composite yield of about 4.06%.

The new rate is likely to draw fresh attention from retail investors seeking low-risk returns amid ongoing market volatility and uncertainty around the Federal Reserve’s path on rates. For many smaller investors, I Bonds offer a stable complement to more speculative holdings such as tech or small-cap equities.

However, higher government-backed yields can also divert short-term capital away from small-cap stocks, which often depend on investor risk appetite to attract flows. As safer assets like I Bonds and Treasuries become more rewarding, some investors may opt to park cash in guaranteed instruments instead of chasing growth in volatile small-cap or emerging sectors.

Still, for disciplined investors, this shift could create buying opportunities in undervalued small-cap names as liquidity temporarily moves toward fixed income.

The Treasury’s latest adjustment makes I Bonds slightly more attractive for conservative investors, even as broader market participants navigate mixed signals from the Fed and bond markets. For small investors, they remain a solid inflation hedge — and for opportunistic traders, the reallocation trend could open new value pockets in smaller-cap stocks.