In a transformative move that will reshape the North American cabinet manufacturing landscape, MasterBrand Inc. and American Woodmark Corporation announced today a definitive all-stock merger agreement that creates a combined entity with a pro forma equity value of $2.4 billion and enterprise value of $3.6 billion.
Under the agreement, American Woodmark shareholders will receive 5.150 shares of MasterBrand common stock for each American Woodmark share they own. Upon completion, MasterBrand shareholders will control approximately 63% of the combined company, while American Woodmark shareholders will hold the remaining 37% on a fully diluted basis.
The transaction is expected to close in early 2026, pending shareholder approvals from both companies, regulatory clearances, and other customary closing conditions. Notably, the deal is structured as an all-stock transaction, though MasterBrand plans to arrange additional credit facilities to retire American Woodmark’s existing debt at closing.
The merger creates what the companies describe as “the cabinet industry’s most comprehensive portfolio of trusted brands and products.” The combination leverages complementary strengths: MasterBrand’s broad brand portfolio and American Woodmark’s streamlined manufacturing profile and strong customer relationships.
Financial projections are compelling. The combined entity expects to generate approximately $639 million in trailing 12-month adjusted EBITDA, including anticipated run-rate cost synergies of $90 million by the end of year three. These synergies will primarily come from procurement optimization, manufacturing network improvements, and administrative cost reductions. The deal is expected to be accretive to MasterBrand’s adjusted diluted earnings per share by year two.
The merger positions the combined company to better serve diverse customer segments across multiple channels. With MasterBrand’s existing network of over 7,700 dealers, major retailers, and builders, plus American Woodmark’s relationships with home centers and independent distributors, the enlarged entity will have unprecedented market reach.
Geographic expansion is another key benefit. The complementary footprints of both companies will provide access to high-growth markets while offering customers greater flexibility in purchasing options and enhanced support capabilities.
Dave Banyard, currently MasterBrand’s President and CEO, will lead the combined company, while David Petratis will serve as Board Chair. The integration will be overseen by Nathaniel Leonard, MasterBrand’s Executive Vice President of Corporate Strategy and Development. The combined entity will maintain its MasterBrand name and be headquartered in Beachwood, Ohio, while preserving a significant operational presence in Winchester, Virginia.
Importantly, American Woodmark’s board will contribute three directors to the expanded MasterBrand board, ensuring representation in governance decisions.
The merger creates a financially stronger entity with an anticipated net debt-to-adjusted EBITDA ratio below MasterBrand’s 2.0x target leverage at closing. This improved financial profile is expected to enhance free cash flow generation, provide greater resilience through market cycles, and enable increased investment in growth initiatives, automation, and technology.
Both companies emphasize their commitment to maintaining and growing their respective legacy brands, which have established trust with channel partners and consumers. The combination represents a strategic bet on the continued growth of the North American residential cabinet market and the companies’ ability to capture greater market share through expanded capabilities and improved operational efficiency.
This merger signals consolidation in the cabinet manufacturing industry as companies seek scale advantages and broader market reach to compete more effectively in an evolving marketplace.
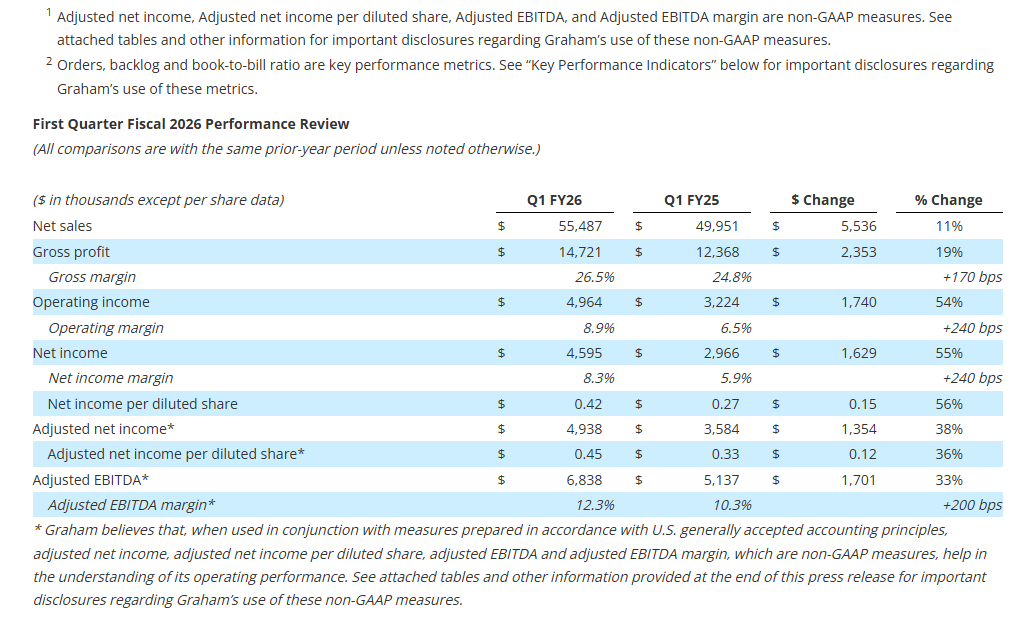
Revenue increased 11% to $55.5 million, reflecting the strength of the Company’s product portfolio and diversified revenue base
Gross profit increased 19% to $14.7 million; Gross margin improved 170 basis points to 26.5%
Net income per diluted share increased 56% to $0.42; adjusted net income per diluted share1 increased 36% to $0.45
Net income increased 55% to $4.6 million; Adjusted EBITDA1 increased 33% to $6.8 million; Adjusted EBITDA margin1 improved 200 basis points to 12.3%
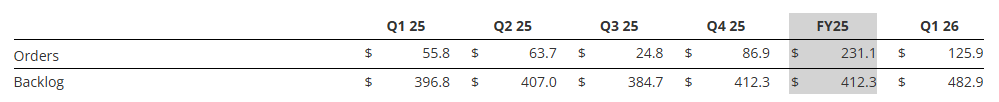
Orders2 were $125.9 million, driven by large defense orders; Book-to-Bill ratio2 of 2.3x and backlog2 of $482.9 million
Strong balance sheet with no debt, $10.8 million in cash, and access to $44.3 million under its revolving credit facility at quarter end to support growth initiatives
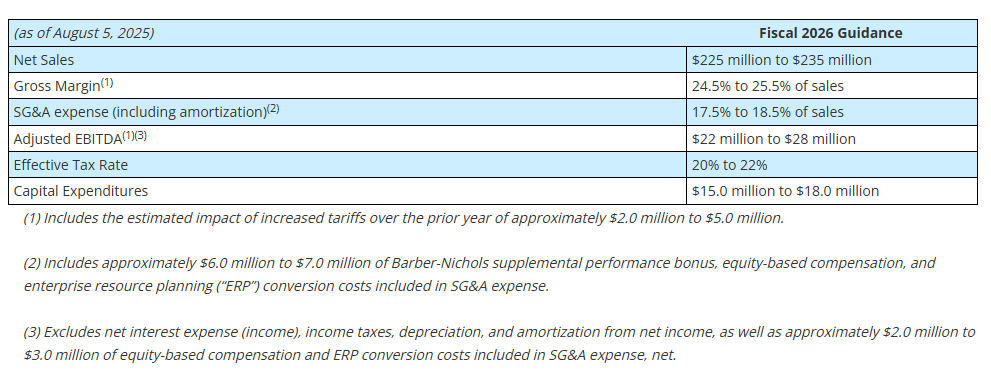
Reiterating full year fiscal 2026 guidance for all metrics provided; Remain on track to reach strategic goal of 8% to 10% annual organic revenue growth and low to mid-teen Adjusted EBITDA margins by fiscal 2027
BATAVIA, N.Y.–(BUSINESS WIRE)– Graham Corporation (NYSE: GHM) (“GHM” or the “Company”), a global leader in the design and manufacture of mission critical fluid, power, heat transfer and vacuum technologies for the Defense, Energy & Process, and Space industries, today reported financial results for its first quarter for the fiscal year ending March 31, 2026 (“fiscal 2026”).
Graham’s President and Chief Executive Officer, Matthew J. Malone stated, “The start of fiscal 2026 demonstrates continued strength across our diversified product portfolio. We delivered strong growth in our Energy & Process markets, driven by execution on major commercial projects and robust aftermarket demand, along with increasing momentum in emerging energy segments such as small modular reactors (“SMRs”) and cryogenics. In addition, our Defense business continues to perform well, supported by recent follow-on orders, including $86.5 million to support the Virginia Class submarine program in May and $25.5 million for the MK48 Mod 7 Heavyweight Torpedo program in July, reaffirming our position as a trusted supplier to the U.S. Navy.”
Mr. Malone continued, “We remain focused on high-return initiatives that drive long-term value creation, including numerous in-process capital investments expected to generate returns above 20%. These initiatives include automated welding, enhanced radiographic testing technologies, and our new cryogenic testing facility in Florida, which we expect will improve margins and create new revenue opportunities. I’m also pleased to announce that we’ve completed the expansion of our Batavia defense facility this month. With these investments, we believe Graham is well-positioned to drive sustainable growth, deliver for our customers, and continue expanding margins.”
Quarterly net sales of $55.5 million increased 11%, or $5.5 million. Sales to the Energy & Process market contributed $5.7 million to growth driven by increased sales in the Chemical/Petrochemical and New Energy industries. The increase in Chemical/Petrochemical sales was largely due to a surface condenser order for a North American net-zero carbon emissions ethylene cracker received in June 2024, while the increase in New Energy sales was driven by increased sales to the hydrogen and SMR markets. Aftermarket sales to the Energy & Process and Defense markets of $10.4 million remained strong and were 33% higher than the prior year. See supplemental data for a further breakdown of sales by market and region.
Gross profit for the quarter increased $2.4 million to $14.7 million compared to the prior-year period of $12.4 million. As a percentage of sales, gross profit margin increased 170 basis points to 26.5%, compared to the first quarter of fiscal 2025. Increased leverage on fixed overhead costs due to the higher volume of sales discussed above, as well as an improved mix of sales related to higher margin aftermarket sales, and better execution and pricing on defense contracts were the primary drivers of this increase. For the first quarter of fiscal 2026, the impact of tariffs was not material to our consolidated financial statements in comparison to the prior year. However, we still estimate the range of potential impact of increased tariffs for the full year to be between $2 million to $5 million.
Selling, general and administrative expense (“SG&A”), including amortization, totaled $9.8 million, an increase of $0.6 million compared with the prior year. This increase reflects the investments we are making in our operations, our employees, and our technology. As a percentage of sales, SG&A, including amortization, of 17.7% decreased 90 basis points compared to the prior year period, reflective of our financial discipline.
Cash Management and Balance Sheet As expected, cash used by operating activities totaled $2.3 million for the quarter-ending June 30, 2025, primarily due to the payment of fiscal 2025 bonuses including the supplemental Barber-Nichols earnout bonus of $4.3 million in connection with the acquisition. As of June 30, 2025, cash and cash equivalents were $10.8 million, compared with $21.6 million as of March 31, 2025.
Capital expenditures for the first quarter fiscal 2025 were $7.0 million, focused on capacity expansion, increasing capabilities, and productivity improvements. All major capital projects are on time.
The Company had no debt outstanding as of June 30, 2025, with $44.3 million available on its revolving credit facility after taking into account outstanding letters of credit.
Orders, Backlog, and Book-to-Bill Ratio See supplemental data filed with the Securities and Exchange Commission on Form 8-K and provided on the Company’s website for a further breakdown of orders and backlog by market. See “Key Performance Indicators” below for important disclosures regarding Graham’s use of these metrics ($ in millions).
Orders for the first quarter of fiscal 2026 increased to $125.9 million, including the remaining $86.5 million of a $136.5 million follow-on order in support of the U.S. Navy’s Virginia Class Submarine program. Aftermarket orders for the Energy & Process and Defense markets remained strong and totaled $10.5 million for the first quarter of fiscal 2026, increasing 16% over the prior year. Book-to-bill for the first quarter of fiscal 2026 was 2.3x. Note that orders tend to be lumpy given the nature of our business (i.e. large capital projects) and in particular, orders to the Defense industry, which span multiple years and can be significantly larger in size.
Backlog at quarter end was $482.9 million, a 22% increase over the prior-year period. Approximately 35% to 40% of orders currently in backlog are expected to be converted to sales in the next twelve months, another 25% to 30% are expected to convert to sales within one to two years, and the remaining beyond two years. Approximately 87% of our backlog at June 30, 2025, was to the Defense industry, which we believe provides stability and visibility to our business.
Fiscal 2026 Outlook Based upon the results for the first quarter of fiscal 2026, as well as our expectations for the remainder of the fiscal year, we are reiterating our full year fiscal 2026 guidance provided earlier this year as follows:
Our expectations for sales and profitability assume that we will be able to operate our production facilities at planned capacity, have access to our global supply chain including our subcontractors, do not experience any global disruptions, and experience no impact from any other unforeseen events.
Webcast and Conference Call GHM’s management will host a conference call and live webcast on August 5, 2025 at 11:00 a.m. Eastern Time (“ET”) to review its financial results as well as its strategy and outlook. The review will be accompanied by a slide presentation, which will be made available immediately prior to the conference call on GHM’s investor relations website.
A question-and-answer session will follow the formal presentation. GHM’s conference call can be accessed by calling (412)-317-5195. Alternatively, the webcast can be monitored from the events section of GHM’s investor relations website.
A telephonic replay will be available from 3:00 p.m. ET today through Tuesday, August 12, 2025. To listen to the archived call, dial (412) 317-6671 and enter conference ID number 10201479 or access the webcast replay via the Company’s website at ir.grahamcorp.com, where a transcript will also be posted once available.
About Graham Corporation Graham is a global leader in the design and manufacture of mission critical fluid, power, heat transfer and vacuum technologies for the Defense, Energy & Process, and Space industries. Graham Corporation and its family of global brands are built upon world-renowned engineering expertise in vacuum and heat transfer, cryogenic pumps, and turbomachinery technologies, as well as its responsive and flexible service and the unsurpassed quality customers have come to expect from the Company’s products and systems. Graham Corporation routinely posts news and other important information on its website, grahamcorp.com, where additional information on Graham Corporation and its businesses can be found.
Safe Harbor Regarding Forward Looking Statements This news release contains forward-looking statements within the meaning of Section 27A of the Securities Act of 1933, as amended, and Section 21E of the Securities Exchange Act of 1934, as amended.
Forward-looking statements are subject to risks, uncertainties and assumptions and are identified by words such as “continue,” “expects,” “future,” “outlook,” “believes,” “could,” “guidance,” “may”, “will,” “plan” and other similar words. All statements addressing operating performance, events, or developments that Graham Corporation expects or anticipates will occur in the future, including but not limited to, profitability of future projects and the business, its ability to deliver to plan, its ability to continue to strengthen relationships with customers in the Defense industry, its ability to secure future projects and applications, expected expansion and growth opportunities, anticipated sales, revenues, adjusted EBITDA, adjusted EBITDA margins, capital expenditures and SG&A expenses, the timing of conversion of backlog to sales, orders, market presence, profit margins, tax rates, foreign sales operations, customer preferences, changes in market conditions in the industries in which it operates, changes in general economic conditions and customer behavior, forecasts regarding the timing and scope of the economic recovery in its markets, and its acquisition and growth strategy, are forward-looking statements. Because they are forward-looking, they should be evaluated in light of important risk factors and uncertainties. These risk factors and uncertainties are more fully described in Graham Corporation’s most recent Annual Report filed with the Securities and Exchange Commission (the “SEC”), included under the heading entitled “Risk Factors”, and in other reports filed with the SEC.
Should one or more of these risks or uncertainties materialize or should any of Graham Corporation’s underlying assumptions prove incorrect, actual results may vary materially from those currently anticipated. In addition, undue reliance should not be placed on Graham Corporation’s forward-looking statements. Except as required by law, Graham Corporation disclaims any obligation to update or publicly announce any revisions to any of the forward-looking statements contained in this news release.
Non-GAAP Financial Measures Adjusted EBITDA is defined as consolidated net income (loss) before net interest expense, income taxes, depreciation, amortization, other acquisition related expenses, and other unusual/nonrecurring expenses. Adjusted EBITDA margin is defined as Adjusted EBITDA as a percentage of sales. Adjusted EBITDA and Adjusted EBITDA margin are not measures determined in accordance with generally accepted accounting principles in the United States, commonly known as GAAP. Nevertheless, Graham believes that providing non-GAAP information, such as Adjusted EBITDA and Adjusted EBITDA margin, is important for investors and other readers of Graham’s financial statements, as it is used as an analytical indicator by Graham’s management to better understand operating performance. Moreover, Graham’s credit facility also contains ratios based on Adjusted EBITDA. Because Adjusted EBITDA and Adjusted EBITDA margin are non-GAAP measures and are thus susceptible to varying calculations, Adjusted EBITDA, and Adjusted EBITDA margin, as presented, may not be directly comparable to other similarly titled measures used by other companies.
Adjusted net income and adjusted net income per diluted share are defined as net income and net income per diluted share as reported, adjusted for certain items and at a normalized tax rate. Adjusted net income and adjusted net income per diluted share are not measures determined in accordance with GAAP, and may not be comparable to the measures as used by other companies. Nevertheless, Graham believes that providing non-GAAP information, such as adjusted net income and adjusted net income per diluted share, is important for investors and other readers of the Company’s financial statements and assists in understanding the comparison of the current quarter’s and current fiscal year’s net income and net income per diluted share to the historical periods’ net income and net income per diluted share. Graham also believes that adjusted net income per share, which adds back intangible amortization expense related to acquisitions, provides a better representation of the cash earnings of the Company.
Forward-Looking Non-GAAP Measures Adjusted EBITDA and adjusted EBITDA margin are non-GAAP measures. The Company is unable to present a quantitative reconciliation of these forward-looking non-GAAP financial measures to their most directly comparable forward-looking GAAP financial measures because such information is not available, and management cannot reliably predict the necessary components of such GAAP measures without unreasonable effort largely because forecasting or predicting our future operating results is subject to many factors out of our control or not readily predictable. In addition, the Company believes that such reconciliations would imply a degree of precision that would be confusing or misleading to investors. The unavailable information could have a significant impact on the Company’s fiscal 2025 financial results. These non-GAAP financial measures are preliminary estimates and are subject to risks and uncertainties, including, among others, changes in connection with purchase accounting, quarter-end, and year-end adjustments. Any variation between the Company’s actual results and preliminary financial estimates set forth above may be material.
Key Performance Indicators In addition to the foregoing non-GAAP measures, management uses the following key performance metrics to analyze and measure the Company’s financial performance and results of operations: orders, backlog, and book-to-bill ratio. Management uses orders and backlog as measures of current and future business and financial performance, and these may not be comparable with measures provided by other companies. Orders represent written communications received from customers requesting the Company to provide products and/or services. Backlog is defined as the total dollar value of net orders received for which revenue has not yet been recognized. Management believes tracking orders and backlog are useful as they often times are leading indicators of future performance. In accordance with industry practice, contracts may include provisions for cancellation, termination, or suspension at the discretion of the customer.
The book-to-bill ratio is an operational measure that management uses to track the growth prospects of the Company. The Company calculates the book-to-bill ratio for a given period as net orders divided by net sales.
Given that each of orders, backlog, and book-to-bill ratio are operational measures and that the Company’s methodology for calculating orders, backlog and book-to-bill ratio does not meet the definition of a non-GAAP measure, as that term is defined by the U.S. Securities and Exchange Commission, a quantitative reconciliation for each is not required or provided.
Second quarter sales of $172 million, EPS of $(0.12), Adjusted EBITDA of $5.2 million Continued strong free cash flow generation Updates full year 2025 guidance
NEW ALBANY, Ohio, Aug. 04, 2025 (GLOBE NEWSWIRE) — CVG (NASDAQ: CVGI), a diversified industrial products and services company, today announced financial results for its second quarter ended June 30, 2025.
Second Quarter 2025 Highlights(Results from Continuing Operations; compared with prior year, where comparisons are noted)
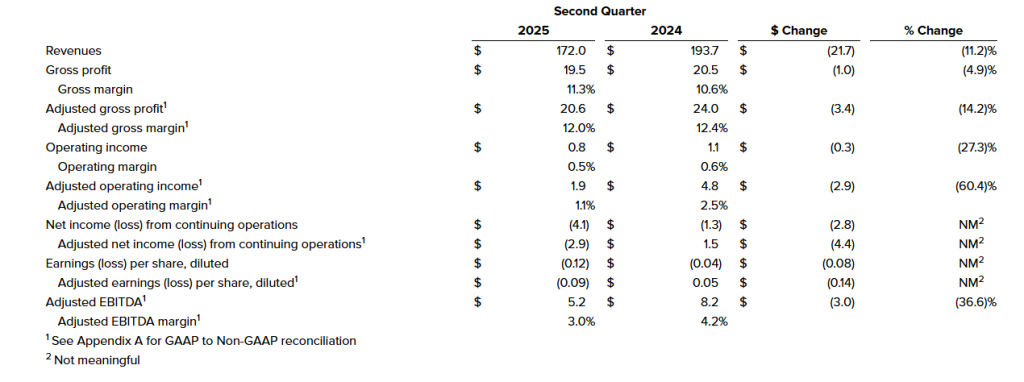
Revenues of $172.0 million, down 11.2%, primarily due to softening in global demand.
Operating income of $0.8 million, adjusted operating income of $1.9 million, down compared to operating income of $1.1 million and adjusted operating income of $4.8 million. The decrease in operating income was driven primarily by lower sales volumes.
Net loss from continuing operations of $4.1 million, or $(0.12) per diluted share and adjusted net loss of $2.9 million, or $(0.09) per diluted share, compared to net loss from continuing operations of $1.3 million, or $(0.04) per diluted share and adjusted net income of $1.5 million, or $0.05 per diluted share.
Adjusted EBITDA of $5.2 million, down 36.6%, with an adjusted EBITDA margin of 3.0%, down from 4.2%.
Free cash flow of $17.3 million, up $16.5 million, due to better working capital management. Net debt decreased $31.8 million compared to the year end 2024 level.
Gross margin expansion of 80 basis points versus Q1 2025 due to operational efficiency improvements.
James Ray, President and Chief Executive Officer, said, “Despite continued macroeconomic volatility, particularly a softening in Construction and Agriculture and Class 8 end markets and ongoing concerns around tariff impacts, we were pleased with continued momentum in our second quarter results, which were highlighted by strong free cash generation. During the quarter, we made progress in implementing operational improvements and right sizing our manufacturing footprint, which drove sequential gross margin improvement for the second consecutive quarter. Additionally, as part of our efforts to preserve margin performance, we are continuing our efforts to further reduce our targeted SG&A levels, and we are having constructive negotiations with customers as it relates to mitigating tariff impacts.”
Mr. Ray continued, “We are encouraged by the improved performance in our Global Electrical Systems segment, driven by new business wins outside of the Construction and Agriculture end markets, which continue to see lower demand. The Global Electrical Systems segment also saw margin expansion despite revenues being flat year-over-year. Across our enterprise, we remain focused on execution, delivery, and driving operational efficiency, while managing the potential impact of trade policy.”
Andy Cheung, Chief Financial Officer, added, “We were pleased to see continued strong free cash generation in the quarter, as well as continued improvement in gross margin, as the benefits of our strategic initiatives take hold. Given our successful working capital initiatives, we are raising our free cash outlook to at least $30 million for the full fiscal year. Continued free cash generation and debt paydown remain key focus areas moving forward. During the quarter, we completed the refinancing of our credit facilities, which will further benefit our strategic initiatives and provide increased financial flexibility as we look to drive further cost reductions, margin improvement, and overall operational efficiency.”
Second Quarter Financial Results from Continuing Operations (amounts in millions except per share data and percentages)
Consolidated Results from Continuing Operations
Second Quarter 2025 Results
Second quarter 2025 revenues were $172.0 million, compared to $193.7 million in the prior year period, a decrease of 11.2%. The overall decrease in revenues was due to lower sales as a result of a softening in customer demand across all segments.
Operating income in the second quarter 2025 was $0.8 million compared to $1.1 million in the prior year period. The decrease in operating income was attributable to the impact of lower sales volumes. Second quarter 2025 adjusted operating income was $1.9 million, compared to $4.8 million in the prior year period.
Interest associated with debt and other expenses was $2.3 million and $2.4 million for the second quarter 2025 and 2024, respectively.
Net loss from continuing operations was $4.1 million, or $(0.12) per diluted share, for the second quarter 2025 compared to net loss of $1.3 million, or $(0.04) per diluted share, in the prior year period. Second quarter 2025 adjusted net loss from continuing operations was $2.9 million, or $(0.09) per diluted share, compared to adjusted net income of $1.5 million, or $0.05 per diluted share.
On June 30, 2025, the Company had $30.3 million of outstanding borrowings on its U.S. revolving credit facility and $4.2 million outstanding borrowings on its China credit facility, $45.3 million of cash and $90.6 million of availability from the credit facilities (subject to customary borrowing base and other conditions), resulting in total liquidity of $135.9 million.
Second Quarter 2025 Segment Results
Global Seating Segment
Revenues were $74.5 million compared to $82.4 million for the prior year period, a decrease of 9.6%, due to lower sales volume as a result of decreased customer demand.
Operating income was $2.7 million, compared to $2.1 million in the prior year period, an increase of 29.1%, primarily attributable to lower SG&A expenses. Second quarter 2025 adjusted operating income was $3.1 million compared to $2.9 million in the prior year period.
Global Electrical Systems Segment
Revenues were $53.6 million compared to $53.6 million in the prior year period, essentially flat.
Operating income was $0.7 million compared to an operating loss of $0.5 million in the prior year period. The increase in operating income was primarily attributable to lower salary expense and lower restructuring costs in the current period compared to the prior period. Second quarter 2025 adjusted operating income was $1.2 million compared to $0.8 million in the prior year period.
Trim Systems and Components Segment
Revenues were $43.9 million compared to $57.6 million in the prior year period, a decrease of 23.8%, primarily as a result of decreased customer demand.
Operating income was $0.1 million compared to $2.3 million in the prior year period, a decrease of $2.2 million. The decrease in operating income was primarily attributable to lower sales volumes. Second quarter 2025 adjusted operating income was $0.3 million compared to $4.0 million in the prior year period.
Outlook
CVG updated the Company’s outlook for the full year 2025, based on current market conditions:
Metric
Prior 2025 Outlook ($ millions)
2025 Outlook ($ millions)
Net Sales
$660- $690
$650- $670
Adjusted EBITDA
$22 – $27
$21 – $25
Free Cash Flow
> $20
> $30
This outlook reflects, among others, current industry forecasts for North America Class 8 truck builds. According to ACT Research, 2025 North American Class 8 truck production levels are expected to be at 252,000 units. The 2024 actual Class 8 truck builds according to the ACT Research was 332,372 units.
Construction and Agriculture end markets are projected to decline approximately 5-15% in 2025. However, we expect the contribution from new business wins outside of Construction and Agriculture end markets in Electrical Systems to soften this decline.
GAAP to Non-GAAP Reconciliation
A reconciliation of GAAP to non-GAAP financial measures referenced in this release is included as Appendix A to this release.
Conference Call
A conference call to discuss this press release is scheduled for Tuesday, August 5, 2025, at 8:30 a.m. ET. Management intends to reference the Q2 2025 Earnings Call Presentation during the conference call. To participate, dial (800) 549-8228 using conference code 72110. International participants dial (289) 819-1520 using conference code 72110.
This call is being webcast and can be accessed through the “Investors” section of CVG’s website at ir.cvgrp.com, where it will be archived for one year.
A telephonic replay of the conference call will be available for a period of two weeks following the call. To access the replay, dial (888) 660-6264 using access code 72110#.
Company Contact Andy Cheung Chief Financial Officer CVG [email protected]
Investor Relations Contact Ross Collins or Stephen Poe Alpha IR Group [email protected]
About CVG
CVG is a global provider of systems, assemblies and components to the global commercial vehicle market and the electric vehicle market. We deliver real solutions to complex design, engineering and manufacturing problems while creating positive change for our customers, industries and communities we serve. Information about the Company and its products is available on the internet at www.cvgrp.com.
Forward-Looking Statements
This press release contains forward-looking statements that are subject to risks and uncertainties. These statements often include words such as “believe”, “anticipate”, “plan”, “expect”, “intend”, “will”, “should”, “could”, “would”, “project”, “continue”, “likely”, and similar expressions. In particular, this press release may contain forward-looking statements about the Company’s expectations for future periods with respect to its plans to improve financial results, the future of the Company’s end markets, changes in the Class 8 and Class 5-7 North America truck build rates, performance of the global construction and agricultural equipment business, the Company’s prospects in the wire harness and electric vehicle markets, the Company’s initiatives to address customer needs, organic growth, the Company’s strategic plans and plans to focus on certain segments, competition faced by the Company, volatility in and disruption to the global economic environment including global supply chain constraints, inflation and labor shortages, tariffs and counter-measures, financial covenant compliance, anticipated effects of acquisitions, production of new products, plans for capital expenditures, and the Company’s financial position or other financial information. These statements are based on certain assumptions that the Company has made in light of its experience as well as its perspective on historical trends, current conditions, expected future developments and other factors it believes are appropriate under the circumstances. Actual results may differ materially from the anticipated results because of certain risks and uncertainties, including those included in the Company’s filings with the SEC. There can be no assurance that statements made in this press release relating to future events will be achieved. The Company undertakes no obligation to update or revise forward-looking statements to reflect changed assumptions, the occurrence of unanticipated events or changes to future operating results over time. All subsequent written and oral forward-looking statements attributable to the Company or persons acting on behalf of the Company are expressly qualified in their entirety by such cautionary statements.
Other Information
Throughout this document, certain numbers in the tables or elsewhere may not sum due to rounding. Rounding may have also impacted the presentation of certain year-on-year percentage changes.
NEW ALBANY, Ohio, July 24, 2025 (GLOBE NEWSWIRE) — Commercial Vehicle Group (the “Company” or “CVG”) (NASDAQ: CVGI) will hold its quarterly conference call on Tuesday, August 5, 2025, at 8:30 a.m. ET, to discuss second quarter 2025 financial results. CVG will issue a press release and presentation prior to the conference call.
Toll-free participants dial (800) 549-8228 using conference code 72110. International participants dial (289) 819-1520 using conference code 72110. This call is being webcast and can be accessed through the “Investors” section of CVG’s website at ir.cvgrp.com where it will be archived for one year.
A telephonic replay of the conference call will be available until August 19, 2025. To access the replay, toll-free callers can dial (+1) 888 660 6264 using access code 72110 #, and toll callers in North America and other locations can dial (+1) 289 819 1325.
About CVG
At CVG, we deliver real solutions to complex design, engineering and manufacturing problems while creating positive change for our customers, industries, and communities we serve. Information about the Company and its products is available on the internet at www.cvgrp.com.
Investor Relations Contact: Ross Collins or Stephen Poe Alpha IR Group [email protected]
Mark Reichman, Managing Director, Equity Research Analyst, Natural Resources, Noble Capital Markets, Inc.
Refer to the full report for the price target, fundamental analysis, and rating.
First quarter financial results. For the first quarter of fiscal year (FY) 2026, AZZ reported adjusted net income of $53.8 million or $1.78 per share compared to $44.0 million or $1.46 per share during the prior year period and our estimate of $50.1 million or $1.66 per share. Compared to the first quarter of FY 2025, sales increased 2.1% to $422.0 million. Adjusted EBITDA increased 13.1% to $106.4 million, representing 25.2% of sales compared to 22.8% of sales during the prior year period.
Updating estimates. We have increased our FY 2026 EBITDA and EPS estimates to $388.3 million and $6.00, respectively, from $381.7 million and $5.83. In FY 2026, our estimates reflect average gross margins of 30.0% and 20.3% for the Metal Coatings and Precoat Metals segments, respectively. Moreover, we have published our estimates for 2027 through 2031 in the back of this report. Our forward estimates reflect an average 30.5% gross margin as a percentage of sales for the Metal Coatings segment, compared to the prior average of 28.0%. The average gross margin as a percentage of sales for the Precoat Metals business is unchanged at 20.3%.
Equity Research is available at no cost to Registered users of Channelchek. Not a Member? Click ‘Join’ to join the Channelchek Community. There is no cost to register, and we never collect credit card information.
This Company Sponsored Research is provided by Noble Capital Markets, Inc., a FINRA and S.E.C. registered broker-dealer (B/D).
*Analyst certification and important disclosures included in the full report. NOTE: investment decisions should not be based upon the content of this research summary. Proper due diligence is required before making any investment decision.
CHICAGO, July 9, 2025 /PRNewswire/ — Titan International, Inc. will release its second quarter 2025 financial results before the opening of the market on Thursday, July 31, 2025 to be followed by a teleconference and webcast on Thursday, July 31, 2025 at 9:00 a.m. Eastern Time.
About Titan: Titan International, Inc. (NYSE: TWI) is a leading global manufacturer of off-highway wheels, tires, assemblies, and undercarriage products. Headquartered in West Chicago, Illinois, the company globally produces a broad range of products to meet the specifications of original equipment manufacturers (OEMs) and aftermarket customers in the agricultural, earthmoving/construction, and consumer markets. For more information, visit www.titan-intl.com.
President Trump dramatically escalated his global trade offensive Monday, announcing 25% tariffs on imports from Japan and South Korea while threatening even higher duties on nations aligning with BRICS policies he deems “anti-American.” The move marks a significant expansion of the administration’s protectionist agenda beyond traditional targets like China.
The President posted formal notification letters to both Asian allies on social media, declaring the tariffs would take effect August 1. The announcement caught markets and diplomatic circles off guard, as both Japan and South Korea have been key U.S. allies for decades and major trading partners in critical technology sectors.
Trump’s tariff strategy appears designed to leverage economic pressure for broader geopolitical objectives. In his letter to Japanese Prime Minister, Trump offered a clear carrot-and-stick approach: “There will be no Tariff if Japan, or companies within your Country, decide to build or manufacture product within the United States.”
The administration promises expedited approvals for companies willing to relocate manufacturing operations to American soil, potentially completing the process “in a matter of weeks” rather than the typical months or years required for major industrial projects.
This represents a significant shift from traditional trade diplomacy, using tariff threats as direct incentives for foreign investment and manufacturing relocation. The approach mirrors tactics used successfully with several other trading partners, where the threat of punitive duties has led to increased American manufacturing commitments.
Perhaps most concerning for global trade stability, Trump explicitly warned both countries that any retaliatory tariffs would be met with equivalent increases in U.S. duties. This tit-for-tat escalation mechanism could quickly spiral into a destructive trade war with America’s closest Pacific allies.
The President cited “long-term, and very persistent” trade deficits as justification for restructuring these relationships. Japan previously faced 24% tariffs in April before a temporary pause, while South Korea had been subject to 25% rates, suggesting the administration views these levels as baseline positions rather than maximum penalties.
The tariff announcements represent just the latest moves in Trump’s comprehensive trade realignment strategy. The administration has been systematically addressing trade relationships across multiple continents, with varying degrees of success and diplomatic tension.
Recent developments elsewhere show the mixed results of this approach. China has seen some easing of tensions, with the U.S. relaxing export restrictions on chip design software and ethane following framework agreements toward a broader trade deal. Vietnam reached accommodation with a 20% tariff rate—substantially lower than the 46% originally threatened—though facing 40% duties on transshipped goods.
The European Union has signaled willingness to accept 10% universal tariffs while seeking sector-specific exemptions, indicating established trading blocs are adapting to the new reality rather than engaging in prolonged resistance.
The targeting of Japan and South Korea creates particular challenges given their roles as critical technology suppliers and security partners. Both nations are integral to global semiconductor supply chains, with South Korean companies like Samsung and SK Hynix playing essential roles in memory chip production, while Japanese firms dominate specialized manufacturing equipment and materials.
The timing appears strategic, occurring as the administration faces domestic pressure to demonstrate progress on trade deficit reduction while maintaining leverage in ongoing negotiations with other partners. The threat of duties reaching as high as 70% on some goods creates enormous uncertainty for businesses planning international supply chain strategies.
Canada’s recent decision to scrap its digital services tax affecting U.S. technology companies demonstrates how the tariff threat environment is reshaping international policy decisions. The White House indicated trade talks with Canada have resumed, targeting a mid-July agreement deadline.
This pattern suggests the administration’s approach of combining immediate tariff threats with longer-term negotiation windows may be yielding results in some cases, even as it strains traditional alliance relationships.
As more notification letters are expected today, global markets are bracing for additional announcements that could further reshape international trade relationships and supply chain strategies worldwide.
Joe Gomes, CFA, Managing Director, Equity Research Analyst, Generalist , Noble Capital Markets, Inc.
Refer to the full report for the price target, fundamental analysis, and rating.
Initiation of Research Coverage. We are initiating research coverage of Titan International with an Outperform rating and an $11 price target. Titan is a worldwide leader in the manufacture of off road wheels, tires, and undercarriages for the agriculture, construction, mining, and consumer space.
Transformation. Titan has undergone a strategic transformation since 2019. Management has restructured the Company, eliminating non-core assets, improving the balance sheet, and diversifying the business through acquisitions. Though still subject to cyclicality of its end markets, we believe Titan is well positioned to capitalize on improving end market demand.
Equity Research is available at no cost to Registered users of Channelchek. Not a Member? Click ‘Join’ to join the Channelchek Community. There is no cost to register, and we never collect credit card information.
This Company Sponsored Research is provided by Noble Capital Markets, Inc., a FINRA and S.E.C. registered broker-dealer (B/D).
*Analyst certification and important disclosures included in the full report. NOTE: investment decisions should not be based upon the content of this research summary. Proper due diligence is required before making any investment decision.
The U.S. manufacturing sector continues to show signs of stress, with May’s ISM Manufacturing PMI slipping further into contraction territory at 48.5 — down from April’s 48.7. This persistent decline highlights the fragility of the sector amid deepening global trade tensions and domestic economic uncertainty. Perhaps more alarmingly, U.S. imports plunged to their lowest levels since 2009, registering a reading of 39.9, a significant drop from April’s 47.1.
This steep decline in imports reflects both softening demand and the growing impact of tariffs, many of which have been reintroduced or expanded under President Trump’s revised trade policy. According to Susan Spence of the ISM Manufacturing Business Survey Committee, tariffs were the most cited concern among respondents — with 86% mentioning them. Several likened the current climate to the disarray of the early pandemic.
For small-cap stocks, especially those tied to industrials, materials, and manufacturing, this environment spells both challenge and opportunity. Small caps are often more domestically focused than their large-cap counterparts and tend to be more sensitive to economic cycles. When manufacturing slows, these companies typically suffer more acutely from reduced orders, higher input costs due to tariffs, and tighter margins.
However, the current backdrop is more nuanced. While ISM’s index showed contraction, S&P Global’s separate gauge of manufacturing activity rose to 52, indicating slight expansion. Yet, even that report carried warnings: Chief economist Chris Williamson noted that the uptick is likely temporary, driven by inventory hoarding amid fears of supply chain issues and rising prices.
This divergence reveals how mixed signals are becoming the norm — complicating investment strategies in the small-cap space. On one hand, small manufacturers that rely on imported materials face margin pressure from rising input costs due to tariffs. On the other, those able to localize supply chains or produce domestically could benefit from reshoring trends and domestic inventory build-up.
For investors, the key takeaway is caution, not panic. Many small-cap industrials are already priced for a slowdown, but those with strong balance sheets and pricing power may weather the storm — or even gain market share as competitors falter. Meanwhile, increased inventory levels could provide short-term tailwinds, though that may evaporate quickly if demand doesn’t keep pace.
Marketwide, prolonged manufacturing contraction can pressure broader economic indicators, especially employment and capital spending, ultimately weighing on the S&P 500 and Dow. The Nasdaq, less exposed to traditional manufacturing, may prove more resilient.
In conclusion, the state of U.S. manufacturing is flashing caution signs, especially for small-cap stocks in the sector. While short-term inventory surges and reshoring trends may offer brief relief, the longer-term picture remains clouded by tariff uncertainties and fragile global trade relations. Investors would be wise to look for companies with flexible supply chains, diversified revenue streams, and strong cash positions as potential outperformers in this challenging landscape.
First quarter sales of $170 million, EPS of $(0.09), Adjusted EBITDA of $5.8 million Significantly improved free cash flow enables further debt paydown Updates guidance for full year 2025
NEW ALBANY, Ohio, May 06, 2025 (GLOBE NEWSWIRE) — CVG (NASDAQ: CVGI), a diversified industrial products and services company, today announced financial results for its first quarter ended March 31, 2025.
During the quarter, the Company completed a strategic reorganization of its operations into three segments: Global Seating, Global Electrical Systems, and Trim Systems and Components. The results and comparisons presented below reflect continuing operations unless otherwise noted.
First Quarter 2025 Highlights(Results from Continuing Operations; compared with prior year, where comparisons are noted)
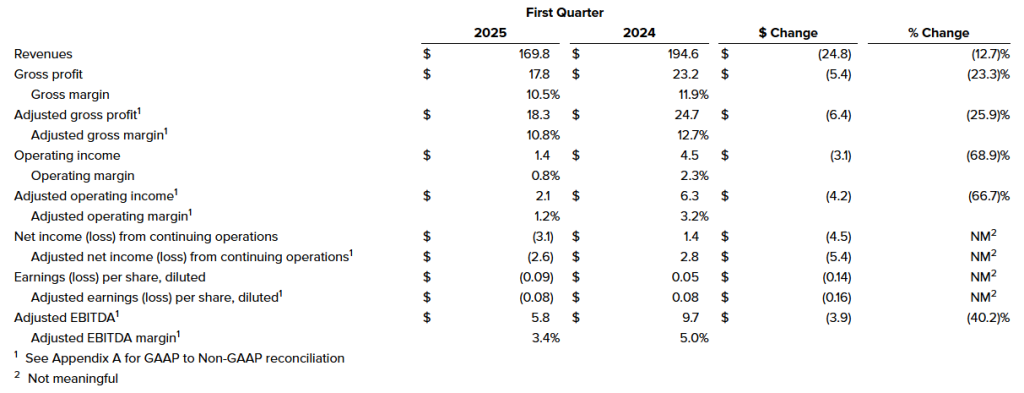
Revenues of $169.8 million, down 12.7%, primarily due to softening in global Construction and Agriculture markets and North America Class 8 truck demand.
Operating income of $1.4 million, adjusted operating income of $2.1 million, down compared to operating income of $4.5 million and adjusted operating income of $6.3 million. The decrease in operating income was driven primarily by lower sales volumes offset by reductions in SG&A expense.
Net loss from continuing operations of $3.1 million, or $(0.09) per diluted share and adjusted net loss of $2.6 million, or $(0.08) per diluted share, compared to net income from continuing operations of $1.4 million, or $0.05 per diluted share and adjusted net income of $2.8 million, or $0.08 per diluted share.
Adjusted EBITDA of $5.8 million, down 40.2%, with an adjusted EBITDA margin of 3.4%, down from 5.0%.
Free cash flow of $11.2 million, up $17.7 million, due to better working capital management. Net debt decreased $11.7 million compared to the year end 2024 level.
Gross margin expansion of 250 basis points versus Q4 2024 due to operational efficiency improvements and conclusion of one-time cost drivers from 2024.
James Ray, President and Chief Executive Officer, said, “Our first quarter results demonstrate sequential improvement in margins and free cash flow. Cash generation and debt paydown remain key priorities for CVG, as we look to build on our strong free cash performance in the first quarter through further margin improvement, working capital reduction, and reduced capital expenditures. We are beginning to see the benefits of efforts made in 2024, including strategic divestments of non-core businesses, to transform CVG. These divestitures, as well as our priority on improving operational efficiency, have allowed us to streamline operations, lower our cost structure, and drive cash generation to pay down debt. Despite industry-wide and global macroeconomic headwinds, we are prioritizing strong execution from the top down within CVG focused on cost mitigation, margin improvement, and operational efficiency.”
Mr. Ray continued, “The actions we took last year position us well for the future. Change management is always difficult, and I would personally like to thank the entire CVG team for their efforts throughout the process. I would like to thank Bob Griffin, our current Chairman, for his contributions to CVG’s strategic goals and priorities over the years. I am also excited to continue working with Bill Johnson, a current board member who is expected to become the Chairman of the Board following Mr. Griffin’s retirement, effective May 15, 2025. While we acknowledge the current macroeconomic uncertainties and geopolitical environment, the transformation undertaken in 2024 makes CVG a lower cost, more nimble company, better positioned to navigate these challenges. We are committed to execution, delivery, and driving operational efficiency, while managing the potential impact of trade policy.”
Andy Cheung, Chief Financial Officer, added, “We are encouraged by the quarter-over-quarter improvement in our financial performance, as we start to see the benefits of our strategic portfolio realignment and operational efficiency efforts. However, given the economic environment and policy concerns, we are adjusting our outlook to reflect current market conditions. Our focused portfolio, now more closely aligned with our customers through our re-segmentation, positions us for improved value capture as end markets recover.”
First Quarter Financial Results from Continuing Operations (amounts in millions except per share data and percentages)
Consolidated Results from Continuing Operations
First Quarter 2025 Results
First quarter 2025 revenues were $169.8 million, compared to $194.6 million in the prior year period, a decrease of 12.7%. The overall decrease in revenues was due to lower sales as a result of a softening in customer demand across all segments.
Operating income in the first quarter 2025 was $1.4 million compared to $4.5 million in the prior year period. The decrease in operating income was attributable to the impact of lower sales volumes. First quarter 2025 adjusted operating income was $2.1 million, compared to $6.3 million in the prior year period.
Interest associated with debt and other expenses was $2.5 million and $2.2 million for the first quarter 2025 and 2024, respectively.
Net loss from continuing operations was $3.1 million, or $(0.09) per diluted share, for the first quarter 2025 compared to net income of $1.4 million, or $0.05 per diluted share, in the prior year period. First quarter 2025 adjusted net loss from continuing operations was $2.6 million, or $(0.08) per diluted share, compared to adjusted net income of $2.8 million, or $0.08 per diluted share.
On March 31, 2025, the Company had $32.4 million of outstanding borrowings on its U.S. revolving credit facility and no outstanding borrowings on its China credit facility, $20.2 million of cash and $102.5 million of availability from the credit facilities (subject to covenant limitations), resulting in total liquidity of $122.7 million.
First Quarter 2025 Segment Results
Global Seating Segment
Revenues were $73.4 million compared to $80.8 million for the prior year period, a decrease of 9.1%, due to lower sales volume as a result of decreased customer demand.
Operating income was $2.7 million, compared $2.8 million in the prior year period, a decrease of 3.0%, primarily attributable to lower sales volume and increased freight costs. First quarter 2025 adjusted operating income was $2.7 million compared to $2.8 million in the prior year period.
Global Electrical Systems Segment
Revenues were $50.5 million compared to $58.7 million in the prior year period, a decrease of 14.1%, primarily as a result of decreased customer demand.
Operating loss was $0.3 million compared to operating income of $0.4 million in the prior year period. The decrease in operating income was primarily attributable to lower sales volumes and unfavorable foreign exchange impacts. First quarter 2025 adjusted operating income was $0.2 million compared to $1.5 million in the prior year period.
Trim Systems and Components Segment
Revenues were $45.9 million compared to $55.1 million in the prior year period, a decrease of 16.6%, primarily as a result of decreased customer demand.
Operating income was $1.5 million compared to $4.2 million in the prior year period, a decrease of 63.5%. The decrease in operating income was primarily attributable to lower sales volume and increased freight costs. First quarter 2025 adjusted operating income was $1.6 million compared to $4.7 million in the prior year period.
Outlook
CVG updated the Company’s outlook for the full year 2025, based on current market conditions:
This outlook reflects, among others, current industry forecasts for North America Class 8 truck builds. According to ACT Research, 2025 North American Class 8 truck production levels are expected to be at 255,000 units. The 2024 actual Class 8 truck builds according to the ACT Research was 332,372 units.
Construction and Agriculture end markets are projected to decline approximately 5-15% in 2025. However, we expect the contribution from new business wins outside of Construction and Agriculture end markets in Electrical Systems to soften this decline.
GAAP to Non-GAAP Reconciliation
A reconciliation of GAAP to non-GAAP financial measures referenced in this release is included as Appendix A to this release.
Conference Call
A conference call to discuss this press release is scheduled for Wednesday, May 7, 2025, at 8:30 a.m. ET. Management intends to reference the Q1 2025 Earnings Call Presentation during the conference call. To participate, dial (800) 549-8228 using conference code 57416. International participants dial (289) 819-1520 using conference code 57416.
This call is being webcast and can be accessed through the “Investors” section of CVG’s website at ir.cvgrp.com, where it will be archived for one year.
A telephonic replay of the conference call will be available for a period of two weeks following the call. To access the replay, dial (888) 660-6264 using access code 57416#.
Company Contact Andy Cheung Chief Financial Officer CVG [email protected]
Investor Relations Contact Ross Collins or Stephen Poe Alpha IR Group [email protected]
About CVG
CVG is a global provider of systems, assemblies and components to the global commercial vehicle market and the electric vehicle market. We deliver real solutions to complex design, engineering and manufacturing problems while creating positive change for our customers, industries and communities we serve. Information about the Company and its products is available on the internet at www.cvgrp.com.
Forward-Looking Statements
This press release contains forward-looking statements that are subject to risks and uncertainties. These statements often include words such as “believe”, “anticipate”, “plan”, “expect”, “intend”, “will”, “should”, “could”, “would”, “project”, “continue”, “likely”, and similar expressions. In particular, this press release may contain forward-looking statements about the Company’s expectations for future periods with respect to its plans to improve financial results, the future of the Company’s end markets, changes in the Class 8 and Class 5-7 North America truck build rates, performance of the global construction and agricultural equipment business, the Company’s prospects in the wire harness, and electric vehicle markets, the Company’s initiatives to address customer needs, organic growth, the Company’s strategic plans and plans to focus on certain segments, competition faced by the Company, volatility in and disruption to the global economic environment and the Company’s financial position or other financial information. These statements are based on certain assumptions that the Company has made in light of its experience as well as its perspective on historical trends, current conditions, expected future developments and other factors it believes are appropriate under the circumstances. Actual results may differ materially from the anticipated results because of certain risks and uncertainties, including those included in the Company’s filings with the SEC. There can be no assurance that statements made in this press release relating to future events will be achieved. The Company undertakes no obligation to update or revise forward-looking statements to reflect changed assumptions, the occurrence of unanticipated events or changes to future operating results over time. All subsequent written and oral forward-looking statements attributable to the Company or persons acting on behalf of the Company are expressly qualified in their entirety by such cautionary statements.
Other Information
Throughout this document, certain numbers in the tables or elsewhere may not sum due to rounding. Rounding may have also impacted the presentation of certain year-on-year percentage changes.
Key Points: – Astec Industries will acquire TerraSource Holdings for $245 million in cash, expanding its scale, global reach, and aftermarket parts business. – Astec posted a 6.5% increase in net sales to $329.4 million and more than quadrupled net income to $14.3 million year-over-year. – The acquisition is expected to be earnings accretive from day one, with $10 million in expected run-rate synergies and a 5.9x adjusted EBITDA multiple.
Astec Industries (NASDAQ: ASTE) reported a robust start to the year, posting solid first-quarter earnings and announcing a definitive agreement to acquire TerraSource Holdings, LLC in a $245 million cash deal. The acquisition, expected to close in early Q3 pending regulatory approvals, will significantly expand Astec’s scale, aftermarket revenue, and presence in adjacent material processing markets.
The Tennessee-based manufacturer of infrastructure and materials processing equipment posted Q1 net sales of $329.4 million, a 6.5% increase from the same period last year. Net income surged to $14.3 million, or $0.62 per diluted share, from $3.4 million, or $0.15 per share, in the prior year. Adjusted net income came in at $20.3 million, or $0.88 per share, while adjusted EBITDA jumped 86% to $35.2 million. Free cash flow was reported at $16.6 million.
“We are pleased to report another strong quarter in line with our plans to deliver consistency, profitability, and growth,” said Astec CEO Jaco van der Merwe. “The TerraSource acquisition adds scale and accretive margins, opens access to new markets, and strengthens our aftermarket parts offering—all aligned with our disciplined growth strategy.”
TerraSource, a material processing equipment manufacturer with over $150 million in annual revenue, brings a robust aftermarket business to the table. Roughly 60% of its revenues and 80% of its gross profit are derived from aftermarket parts—a key area of focus for Astec as it looks to increase recurring revenue and margin stability.
Astec said the deal, financed through cash on hand and new committed financing, is expected to be accretive to earnings immediately. With expected run-rate synergies of $10 million within two years and tax benefits of approximately $15 million, the transaction represents an adjusted EBITDA multiple of 5.9x.
From a segment standpoint, Astec’s Infrastructure Solutions division led Q1 performance with $236 million in sales, up 16.7% year-over-year, benefiting from strong demand in road building and concrete plants. The Materials Solutions division, however, saw a 12.7% decline to $93.4 million due to softer domestic equipment sales, though dealer interest remained high.
CFO Brian Harris emphasized the financial strength behind the transaction, noting that “TerraSource enhances our financial profile with expanded margins and quality of earnings. The acquisition aligns with our strategy and positions us for long-term growth.”
Despite a 28% year-over-year drop in backlog—down to $402.6 million—Astec remains confident in its ability to convert new demand as infrastructure markets evolve and financing capacity improves across contractor and dealer channels.
The TerraSource acquisition adds meaningful scale and global reach for Astec, reinforcing its position as a top-tier provider of material and infrastructure solutions. The company is expected to maintain its adjusted EBITDA guidance of $105 million to $125 million for the full year, excluding the pending deal.
With strong financials, a growing aftermarket footprint, and a major acquisition in play, Astec is positioning itself for long-term gains amid rising global infrastructure needs. Investors responded favorably in early trading, with Astec shares ticking higher following the announcement
Orders Highlight Continued Strength Across Diverse Product Offerings
CHICAGO, April 24, 2025 (GLOBE NEWSWIRE) — FreightCar America, Inc. (NASDAQ: RAIL) (“FreightCar America” or the “Company”), a diversified manufacturer and supplier of railroad freight cars, railcar parts, and components, today announced that it received total orders valued at approximately $141 million, representing a total of 1,250 railcars, during the quarter ended March 31, 2025. These orders underscore ongoing demand for FreightCar America’s railcar offerings and reflect continued market share gains.
FreightCar America continues to gain share within its core railcar markets, driven by strategic initiatives aimed at increasing operational efficiency, product innovation, and commercial excellence. The orders represent approximately 25% of all new railcars ordered in the quarter, and 36% in our addressable market, marking the largest new railcar market share quarter intake in 15 years.
Nick Randall, President and Chief Executive Officer of FreightCar America, commented, “We are pleased to see sustained customer interest across our product portfolio, particularly in gondolas, open-top hoppers and covered hopper cars, which remain an integral part of our diverse portfolio of railcar types. Our manufacturing agility and ability to capture these opportunities highlights our competitive strengths.”
Randall continued, “We have been monitoring recent tariff developments and based on our current understanding, railcars sold by FreightCar America in North America are not subject to tariffs due to their compliance with the United States-Mexico-Canada Agreement. We continue to monitor any tariff developments. With our supply chain strategy, operational excellence initiatives at our manufacturing facility and continued commercial momentum, we remain confident in our forward trajectory.”
Certain orders referenced in this release are subject to customary documentation and completion of terms.
About FreightCar America
FreightCar America, headquartered in Chicago, Illinois, is a leading designer, producer and supplier of railroad freight cars, railcar parts and components. We also specialize in railcar repairs, complete railcar rebody services and railcar conversions that repurpose idled rail assets back into revenue service. Since 1901, our customers have trusted us to build quality railcars that are critical to economic growth and instrumental to the North American supply chain. To learn more about FreightCar America, visit www.freightcaramerica.com.
Forward-Looking Statements
This press release contains statements relating to our expected financial performance, financial condition, and/or future business prospects, events and/or plans that are “forward-looking statements” as defined under the Private Securities Litigation Reform Act of 1995. Forward-looking statements represent our estimates and assumptions only as of the date of this press release. Our actual results may differ materially from the results described in or anticipated by our forward-looking statements due to certain risks and uncertainties. These potential risks and uncertainties relate to, among other things, the cyclical nature of our business; adverse economic and market conditions, including inflation; material disruption in the movement of rail traffic for deliveries; fluctuating costs of raw materials, including steel and aluminum; delays in the delivery of raw materials; our ability to maintain relationships with our suppliers of railcar components; our reliance upon a small number of customers that represent a large percentage of our sales; the variable purchase patterns of our customers and the timing of completion; delivery and customer acceptance of orders; the highly competitive nature of our industry; the risk of lack of acceptance of our new railcar offerings; potential unexpected changes in laws, rules, and regulatory requirements, including tariffs and trade barriers (including recent United States tariffs imposed or threatened to be imposed on China, Canada, Mexico and other countries and any retaliatory actions taken by such countries); and other competitive factors. The factors listed above are not exhaustive. New factors emerge from time to time that may cause our business not to develop as we expect, and it is not possible for us to predict all of them. We expressly disclaim any duty to provide updates to any forward-looking statements made in this press release, whether as a result of new information, future events or otherwise.
NEW ALBANY, Ohio, April 23, 2025 (GLOBE NEWSWIRE) — Commercial Vehicle Group (the “Company” or “CVG”) (NASDAQ: CVGI) will hold its quarterly conference call on Wednesday, May 7, 2025, at 8:30 a.m. ET, to discuss first quarter 2025 financial results. CVG will issue a press release and presentation prior to the conference call.
Toll-free participants dial (800) 549-8228 using conference code 57416. International participants dial (289) 819-1520 using conference code 57416. This call is being webcast and can be accessed through the “Investors” section of CVG’s website at ir.cvgrp.com where it will be archived for one year.
A telephonic replay of the conference call will be available until May 21, 2025. To access the replay, toll-free callers can dial (+1) 888 660 6264 using access code 57416 #, and toll callers in North America and other locations can dial (+1) 289 819 1325.
About CVG
At CVG, we deliver real solutions to complex design, engineering and manufacturing problems while creating positive change for our customers, industries, and communities we serve. Information about the Company and its products is available on the internet at www.cvgrp.com.
Investor Relations Contact: Ross Collins or Stephen Poe Alpha IR Group [email protected]