Research News and Market Data on NMAX
March 26, 2026
Company Reports Record Full-Year Revenues of $189.3 million, a 10.7% Year-Over-Year Increase, Outpacing Election-Year Comparison
Broadcast Revenues Increase to $153.3 million, a 17.3% Increase Year-Over-Year
Newsmax Remains the Fourth Highest-Rated Cable News Channel, Reaching More Than 58 Million Total Viewers
Company Projects Accelerated Revenue Growth in 2026
BOCA RATON, FL / ACCESS Newswire / March 26, 2026 / Newsmax Inc. (NYSE:NMAX) (“Newsmax” or the “Company”) today announced its financial results for the fourth quarter and full-year ended December 31, 2025.
2025 Business and Operational Highlights
- Delivered record full-year 2025 revenues of $189.3 million, representing a 10.7% year-over-year increase and achieving results at the high end of the Company’s full-year guidance range, despite a challenging post-election year comparison.
- Expanded domestic distribution through new and renewed multi-year carriage agreements, including a multi-year renewal with YouTube TV, maintaining Newsmax’s placement in the platform’s base package and extending Newsmax+ availability through YouTube Prime-time Channels beginning in 2026.
- Advanced the Company’s international expansion strategy through new multi-year distribution agreements across Europe and the Middle East, including launches in France, Israel and Cyprus, and a brand license agreement to launch Newsmax Ukraine, extending the Company’s reach to more than 100 countries worldwide.
- Continued to scale the Company’s streaming and digital platforms through the expansion of Newsmax2 across major FAST and connected TV platforms and ongoing investment in exclusive content for the Newsmax+ subscription service.
- Maintained Newsmax’s position as the fourth highest-rated cable news channel in the United States while expanding total audience reach across cable, streaming, digital and social media platforms, reaching more than 58 million total viewers in 2025 and finishing #6 among all cable channels in total day ratings, according to Nielsen.
Management Commentary
“Fiscal year 2025 was a defining year for Newsmax,” said Christopher Ruddy, Chief Executive Officer of Newsmax. “In our first year as a public company, we delivered double digit revenue growth and expanded our audience reach across cable, FAST and digital platforms, even in a non-election year when industry-wide viewership and advertising demand typically normalize. We broadened both our domestic and international distribution footprint, extending Newsmax to new platforms and markets around the world, while reinforcing our position as the fourth highest-rated cable news network. These achievements underscore the strength of our multi-platform model and diversified revenue streams that benefit from the continued demand for independent, values-driven journalism, which resonates with audiences across all of our platforms.”
Ruddy continued, “Looking ahead, with key milestones completed and the costs of becoming a public company largely absorbed, we are well positioned to accelerate our growth trajectory with strategic investment initiatives across content, distribution and technology. As we enter 2026 , we believe Newsmax is entering this next chapter from a position of strength, supported by a solid financial foundation, expanding distribution and a clear focus on sustainable, long-term growth for our shareholders.”
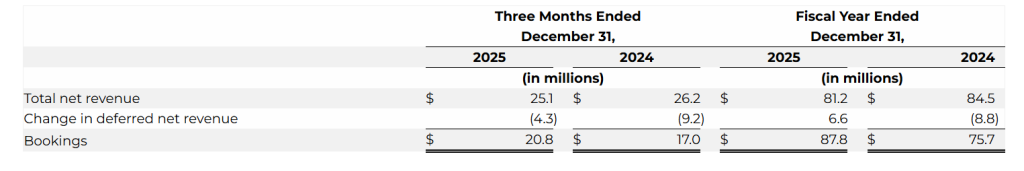
Financial Results:
Revenue by Segment by Component Summary Table (unaudited):
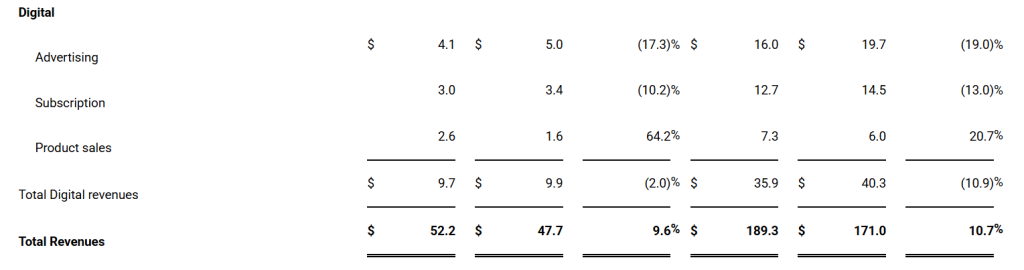
Fourth Quarter 2025 Financial Highlights:
- Newsmax reported total quarterly revenues of $52.2 million for the three-month period ended December 31, 2025, representing a 9.6% year-over-year increase.
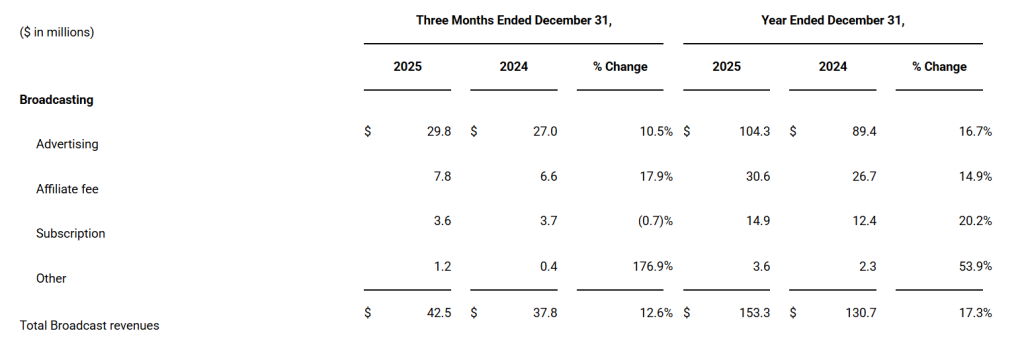
- Total broadcasting revenues grew 12.6% year-over year to $42.5 million for the fourth quarter of 2025, underscoring continued growth even in a non-election year. This was driven by affiliate fee revenue growth, higher ratings and pricing for broadcasting ad revenue, and licensing growth.
- Newsmax reported a quarterly Net Loss of $(3.0) million as compared to a net loss of $(6.9) million reported in same quarter in the prior year, primarily driven by higher strategic investments in headcount, programming and production capabilities to support the ongoing expansion and enhancement of our content offering, stock-based compensation costs, offset by higher broadcasting advertising, affiliate fees, book sales and licensing revenue.
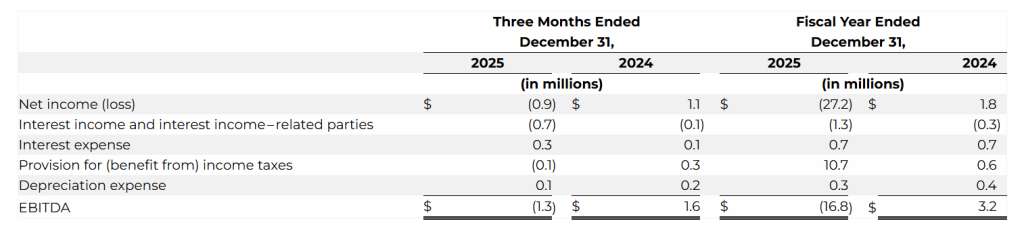
- Quarterly adjusted EBITDA was $(1.3) million, a decrease of $(3.8) million from the amount reported in the same quarter last year, primarily due to higher production and programming expense, increased personnel, increase legal, consulting and public company costs. (See reconciliation of net loss to adjusted EBITDA below).
- The Company ended the quarter with $131.3 million in cash and short-term investments. cash and cash equivalents were $20.4 million and short-term investments were $110.9 million.
Fiscal Year 2025 Financial Highlights:
- Newsmax reported total revenues of $189.3 million for the year ended December 31, 2025, representing a 10.7% year-over-year increase.
- Total broadcasting revenues increased 17.3% year-over-year to $153.3 million, driven by an increase in advertising revenue due to higher ratings and pricing, timing of new affiliate contractual relationships and growth of subscription revenue from Newsmax+.
- Newsmax reported a net loss of $(99.5) million for full year 2025, largely driven by approximately $79 million in legal settlement expenses, along with stock-based compensation costs, non-cash derivative and warrant liability adjustment and higher production and programming investments, partially offset by higher Broadcasting advertising revenues, affiliate fees and licensing fees.
- Full-year adjusted EBITDA was $(6.5) million, reflecting continued strategic investments in content, talent, technology and public company infrastructure. (See reconciliation of net loss to adjusted EBITDA below).
Fiscal Year 2026 Outlook
The Company is issuing full-year 2026 guidance as follows:
- Full-year revenue of $212 million to $216 million, representing 13% year-over-year growth at the midpoint of the range.
“Our full-year 2025 results reflect disciplined execution across the business, with revenue performance at the high end of our guidance range despite a challenging post-election comparison,” commented Darryle Burnham, Chief Financial Officer of Newsmax. “We ended the year with a strong balance sheet and increased financial flexibility following our transition to a public company, and as we look ahead, we are confident in our financial outlook and are focused on prudent investment in content, technology and distribution initiatives that support sustainable, long-term shareholder value.”
About Newsmax
Newsmax Inc. is listed on the NYSE (NMAX) and operates, through Newsmax Broadcasting LLC, one of the nation’s leading news outlets, the Newsmax channel. The fourth highest-rated network is carried on all major pay TV providers. Newsmax’s media properties reach more than 50 million Americans regularly through Newsmax TV, the Newsmax App, its popular website Newsmax.com, and publications such as Newsmax Magazine. Through its social media accounts, Newsmax reaches over 24 million combined followers. Reuters Institute says Newsmax is one of the top U.S. news brands and Forbes has called Newsmax “a news powerhouse.”
For more information, please visit Investor Relations | Newsmax Inc.
Investor Contacts
Newsmax Investor Relations
ir@newsmax.com
Forward-Looking Statements
This communication contains forward-looking statements. From time to time, we or our representatives may make forward-looking statements orally or in writing. We base these forward-looking statements on our expectations and projections about future events, which we derive from the information currently available to us. Forward-looking statements can be identified by those that are not historical in nature. The forward-looking statements discussed in this communication and other statements made from time to time by us or our representatives, may not occur, and actual events and results may differ materially and are subject to risks, uncertainties and assumptions about us. Newsmax does not guarantee future results, performance or achievements. Moreover, neither we nor any other person assumes responsibility for the accuracy or completeness of any of these forward-looking statements. Forward-looking statements should not be relied upon as predictions of future events. We are under no duty to update any of these forward-looking statements after the date of this communication to conform our prior statements to actual results or revised expectations, and we do not intend to do so. Factors that may cause actual results to differ materially from current expectations include various factors, including but not limited changes in domestic and global general economic and macro-economic conditions and the volatility of the price of Common Stock that may result from, among other things, comments by securities analysts or other third parties, including blogs, articles, message boards and social and other media, large shareholders exiting their position in our Common Stock, any negative public perception of us, sales of shares previously registered for resale, or other uncertainties and the factors set forth in the sections entitled “Risk Factors” in Newsmax’s Annual Report on Form 10-K for the twelve months ended December 31, 2025 and other filings Newsmax makes with the Securities and Exchange Commission. Nothing in this communication should be regarded as a representation by any person that the forward-looking statements set forth herein will be achieved or that any of the contemplated results of such forward-looking statements will be achieved. Undue reliance should not be placed on forward-looking statements in this communication, which speak only as of the date they are made and are qualified in their entirety by reference to the cautionary statements herein.
USE AND DEFINITION OF NON-GAAP FINANCIAL MEASURES
This press release contains a financial measure that has not been prepared in accordance with United States Generally Accepted Accounting Principles (“U.S. GAAP”). This financial measure is Adjusted EBITDA.
Non-GAAP financial measures are used to supplement the financial information presented on a U.S. GAAP basis and should not be considered in isolation or as a substitute for the relevant U.S. GAAP measures and should be read in conjunction with information presented on a U.S. GAAP basis. Because not all companies use identical calculations, our presentation of Non-GAAP measures may not be comparable to other similarly titled measures of other companies.
Adjusted EBITDA1 is defined as revenues less cost of revenues and general and administrative expenses and does not include depreciation and amortization, interest expense, net, impairment charges, unrealized gains (losses) on marketable securities, other corporate matters (consisting primarily of certain litigation expenses, and related fees, for specific legal proceedings that the Company has determined are infrequent and unusual in terms of their magnitude), other, net, and income tax expense.
You are encouraged to evaluate each adjustment used in calculating our non-GAAP financial measure and the reasons we consider our non-GAAP financial measure appropriate for supplemental analysis. In evaluating our non-GAAP financial measure, you should be aware that in the future we may incur expenses similar to the adjustments in our presentation. Our non-GAAP financial measure has limitations as an analytical tool, and you should not consider this measure in isolation or as a substitute for analysis of our results as reported under GAAP. Our presentation of our non-GAAP financial measure should not be construed as an inference that our future results will be unaffected by unusual or non-recurring items. Our non-GAAP financial measure may not be comparable to other companies. Please see a historical reconciliation of this measure to the most comparable GAAP measure presented in our consolidated financial statements below.
_________________
1 The Company compensates for limitations of the adjusted EBITDA measure by prominently disclosing GAAP net income (loss), which the Company believes is the most directly comparable GAAP measure, and providing investors with a reconciliation from GAAP net loss to adjusted EBITDA on page 11.