BOCA RATON, Fla.–(BUSINESS WIRE)–Jun. 9, 2025– The GEO Group, Inc. (NYSE: GEO) (“GEO” or the “Company”) announced today that U.S. Immigration and Customs Enforcement (“ICE”) has executed a contract modification, effective June 6, 2025, to activate a federal immigration processing center at the GEO-owned, 1,868-bed D. Ray James Facility (the “Facility”) in Folkston, Georgia under the existing intergovernmental service agreement (“IGSA”) involving the GEO-owned, 1,118-bed Folkston ICE Processing Center.
Under the modified IGSA, GEO expects to generate approximately $66 million in incremental annualized revenues in the first full year of operations, with margins consistent with GEO’s company-owned Secure Services facilities. GEO’s support services will include the exclusive use of this federal facility by ICE, along with security, maintenance, and food services, as well as access to recreational amenities, medical care, and legal counsel.
George C. Zoley, Executive Chairman of GEO, said, “We expect that our company-owned D. Ray James Facility in Georgia will play an important role in helping meet the need for increased federal immigration processing center bedspace. We are proud of our 40-year public-private partnership with ICE, and we stand ready to continue to help the federal government meet its expanded immigration enforcement priorities.”
About The GEO Group
The GEO Group, Inc. (NYSE: GEO) is a leading diversified government service provider, specializing in design, financing, development, and support services for secure facilities, processing centers, and community reentry centers in the United States, Australia, South Africa, and the United Kingdom. GEO’s diversified services include enhanced in-custody rehabilitation and post-release support through the award-winning GEO Continuum of Care®, secure transportation, electronic monitoring, community-based programs, and correctional health and mental health care. GEO’s worldwide operations include the ownership and/or delivery of support services for 98 facilities totaling approximately 77,000 beds, including idle facilities and projects under development, with a workforce of up to approximately 18,000 employees.
Use of forward-looking statements
This news release may contain “forward-looking statements” within the meaning of Section 21E of the Securities Exchange Act of 1934, as amended, and the U.S. Private Securities Litigation Reform Act of 1995. Readers are cautioned not to place undue reliance on these forward-looking statements and any such forward-looking statements are qualified in their entirety by reference to the cautionary statements and risk factors contained in GEO’s filings with the U.S. Securities and Exchange Commission including its Form 10-K, 10-Q and 8-K reports. All forward-looking statements speak only as of the date of this news release and are based on current expectations and involve a number of assumptions, risks and uncertainties that could cause the actual results to differ materially from such forward-looking statements. Readers are strongly encouraged to read the full cautionary statements and risk factors contained in GEO’s filings with the U.S. Securities and Exchange Commission, including those referenced above. GEO disclaims any obligation to update or revise any forward-looking statements, except as required by law.
Fourth quarter 2025 results reflect continued strength in the business
Revenue grew 21% to $59.3 million driven by strength across all markets
Gross margin expanded 110 basis points to 27.0% and achieved operating margin of 9.3% compared to 3.1% in the prior-year period
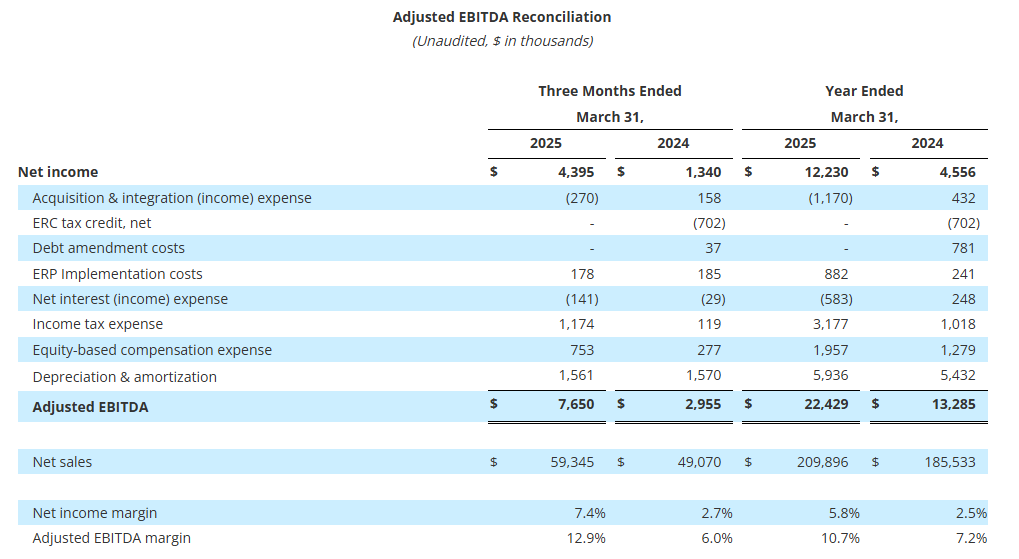
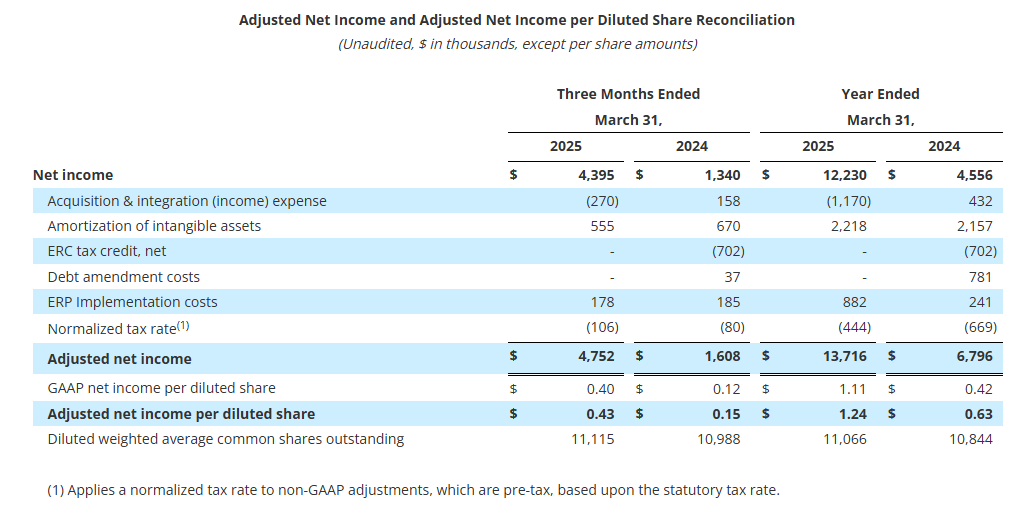
Net Income was $4.4 million; Adjusted net income1 was $4.8 million and Adjusted EBITDA1 was $7.7 million or 12.9% of sales
Fiscal 2025 results demonstrate strong execution on Graham’s long-term strategic plan
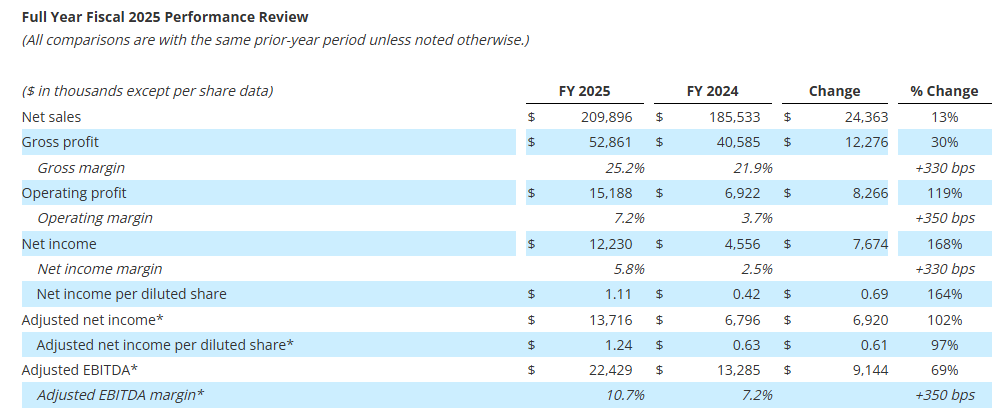
Sales growth of 13% driven by Defense projects and Space demand
Gross Margin Expanded 330 Basis Points to 25.2%
Net Income was $12.2 million compared with $4.6 million in prior fiscal year; achieved Adjusted EBITDA1 of $22.4 million or 10.7% of sales
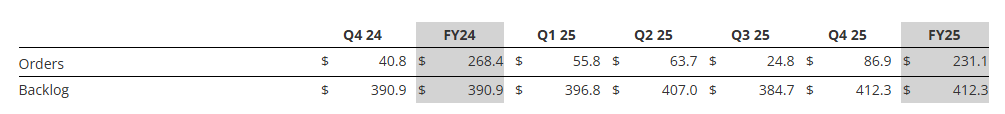
Received full year orders2 of $231.1 million, which represented a Book-to-Bill ratio2 of 1.1x
Record Backlog of $412.3 million
Initiated fiscal 2026 guidance with revenue of $225 million to $235 million, up 10% at Mid-Point over fiscal 2025 with Adjusted EBITDA1 in the range of $22 million to $28 million, up 12% at the mid-point over fiscal 2025
BATAVIA, N.Y.–(BUSINESS WIRE)– Graham Corporation (NYSE: GHM) (“GHM” or the “Company”), a global leader in the design and manufacture of mission critical fluid, power, heat transfer and vacuum technologies for the Defense, Energy & Process, and Space industries, today reported financial results for the fourth quarter and fiscal year 2025 ending March 31, 2025 (“fiscal 2025”).
“We closed fiscal 2025 with strong momentum, as our fourth quarter results reflected solid execution and sustained demand across our diversified product portfolio,” said Daniel J. Thoren, Chief Executive Officer. “We continue to advance projects with an expected 20%+ ROIC1, including automated welding, the expansion of our Batavia, NY facility, and a new cryogenic testing facility in Florida, which will drive enhanced margins and create additional revenue opportunities.”
Mr. Thoren continued, “Looking ahead to fiscal 2026, we are well-positioned to achieve our long-term growth and profitability targets and are strategically looking to invest in key organic and inorganic growth opportunities.”
Management Transition
As previously announced on February 6, 2025, Graham began a planned management transition aligned with its succession strategy. Effective June 10, 2025, Chief Executive Officer Daniel J. Thoren will transition to Executive Chairman and Strategic Advisor. Matt Malone, currently President and Chief Operating Officer, will succeed him as CEO.
Jonathan W. Painter, Chairman of the Board, will transition to Lead Independent Director. Additionally, Michael E. Dixon, promoted to General Manager of Barber-Nichols in February 2025, will assume the role of Vice President of Graham Corporation and General Manager of Barber-Nichols.
“It has been a career highlight and honor to lead Graham Corporation over the last four years and I want to thank our Board and each one of our employees for their commitment and belief in our mission to build better companies, supply mission critical equipment to our customers, and deliver superior performance to our investors,” said Mr. Thoren. “The company is well positioned to achieve its 2027 goals we set in 2022, and I have every confidence in Matt to lead the company to even greater achievements beyond that.”
1Adjusted net income, Adjusted EBITDA and ROIC are non-GAAP measures. See attached tables and other information for important disclosures regarding Graham’s use of these non-GAAP measures.
2Orders, backlog and book-to-bill ratio are key performance metrics. See “Key Performance Indicators” below for important disclosures regarding Graham’s use of these metrics.
*Graham believes that, when used in conjunction with measures prepared in accordance with U.S. generally accepted accounting principles, adjusted net income, adjusted net income per diluted share, adjusted EBITDA and adjusted EBITDA margin, which are non-GAAP measures, help in the understanding of its operating performance. See attached tables and other information provided at the end of this press release for important disclosures regarding Graham’s use of these non-GAAP measures.
We have updated our end market disclosures to better align with how management evaluates the business and product portfolio. As part of this change, revenue previously classified as Refining, Chemical/Petrochemical, and Other, which included New Energy product sales, will now be consolidated into one market, which has been renamed “Energy & Process.” The Defense and Space end market classifications remain unchanged. Prior period amounts have been updated to reflect this change.
Quarterly net sales of $59.3 million increased 21%, or $10.3 million. Sales to the Defense market grew by $7.7 million, or 28% from the prior year period, driven by growth in existing programs, better execution, improved pricing, and the timing of key project milestones. Energy & Process sales contributed $1.8 million to growth driven by increased sales of capital equipment to foreign markets and higher aftermarket sales. Aftermarket sales to the Energy & Process and Defense markets of $12.1 million remained strong and were 3.3% higher than the prior year. See supplemental data for a further breakdown of sales by market and region.
Gross profit for the quarter increased $3.3 million to $16.0 million compared to the prior-year period of $12.7 million. As a percentage of sales, gross profit margin increased 110 basis points to 27.0%, compared to the fiscal fourth quarter of 2024. This increase was driven by leverage on higher volume, better execution, and improved pricing, partially offset by higher incentive compensation compared to the prior year period.
Selling, general and administrative expense (“SG&A”), including amortization, totaled $10.8 million, or 18.1% of sales, down $0.3 million compared with the prior year. This decrease reflects the timing of various project expenses partially offset by higher salaries and performance-based compensation as we continue to invest in our people, our processes and our technology to drive long-term sustainable growth.
*Graham believes that, when used in conjunction with measures prepared in accordance with U.S. generally accepted accounting principles, adjusted net income, adjusted net income per diluted share, adjusted EBITDA and adjusted EBITDA margin, which are non-GAAP measures, help in the understanding of its operating performance. See attached tables and other information provided at the end of this press release for important disclosures regarding Graham’s use of these non-GAAP measures.
Net sales of $209.9 million increased 13%, or $24.4 million. Incremental revenue from the acquisition of P3 Technologies (“P3”) in November 2023 accounted for $2.8 million of this increase. Sales to the Defense market grew by $22.4 million, or 23% from the prior year, driven by the addition of new Defense programs, the growth of existing programs, better execution, improved pricing and the timing of key project milestones. Additionally, net sales to the Space industry for fiscal 2025 increased 11% over the prior year primarily due to the addition of P3. Finally, net sales to the Energy & Process industry for fiscal 2025 was consistent with the prior year as increased sales to Asia and the Middle-East were offset by a $2.7 million decline in aftermarket sales from the record levels of fiscal 2024, but which remain strong. See supplemental data for a further breakdown of sales by market and region.
Gross profit for the year increased $12.3 million to $52.9 million compared to the prior-year period of $40.6 million. As a percentage of sales, gross profit margin increased 330 basis points to 25.2%, compared to fiscal 2024. This increase was driven by leverage on higher volume, better execution, and improved pricing. Additionally, fiscal 2025 gross profit benefited $1.3 million from a grant received from the BlueForge Alliance earlier this fiscal year to reimburse Graham for the cost of the Company’s Defense welder training programs in Batavia and related equipment. The Company currently does not expect to receive any additional welder training grants in fiscal 2026.
SG&A, including amortization, totaled $38.9 million, or 18.5% of sales, up $5.3 million compared with the prior year. This increase reflects the Company’s continued investments in its people, processes, and technology to drive long-term sustainable growth including costs related to the implementation of a new enterprise resource planning (“ERP”) system at our Batavia facility, incremental costs related to P3, and increased research and development investment, among others.
Cash Management and Balance Sheet
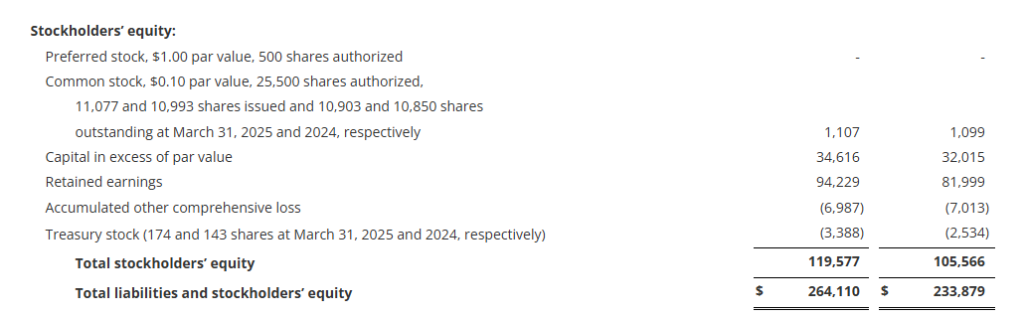
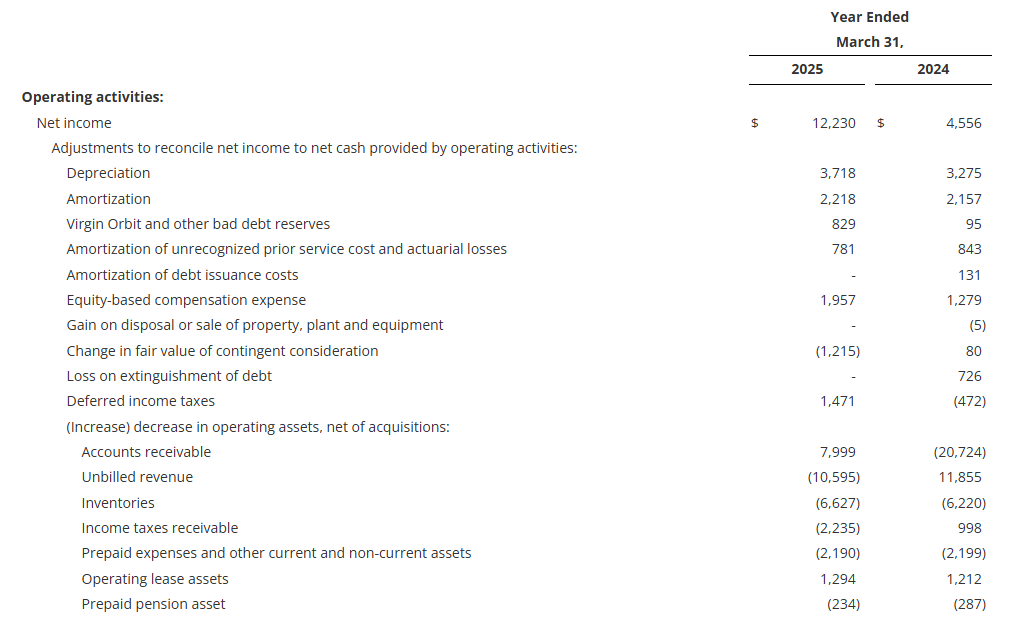
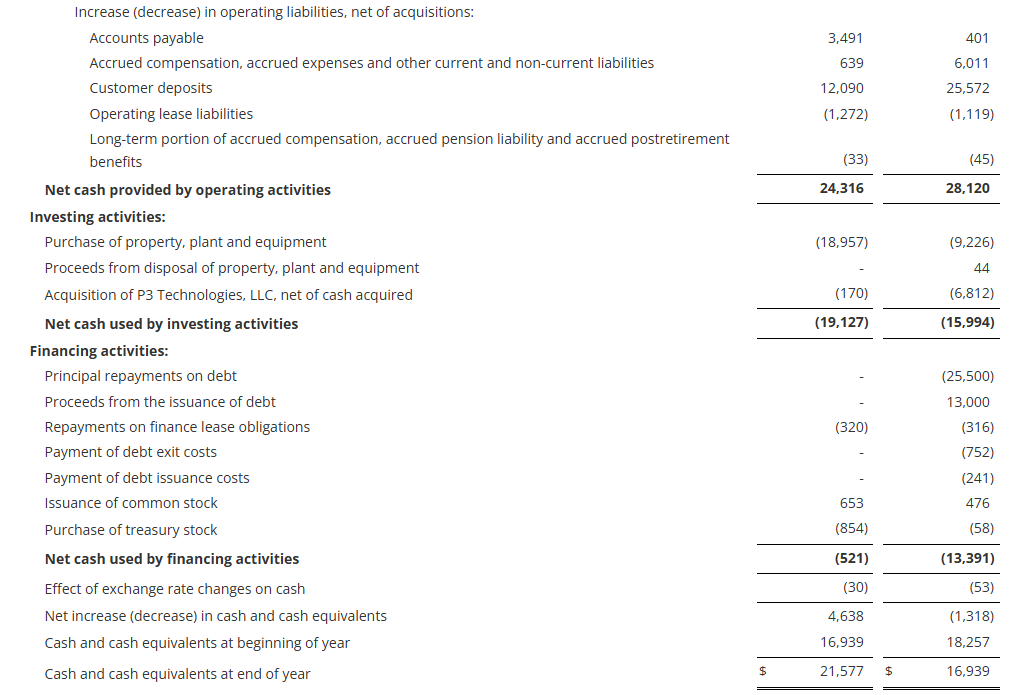
Cash provided by operating activities totaled $24.3 million for the year-ending March 31, 2025, a decrease of $3.8 million from the comparable period in fiscal 2024. As of March 31, 2025, cash and cash equivalents were $21.6 million, up from $16.9 million at the end of fiscal 2024.
Capital expenditures for fiscal 2025 were $19.0 million, focused on capacity expansion, increasing capabilities, and productivity improvements. All major capital projects are on time and on budget.
The Company had no debt outstanding March 31, 2025 with $44.7 million available on its revolving credit facility after taking into account outstanding letters of credit.
Orders, Backlog, and Book-to-Bill Ratio
See supplemental data filed with the Securities and Exchange Commission on Form 8-K and provided on the Company’s website for a further breakdown of orders and backlog by market. See “Key Performance Indicators” below for important disclosures regarding Graham’s use of these metrics ($ in millions).
Orders for the fourth quarter of fiscal 2025 increased to $86.9 million, including $50.0 million, of a $136.5 million total contract value, to procure long-lead time materials for follow-on contracts to support the U.S. Navy’s Virginia Class Submarine program. Aftermarket orders for the Energy & Process and Defense markets remained strong and totaled $11.8 million for the fourth quarter of fiscal 2025, an increase of 50% over the prior year.
For fiscal 2025, orders decreased to $231.1 million, primarily due to a record level of orders in fiscal 2024 as a result of follow-on orders for critical U.S. Navy programs related to the Columbia Class submarine and Ford Class carrier programs. Aftermarket orders in fiscal 2025 for the Energy & Process, and Defense markets increased 8% to $46.6 million, compared with fiscal 2024.
Orders tend to be lumpy given the nature of our business (i.e. large capital projects) and in particular, orders to the Defense industry, which span multiple years and can be significantly larger in size. Book-to-bill for fiscal 2025 was 1.1x.
Backlog as of March 31, 2025, was $412.3 million, a 5% increase over the prior-year period. Approximately 45% of orders currently in backlog are expected to be converted to sales in the next twelve months and another 25% to 30% are expected to convert to sales within one to two years. Approximately 83% of our backlog at March 31, 2025 was to the Defense industry, which we believe provides stability and visibility to our business.
Fiscal 2026 Outlook
“I am pleased to announce our fiscal 2026 outlook, which reflects the continued momentum in our business and the initial impacts of the strategic investments we have made. The Company is deploying capital to support our organic and inorganic growth initiatives, while making strategic improvements to enhance our operations and drive margin expansion, which is being enabled by our strong balance sheet. The outlook we are providing reflects the expected impact of tariffs on our fiscal 2026 results, which we estimate to be approximately $2.0 million to $5.0 million. This is subject to change based on the fluidity of global trade policy,” said Christopher Thome, Chief Financial Officer.
(as of June 9, 2025)
Fiscal 2026 Guidance
Net Sales
$225 million to $235 million
Gross Margin(1)
24.5% to 25.5% of sales
SG&A expense (including amortization)(2)
17.5% to 18.5% of sales
Adjusted EBITDA(1)(3)
$22 million to $28 million
Effective Tax Rate
20% to 22%
Capital Expenditures
$15.0 million to $18.0 million
(1)
Includes the estimated impact of increased tariffs over the prior year of approximately $2.0 million to $5.0 million.
(2)
Includes approximately $6.0 million to $7.0 million of Barber-Nichols supplemental performance bonus, equity-based compensation, and enterprise resource planning (“ERP”) conversion costs included in SG&A expense.
(3)
Excludes net interest expense (income), income taxes, depreciation, and amortization from net income, as well as approximately $2.0 million to $3.0 million of equity-based compensation and ERP conversion costs included in SG&A expense, net.
Our expectations for sales and profitability assumes that we will be able to operate our production facilities at planned capacity, have access to our global supply chain including our subcontractors, do not experience any global disruptions, and experience no impact from any other unforeseen events.
Webcast and Conference Call
GHM’s management will host a conference call and live webcast on June 9, 2025 at 11:00 a.m. Eastern Time (“ET”) to review its financial results as well as its strategy and outlook. The review will be accompanied by a slide presentation, which will be made available immediately prior to the conference call on GHM’s investor relations website.
A question-and-answer session will follow the formal presentation. GHM’s conference call can be accessed by calling (201) 689-8560. Alternatively, the webcast can be monitored from the events section of GHM’s investor relations website.
A telephonic replay will be available from 3:00 p.m. ET today through Monday, June 16, 2025. To listen to the archived call, dial (412) 317-6671 and enter conference ID number 13753289 or access the webcast replay via the Company’s website at ir.grahamcorp.com, where a transcript will also be posted once available.
About Graham Corporation
Graham is a global leader in the design and manufacture of mission critical fluid, power, heat transfer and vacuum technologies for the Defense, Energy & Process, and Space industries. Graham Corporation and its family of global brands are built upon world-renowned engineering expertise in vacuum and heat transfer, cryogenic pumps, and turbomachinery technologies, as well as its responsive and flexible service and the unsurpassed quality customers have come to expect from the Company’s products and systems. Graham Corporation routinely posts news and other important information on its website, grahamcorp.com, where additional information on Graham Corporation and its businesses can be found.
Safe Harbor Regarding Forward Looking Statements
This news release contains forward-looking statements within the meaning of Section 27A of the Securities Act of 1933, as amended, and Section 21E of the Securities Exchange Act of 1934, as amended.
Forward-looking statements are subject to risks, uncertainties and assumptions and are identified by words such as “continue,” “expects,” “future,” “goal,” “outlook,” “anticipates,” “believes,” “could,” “guidance,” ”may”, “will,” “plan” and other similar words. All statements addressing operating performance, events, or developments that Graham Corporation expects or anticipates will occur in the future, including but not limited to, profitability of future projects and the business, its ability to deliver to plan, its ability to continue to strengthen relationships with customers in the Defense industry, its ability to secure future projects and applications, expected expansion and growth opportunities, anticipated sales, revenues, adjusted EBITDA, adjusted EBITDA margins, capital expenditures and SG&A expenses, the timing of conversion of backlog to sales, orders, market presence, profit margins, tax rates, foreign sales operations, customer preferences, changes in market conditions in the industries in which it operates, changes in general economic conditions and customer behavior, forecasts regarding the timing and scope of the economic recovery in its markets, and its acquisition and growth strategy, are forward-looking statements. Because they are forward-looking, they should be evaluated in light of important risk factors and uncertainties. These risk factors and uncertainties are more fully described in Graham Corporation’s most recent Annual Report filed with the Securities and Exchange Commission (the “SEC”), included under the heading entitled “Risk Factors”, and in other reports filed with the SEC.
Should one or more of these risks or uncertainties materialize or should any of Graham Corporation’s underlying assumptions prove incorrect, actual results may vary materially from those currently anticipated. In addition, undue reliance should not be placed on Graham Corporation’s forward-looking statements. Except as required by law, Graham Corporation disclaims any obligation to update or publicly announce any revisions to any of the forward-looking statements contained in this news release.
Non-GAAP Financial Measures
Adjusted EBITDA is defined as consolidated net income (loss) before net interest expense, income taxes, depreciation, amortization, other acquisition related expenses, and other unusual/nonrecurring expenses. Adjusted EBITDA margin is defined as Adjusted EBITDA as a percentage of sales. Adjusted EBITDA and Adjusted EBITDA margin are not measures determined in accordance with generally accepted accounting principles in the United States, commonly known as GAAP. Nevertheless, Graham believes that providing non-GAAP information, such as Adjusted EBITDA and Adjusted EBITDA margin, is important for investors and other readers of Graham’s financial statements, as it is used as an analytical indicator by Graham’s management to better understand operating performance. Moreover, Graham’s credit facility also contains ratios based on Adjusted EBITDA. Because Adjusted EBITDA and Adjusted EBITDA margin are non-GAAP measures and are thus susceptible to varying calculations, Adjusted EBITDA, and Adjusted EBITDA margin, as presented, may not be directly comparable to other similarly titled measures used by other companies.
Adjusted net income and adjusted net income per diluted share are defined as net income and net income per diluted share as reported, adjusted for certain items and at a normalized tax rate. Adjusted net income and adjusted net income per diluted share are not measures determined in accordance with GAAP, and may not be comparable to the measures as used by other companies. Nevertheless, Graham believes that providing non-GAAP information, such as adjusted net income and adjusted net income per diluted share, is important for investors and other readers of the Company’s financial statements and assists in understanding the comparison of the current quarter’s and current fiscal year’s net income and net income per diluted share to the historical periods’ net income and net income per diluted share. Graham also believes that adjusted net income per share, which adds back intangible amortization expense related to acquisitions, provides a better representation of the cash earnings of the Company.
ROIC is defined as a return on invested capital and is calculated by dividing net operating profit after taxes by the total invested capital. ROIC is not a measure determined in accordance with GAAP. Nevertheless, Graham believes that providing ROIC is important for investors and other readers of Graham’s financial statements, as it is used as an analytical indicator by Graham’s management to better understand profitability and efficiency of use of capital for certain projects. Because ROIC is a non-GAAP measure and is thus susceptible to varying calculations, ROIC, as presented, may not be directly comparable to other similarly titled measures used by other companies.
Forward-Looking Non-GAAP Measures
Forward-looking ROIC, adjusted EBITDA and adjusted EBITDA margin are non-GAAP measures. The Company is unable to present a quantitative reconciliation of these forward-looking non-GAAP financial measures to their most directly comparable forward-looking GAAP financial measures because such information is not available, and management cannot reliably predict the necessary components of such GAAP measures without unreasonable effort largely because forecasting or predicting our future operating results is subject to many factors out of our control or not readily predictable. In addition, the Company believes that such reconciliations would imply a degree of precision that would be confusing or misleading to investors. The unavailable information could have a significant impact on the Company’s fiscal 2025 financial results. These non-GAAP financial measures are preliminary estimates and are subject to risks and uncertainties, including, among others, changes in connection with purchase accounting, quarter-end, and year-end adjustments. Any variation between the Company’s actual results and preliminary financial estimates set forth above may be material.
Key Performance Indicators
In addition to the foregoing non-GAAP measures, management uses the following key performance metrics to analyze and measure the Company’s financial performance and results of operations: orders, backlog, and book-to-bill ratio. Management uses orders and backlog as measures of current and future business and financial performance, and these may not be comparable with measures provided by other companies. Orders represent written communications received from customers requesting the Company to provide products and/or services. Backlog is defined as the total dollar value of net orders received for which revenue has not yet been recognized. Management believes tracking orders and backlog are useful as they often times are leading indicators of future performance. In accordance with industry practice, contracts may include provisions for cancellation, termination, or suspension at the discretion of the customer.
The book-to-bill ratio is an operational measure that management uses to track the growth prospects of the Company. The Company calculates the book-to-bill ratio for a given period as net orders divided by net sales.
Given that each of orders, backlog, and book-to-bill ratio are operational measures and that the Company’s methodology for calculating orders, backlog and book-to-bill ratio does not meet the definition of a non-GAAP measure, as that term is defined by the U.S. Securities and Exchange Commission, a quantitative reconciliation for each is not required or provided.
Acquisition and integration (income) expense are incremental costs that are directly related to and as a result of the P3 acquisition or the subsequent accounting for the contingent earn-out liability. These costs (income) may include, among other things, professional, consulting and other fees, system integration costs, and contingent consideration fair value adjustments. ERP implementation costs primarily relate to consulting costs (training, data conversion, and project management) incurred in connection with the ERP system being implemented throughout our Batavia, New York facility in order to enhance efficiency and productivity and are not expected to recur once the project is completed. Debt amendment costs consist of accelerated write-offs of unamortized deferred debt issuance costs and discounts, prepayment penalties and attorney fees in connection with the amendment of our credit facility in October 2023.
Key Points: – Consumers now expect inflation to rise 3.2% over the next year, down from 3.6% in April, signaling easing price concerns. – President Trump’s decision to pause aggressive tariff plans appears to have calmed inflation fears. – Fewer Americans expect job losses or missed debt payments, and optimism about the stock market has ticked up.
Americans appeared more optimistic about inflation in May, as expectations for rising prices declined across the board, according to a new report from the Federal Reserve Bank of New York. The improvement coincides with President Donald Trump’s decision to ease back on his sweeping tariff threats, providing some relief to consumers and policymakers alike.
The Fed’s Survey of Consumer Expectations, released Monday, showed that the anticipated inflation rate one year from now fell to 3.2%, down from 3.6% in April. It marks one of the sharpest monthly drops in recent years and suggests Americans are growing more confident that inflation may not spiral out of control.
Longer-term inflation outlooks also improved. The three-year expectation ticked down to 3%, while the five-year projection eased to 2.6%. While still above the Federal Reserve’s 2% target, the declines point to a growing belief among households that price pressures could be moderating.
The shift comes after the White House softened its stance on some of its more aggressive trade proposals. In April, President Trump announced sweeping 10% tariffs on all U.S. imports and floated the idea of “reciprocal” duties on specific countries. But by early May, the administration introduced a 90-day negotiation period and paused additional tariff hikes, calming fears of an escalating trade war.
The easing rhetoric appears to have had a measurable effect on consumer sentiment, at a time when officials at the Federal Reserve are closely monitoring expectations to determine the future path of interest rates.
“The inflation outlook is coming down, even as tariff collections rise,” said National Economic Council Director Kevin Hassett in an interview Monday. “It runs counter to the narrative that tariffs automatically lead to higher inflation.”
April’s core Personal Consumption Expenditures (PCE) index, the Fed’s preferred inflation measure, remained at 2.5% — stable, but not accelerating. Headline PCE, which includes food and energy, dipped slightly to 2.1%, one of the lowest levels in over three years.
The New York Fed’s survey also found that inflation expectations declined across several major spending categories. While Americans still expect food prices to climb by 5.5% over the next year — up slightly from April — they foresee smaller increases in gas, rent, medical care, and college tuition.
In addition to inflation, the report included promising data on labor market confidence and household finances. The percentage of respondents who believe they’ll lose their job in the next 12 months dropped to 14.8%, a slight but notable improvement. Meanwhile, fewer Americans expect to miss a minimum debt payment in the near term, with that figure falling to 13.4%, the lowest since January.
Consumers also seem to be gaining confidence in the markets. The share of respondents expecting stock prices to be higher a year from now rose to 36.3%, reflecting optimism despite geopolitical uncertainty.
As policymakers weigh inflation, tariffs, and rate decisions, these improving expectations may offer a signal: Americans are cautiously optimistic that the worst inflation fears could be fading.
Elevated Baseline. Titan’s multi-year strategic transformation has elevated the baseline for the Company. An optimized product portfolio, strong customer relationships, expanded aftermarket business, and long-term tailwinds have increased Titan’s earnings power to $250-$300 million of adjusted EBITDA mid-cycle.
Equity Research is available at no cost to Registered users of Channelchek. Not a Member? Click ‘Join’ to join the Channelchek Community. There is no cost to register, and we never collect credit card information.
This Company Sponsored Research is provided by Noble Capital Markets, Inc., a FINRA and S.E.C. registered broker-dealer (B/D).
*Analyst certification and important disclosures included in the full report. NOTE: investment decisions should not be based upon the content of this research summary. Proper due diligence is required before making any investment decision.
The GEO Group, Inc. (NYSE: GEO) is a leading diversified government service provider, specializing in design, financing, development, and support services for secure facilities, processing centers, and community reentry centers in the United States, Australia, South Africa, and the United Kingdom. GEO’s diversified services include enhanced in-custody rehabilitation and post-release support through the award-winning GEO Continuum of Care®, secure transportation, electronic monitoring, community-based programs, and correctional health and mental health care. GEO’s worldwide operations include the ownership and/or delivery of support services for 103 facilities totaling approximately 83,000 beds, including idle facilities and projects under development, with a workforce of up to approximately 18,000 employees.
Joe Gomes, CFA, Managing Director, Equity Research Analyst, Generalist , Noble Capital Markets, Inc.
Refer to the full report for the price target, fundamental analysis, and rating.
Lawton Sale. The GEO Group announced it has entered into a purchase agreement to sell its Company-owned Lawton, OK, facility to the Oklahoma Department of Corrections for $312 million. This is one of two facilities GEO management had indicated were up for sale. The sale is expected to close by the end of July 2025.
Value Affirming. The Lawton sale re-affirms our belief in the value of GEO’s real estate assets, a value that significantly exceeds the current stock price. Based on the reported 2,682 beds, the purchase price is equivalent to $116,000/bd. With some 43,000 owned beds in the Safety segment alone, the potential value of the segment real estate would be $5 billion. We do not expect the sale to have a significant impact on reported EBITDA.
Equity Research is available at no cost to Registered users of Channelchek. Not a Member? Click ‘Join’ to join the Channelchek Community. There is no cost to register, and we never collect credit card information.
This Company Sponsored Research is provided by Noble Capital Markets, Inc., a FINRA and S.E.C. registered broker-dealer (B/D).
*Analyst certification and important disclosures included in the full report. NOTE: investment decisions should not be based upon the content of this research summary. Proper due diligence is required before making any investment decision.
RTO Trends. While overall office occupancy improvement trends have somewhat flattened, Steelcase’s key end market, firms in Class A office space, are improving as more large companies are becoming more aggressive about employees returning to the office. And split working environments can be a benefit to Steelcase as employees need to set up work-from-home offices. Steelcase continues to lead the transformation of the workplace.
Equity Research is available at no cost to Registered users of Channelchek. Not a Member? Click ‘Join’ to join the Channelchek Community. There is no cost to register, and we never collect credit card information.
This Company Sponsored Research is provided by Noble Capital Markets, Inc., a FINRA and S.E.C. registered broker-dealer (B/D).
*Analyst certification and important disclosures included in the full report. NOTE: investment decisions should not be based upon the content of this research summary. Proper due diligence is required before making any investment decision.
Resources Connection, Inc. provides agile consulting services in North America, Europe, and the Asia Pacific. The company offers finance and accounting services, including process transformation and optimization, financial reporting and analysis, technical and operational accounting, merger and acquisition due diligence and integration, audit readiness, preparation and response, implementation of new accounting standards, and remediation support. It also provides information management services, such as program and project management, business and technology integration, data strategy, and business performance management. In addition, the company offers corporate advisory, strategic communications, and restructuring services; and corporate governance, risk, and compliance management services, such as contract and regulatory compliance, enterprise risk management, internal controls management, and operation and information technology (IT) audits. Further, it provides supply chain management services comprising strategy development, procurement and supplier management, logistics and materials management, supply chain planning and forecasting, and unique device identification compliance; and human capital services, including change management, organization development and effectiveness, compensation and incentive plan strategies, and optimization of human resources technology and operations. Additionally, the company offers legal and regulatory supporting services for commercial transactions, global compliance initiatives, law department operations, and law department business strategies and analytics. It also provides policyIQ, a proprietary cloud-based governance, risk, and compliance software application. The company was formerly known as RC Transaction Corp. and changed its name to Resources Connection, Inc. in August 2000. Resources Connection, Inc. was founded in 1996 and is headquartered in Irvine, California.
Joe Gomes, CFA, Managing Director, Equity Research Analyst, Generalist , Noble Capital Markets, Inc.
Refer to the full report for the price target, fundamental analysis, and rating.
Transformation. RGP’s business transformation has uniquely positioned the Company to capitalize on shifting demand in its end markets. RGP’s diversified client base and high retention reduce risk and drive long-term value, in our view. The Company’s business is diversified across industries, regions, and service lines, while high retention is growing the lifetime value of clients.
Equity Research is available at no cost to Registered users of Channelchek. Not a Member? Click ‘Join’ to join the Channelchek Community. There is no cost to register, and we never collect credit card information.
This Company Sponsored Research is provided by Noble Capital Markets, Inc., a FINRA and S.E.C. registered broker-dealer (B/D).
*Analyst certification and important disclosures included in the full report. NOTE: investment decisions should not be based upon the content of this research summary. Proper due diligence is required before making any investment decision.
A Leader. With approximately 165 locations, ONE Group is a leader in Vibe dining through its ownership of STK, Benihana, Kona Grill, and RA Sushi. Notably, Vibe dining customers tend to generate higher average checks while only remaining in the restaurant for slightly longer than traditional restaurant customers.
Equity Research is available at no cost to Registered users of Channelchek. Not a Member? Click ‘Join’ to join the Channelchek Community. There is no cost to register, and we never collect credit card information.
This Company Sponsored Research is provided by Noble Capital Markets, Inc., a FINRA and S.E.C. registered broker-dealer (B/D).
*Analyst certification and important disclosures included in the full report. NOTE: investment decisions should not be based upon the content of this research summary. Proper due diligence is required before making any investment decision.
Tariff Impact. With production sourced and sold in-country, the direct impact of tariffs on NN is expected to be minimal. The Company has seen some modest indirect impact, mostly related to deferred decision making on the part of clients and/or consumers. Once tariffs have stabilized, we expect any indirect impacts to be minimal.
Equity Research is available at no cost to Registered users of Channelchek. Not a Member? Click ‘Join’ to join the Channelchek Community. There is no cost to register, and we never collect credit card information.
This Company Sponsored Research is provided by Noble Capital Markets, Inc., a FINRA and S.E.C. registered broker-dealer (B/D).
*Analyst certification and important disclosures included in the full report. NOTE: investment decisions should not be based upon the content of this research summary. Proper due diligence is required before making any investment decision.
Kelly (Nasdaq: KELYA, KELYB) connects talented people to companies in need of their skills in areas including Science, Engineering, Education, Office, Contact Center, Light Industrial, and more. We’re always thinking about what’s next in the evolving world of work, and we help people ditch the script on old ways of thinking and embrace the value of all workstyles in the workplace. We directly employ nearly 350,000 people around the world and connect thousands more with work through our global network of talent suppliers and partners in our outsourcing and consulting practice. Revenue in 2021 was $4.9 billion. Visit kellyservices.com and let us help with what’s next for you.
Joe Gomes, CFA, Managing Director, Equity Research Analyst, Generalist , Noble Capital Markets, Inc.
Refer to the full report for the price target, fundamental analysis, and rating.
Value Creation Opportunity. A key chart in Kelly’s presentation highlights how the implied value of Kelly’s individual businesses and their valuation multiples relative to peers implies considerable upside potential. Based on Kelly’s current enterprise value and the historic valuation multiple of the peer group, management believes KELYA shares have a nearly 100% upside opportunity at this time.
Equity Research is available at no cost to Registered users of Channelchek. Not a Member? Click ‘Join’ to join the Channelchek Community. There is no cost to register, and we never collect credit card information.
This Company Sponsored Research is provided by Noble Capital Markets, Inc., a FINRA and S.E.C. registered broker-dealer (B/D).
*Analyst certification and important disclosures included in the full report. NOTE: investment decisions should not be based upon the content of this research summary. Proper due diligence is required before making any investment decision.
FAT Brands (NASDAQ: FAT) is a leading global franchising company that strategically acquires, markets, and develops fast casual, quick-service, casual dining, and polished casual dining concepts around the world. The Company currently owns 17 restaurant brands: Round Table Pizza, Fatburger, Marble Slab Creamery, Johnny Rockets, Fazoli’s, Twin Peaks, Great American Cookies, Hot Dog on a Stick, Buffalo’s Cafe & Express, Hurricane Grill & Wings, Pretzelmaker, Elevation Burger, Native Grill & Wings, Yalla Mediterranean and Ponderosa and Bonanza Steakhouses, and franchises and owns over 2,300 units worldwide. For more information on FAT Brands, please visit www.fatbrands.com.
Joe Gomes, CFA, Managing Director, Equity Research Analyst, Generalist , Noble Capital Markets, Inc.
Refer to the full report for the price target, fundamental analysis, and rating.
Pipeline. FAT Brands new store pipeline consists of approximately 1,100 units already paid for by franchisees, which will add some $50-60 million of incremental EBITDA once opened. With some 250 new unit agreements per year and some 100+ new openings per year, we expect the pipeline to be a key driver of financial performance going forward.
Equity Research is available at no cost to Registered users of Channelchek. Not a Member? Click ‘Join’ to join the Channelchek Community. There is no cost to register, and we never collect credit card information.
This Company Sponsored Research is provided by Noble Capital Markets, Inc., a FINRA and S.E.C. registered broker-dealer (B/D).
*Analyst certification and important disclosures included in the full report. NOTE: investment decisions should not be based upon the content of this research summary. Proper due diligence is required before making any investment decision.
CoreCivic is a diversified, government-solutions company with the scale and experience needed to solve tough government challenges in flexible, cost-effective ways. We provide a broad range of solutions to government partners that serve the public good through high-quality corrections and detention management, a network of residential and non-residential alternatives to incarceration to help address America’s recidivism crisis, and government real estate solutions. We are the nation’s largest owner of partnership correctional, detention and residential reentry facilities, and believe we are the largest private owner of real estate used by government agencies in the United States. We have been a flexible and dependable partner for government for nearly 40 years. Our employees are driven by a deep sense of service, high standards of professionalism and a responsibility to help government better the public good. Learn more at www.corecivic.com.
Joe Gomes, CFA, Managing Director, Equity Research Analyst, Generalist , Noble Capital Markets, Inc.
Refer to the full report for the price target, fundamental analysis, and rating.
Increased Demand. As regular readers know, CoreCivic has seen increased demand for its services from ICE. The Company already has received new awards for beds and expects to re-open currently idled facilities for ICE. Increased occupancy could drive significant earnings growth. Occupancy in 1Q25 was 77%, still below the low 80% range in 2018/19. The Company showed various illustrative potential for increased demand that could add $73-$131 million of additional NOI.
Equity Research is available at no cost to Registered users of Channelchek. Not a Member? Click ‘Join’ to join the Channelchek Community. There is no cost to register, and we never collect credit card information.
This Company Sponsored Research is provided by Noble Capital Markets, Inc., a FINRA and S.E.C. registered broker-dealer (B/D).
*Analyst certification and important disclosures included in the full report. NOTE: investment decisions should not be based upon the content of this research summary. Proper due diligence is required before making any investment decision.
Key Points: – Stocks rose Monday as U.S. and Chinese officials met in London to address trade tensions and discuss resuming critical mineral exports. – Semiconductor and Chinese tech stocks outperformed, with major gains from Qualcomm, AMD, and Alibaba amid optimism over eased restrictions. – Investors await key inflation data later this week, while the S&P 500 continues to approach record highs despite lingering tariff uncertainties.
Stocks climbed on Monday as investors closely monitored renewed trade negotiations between the United States and China. The diplomatic meeting, held in London, marked another key step in the ongoing effort to ease tensions between the world’s two largest economies.
The S&P 500 rose 0.3%, while the Nasdaq Composite added nearly 0.4%. The Dow Jones Industrial Average was also higher, gaining 84 points, or 0.2%, by the end of the trading session.
Representatives from both countries met to resolve outstanding trade issues, including the flow of critical mineral exports. The U.S. delegation included Treasury Secretary Scott Bessent, Commerce Secretary Howard Lutnick, and Trade Representative Jamieson Greer. Discussions centered around verifying China’s commitment to restoring exports of rare earth elements, which are essential for electronics and clean energy technologies.
This round of talks follows a recent phone conversation between President Donald Trump and Chinese President Xi Jinping. In that call, both leaders agreed to pause tariff escalations while negotiations progressed. The latest diplomatic push appears to be an attempt to move beyond high-stakes disputes and toward more sustainable trade cooperation.
Investors responded positively, especially in sectors with direct exposure to China and global supply chains. Semiconductor stocks rallied, with Qualcomm jumping over 4% after announcing its $2.4 billion acquisition of chipmaker Alphawave. Other chipmakers, including Advanced Micro Devices and Texas Instruments, also gained more than 4%. Nvidia saw more modest gains, while Chinese tech giant Alibaba advanced 2%.
The strength in semiconductors and Chinese equities reflects a broader investor belief that trade de-escalation could benefit high-growth sectors reliant on stable cross-border commerce. Market analysts noted increased appetite for risk, particularly in areas sensitive to trade dynamics.
However, not all sectors shared in Monday’s gains. Apple stock declined by 1.5% following the company’s keynote at its 2025 Worldwide Developers Conference. The event featured the first major iOS redesign since 2013, but investors appeared underwhelmed by the announcements.
Looking ahead, inflation remains a key concern for markets. The Consumer Price Index (CPI) is scheduled for release on Wednesday, followed by the Producer Price Index (PPI) on Thursday. These data points will help clarify whether current tariffs are feeding through to consumer and producer prices — a key consideration for Federal Reserve policy decisions in the months ahead.
Despite lingering uncertainties, Wall Street’s mood remains cautiously optimistic. Last week, all three major indexes posted their second consecutive weekly gains. The S&P 500 even closed above the 6,000 mark for the first time since February, now less than 3% from its all-time high. Many investors appear to be looking past short-term trade noise and focusing instead on a more resilient and potentially stimulative economic environment.