Research, News, and Market Data on FLWS
Nov 03, 2022
First Quarter Results Slightly Exceeded Guidance
Company Issues Fiscal 2023 Full Year Guidance
Expects Fiscal 2023 Adjusted EBITDA1 to be in a range of $75 million to $80 million
Expects to Generate Free Cash Flow1 in Excess of $75 million in Fiscal Year 2023; Representing a More Than $135 Million Improvement as Compared to the Prior Year
(1 Refer to “Definitions of Non-GAAP Financial Measures” and the tables attached at the end of this press release for reconciliation of non-GAAP results to applicable GAAP results.)
JERICHO, N.Y.–(BUSINESS WIRE)– 1-800-FLOWERS.COM, Inc. (NASDAQ: FLWS), a leading provider of gifts designed to help inspire customers to give more, connect more, and build more and better relationships, today reported results for its Fiscal 2023 first quarter ended October 2, 2022.
Fiscal 2023 First Quarter Highlights
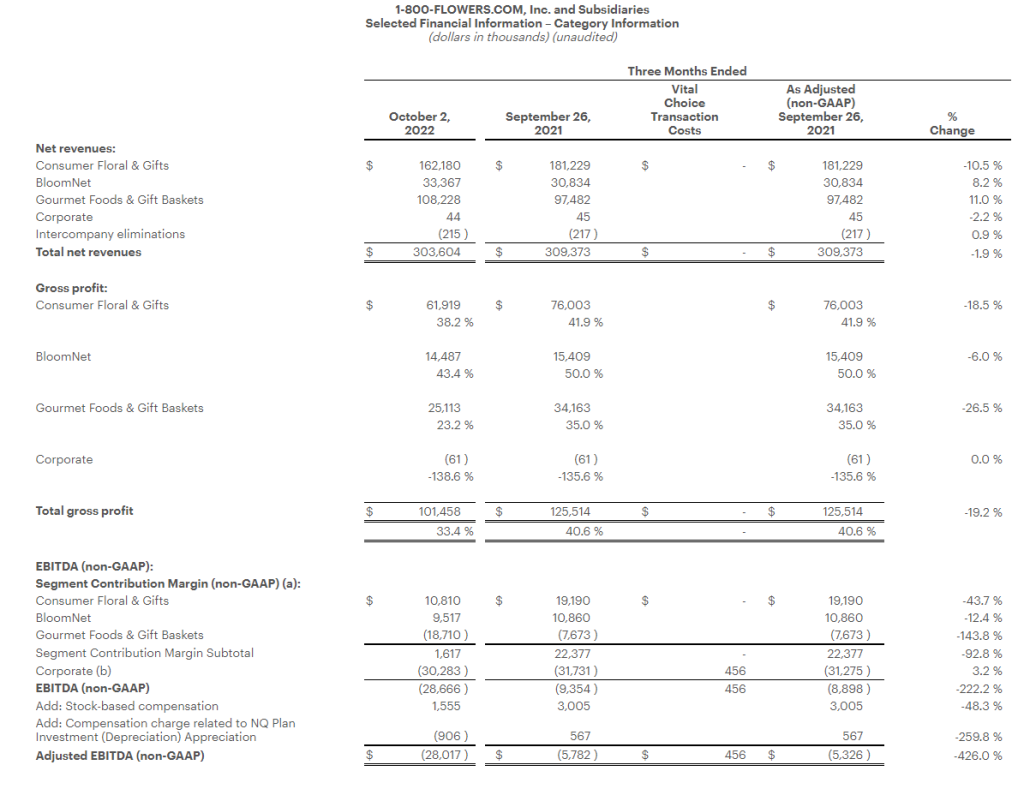
- Total consolidated revenues decreased 1.9% to $303.6 million, compared with total consolidated revenues of $309.4 million in the prior year period.
- Gross profit margin for the quarter was 33.4%, compared with 40.6% in the prior year period.
- Operating expenses were 47.0% of total sales, as compared with 47.1% in the prior year period.
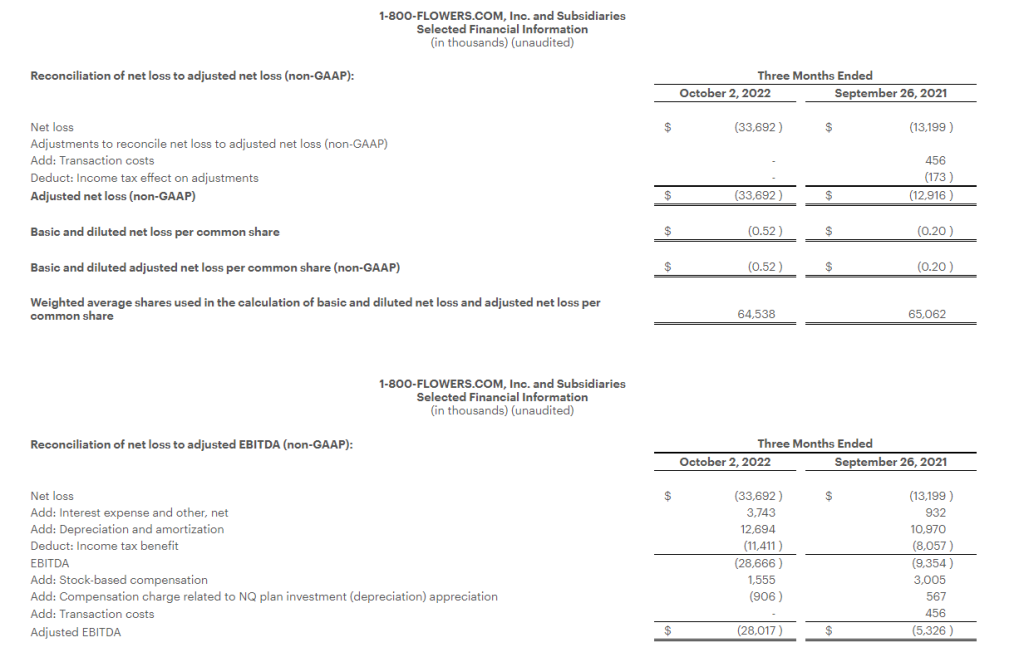
- Net loss for the quarter was $33.7 million, or $(0.52) per share, compared with a net loss of $13.2 million, or $(0.20) per share in the prior year period.
- Adjusted EBITDA loss1 for the quarter was $28.0 million, as compared to an Adjusted EBITDA loss1 of $5.3 million in the prior year period.
Chris McCann, CEO of 1-800-FLOWERS.COM, Inc., said, “Our first quarter results were slightly better than our expectations, benefitting from the strength in our Gourmet Foods and Gift Baskets business. During the quarter, we saw consumers purchasing fewer everyday gifts as they responded to the significant macro-inflationary pressures affecting their discretionary spending. However, as we look out to the holiday season and the balance of our fiscal year, we are cautiously optimistic that consumers will spend during the major gift giving holiday occasions, while we anticipate they will remain guarded on their spending otherwise.”
“Coming into Fiscal 2023, we expected a challenging macroeconomic backdrop to affect our performance during the first quarter. However, we expect to see a stabilization of our business during our second quarter and improvement during the second half of our fiscal year, as we cycle against the sharp inflationary period of a year ago. After growing revenues 77% since Fiscal 2019, we anticipate revenues to decline slightly in Fiscal 2023. The impact of this revenue decline on our earnings is partially mitigated by our initiatives to operate more efficiently, coupled with the decline that we are seeing in ocean freight costs. We expect the reduction of these costs to begin to provide a margin benefit in the second half of this fiscal year, and even more so next year.”
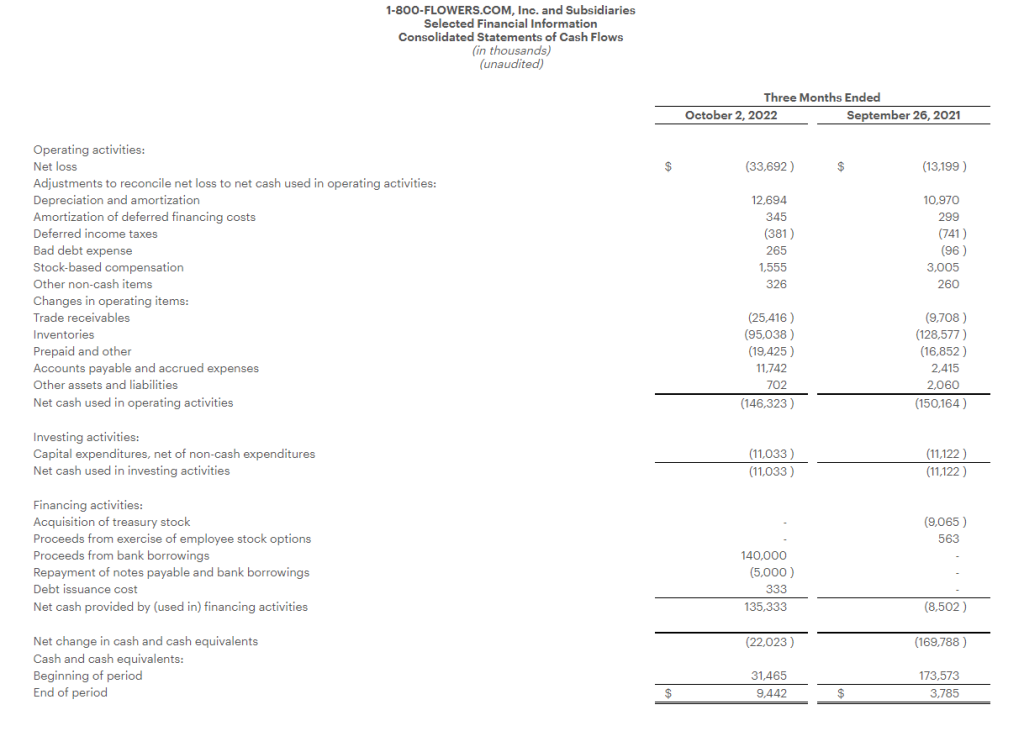
McCann added, “As a result of our decision to increase inventories of non-perishable items last fiscal year and the actions that we have taken over the last few years to operate more efficiently, we expect to generate more than $75 million in Free Cash Flow1 in Fiscal 2023. This represents an improvement of more than $135 million compared with last year.”
First Quarter 2023 Financial Results
Total consolidated revenues decreased 1.9% to $303.6 million, compared with total consolidated revenues of $309.4 million in the prior year period. Excluding contributions from Vital Choice® and Alice’s Table®, which were acquired in October 2021 and December 2021, respectively, total revenue for the quarter declined 3.6%, compared with the prior year period.
Gross profit margin for the quarter was 33.4%, a decline of 720 basis points, compared with 40.6% in the prior year period, primarily reflecting significantly increased costs for labor, shipping and commodities in the current year period. Operating expenses were 47.0% of total sales, as compared with 47.1% in the prior year period, primarily reflecting lower marketing costs, as the Company shifted its advertising investments to lower cost, higher return on investment areas of the marketing funnel, partially offset by higher depreciation associated with the Company’s automation and technology projects.
As a result, the Adjusted EBITDA loss1 was $28.0 million, as compared to an Adjusted EBITDA loss1 of $5.3 million in the prior year period. Net loss for the quarter was $33.7 million, or $(0.52) per share, compared with a net loss of $13.2 million, or $(0.20) per share, and an Adjusted Net Loss1 of $12.9 million, or $(0.20) per share, in the prior year period.
Segment Results:
The Company provides selected financial results for its Gourmet Foods and Gift Baskets, Consumer Floral and Gifts, and BloomNet segments in the tables attached to this release and as follows:
- Gourmet Foods and Gift Baskets: Revenues for the quarter increased 11.0% to $108.2 million, compared with $97.5 million in the prior year period, reflecting the contributions of Vital Choice and improved wholesale product demand. Gross profit margin was 23.2%, compared with 35.0% in the prior year period, primarily reflecting increased commodities and transportation costs, as well as product mix reflecting the sharp sales increase in the lower-margin wholesale channel. As a result, segment contribution margin1 was a loss of $18.7 million, compared with a loss of $7.7 million a year ago.
- Consumer Floral and Gifts: Revenues decreased 10.5% to $162.2 million, compared with $181.2 million in the prior year period. Gross profit margin decreased to 38.2%, compared with 41.9% in the prior year period, primarily due to increased transportation and commodity costs. Segment contribution margin1 was $10.8 million, compared with $19.2 million the prior year.
- BloomNet: Revenues for the quarter increased 8.2% to $33.4 million, compared with $30.8 million in the prior year period. Gross profit margin decreased to 43.4%, compared with 50.0% in the prior year period, primarily due to product mix and higher shipping costs. Segment contribution margin1 was $9.5 million, compared with $10.9 million in the prior year period.
Company Guidance
The Company is providing the following guidance for Fiscal 2023. While the highly unpredictable nature of the current macro economy makes it difficult to forecast in this environment, the Company anticipates that after growing revenues 77% over the past two fiscal years, revenues will decline slightly in Fiscal 2023 on lower consumer confidence and cautious spending behavior. The Company anticipates that the combination of the investments it has made – and continues to make – in its business platform, along with strategic pricing programs and moderation of cost inputs, will enable it to gradually improve gross margins and bottom-line results during the latter half of the current fiscal year. Additionally, this guidance assumes the restoration of 100% bonus payout in Fiscal 2023, compared with a limited bonus payout in Fiscal 2022.
Full Year Fiscal 2023 Guidance
- Total revenues to decline in the mid-single digit range on a percentage basis as compared with the prior year;
- Adjusted EBITDA1 to be in a range of $75 million to $80 million; and
- Free Cash Flow1 to exceed $75 million.
Conference Call:
The Company will conduct a conference call to discuss the above details and attached financial results today, Thursday, November 3, at 8:00 a.m. (ET). The conference call will be webcast from the Investors section of the Company’s website at www.1800flowersinc.com. A recording of the call will be posted on the Investors section of the Company’s website within two hours of the call’s completion. A telephonic replay of the call can be accessed beginning at 2:00 p.m. (ET) today, through November 10, 2022, at: (US) 1-877-344-7529; (Canada) 855-669-9658; (International) 1-412-317-0088; enter conference ID #: 5253715. If you have any questions regarding the above information, please contact the Investor Relations office at invest@1800flowers.com.
Definitions of non-GAAP Financial Measures:
We sometimes use financial measures derived from consolidated financial information, but not presented in our financial statements prepared in accordance with U.S. generally accepted accounting principles (“GAAP”). Certain of these are considered “non-GAAP financial measures” under the U.S. Securities and Exchange Commission rules. Non-GAAP financial measures referred to in this document are either labeled as “non-GAAP” or designated as such with a “1”. See below for definitions and the reasons why we use these non-GAAP financial measures. Where applicable, see the Selected Financial Information below for reconciliations of these non-GAAP measures to their most directly comparable GAAP financial measures. Reconciliations for forward-looking figures would require unreasonable efforts at this time because of the uncertainty and variability of the nature and amount of certain components of various necessary GAAP components, including, for example, those related to compensation, tax items, amortization or others that may arise during the year, and the Company’s management believes such reconciliations would imply a degree of precision that would be confusing or misleading to investors. For the same reasons, the Company is unable to address the probable significance of the unavailable information. The lack of such reconciling information should be considered when assessing the impact of such disclosures.
EBITDA and Adjusted EBITDA
We define EBITDA as net income (loss) before interest, taxes, depreciation, and amortization. Adjusted EBITDA is defined as EBITDA adjusted for the impact of stock-based compensation, Non-Qualified Plan Investment appreciation/depreciation, and for certain items affecting period-to-period comparability. See Selected Financial Information for details on how EBITDA and Adjusted EBITDA were calculated for each period presented. The Company presents EBITDA and Adjusted EBITDA because it considers such information meaningful supplemental measures of its performance and believes such information is frequently used by the investment community in the evaluation of similarly situated companies. The Company uses EBITDA and Adjusted EBITDA as factors to determine the total amount of incentive compensation available to be awarded to executive officers and other employees. The Company’s credit agreement uses EBITDA and Adjusted EBITDA to determine its interest rate and to measure compliance with certain covenants. EBITDA and Adjusted EBITDA are also used by the Company to evaluate and price potential acquisition candidates. EBITDA and Adjusted EBITDA have limitations as analytical tools and should not be considered in isolation or as a substitute for analysis of the Company’s results as reported under GAAP. Some of the limitations are: (a) EBITDA and Adjusted EBITDA do not reflect changes in, or cash requirements for, the Company’s working capital needs; (b) EBITDA and Adjusted EBITDA do not reflect the significant interest expense, or the cash requirements necessary to service interest or principal payments, on the Company’s debts; and (c) although depreciation and amortization are non-cash charges, the assets being depreciated and amortized may have to be replaced in the future and EBITDA does not reflect any cash requirements for such capital expenditures. EBITDA and Adjusted EBITDA should only be used on a supplemental basis combined with GAAP results when evaluating the Company’s performance.
Segment Contribution Margin
We define Segment Contribution Margin as earnings before interest, taxes, depreciation, and amortization, before the allocation of corporate overhead expenses. See Selected Financial Information for details on how Segment Contribution Margin was calculated for each period presented. When viewed together with our GAAP results, we believe Segment Contribution Margin provides management and users of the financial statements meaningful information about the performance of our business segments. Segment Contribution Margin is used in addition to and in conjunction with results presented in accordance with GAAP and should not be relied upon to the exclusion of GAAP financial measures. The material limitation associated with the use of Segment Contribution Margin is that it is an incomplete measure of profitability as it does not include all operating expenses or non-operating income and expenses. Management compensates for these limitations when using this measure by looking at other GAAP measures, such as Operating Income and Net Income.
Adjusted Net Income (Loss) and Adjusted or Comparable Net Income (Loss) Per Common Share:
We define Adjusted Net Income (Loss) and Adjusted or Comparable Net Income (Loss) Per Common Share as Net Income (Loss) and Net Income (Loss) Per Common Share adjusted for certain items affecting period-to-period comparability. See Selected Financial Information below for details on how Adjusted Net Income (Loss) Per Common Share and Adjusted or Comparable Net Income (Loss) Per Common Share were calculated for each period presented. We believe that Adjusted Net Income (Loss) and Adjusted or Comparable Net Income (Loss) Per Common Share are meaningful measures because they increase the comparability of period-to-period results. Since these are not measures of performance calculated in accordance with GAAP, they should not be considered in isolation of, or as a substitute for, GAAP Net Income (Loss) and Net Income (Loss) Per Common share, as indicators of operating performance and they may not be comparable to similarly titled measures employed by other companies.
Free Cash Flow:
We define Free Cash Flow as net cash provided by operating activities less capital expenditures. The Company considers Free Cash Flow to be a liquidity measure that provides useful information to management and investors about the amount of cash generated by the business after the purchases of fixed assets, which can then be used to, among other things, invest in the Company’s business, make strategic acquisitions, strengthen the balance sheet, and repurchase stock or retire debt. Free Cash Flow is a liquidity measure that is frequently used by the investment community in the evaluation of similarly situated companies. Since Free Cash Flow is not a measure of performance calculated in accordance with GAAP, it should not be considered in isolation or as a substitute for analysis of the Company’s results as reported under GAAP. A limitation of the utility of Free Cash Flow as a measure of financial performance is that it does not represent the total increase or decrease in the Company’s cash balance for the period.
About 1-800-FLOWERS.COM, Inc.
1-800-FLOWERS.COM, Inc. is a leading provider of gifts designed to help inspire customers to give more, connect more, and build more and better relationships. The Company’s e-commerce business platform features an all-star family of brands, including: 1-800-Flowers.com®, 1-800-Baskets.com®, Cheryl’s Cookies®, Harry & David®, PersonalizationMall.com®, Shari’s Berries®, FruitBouquets.com®, Moose Munch®, The Popcorn Factory®, Wolferman’s Bakery®, Vital Choice®, Stock Yards® and Simply Chocolate®. Through the Celebrations Passport® loyalty program, which provides members with free standard shipping and no service charge across our portfolio of brands, 1-800-FLOWERS.COM, Inc. strives to deepen relationships with customers. The Company also operates BloomNet®, an international floral and gift industry service provider offering a broad-range of products and services designed to help members grow their businesses profitably; Napco℠, a resource for floral gifts and seasonal décor; DesignPac Gifts, LLC, a manufacturer of gift baskets and towers; and Alice’s Table®, a lifestyle business offering fully digital livestreaming and on demand floral, culinary and other experiences to guests across the country. 1-800-FLOWERS.COM, Inc. was recognized among the top 5 on the National Retail Federation’s 2021 Hot 25 Retailers list, which ranks the nation’s fastest-growing retail companies, and was named to the Fortune 1000 list in 2022. Shares in 1-800-FLOWERS.COM, Inc. are traded on the NASDAQ Global Select Market, ticker symbol: FLWS. For more information, visit 1800flowersinc.com or follow @1800FLOWERSInc on Twitter.
FLWS–COMP
FLWS-FN
Special Note Regarding Forward Looking Statements:
This press release contains forward-looking statements within the meaning of the Private Securities Litigation Reform Act of 1995. These forward-looking statements represent the Company’s current expectations or beliefs concerning future events and can generally be identified using statements that include words such as “estimate,” “expects,” “project,” “believe,” “anticipate,” “intend,” “plan,” “foresee,” “forecast,” “likely,” “will,” “target” or similar words or phrases. These forward-looking statements are subject to risks, uncertainties, and other factors, many of which are outside of the Company’s control, which could cause actual results to differ materially from the results expressed or implied in the forward-looking statements, including, but not limited to, statements regarding the Company’s ability to achieve its guidance for full year Fiscal 2023; the impact of the Covid-19 pandemic on the Company; its ability to leverage its operating platform and reduce its operating expense ratio; its ability to sell through existing inventories; its ability to successfully integrate acquired businesses and assets; its ability to successfully execute its strategic initiatives; its ability to cost effectively acquire and retain customers; the outcome of contingencies, including legal proceedings in the normal course of business; its ability to compete against existing and new competitors; its ability to manage expenses associated with sales and marketing and necessary general and administrative and technology investments; its ability to reduce promotional activities and achieve more efficient marketing programs; and general consumer sentiment and industry and economic conditions that may affect levels of discretionary customer purchases of the Company’s products. The Company undertakes no obligation to publicly update any of the forward-looking statements, whether because of new information, future events or otherwise, made in this release or in any of its SEC filings. Consequently, you should not consider any such list to be a complete set of all potential risks and uncertainties. For a more detailed description of these and other risk factors, refer to the Company’s SEC filings, including the Company’s Annual Reports on Form 10-K and its Quarterly Reports on Form 10-Q.
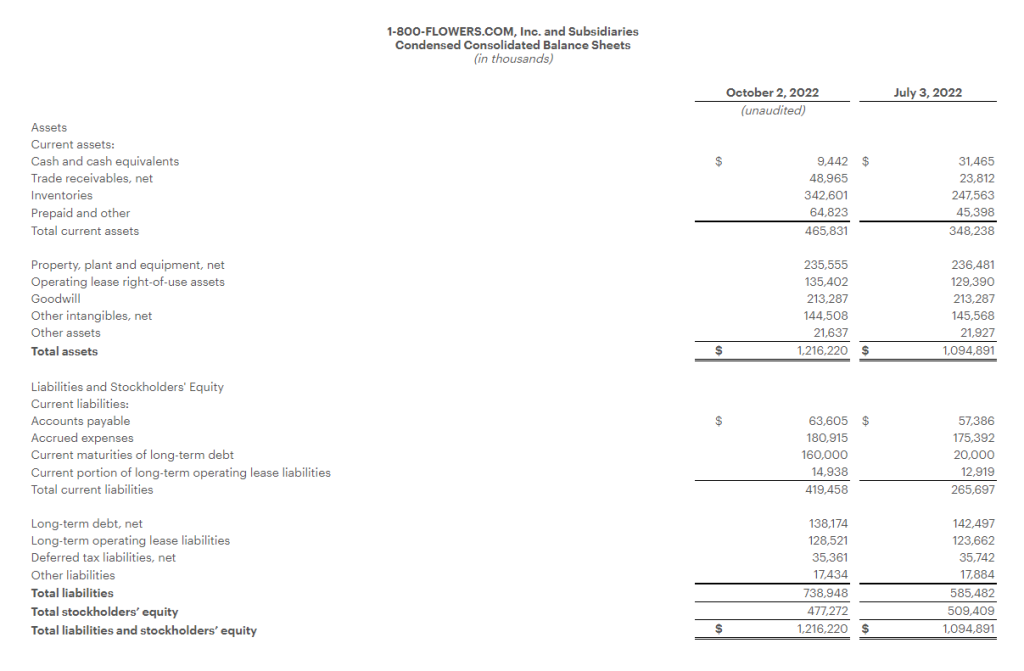
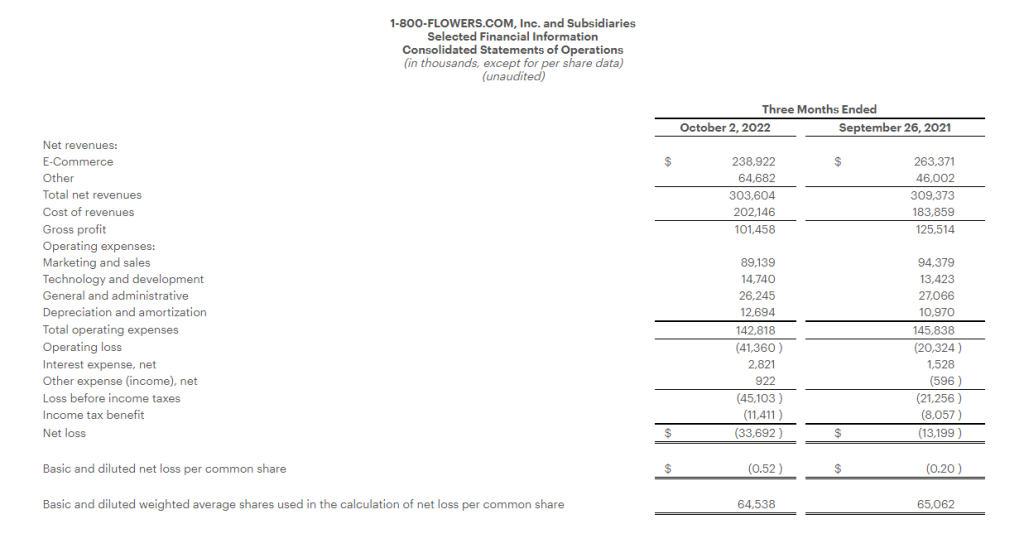
Note: The following tables are an integral part of this press release without which the information presented in this press release should be considered incomplete.
(a) Segment performance is measured based on segment contribution margin or segment Adjusted EBITDA, reflecting only the direct controllable revenue and operating expenses of the segments, both of which are non-GAAP measurements. As such, management’s measure of profitability for these segments does not include the effect of corporate overhead, described above, depreciation and amortization, other income (net), and other items that we do not consider indicative of our core operating performance.
(b) Corporate expenses consist of the Company’s enterprise shared service cost centers, and include, among other items, Information Technology, Human Resources, Accounting and Finance, Legal, Executive and Customer Service Center functions, as well as Stock-Based Compensation. In order to leverage the Company’s infrastructure, these functions are operated under a centralized management platform, providing support services throughout the organization. The costs of these functions, other than those of the Customer Service Center, which are allocated directly to the above categories based upon usage, are included within corporate expenses as they are not directly allocable to a specific segment.
View source version on businesswire.com: https://www.businesswire.com/news/home/20221103005120/en/
Investor:
Andy Milevoj
(516) 237-4617
invest@1800flowers.com
Media:
Kathleen Waugh
(516) 237-6028
kwaugh@1800flowers.com
Source: 1-800-FLOWERS.COM, Inc.