Entravision Communications Corporation is a diversified Spanish-language media company utilizing a combination of television and radio operations to reach Hispanic consumers across the United States, as well as the border markets of Mexico. Entravision owns and/or operates 53 primary television stations and is the largest affiliate group of both the top-ranked Univision television network and Univision’s TeleFutura network, with television stations in 20 of the nation’s top 50 Hispanic markets. The Company also operates one of the nation’s largest groups of primarily Spanish-language radio stations, consisting of 48 owned and operated radio stations.
Michael Kupinski, Director of Research, Noble Capital Markets, Inc.
Patrick McCann, Research Associate, Noble Capital Markets, Inc.
Refer to the full report for the price target, fundamental analysis, and rating.
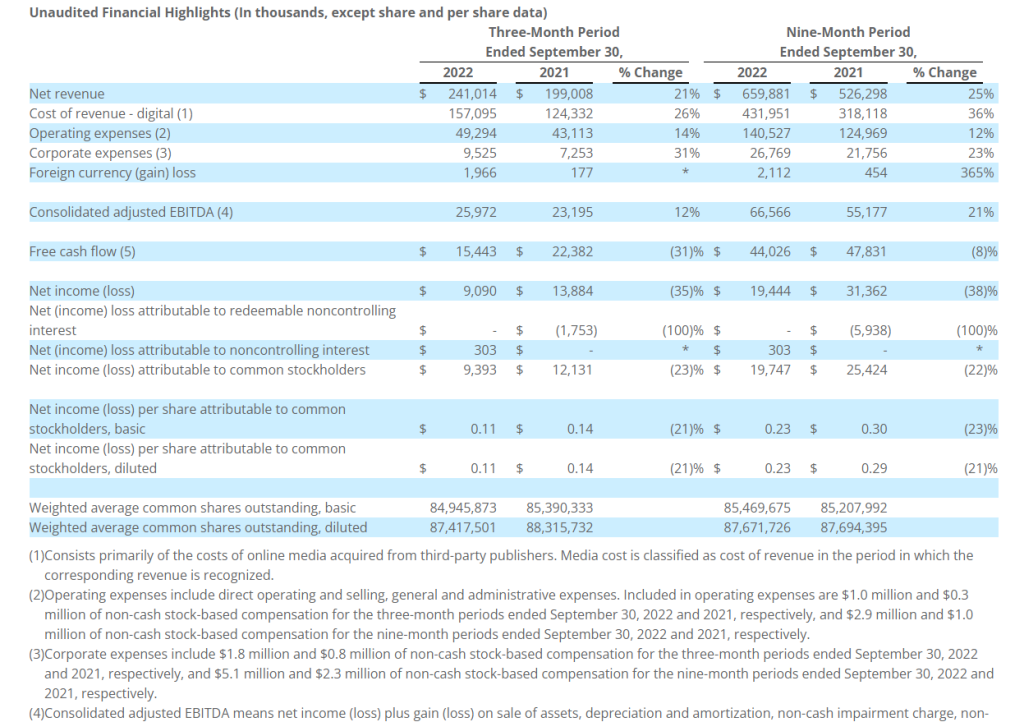
Solid Q3 results. Q3 revenue of $241 million increased 21% versus the prior year period, better than our $234.1 million estimate. Digital revenues accounted for much of the upside variance while stronger than expected Political advertising contributed as well. Adj. EBITDA was $25.9 million, up 12% year over year, slightly below our $27.3 million estimate, which was impacted by currency exchange rates.
Digital continues its impressive growth. Digital revenues increased 29%, driven by strong performance of the company’s digital ad agency business in Latin America. Additionally, the recent acquisitions of 365 Digital and MediaDonuts were not fully accounted for in in Q3 of 2021, leading to further upside in the quarter.
This Company Sponsored Research is provided by Noble Capital Markets, Inc., a FINRA and S.E.C. registered broker-dealer (B/D).
*Analyst certification and important disclosures included in the full report. NOTE: investment decisions should not be based upon the content of this research summary. Proper due diligence is required before making any investment decision.
CoreCivic is a diversified, government-solutions company with the scale and experience needed to solve tough government challenges in flexible, cost-effective ways. We provide a broad range of solutions to government partners that serve the public good through high-quality corrections and detention management, a network of residential and non-residential alternatives to incarceration to help address America’s recidivism crisis, and government real estate solutions. We are the nation’s largest owner of partnership correctional, detention and residential reentry facilities, and believe we are the largest private owner of real estate used by government agencies in the United States. We have been a flexible and dependable partner for government for nearly 40 years. Our employees are driven by a deep sense of service, high standards of professionalism and a responsibility to help government better the public good. Learn more at www.corecivic.com.
Joe Gomes, Senior Research Analyst, Noble Capital Markets, Inc.
Joshua Zoepfel, Research Associate, Noble Capital Markets, Inc.
Refer to the full report for the price target, fundamental analysis, and rating.
Increasing Populations. Management noted ICE populations have increased nearly 26% quarter-to-date. While one month does not make a trend, that is encouraging, especially as we believe there will be further loosening of COVID restrictions and a removal of Title 42, both of which could increase the demand for CoreCivic’s services.
More to Come? In addition to the rising ICE populations, management noted increasing interest from other parties for staffing shortages, as these parties deal with a very tight labor market. With excess bed capacity available and the staff hired, CoreCivic is well positioned to pick up additional business, in our view.
This Company Sponsored Research is provided by Noble Capital Markets, Inc., a FINRA and S.E.C. registered broker-dealer (B/D).
*Analyst certification and important disclosures included in the full report. NOTE: investment decisions should not be based upon the content of this research summary. Proper due diligence is required before making any investment decision.
ISG (Information Services Group) (Nasdaq: III) is a leading global technology research and advisory firm. A trusted business partner to more than 700 clients, including more than 75 of the world’s top 100 enterprises, ISG is committed to helping corporations, public sector organizations, and service and technology providers achieve operational excellence and faster growth. The firm specializes in digital transformation services, including automation, cloud and data analytics; sourcing advisory; managed governance and risk services; network carrier services; strategy and operations design; change management; market intelligence and technology research and analysis. Founded in 2006, and based in Stamford, Conn., ISG employs more than 1,300 digital-ready professionals operating in more than 20 countries—a global team known for its innovative thinking, market influence, deep industry and technology expertise, and world-class research and analytical capabilities based on the industry’s most comprehensive marketplace data. For additional information, visit www.ISG-One.com
Joe Gomes, Senior Research Analyst, Noble Capital Markets, Inc.
Joshua Zoepfel, Research Associate, Noble Capital Markets, Inc.
Refer to the full report for the price target, fundamental analysis, and rating.
3Q22 Results. ISG announced revenue of $68.8 million, down from $71.1 million in the year ago period, management’s $71-$73 million guide, and our $72 million estimate. The key culprit was a $4 million negative FX impact. Third quarter net income was $5.6 million, GAAP EPS was $0.11, and adjusted EPS was $0.14. Adjusted EBITDA was $10.7 million, a 5.1% increase year-over-year. We forecasted net income of $4.17 million, $0.11 fully diluted EPS, and adjusted EBITDA of $10.4 million.
Cap Structure and Returning Capital. Cash balance totaled $19.7 million at September 30, 2022, down from $31.5 million at June 30, 2022, while outstanding debt was $71.3 million at the end of the third quarter. During the third quarter, ISG repurchased $4.8 million of shares, paid dividends of $2.0 million, paid $1.0 million in a final earnout associated with the 2020 Neuralify acquisition, and paid down $1.1 million of debt.
This Company Sponsored Research is provided by Noble Capital Markets, Inc., a FINRA and S.E.C. registered broker-dealer (B/D).
*Analyst certification and important disclosures included in the full report. NOTE: investment decisions should not be based upon the content of this research summary. Proper due diligence is required before making any investment decision.
FAT Brands (NASDAQ: FAT) is a leading global franchising company that strategically acquires, markets, and develops fast casual, quick-service, casual dining, and polished casual dining concepts around the world. The Company currently owns 17 restaurant brands: Round Table Pizza, Fatburger, Marble Slab Creamery, Johnny Rockets, Fazoli’s, Twin Peaks, Great American Cookies, Hot Dog on a Stick, Buffalo’s Cafe & Express, Hurricane Grill & Wings, Pretzelmaker, Elevation Burger, Native Grill & Wings, Yalla Mediterranean and Ponderosa and Bonanza Steakhouses, and franchises and owns over 2,300 units worldwide. For more information on FAT Brands, please visit www.fatbrands.com.
Joe Gomes, Senior Research Analyst, Noble Capital Markets, Inc.
Joshua Zoepfel, Research Associate, Noble Capital Markets, Inc.
Refer to the full report for the price target, fundamental analysis, and rating.
A Large Deal. Yesterday, FAT Brands announced a new development deal that will open 80 new franchised locations in Texas. In a partnership with Brame Holdings LLC, 40 Round Table Pizza restaurants and 40 co-branded Fatburger and Buffalo’s Express locations will open over the next 10 years, with the first opening in 2023.
Who is Brame Holdings LLC? Brame Holdings is an experienced fine dining operator located in San Antonio, Texas. The firm’s reason for the deal is to expand on the existing portfolio with the addition of fast casual/quick-service concepts. FAT Brands believes Brame has the capital and experience to quickly develop and open new Round Table Pizza and Fatburger and Buffalo’s Express locations in Texas.
This Company Sponsored Research is provided by Noble Capital Markets, Inc., a FINRA and S.E.C. registered broker-dealer (B/D).
*Analyst certification and important disclosures included in the full report. NOTE: investment decisions should not be based upon the content of this research summary. Proper due diligence is required before making any investment decision.
For more than 45 years, 1-800-Flowers.com has offered truly original floral arrangements, plants and unique gifts to celebrate birthdays, anniversaries, everyday occasions, and seasonal holidays, and to deliver comfort during times of grief. Backed by a caring team obsessed with service, 1-800-Flowers.com provides customers thoughtful ways to express themselves and connect with the most important people in their lives. 1-800-Flowers.com is part of the 1-800-FLOWERS.COM, Inc. family of brands. Shares in 1-800-FLOWERS.COM, Inc. are traded on the NASDAQ Global Select Market, ticker symbol: FLWS.
Michael Kupinski, Director of Research, Noble Capital Markets, Inc.
Patrick McCann, Research Associate, Noble Capital Markets, Inc.
Refer to the full report for the price target, fundamental analysis, and rating.
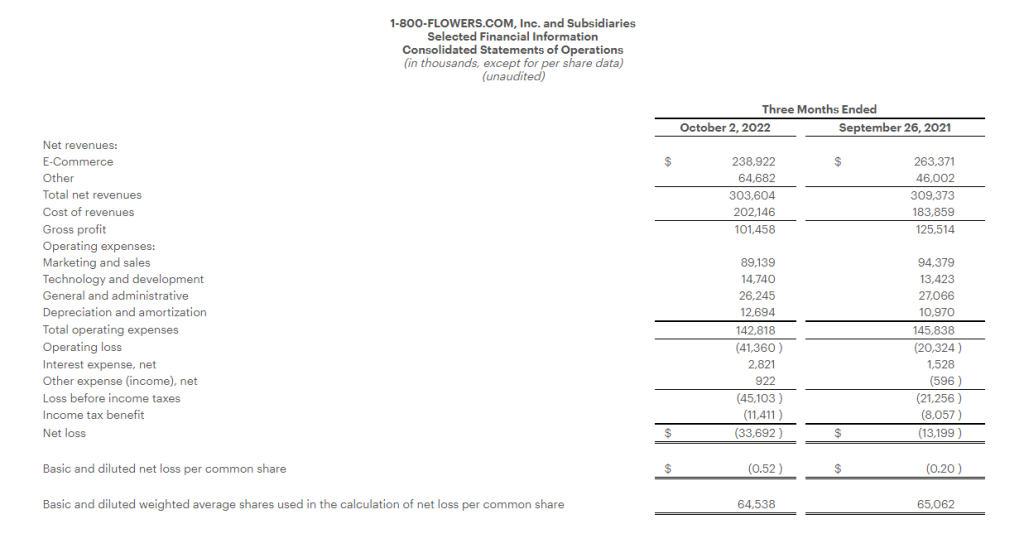
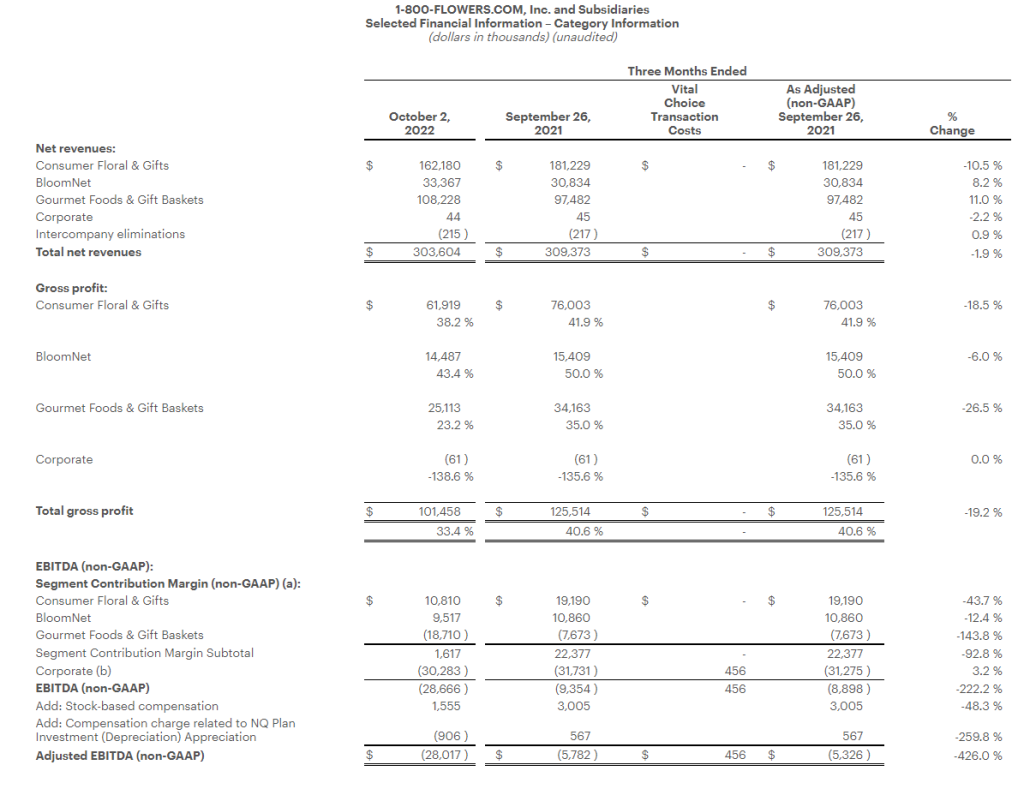
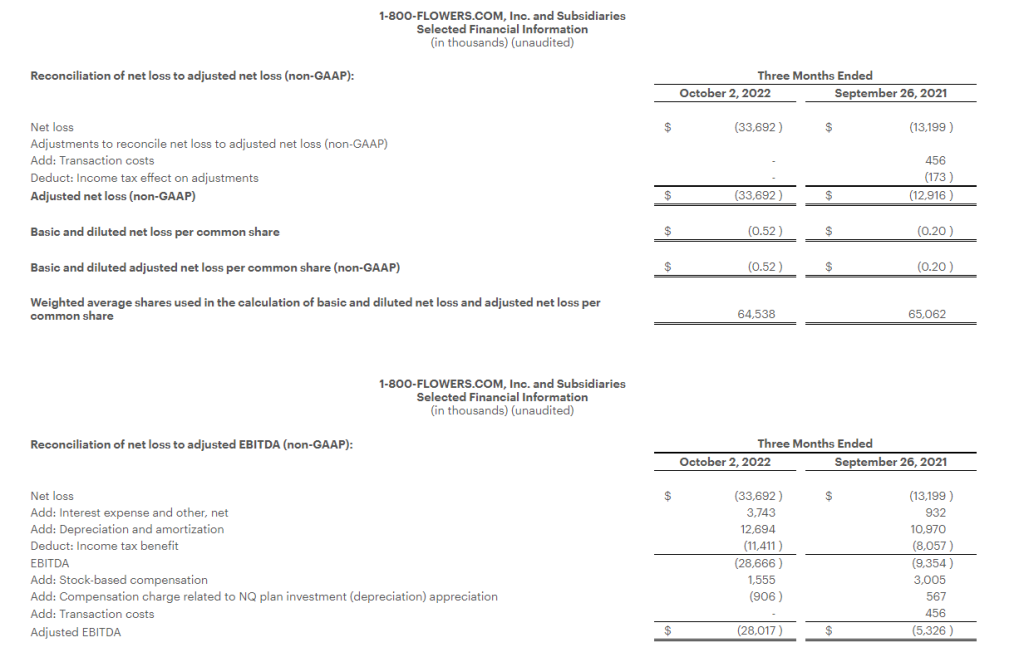
Fiscal Q1 exceeds expectations. The company reported fiscal Q1 revenue of $303.6 million, 2.4% above our forecast of $296.5 million. Stronger revenues in Gourmet Food & Gift Baskets accounted for the largest upside revenue variance. Adj. EBITDA loss of $28.7 million was better than our forecast of a loss of $34 million.
Segment contributions. Revenue was bolstered by 11% growth in the Gourmet Food & Gift Baskets segment, reflecting the Vital Choice acquisition last year, which benefited the quarter by roughly $5 million. The Adj. EBITDA upside was driven by better-than-expected margins in the Consumer Floral and BloomNet segments. Management anticipates that margins should improve in the second half due to moderating labor, ocean freight and shipping costs.
This Company Sponsored Research is provided by Noble Capital Markets, Inc., a FINRA and S.E.C. registered broker-dealer (B/D).
*Analyst certification and important disclosures included in the full report. NOTE: investment decisions should not be based upon the content of this research summary. Proper due diligence is required before making any investment decision.
Philippe Petit walks Tightrope between buildings one and two of WTC, Manhattan, 1974 – Robert.Dearie (Flickr)
Analyst Team Point Out Asset Classes that Slingshotted in the 1970s
While the traditional fine print usually says, “past performance is no guarantee of future results,’ we all know trading decisions, whether the stocks are to be held for seconds, or decades, are based on probabilities. And market probabilities are rooted in past performance. What does past performance tell us about the chances that the markets can survive high inflation and low growth? Well, if the stagflation of the 70s repeats, there may be a small section of the markets to keep a solid footing.
Michael Hartnett is the chief investment strategist at Bank of America/Merrill Lynch. Hartnett sees in our current economy the ingredients in the macroeconomic picture that lead to the difficult economic combination of high inflation and low growth. His team, in their Flow Show note on Friday, wrote: “Inflation and stagnation was ‘unanticipated in 2022…hence $35 trillion collapse in asset valuations; but relative returns in 2022 have very much mirrored asset returns in 1973/74, and the 70s remain our asset allocation analog for 2020s.”
If the conditions of the 1970s are being mirrored and we are creating a foundation similar to 1973/74, Hartnett and team have a list of assets that could springboard off the stagflation cycle.
The assets with potential include taking long positions in small-caps, value, commodities, resources, volatility, and emerging markets. The group also highlights the short positions that worked well in the 1970s, the note indicates these are larger stocks, bonds, growth, and technology.
Why Small-Caps
As it applies to the smaller companies, the note points out that stagflation persisted through the late 1970s, but the inflation shock had ended by 1973/74, when the small-cap asset class “entered one of the great bull markets of all-time.” The Hartnett team sees small-caps set to keep outperforming in the “coming years of stagflation.”
The current year-to-date status has the Russell 2000 small-cap stock market index (measured by iShares ETF) down 19.8% in 2022. At the same time, the Dow Industrials are down 11%, S&P 500 lost 21%, and the Nasdaq Composite gave back 33%.
The current state of the Fed and Chairman Powell is they continue to be adamant about tightening, Powell said he’d prefer to overdo withdrawing stimulus than do too little. He also knows that until the market believes this, his tightening efforts will have a lower impact.
The BofA team isn’t helping market expectations as they noted, despite Powell’s clear signal that the Fed isn’t ready to declare even a slight victory from its raising rates; the analyst team says, don’t give up on that pivot.
After tightening interest rates through 1973/74 amid inflation and oil shocks, the central bank first cut in July 1975 as growth turned negative, Hartnett points out. A sustained pivot began in December of that year, and importantly, the unemployment rate surged from 5.6% and 6.6% that same month.
The “following 12 months, the S&P 500 rose 31%. The note suggests the lesson learned is that job losses when they occur, will be the catalyst for a 2023 pivot,” said Hartnett and the team.
We’re not there yet. Today’s economic release on jobs showed the U.S. added a stronger-than-expected 261,000 jobs during October. This is a slower pace than the prior month’s 315,000 job gains but still shows the Fed can comfortably notch rates up more and continue reducing its balance sheet.
Take Away
The team of analysts at BofA/Merrill Lynch, reporting to Michael Hartnett, drew conclusions from the stagflation and financial markets’ performance of the 1970s. They shared their thoughts in a research note with investors. Looking at past performance, their expectation is that the Fed will pivot away from aggressively raising rates when it begins to negatively impact job creation. At this point, many markets will have already reacted to inflation expectations and would then react to a more accommodative monetary policy.
The asset sectors to avoid or short are larger stocks, bonds, growth, and technology. The preferred sectors that, in past situations, have done well are small-caps, value, commodities, resources, volatility, and emerging markets.
Be sure to sign-up at no cost for small and microcap company research sent to you each day by Channelchek.
How the U.S. and its Allies Plan to Put the Squeeze on Russian Oil Profits
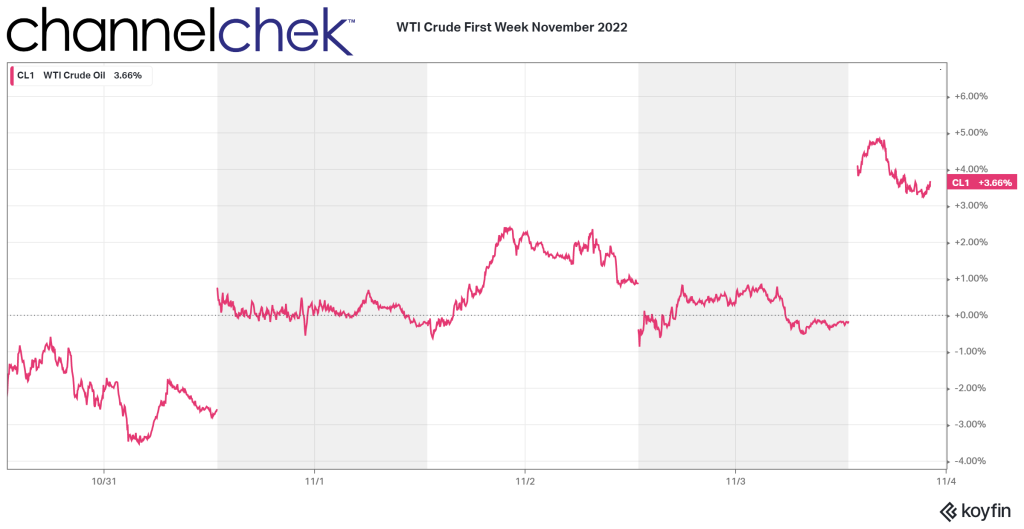
Volatility in oil prices this week has been extreme, even by the standards already set this decade. The price of WTI rose nearly 5% just today. The month ahead promises to create even more volatility as Saudi Arabia just cut prices to Asia; meanwhile, the US and its allies have agreed to put a cap on Russian oil. Details on many of these influences have not yet been worked out or announced. What is known is that the price cap and other sanctions against Russia begin in one month. The commodity trading days leading to the planned December 5 start date and the weeks that follow ought to create a great deal of speculation and price movement. Here is what we do know the allies have agreed upon.
The Cap Map
Sales of Russian oil to the participating countries will be subject to a price cap. The cap pertains to the initial purchase of a load of seaborne Russian oil. The agreement settled by the US and its allies doesn’t subject any subsequent sale of crude as falling under the same cap. The cost of transporting Russian oil is not included in the calculation of the cap. However, these rules only apply once the load of oil makes land. Out at sea, the rules are different.
Trades of Russian oil that occur once the load is at sea are expected to still fall under the cap. However, if the Russia-originated oil has been refined into products such as diesel or gasoline, then it is not subject to the cap.
Restrictions and Jurisdictions
Under the expected price-cap plan, the Group of Seven and Australia are planning to restrict firms in their countries from providing insurance and other key maritime services for any Russian oil shipment unless the oil is sold below a set price. Because much of the world’s maritime services are based in G-7 countries and the European Union, the Western partners are aiming to effectively dictate the price at which Russia can sell some of its oil on global markets.
The Precise Price
The US and its allies have yet to set the price for the scheme, but they expect to define the level or range well before the December 5 implementation date. The slow pace of finalizing the plan have left some oil-market participants concerned that shipments of Russian oil at sea on December 5 could face the cap restrictions. The US Treasury Department, earlier this week, has clarified how this would be determined. The agreement rules that Russian oil shipped before December 5 would be exempt from the cap if it is unloaded at its destination by January 19.
It’s expected the price cap would not bring a crushing blow to banks, insurers, shippers, and traders that help make Russian oil available on global markets. The goal is to cut into the profits Russia earns from its oil sales, the hope by participants is to keep global markets supplied with Russian oil and keep energy prices steady.
The precise price is unknown, however a price range in the mid-60s has been discussed as the possible cap range, as it represents levels in line with where Russian oil had traded before the big run-up.
What Else?
Officials speaking for Russia have threatened to cut their oil production in retaliation for any price cap. It remains seen whether this game of each party partaking in ugly medicine for the survival of both will play out in unexpected ways.
The plan for the price cap for Russian crude will go into effect on December 5, while two separate price limits for refined Russian petroleum products will kick in on February 5.
Expect volatility in oil prices, leading up to and after the caps go into effect. At the same time, expect the unexpected as it relates to energy.
SANTA MONICA, Calif.–(BUSINESS WIRE)– Entravision Communications Corporation (NYSE: EVC), a leading global advertising solutions, media and technology company, today announced financial results for the three- and nine-month periods ended September 30, 2022.
Third Quarter 2022 Highlights
Record third quarter advertising revenue
Net revenue up 21% over the prior-year quarter
Net income attributable to common stockholders down 23% over the prior-year quarter
Consolidated adjusted EBITDA up 12% over the prior-year quarter
Operating cash flow up 62% over the prior-year quarter
Free cash flow down 31% over the prior-year quarter
Quarterly cash dividend of $0.025 per share
“Entravision continued to see progress in the third quarter of 2022, with revenue up 21% versus the prior-year period. Adjusted EBITDA also improved double-digits, increasing 12% year-over-year,” said Walter Ulloa, Chairman and Chief Executive Officer. “Entravision’s strength throughout the quarter was again driven by our digital segment, where revenue improved 29% versus the third quarter of 2021. In our television and audio businesses, political ad spend, in particular, continued to perform strongly.”
Mr. Ulloa continued, “Entravision’s solid performance in the third quarter, together with our progress year-to-date, demonstrates the resiliency and growth of our business in a tough macro environment. We continue to strategically expand across the globe and now have operations in 40 countries across five continents in service of more than 7,000 clients. We are thoughtfully positioning our digital teams in emerging economies where Entravision’s unique offerings have a key first-mover advantage and where a critical mass of connected consumers exists alongside a growing advertising industry. We remain optimistic in finding multiple growth opportunities around the world for our digital business and look forward to sharing our progress as we continue to grow and expand globally.”
Quarterly Cash Dividend
The Company announced today that its Board of Directors approved a quarterly cash dividend to shareholders of $0.025 per share on the Company’s Class A, Class B and Class U common stock, in an aggregate amount of approximately $2.1 million. The quarterly dividend will be payable on December 30, 2022 to shareholders of record as of the close of business on December 15, 2022, and the common stock will trade ex-dividend on December 14, 2022. The Company currently anticipates that future cash dividends will be paid on a quarterly basis; however, any decision to pay future cash dividends will be subject to approval by the Board.
Non-GAAP Financial Measures
This press release contains certain non-GAAP financial measures as defined by SEC Regulation G. The GAAP financial measure most directly comparable to each of these non-GAAP financial measures, and a table reconciling each of these non-GAAP financial measures to its most directly comparable GAAP financial measure is included beginning on page 10.
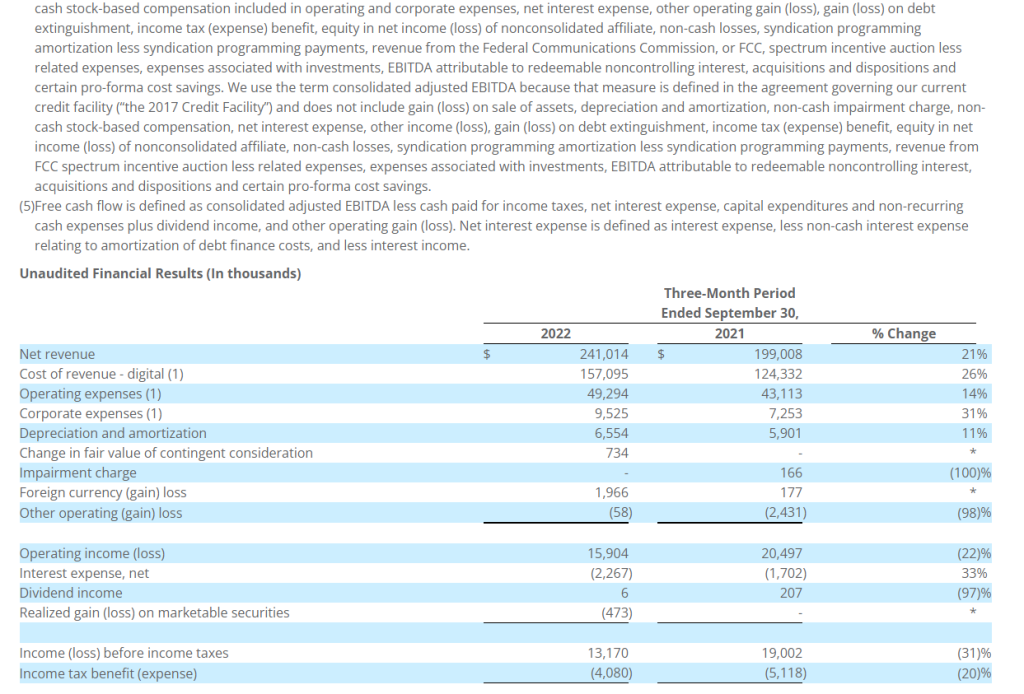
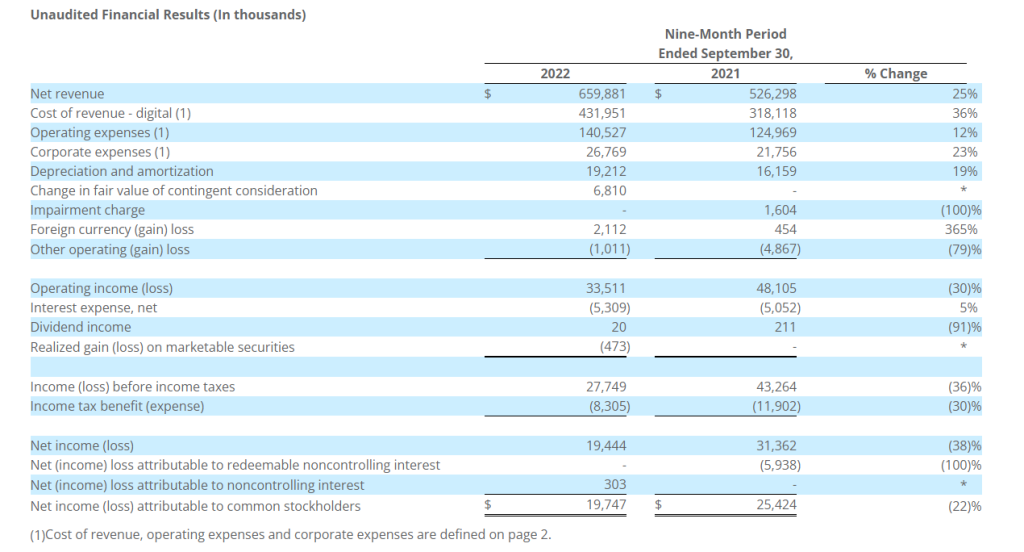
Net revenue in the third quarter of 2022 totaled $241.0 million, up 21% from $199.0 million in the prior-year period. Of the overall increase, approximately $42.8 million was attributable to our digital segment and was primarily due to advertising revenue growth from our digital commercial partnerships business, and due to our investment in a variable interest entity during the third quarter of 2022 and our acquisition of 365 Digital during the fourth quarter of 2021, neither of which contributed to net revenue in the comparable period ended September 30, 2021. In addition, of the overall increase, approximately $0.1 million was attributable to our audio segment, primarily due to increases in political advertising revenue and local advertising revenue, partially offset by a decrease in national advertising revenue. The overall increase was partially offset by a decrease of approximately $0.8 million attributable to our television segment, primarily due to decreases in local and national advertising revenue, and a decrease in retransmission consent revenue. These decreases were mainly attributed to the expiration of our Univision and UniMás network affiliation agreements in Orlando, Tampa and Washington, D.C. on December 31, 2021. The decrease in our television segment revenue was partially offset by increases in political advertising revenue and spectrum usage rights revenue.
Cost of revenue in the third quarter of 2022 totaled $157.1 million, up 26% from $124.3 million in the prior-year period. The increase was primarily due to increased cost of revenue related to advertising revenue growth from our digital commercial partnerships business, and due to our investment in a variable interest entity during the third quarter of 2022 and our acquisition of 365 Digital during the fourth quarter of 2021, neither of which incurred cost of revenue for us in the comparable period ended September 30, 2021.
Operating expenses in the third quarter of 2022 totaled $49.3 million, up 14% from $43.1 million in the prior-year period. Of the overall increase, approximately $5.9 million was attributable to our digital segment and was primarily due to an increase in expenses associated with the increase in digital advertising revenue, an increase in salary expense and our investment in a variable interest entity during the third quarter of 2022 and our acquisition of 365 Digital during the fourth quarter of 2021, which did not incur operating expenses for us in the comparable period. Additionally, of the overall increase in operating expenses, approximately $0.4 million was attributable to our audio segment primarily due to an increase in expenses associated with the increase in local advertising revenue. The overall increase in operating expenses was partially offset by a decrease of approximately $0.1 million that was attributable to our television segment primarily due to a decrease in expenses associated with the decrease in local and national advertising revenue, partially offset by an increase in rent expense and an increase in bad debt expense.
Corporate expenses in the third quarter of 2022 totaled $9.5 million, up 31% from $7.3 million in the prior-year period. The increase was primarily due to increases in non-cash stock-based compensation and an increase in salaries.
Net revenue for the nine-month period of 2022 totaled $659.9 million, up 25% from $526.3 million in the prior-year period. Of the overall increase, approximately $139.1 million was attributable to our digital segment and was primarily due to advertising revenue growth from our digital commercial partnerships business. In addition, the increase in net revenue in our digital segment was due to our investment in a variable interest entity and our acquisition of 365 Digital during the third quarter of 2022 and fourth quarter of 2021, respectively, neither of which contributed to net revenue in the comparable period ended September 30, 2021, and due to our acquisition of MediaDonuts during the third of 2021, which only partially contributed to net revenue in the comparable period ended September 30, 2021. Additionally, of the overall increase, approximately $2.1 million was attributable to our audio segment, primarily due to increases in political advertising revenue and local advertising revenue, partially offset by a decrease in national advertising revenue. The overall increase was partially offset by a decrease of approximately $7.7 million attributable to our television segment, primarily due to decreases in local and national advertising revenue, and a decrease in retransmission consent revenue. These decreases were mainly attributed to the expiration of our Univision and UniMás network affiliation agreements in Orlando, Tampa and Washington, D.C. on December 31, 2021. The decrease in our television segment revenue was partially offset by increases in political advertising revenue and spectrum usage rights revenue.
Cost of revenue for the nine-month period of 2022 totaled $432.0 million, up 36% from $318.1 million in the prior-year period. The increase was primarily due to increased cost of revenue related to advertising revenue growth from our digital commercial partnerships business, and due to our investment in a variable interest entity and our acquisition of 365 Digital during the third quarter of 2022 and fourth quarter of 2021, respectively, neither of which incurred cost of revenue for us in the comparable period ended September 30, 2021, and due to our acquisition of MediaDonuts during the third of 2021, which only partially incurred cost of revenue for us in the comparable period ended September 30, 2021.
Operating expenses for the nine-month period of 2022 totaled $140.5 million, up 12% from $125.0 million in the prior-year period. Of the overall increase, approximately $15.5 million was attributable to our digital segment and was primarily due to an increase in expenses associated with the increase in digital advertising revenue and an increase in salary expense. In addition, the increase in operating expenses in our digital segment was due to our investment in a variable interest entity and our acquisition of 365 Digital during the third quarter of 2022 and fourth quarter of 2021, respectively, neither of which incurred operating expenses for us in the comparable period ended September 30, 2021, and due to our acquisition of MediaDonuts during the third of 2021, which only partially incurred operating expenses for us in the comparable period ended September 30, 2021. Additionally, of the overall increase in operating expenses, approximately $0.6 million was attributable to our audio segment primarily due to an increase in expenses associated with the increase in local advertising revenue. The overall increase in operating expenses was partially offset by a decrease of approximately $0.6 million that was attributable to our television segment primarily due to a decrease in expenses associated with the decrease in local and national advertising revenue, partially offset by an increase in rent expense and bad debt expense.
Corporate expenses for the nine-month period of 2022 totaled $26.8 million, up 23% from $21.8 million in the prior-year period. The increase was primarily due to increases in non-cash stock-based compensation and an increase in salaries.
Balance Sheet and Related Metrics
Cash and marketable securities as of September 30, 2022 totaled approximately $164.8 million. Total debt under the Company’s credit agreement was $210.0 million. Net of $75 million of cash and marketable securities, total leverage as defined in the Company’s credit agreement was 1.4 times as of September 30, 2022. Net of total cash and marketable securities, total leverage was 0.5 times.
Notice of Conference Call
Entravision Communications Corporation will hold a conference call to discuss its third quarter 2022 results on Thursday, November 3, 2022 at 4:30 p.m. Eastern Time. To access the conference call, please dial (844) 836-8739 (U.S.) or (412) 317-5440 (Int’l) ten minutes prior to the start time and reference Conference ID number 10171311. The call will also be available via live webcast on the investor relations portion of the Company’s website located at www.entravision.com.
About Entravision Communications Corporation
Entravision is a leading global advertising, media and ad-tech solutions company connecting brands to consumers by representing top platforms and publishers. Our dynamic portfolio includes digital, television and audio offerings. Digital, our largest revenue segment, is comprised of four business units: our digital sales representation business; Smadex, our programmatic ad purchasing platform; our branding and mobile performance solutions business; and our digital audio business. Through our digital sales representation business, we connect global media companies such as Meta, Twitter, TikTok and Spotify with advertisers in primarily emerging growth markets worldwide. Smadex is our mobile-first demand side platform, enabling advertisers to execute performance campaigns using machine learning. We also offer a branding and mobile performance solutions business, which provides managed services to advertisers looking to connect with global consumers, primarily on mobile devices, and our digital audio business provides digital audio advertising solutions for advertisers in the Americas. In addition to digital, Entravision has 49 television stations and is the largest affiliate group of the Univision and UniMás television networks. Entravision also manages 45 primarily Spanish-language radio stations that feature nationally recognized, Emmy award-winning talent. Shares of Entravision Class A Common Stock trade on the NYSE under ticker: EVC. Learn more about our offerings at entravision.com or connect with us on LinkedIn and Facebook.
Forward-Looking Statements
This press release contains certain forward-looking statements. These forward-looking statements, which are included in accordance with the safe harbor provisions of the Private Securities Litigation Reform Act of 1995, may involve known and unknown risks, uncertainties and other factors that may cause the Company’s actual results and performance in future periods to be materially different from any future results or performance suggested by the forward-looking statements in this press release. Although the Company believes the expectations reflected in such forward-looking statements are based upon reasonable assumptions, it can give no assurance that actual results will not differ materially from these expectations, and the Company disclaims any duty to update any forward-looking statements made by the Company. From time to time, these risks, uncertainties and other factors are discussed in the Company’s filings with the Securities and Exchange Commission.
IRVING, Texas–(BUSINESS WIRE)– Salem Media Group, Inc. (Nasdaq: SALM) released its results for the three and nine months ended September 30, 2022.
Third Quarter 2022 Results
For the quarter ended September 30, 2022 compared to the quarter ended September 30, 2021:
Consolidated
Total revenue increased 1.3% to $66.9 million from $66.0 million;
Total operating expenses increased 50.7% to $75.6 million from $50.2 million;
Operating expenses, excluding stock-based compensation expense, debt modification costs, gains and losses on the sale or disposition of assets, legal settlement, impairments, depreciation expense and amortization expense (1) increased 10.3% to $60.8 million from $55.2 million;
The company had an operating loss of $8.8 million compared to operating income of $15.8 million;
The company recognized $0.1 million in film distribution income from an unconsolidated equity investment;
The company had a net loss of $11.9 million, or $0.44 net loss per share compared to net income of $22.1 million, or $0.81 net income per diluted share;
EBITDA (1) decreased to $(5.7) million from $30.2 million; and
Adjusted EBITDA (1) decreased 78.8% to $2.3 million from $10.8 million.
Broadcast
Net broadcast revenue increased 3.1% to $51.1 million from $49.6 million;
Station Operating Income (“SOI”) (1) decreased 17.9% to $10.0 million from $12.1 million;
Same Station (1) net broadcast revenue increased 3.2% to $51.1 million from $49.5 million; and
Same Station SOI (1) decreased 16.7% to $10.1 million from $12.1 million.
Digital Media
Digital media revenue decreased 4.3% to $10.2 million from $10.6 million; and
Digital Media Operating Income (1) decreased 21.9% to $1.9 million from $2.4 million.
Publishing
Publishing revenue decreased 3.7% to $5.5 million from $5.7 million; and
Publishing Operating Loss (1) was $1.0 million as compared to publishing operating income of $0.5 million.
Included in the results for the quarter ended September 30, 2022 are:
A $7.7 million ($5.7 million, net of tax, or $0.21 per share) impairment charge to the value of broadcast licenses in Boston, Chicago, Columbus, Dallas, Greenville, Honolulu, Little Rock, Orlando, Philadelphia, Portland, Sacramento, and San Francisco;
A $0.1 million loss on the disposal of assets;
A $3.8 million ($2.8 million, net of tax, or $0.10 per share) legal settlement expense; and
A $0.1 million non-cash compensation charge related to the expensing of stock options.
Included in the results for the quarter ended September 30, 2021 are:
A $2.3 million ($1.7 million, net of tax, or $0.06 per share) charge for debt modification costs. On September 10, 2021, the company refinanced $112.8 million of the 2024 Notes by exchanging into $114.7 million (reflecting a call premium of 1.688%) of 2028 Notes. The transaction was assessed on a lender-specific level and was accounted for as a debt modification in accordance with ASC 470 with $2.3 million of fees paid to third parties included in operating expenses for the period;
A $11.2 million ($8.3 million, net of tax, or $0.30 per diluted share) gain on the forgiveness of PPP loans;
A $0.1 million loss from the early retirement of long-term debt associated with the 2024 Notes;
A $10.6 million ($7.8 million, net of tax, or $0.29 per diluted share) net gain on the disposition of assets relates to a $10.5 million pre-tax gain on the sale of land in Lewisville, Texas, and $0.1 million pre-tax gain on the sale of the Hilary Kramer Financial Newsletter and related assets as well as various other fixed asset disposals; and
A $0.1 million non-cash compensation charge ($0.1 million, net of tax) related to the expensing of stock options.
Per share numbers are calculated based on 27,216,787 diluted weighted average shares for the quarter ended September 30, 2022, and 27,280,949 diluted weighted average shares for the quarter ended September 30, 2021.
Year to Date 2022 Results
For the nine months ended September 30, 2022 compared to the nine months ended September 30, 2021:
Consolidated
Total revenue increased 4.8% to $198.2 million from $189.1 million;
Total operating expenses increased 19.2% to $194.6 million from $163.3 million;
Operating expenses, excluding stock-based compensation expense, debt modification costs, gains and losses on the sale or disposition of assets, legal settlement, impairments, depreciation expense and amortization expense (1) increased 9.2% to $176.6 million from $161.6 million;
The company’s operating income decreased 86.4% to $3.5 million from $25.8 million;
The company recognized $4.0 million in film distribution income from an unconsolidated equity investment;
The company had a net loss of $1.0 million, or $0.04 net loss per share compared to net income of $24.7 million, or $0.91 net income per diluted share;
EBITDA (1) decreased 63.6% to $17.0 million from $46.7 million; and
Adjusted EBITDA (1) decreased 24.3% to $20.8 million from $27.5 million.
Broadcast
Net broadcast revenue increased 8.3% to $152.0 million from $140.4 million;
SOI (1) decreased 6.8% to $31.2 million from $33.5 million;
Same station (1) net broadcast revenue increased 8.1% to $151.6 million from $140.2 million; and
Same station SOI (1) decreased 6.7% to $31.3 million from $33.6 million.
Digital media
Digital media revenue increased 2.3% to $31.3 million from $30.6 million; and
Digital media operating income (1) increased 16.7% to $6.2 million from $5.3 million.
Publishing
Publishing revenue decreased 18.0% to $14.8 million from $18.1 million; and
Publishing Operating Loss (1) was $1.6 million compared to publishing operating income of $1.2 million.
Included in the results for the nine months ended September 30, 2022 are:
A $11.7 million ($8.6 million, net of tax, or $0.32 per share) impairment charge to the value of broadcast licenses in Boston, Chicago, Columbus, Dallas, Greenville, Honolulu, Little Rock, Orlando, Philadelphia, Portland, Sacramento and San Francisco;
A $8.5 million ($6.3 million, net of tax, or $0.23 per diluted share) net gain on the disposition of assets relates primarily to the $6.5 million pre-tax gain on the sale of land used in the company’s Denver, Colorado broadcast operations, the $1.8 million pre-tax gain on sale of land used in the company’s Phoenix, Arizona broadcast operations, and $0.5 million pre-tax gain on the sale of the company’s radio stations in Louisville, Kentucky offset by various fixed asset disposals;
A $18,000 loss on the early retirement of long-term debt associated with the 2024 Notes;
A $4.8 million ($3.5 million, net of tax, or $0.13 per share) legal settlement expense;
A $0.1 million ($0.1 million, net of tax) goodwill impairment charge;
A $0.2 million ($0.2 million, net of tax, or $0.01 per share) charge for debt modification costs; and
A $0.2 million non-cash compensation charge ($0.2 million, net of tax, or $0.01 per share) related to the expensing of stock options.
Included in the results for the nine months ended September 30, 2021 are:
A $2.3 million ($1.7 million, net of tax, or $0.06 per share) charge for debt modification costs. On September 10, 2021, the company refinanced $112.8 million of the 2024 Notes by exchanging into $114.7 million (reflecting a call premium of 1.688%) of 2028 Notes. The transaction was assessed on a lender-specific level and was accounted for as a debt modification in accordance with ASC 470 with $2.3 million of fees paid to third parties included in operating expenses for the period;
A $11.2 million ($8.3 million, net of tax, or $0.30 per diluted share) gain on the forgiveness of PPP loans;
A $0.1 million loss from the early retirement of long-term debt associated with the 2024 Notes;
A $10.6 million ($7.8 million, net of tax, or $0.29 per diluted share) net gain on the disposition of assets relating to a $10.5 million pre-tax gain on the sale of land in Lewisville, Texas, a $0.5 million pre-tax gain on the sale of Singing News Magazine and Singing News Radio and a $0.1 million pre-tax gain on the sale of the Hilary Kramer Financial Newsletter and related assets offset by $0.4 million additional loss recorded at closing on the sale of radio station WKAT-AM and FM translator in Miami, Florida and various fixed asset disposals; and
A $0.2 million non-cash compensation charge ($0.2 million, net of tax, or $0.01 per share) related to the expensing of stock options.
Per share numbers are calculated based on 27,202,983 diluted weighted average shares for the nine months ended September 30, 2022, and 27,217,382 diluted weighted average shares for the nine months ended September 30, 2021.
Balance Sheet
As of September 30, 2022, the company had $114.7 million outstanding on the 7.125% senior secured notes due 2028 (“2028 Notes”) and $44.7 million outstanding on 6.75% senior secured notes due 2024 (“2024 Notes”).
Acquisitions and Divestitures
The following transactions were completed since July 1, 2022:
On October 1, 2022, the company acquired websites and the related assets of DayTradeSPY for $0.6 million in cash. As part of the purchase agreement, the company may pay up to an additional $1.0 million of cash in contingent earn-out consideration within one-year of the closing date based on the achievement of certain revenue benchmarks.
Pending Transactions
On September 29, 2022, the company entered into an Asset Purchase Agreement (“APA”) to acquire radio station WMYM-AM and an FM translator in Miami, Florida for $5.0 million. The company paid $0.3 million of cash into an escrow account and plans to operate the radio stations under a Time Brokerage Agreement beginning on November 16, 2022.
On September 22, 2022, the company entered into an APA to acquire radio stations WWFE-AM, WRHC-AM and two FM translators in Miami, Florida for $5.0 million.
On June 2, 2021, the company entered into an APA to acquire radio station KKOL-AM in Seattle, Washington for $0.5 million. The company paid $0.1 million of cash into an escrow account and began operating the station under a Local Marketing Agreement on June 7, 2021.
Conference Call Information
Salem will host a teleconference to discuss its results on November 3, 2022 at 4:00 p.m. Central Time. To access the teleconference, please dial (888) 770-7291, and then ask to be joined into the Salem Media Group Third Quarter 2022 call or listen via the investor relations portion of the company’s website, located at investor.salemmedia.com. A replay of the teleconference will be available through November 17, 2022 and can be heard by dialing (800) 770-2030, passcode 2413416 or on the investor relations portion of the company’s website, located at investor.salemmedia.com.
Follow us on Twitter @SalemMediaGrp.
Fourth Quarter 2022 Outlook
For the fourth quarter of 2022, the company is projecting total revenue to decrease between 3% and 5% from fourth quarter 2021 total revenue of $69.1 million. This decrease is due largely to the fact that Regnery had an extremely strong fourth quarter in book sales last year. The company is also projecting operating expenses before gains or losses on the sale or disposal of assets, stock-based compensation expense, legal settlement, changes in the estimated fair value of contingent earn-out consideration, impairments, depreciation expense and amortization expense (“Recurring Operating Expenses”) to increase between 4% and 7% compared to the fourth quarter of 2021 Recurring Operating Expenses of $58.3 million.
A reconciliation of Recurring Operating Expenses to the most directly comparable GAAP measure is not available without unreasonable efforts on a forward-looking basis due to the potential high variability, complexity and low visibility with respect to the charges excluded from this non-GAAP financial measure, in particular, the change in the estimated fair value of earn-out consideration, impairments and gains or losses from the disposition of fixed assets. The company expects the variability of the above charges may have a significant, and potentially unpredictable, impact on its future GAAP financial results.
About Salem Media Group, Inc.
Salem Media Group is America’s leading multimedia company specializing in Christian and conservative content, with media properties comprising radio, digital media and book and newsletter publishing. Each day Salem serves a loyal and dedicated audience of listeners and readers numbering in the millions nationally. With its unique programming focus, Salem provides compelling content, fresh commentary and relevant information from some of the most respected figures across the Christian and conservative media landscape. Learn more about Salem Media Group, Inc. at www.salemmedia.com, Facebook and Twitter.
Forward-Looking Statements
Statements used in this press release that relate to future plans, events, financial results, prospects or performance are forward-looking statements as defined under the Private Securities Litigation Reform Act of 1995. Actual results may differ materially from those anticipated as a result of certain risks and uncertainties, including but not limited to the ability of Salem to close and integrate announced transactions, market acceptance of Salem’s radio station formats, competition from new technologies, inflation and other adverse economic conditions, and other risks and uncertainties detailed from time to time in Salem’s reports on Forms 10-K, 10-Q, 8-K and other filings filed with or furnished to the Securities and Exchange Commission. Readers are cautioned not to place undue reliance on these forward-looking statements, which speak only as of the date hereof. Salem undertakes no obligation to update or revise any forward-looking statements to reflect new information, changed circumstances or unanticipated events.
(1) Regulation G
Management uses certain non-GAAP financial measures defined below in communications with investors, analysts, rating agencies, banks and others to assist such parties in understanding the impact of various items on its financial statements. The company uses these non-GAAP financial measures to evaluate financial results, develop budgets, manage expenditures and as a measure of performance under compensation programs.
The company’s presentation of these non-GAAP financial measures should not be considered as a substitute for or superior to the most directly comparable financial measures as reported in accordance with GAAP.
Regulation G defines and prescribes the conditions under which certain non-GAAP financial information may be presented in this earnings release. The company closely monitors EBITDA, Adjusted EBITDA, Station Operating Income (“SOI”), Same Station net broadcast revenue, Same Station broadcast operating expenses, Same Station Operating Income, Digital Media Operating Income, Publishing Operating Income (Loss), and operating expenses excluding gains or losses on the disposition of assets, stock-based compensation, changes in the estimated fair value of contingent earn-out consideration, impairments, depreciation and amortization, all of which are non-GAAP financial measures. The company believes that these non-GAAP financial measures provide useful information about its core operating results, and thus, are appropriate to enhance the overall understanding of its financial performance. These non-GAAP financial measures are intended to provide management and investors a more complete understanding of its underlying operational results, trends and performance.
The company defines Station Operating Income (“SOI”) as net broadcast revenue minus broadcast operating expenses. The company defines Digital Media Operating Income as net Digital Media Revenue minus Digital Media Operating Expenses. The company defines Publishing Operating Income (Loss) as net Publishing Revenue minus Publishing Operating Expenses. The company defines EBITDA as net income before interest, taxes, depreciation, and amortization. The company defines Adjusted EBITDA as EBITDA before gains or losses on the disposition of assets, before debt modification costs, before changes in the estimated fair value of contingent earn-out consideration, before impairments, before net miscellaneous income and expenses, before (gain) loss on early retirement of long-term debt and before non-cash compensation expense. SOI, Digital Media Operating Income, Publishing Operating Income (Loss), EBITDA and Adjusted EBITDA are commonly used by the broadcast and media industry as important measures of performance and are used by investors and analysts who report on the industry to provide meaningful comparisons between broadcasters. SOI, Digital Media Operating Income, Publishing Operating Income (Loss), EBITDA and Adjusted EBITDA are not measures of liquidity or of performance in accordance with GAAP and should be viewed as a supplement to and not a substitute for or superior to its results of operations and financial condition presented in accordance with GAAP. The company’s definitions of SOI, Digital Media Operating Income, Publishing Operating Income (Loss), EBITDA and Adjusted EBITDA are not necessarily comparable to similarly titled measures reported by other companies.
The company defines Same Station net broadcast revenue as broadcast revenue from its radio stations and networks that the company owns or operates in the same format on the first and last day of each quarter, as well as the corresponding quarter of the prior year. The company defines Same Station broadcast operating expenses as broadcast operating expenses from its radio stations and networks that the company owns or operates in the same format on the first and last day of each quarter, as well as the corresponding quarter of the prior year. The company defines Same Station SOI as Same Station net broadcast revenue less Same Station broadcast operating expenses. Same Station operating results include those stations that the company owns or operates in the same format on the first and last day of each quarter, as well as the corresponding quarter of the prior year. Same Station operating results for a full calendar year are calculated as the sum of the Same Station-results for each of the four quarters of that year. The company uses Same Station operating results, a non-GAAP financial measure, both in presenting its results to stockholders and the investment community, and in its internal evaluations and management of the business. The company believes that Same Station operating results provide a meaningful comparison of period over period performance of its core broadcast operations as this measure excludes the impact of new stations, the impact of stations the company no longer owns or operates, and the impact of stations operating under a new programming format. The company’s presentation of Same Station operating results are not intended to be considered in isolation or as a substitute for the financial information prepared and presented in accordance with GAAP. The company’s definition of Same Station operating results is not necessarily comparable to similarly titled measures reported by other companies.
For all non-GAAP financial measures, investors should consider the limitations associated with these metrics, including the potential lack of comparability of these measures from one company to another.
The Supplemental Information tables that follow the condensed consolidated financial statements provide reconciliations of the non-GAAP financial measures that the company uses in this earnings release to the most directly comparable measures calculated in accordance with GAAP. The company uses non-GAAP financial measures to evaluate financial performance, develop budgets, manage expenditures, and determine employee compensation. The company’s presentation of this additional information is not to be considered as a substitute for or superior to the directly comparable measures as reported in accordance with GAAP.
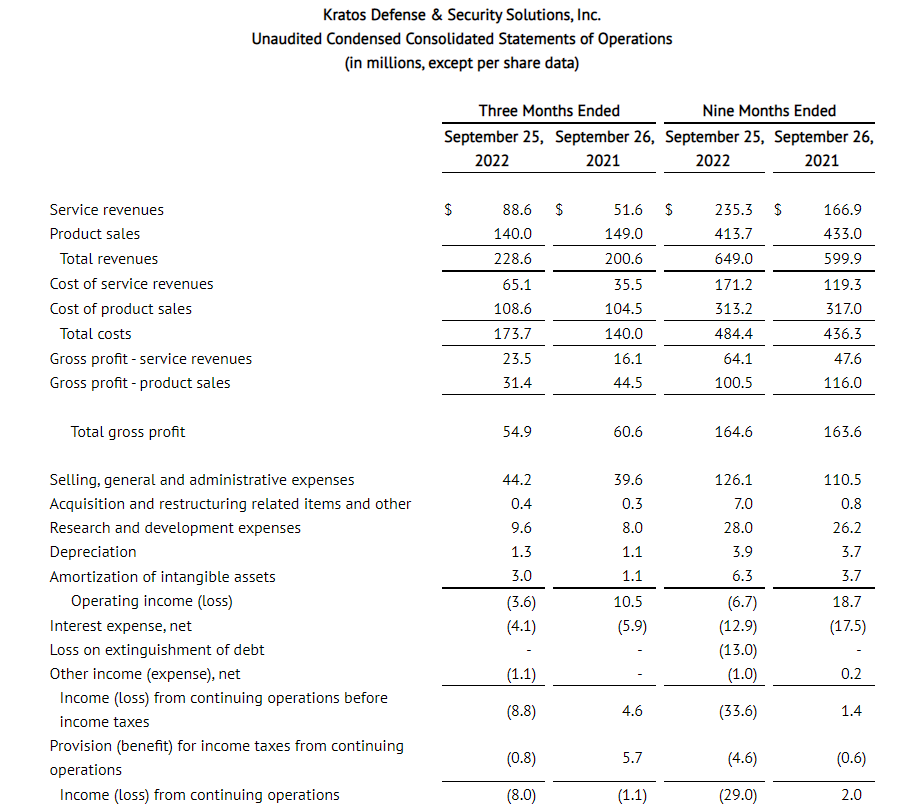
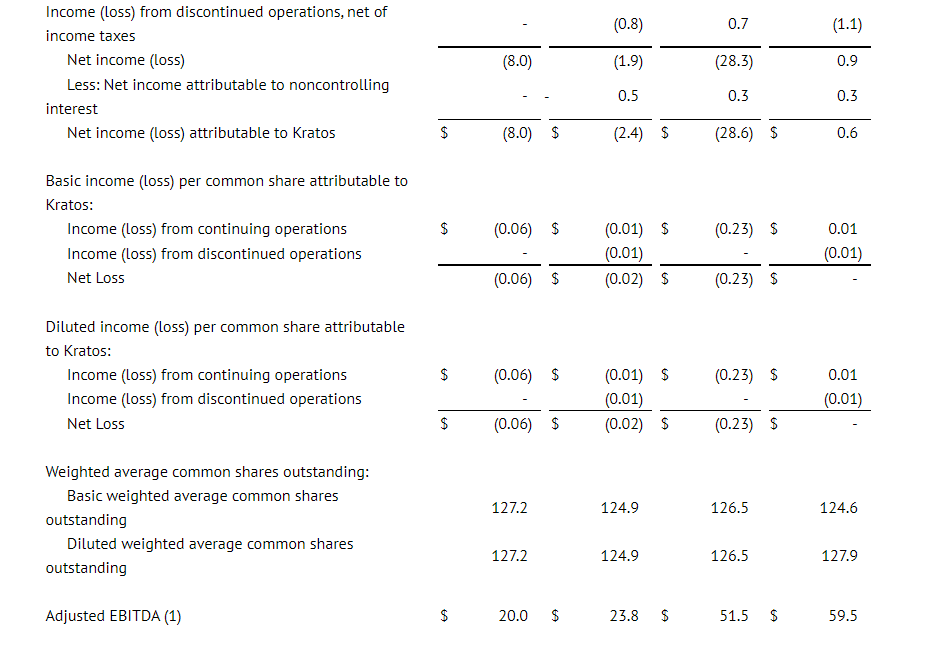
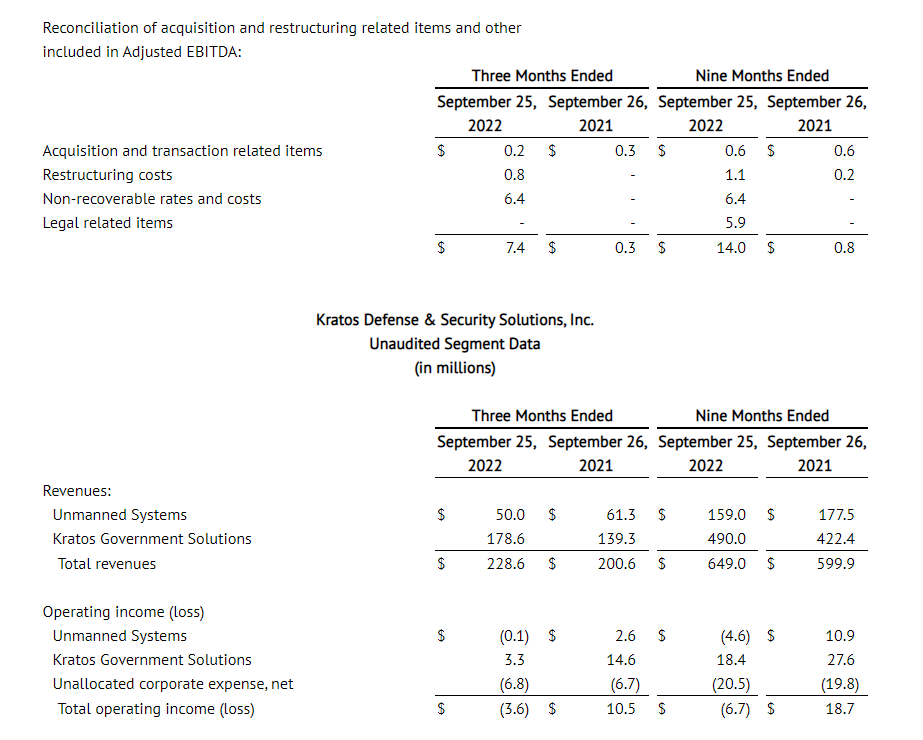
SAN DIEGO, Nov. 03, 2022 (GLOBE NEWSWIRE) — Kratos Defense & Security Solutions, Inc. (Nasdaq:KTOS), a leading National Security Solutions provider, today reported its third quarter 2022 financial results. For the third quarter of 2022, Kratos reported Revenues of $228.6 million, Operating Loss of $3.6 million, Net Loss of $8.0 million, Adjusted EBITDA of $20.0 million and a book to bill ratio of 1.1 to 1.0.
Included in Net Loss is a $6.4 million charge, $3.4 million related to certain non-recoverable costs, including rate and cost growth items resulting from an inability to hire the required planned direct labor base, both internally and by our subcontractors, to execute on our backlog, due to a continuing challenging industry environment in both hiring and retaining skilled manufacturing personnel in our C5ISR business and $3 million from non-recoverable indirect cost rate growth resulting from a smaller than planned direct labor base due to delays in customer program execution and awards in our Training Solutions business. We have recorded this charge as the Department of Defense (DoD) position remains that Requests for Equitable Adjustment (REAs) will not be accepted by contractors like Kratos for inflation related and other increased costs, and as Kratos’ contract mix in the C5ISR and Training Solutions businesses is substantially firm fixed price, we are unable to absorb and pass on to our customers such unanticipated costs in our programs, contracts and rate structures and remain competitive, including as certain program execution work has either not yet commenced or has just begun.
Third quarter 2022 Operating Loss includes non-cash stock compensation expense of $6.6 million, and Company-funded Research and Development expense of $9.6 million, primarily reflecting significant ongoing development efforts being made, including in our Space and Satellite business to develop our virtual, software-based OpenSpace ground station solution.
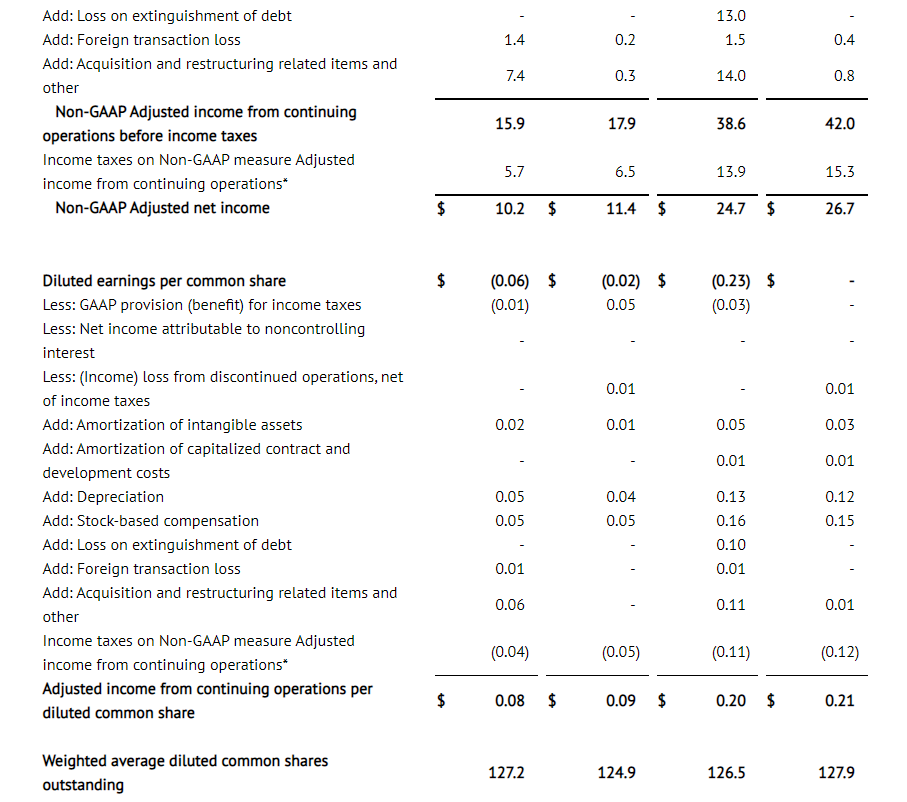
Kratos reported a third quarter 2022 GAAP loss per share of $0.06, which includes the $6.4 million charge noted above, compared to a Net Loss of $2.4 million and a GAAP loss per share of $0.02 for the third quarter of 2021. Adjusted EPS was $0.08 for the third quarter of 2022, compared to $0.09 for the third quarter of 2021.
Third quarter 2022 Revenues of $228.6 million, which increased $28.0 million, or 14.0 percent, from third quarter 2021 Revenues of $200.6 million, were adversely impacted by continuing and increased supply chain disruptions and increased material costs, COVID-related employee absenteeism and increased challenges and costs associated with hiring, obtaining and retaining qualified employees, which resulted in approximately $11.3 million of third quarter 2022 revenues being deferred into future periods, with approximately $5.9 million of associated operating income, including increased inflationary costs. Third quarter 2022 revenues include an aggregate contribution of $30.2 million from the recent acquisitions of Cosmic Advanced Engineered Solutions, Inc. (Cosmic AES), CTT, Inc. (CTT), and the Engineering Division of Southern Research Institute (SRE), organic revenue growth in our C5ISR, Turbine Technologies, Microwave Products, and Rocket Support businesses, primarily offset by reduced volume in our Unmanned Systems and Training Solutions businesses.
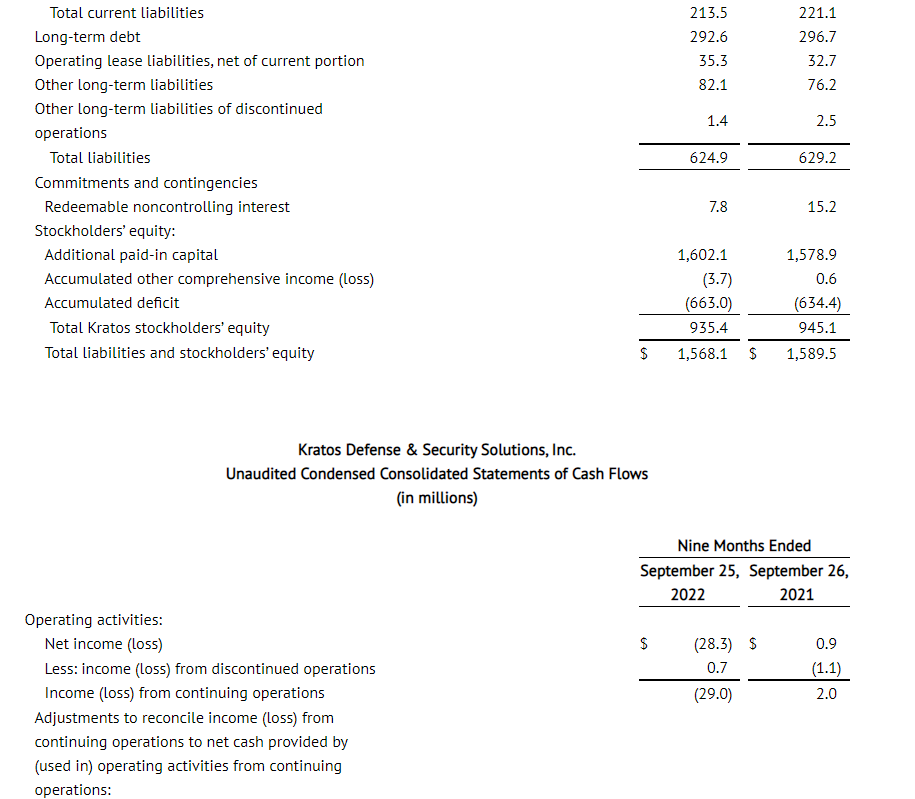
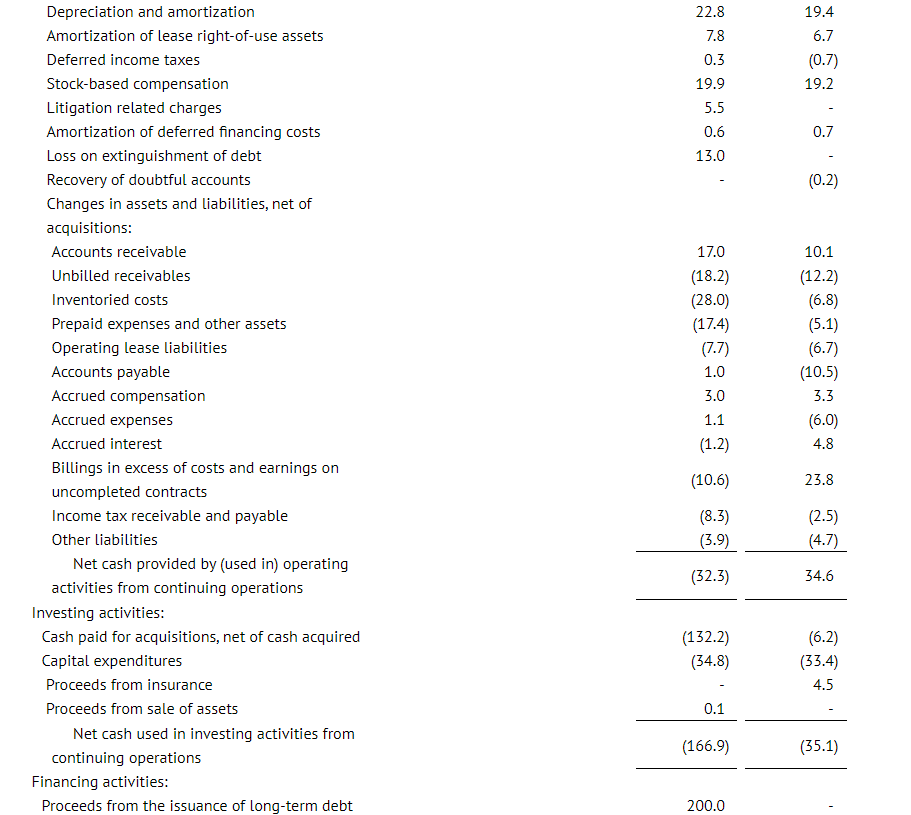
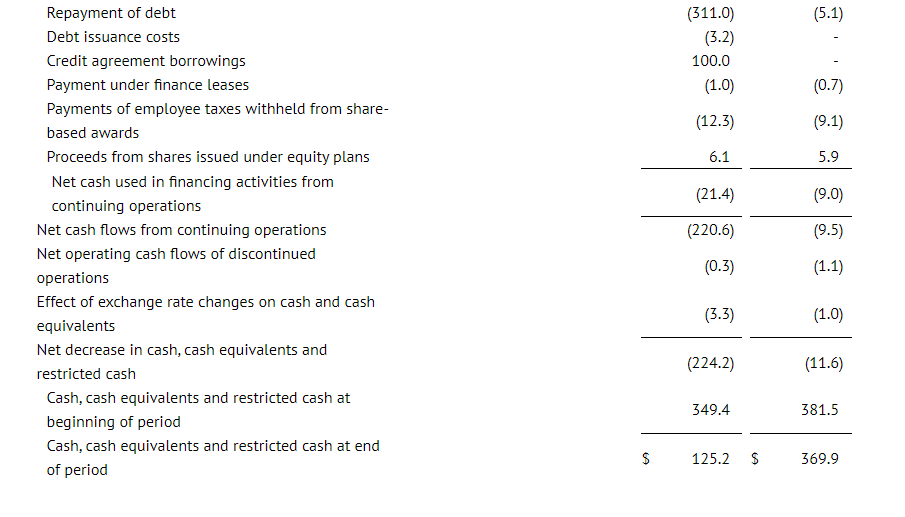
Third quarter 2022 Cash Flow Used in Operations was $2.8 million. Free Cash Flow Used in Operations was $15.7 million, after funding $12.9 million of capital expenditures, including in our Unmanned Systems, Space, Satellite and Cyber and Turbine Technologies business areas.
For the third quarter of 2022, Kratos’ Unmanned Systems Segment (KUS) generated Revenues of $50.0 million, as compared to $61.3 million in the third quarter of 2021, primarily reflecting reduced tactical drone related activity as compared to 2021. KUS Operating Loss was $0.1 million in the third quarter of 2022 compared to KUS Operating Income of $2.6 million in the third quarter of 2021, reflecting reduced volumes, a less favorable mix of revenues, including an increase in development programs which typically generate lower margins, an increase in SG&A costs of approximately $0.2 million resulting primarily from increased headcount, and an increase of R&D expenses of approximately $1.0 million.
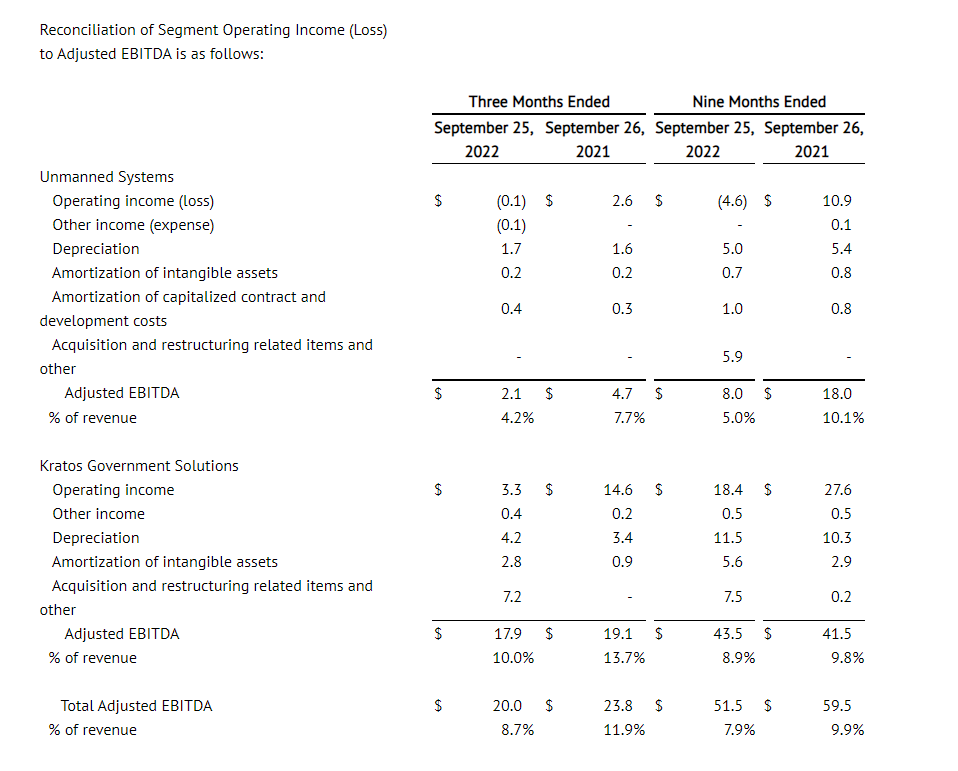
KUS Adjusted EBITDA for the third quarter of 2022 was $2.1 million, compared to third quarter 2021 KUS Adjusted EBITDA of $4.7 million, reflecting reduced volume, increases in certain development programs which typically generate lower margins and increases in SG&A, R&D, supply chain related and employee costs.
KUS’s book-to-bill ratio for the third quarter of 2022 was 1.0 to 1.0 and 1.0 to 1.0 for the last twelve months ended September 25, 2022, with bookings of $221.3 million for the twelve months ended September 25, 2022. Total backlog for KUS at the end of the third quarter of 2022 was $202.4 million compared to $203.3 million at the end of the second quarter of 2022.
For the third quarter of 2022, Kratos’ Government Solutions Segment (KGS) reported Revenues of $178.6 million, compared to Revenues of $139.3 million in the third quarter of 2021. The increased revenues include the aggregate contribution of approximately $30.2 million from the recently acquired Cosmic AES, CTT and SRE, and organic revenue growth in our C5ISR, Turbine Technologies, Microwave Products, and Rocket Support businesses, primarily offset by a reduction of $2.8 million in our Training Solutions business. On a proforma basis, excluding the Training Solutions business, KGS revenues grew organically 8.9 percent or $11.8 million, from $133.1 million in the third quarter of 2021 to $144.9 million in the third quarter of 2022.
KGS reported operating income of $3.3 million in the third quarter of 2022, compared to $14.6 million in the third quarter of 2021. Third quarter 2022 operating income included the charge for non-recoverable costs of $6.4 million in our C5ISR and Training Solutions businesses described above, as well as a $0.6 million charge related to excess Training Solutions facilities.
Kratos’ Space, Satellite and Cyber business generated Revenues of $85.9 million in the third quarter of 2022, compared to $72.0 million in the third quarter of 2021. Excluding revenues generated of $15.6 million from the recent Cosmic AES acquisition, revenues for our Space, Satellite and Cyber business were $70.3 million in the third quarter of 2022, down approximately $1.7 million reflecting the wind-down of a federal services satellite contract in 2021.
Excluding the impact of the $6.4 million charge related to non-recoverable costs and the $0.6 million charge related to excess Training Solutions facilities, third quarter 2022 KGS Adjusted EBITDA was $17.9 million, compared to third quarter 2021 KGS Adjusted EBITDA of $19.1 million.
For the third quarter of 2022, KGS reported a book-to-bill ratio of 1.1 to 1.0, with a book to bill ratio of 1.2 to 1.0 for the twelve months ended September 25, 2022, and bookings of $807.6 million for the twelve months ended September 25, 2022. Included in KGS is Kratos’ Space, Satellite and Cyber business, which reported a book to bill ratio of 1.1 to 1.0 for the third quarter of 2022, and a book to bill ratio of 1.2 to 1.0 for the twelve months ended September 25, 2022. Bookings for the Space, Satellite and Cyber business for the last twelve months ended September 25, 2022, were $406.2 million. KGS’s total backlog at the end of the third quarter of 2022 was $866.6 million, as compared to $846.9 million at the end of the second quarter of 2022.
For the third quarter of 2022, Kratos reported consolidated bookings of $246.5 million and a book-to-bill ratio of 1.1 to 1.0, with consolidated bookings of $1.029 billion and a book-to-bill ratio of 1.2 to 1.0 for the last twelve months ended September 25, 2022. Backlog on September 25, 2022 was $1.07 billion, as compared to $1.05 billion at June 26, 2022, and Kratos’ bid and proposal pipeline was $9.9 billion at September 25, 2022, as compared to $9.9 billion at June 26, 2022. Backlog at September 25, 2022 was comprised of funded backlog of $696.1 million and unfunded backlog of $372.8 million.
Eric DeMarco, Kratos’ President and CEO, said, “In the third quarter, Kratos successfully executed on what we can control in a continued and increasingly difficult operating environment, including a 1.1 to 1.0 book to bill ratio and the recent MACH-TB Hypersonic program award with our partner Dynetics, which could be significant related to Kratos’ Zeus launch systems and Erinyes vehicles. Expected upcoming awards for Kratos include an additional new hypersonic related program award, two new Valkyrie related tactical drone system awards from two new customers for multiple aircraft and a large OpenSpace virtualized satellite system program award.”
Mr. DeMarco continued, “Since our last report to you, we were informed that certain Kratos satellite program related software deliverables expected to be acquired by an existing government customer have been delayed to a future period and we were informed by a customer that funding is no longer available for the continuation of a certain, non-Valkyrie related drone program we have been working on, both which were previously forecast as significant contributors to our fourth quarter 2022 financial forecast. We have also determined that as a result of the continuing incredibly tight labor market for qualified machinists and skilled production personnel, including those with security clearances, that we will not achieve by this fiscal year end our previous forecast net increase headcount target to execute on our backlog and maintain our indirect rates. We have reflected the impact of each of these and other items, including inflation, supply chain, etc., in today’s third quarter financial report and our updated fiscal 2022 forecast.”
Mr. DeMarco concluded, “We have taken action to address these matters, including continuing to incorporate in our new proposals and contract awards cost and rate increases to address the inflationary environment, including specifically as related to higher labor rates and we have adjusted the organization in certain areas to address customer related delays, funding and other issues. By taking these actions now, having a 1.2 to 1.0 LTM book to bill ratio with multiple large, new programs ramping and maintaining a record combined backlog and opportunity pipeline, we continue to forecast future growth for the Company, including base case full year 2023 over 2022 10 percent revenue growth and increased margins, with potential accelerated growth opportunities in the tactical drone, space, satellite, rocket and hypersonic system areas.”
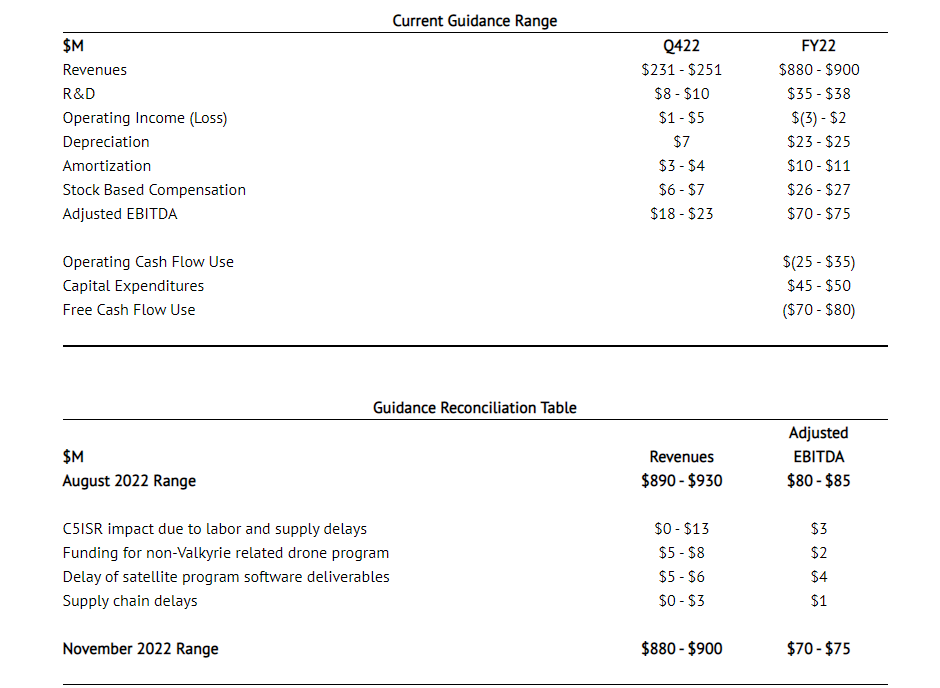
Financial Guidance Our fourth quarter and Fiscal Year 2022 financial guidance we are providing today includes our current forecasted business mix, and our assumptions, including as related to: employee sourcing, hiring and retention; manufacturing, production and supply chain disruptions; and parts shortages and related continued significant cost and price increases, including for employees, materials and components that are impacting the industry and Kratos. The range of our expected fourth quarter 2022 revenues includes assumptions of forecasted execution including the number of new qualified personnel expected to be retained to execute on our programs and contracts, as well as expected contract awards. Our revised Fiscal Year 2022 cash flow guidance also includes continued advanced purchases of inventory in an attempt to mitigate supply chain disruptions, which are not currently expected to be converted to cash through the sales process until the second half of 2023.
On October 1, 2022, the U.S. Federal Government began operating under a Continuing Resolution Authorization (CRA) through at least December 16, 2022, with no Federal Fiscal 2023 Budget or DoD budget being in place. Under a CRA, federal spending and its composition is substantially held consistent with the previous year’s budget, with no new contract awards, no increased production or spending on existing programs and no transition from development to production contracts, or from low-rate initial production to full rate production being allowed, all of which may impact Kratos and our current fourth quarter and fiscal 2023 financial expectations. The longer a CRA period is extended, the greater the impact on the industry, our customers and Kratos.
Throughout the third and fourth quarter of 2022, our industry and Kratos continue to experience the effects of continuing supply chain disruptions and significant cost increases and inflation, including on our employees, consultants, subcontractors, vendors, suppliers, customers, etc., and an acute labor shortage of qualified personnel, including those requiring security clearances, to perform on programs and contracts.
We expect this difficult operating environment and its impact on the industry, our operations and our ability to forecast to continue for the foreseeable future. Following is our fourth quarter and revised full year 2022 guidance along with a reconciliation from our full year 2022 guidance provided in August 2022 to our current guidance range.
Management will discuss the Company’s third quarter 2022 financial results, as well as its fourth quarter and full year 2022 guidance on a conference call beginning at 2:00 p.m. Pacific (5:00 p.m. Eastern) today. The call will be available at www.kratosdefense.com. Participants may register for the call using this Online Form. Upon registration, all telephone participants will receive the dial-in number along with a unique PIN that can be used to access the call. For those who cannot access the live broadcast, a replay will be available on Kratos’ website.
About Kratos Defense & Security Solutions Kratos Defense & Security Solutions, Inc. (NASDAQ:KTOS) develops and fields transformative, affordable technology, platforms, and systems for United States National Security related customers, allies, and commercial enterprises. Kratos is changing the way breakthrough technologies for these industries are rapidly brought to market through proven commercial and venture capital backed approaches, including proactive research, and streamlined development processes. At Kratos, affordability is a technology, and we specialize in unmanned systems, satellite communications, cyber security/warfare, microwave electronics, missile defense, hypersonic systems, training and combat systems and next generation turbo jet and turbo fan engine development. For more information go to www.kratosdefense.com.
Notice RegardingForward-LookingStatements This news release contains certain forward-looking statements that involve risks and uncertainties, including, without limitation, express or implied statements concerning the Company’s expectations regarding its future financial performance, including the Company’s expectations for its fourth quarter and full year 2022 revenues, R&D, operating income, depreciation, amortization, stock based compensation expense, and Adjusted EBITDA, and full year 2022 operating cash flow, capital expenditures and other investments, and free cash flow use, the Company’s future growth trajectory and ability to achieve improved revenue mix and profit in certain of its business segments and the expected timing of such improved revenue mix and profit, the Company’s expectation of ramp on projects and that investments in its business will result in an increase in the Company’s market share and total addressable market and position the Company for significant future organic growth, profitability, cash flow and an increase in shareholder value, the Company’s bid and proposal pipeline, demand for its products and services, including the Company’s alignment with today’s National Security requirements, ability to successfully compete and expected new customer awards, including the magnitude and timing of funding and the future opportunity associated with such awards, including in the tactical drone and satellite communication areas, performance of key contracts and programs, including the timing of production and demonstration related to certain of the Company’s contracts and product offerings, the impact of the Company’s restructuring efforts and cost reduction measures, including its ability to improve profitability and cash flow in certain business units as a result of these actions and to achieve financial leverage on fixed administrative costs, benefits to be realized from the Company’s net operating loss carry forwards, the availability and timing of government funding for the Company’s offerings, including the strength of the future funding environment, the short-term delays that may occur as a result of Continuing Resolutions or delays in DoD budget approvals, timing of LRIP and full rate production related to the Company’s unmanned aerial target system offerings, as well as the level of recurring revenues expected to be generated by these programs once they achieve full rate production, market and industry developments, and the current estimated impact of COVID-19 and employee absenteeism, supply chain disruptions, availability of an experienced skilled workforce, inflation and increased costs, and delays on our financial projections, industry, business and operations, including projected growth. Such statements are only predictions, and the Company’s actual results may differ materially from the results expressed or implied by these statements. Investors are cautioned not to place undue reliance on any such forward-looking statements. All such forward-looking statements speak only as of the date they are made, and the Company undertakes no obligation to update or revise these statements, whether as a result of new information, future events or otherwise. Factors that may cause the Company’s results to differ include, but are not limited to: risks to our business and financial results related to the reductions and other spending constraints imposed on the U.S. Government and our other customers, including as a result of sequestration and extended continuing resolutions, the Federal budget deficit and Federal government shut-downs; risks of adverse regulatory action or litigation; risks associated with debt leverage and cost savings and cash flow improvements expected as a result of the refinancing of our Senior Notes; risks that our cost-cutting initiatives will not provide the anticipated benefits; risks that changes, cutbacks or delays in spending by the U.S. DoD may occur, which could cause delays or cancellations of key government contracts; risks of delays to or the cancellation of our projects as a result of protest actions submitted by our competitors; risks that changes may occur in Federal government (or other applicable) procurement laws, regulations, policies and budgets; risks of the availability of government funding for the Company’s products and services due to performance, cost growth, or other factors, changes in government and customer priorities and requirements (including cost-cutting initiatives, the potential deferral of awards, terminations or reduction of expenditures to respond to the priorities of Congress and the Administration, or budgetary cuts resulting from Congressional committee recommendations or automatic sequestration under the Budget Control Act of 2011, as amended); risks that the UAS and UGS markets do not experience significant growth; risks that products we have developed or will develop will become programs of record; risks that we cannot expand our customer base or that our products do not achieve broad acceptance which could impact our ability to achieve our anticipated level of growth; risks of increases in the Federal government initiatives related to in-sourcing; risks related to security breaches, including cyber security attacks and threats or other significant disruptions of our information systems, facilities and infrastructures; risks related to our compliance with applicable contracting and procurement laws, regulations and standards; risks related to the new DoD Cybersecurity Maturity Model Certification (CMMC); risks relating to the ongoing conflict in Ukraine; risks related to contract performance; risks related to failure of our products or services; risks associated with our subcontractors’ or suppliers’ failure to perform their contractual obligations, including the appearance of counterfeit or corrupt parts in our products; changes in the competitive environment (including as a result of bid protests); failure to successfully integrate acquired operations and competition in the marketplace, which could reduce revenues and profit margins; risks that potential future goodwill impairments will adversely affect our operating results; risks that anticipated tax benefits will not be realized in accordance with our expectations; risks that a change in ownership of our stock could cause further limitation to the future utilization of our net operating losses; risks that we may be required to record valuation allowances on our net operating losses which could adversely impact our profitability and financial condition; risks that the current economic environment will adversely impact our business, including with respect to our ability to recruit and retain sufficient numbers of qualified personnel to execute on our programs and contracts, as well as expected contract awards and risks related to increasing interest rates; currently unforeseen risks associated with COVID-19 and risks related to natural disasters or severe weather. These and other risk factors are more fully discussed in the Company’s Annual Report on Form 10-K for the period ended December 26, 2021, and in our other filings made with the Securities and Exchange Commission.
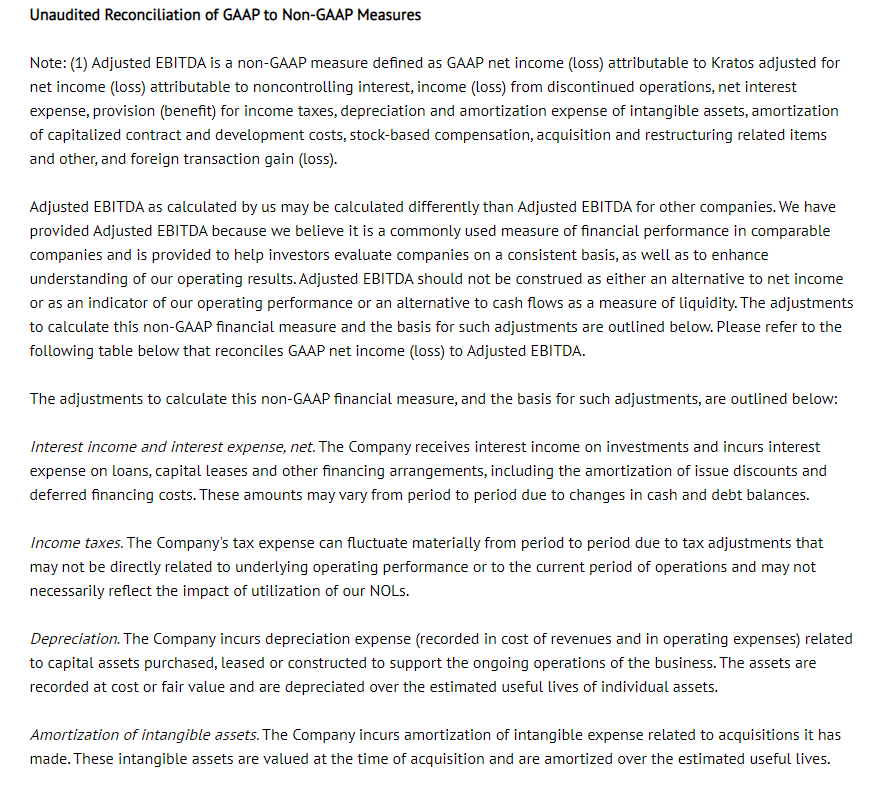
Note Regarding Use of Non-GAAP Financial Measures and Other Performance Metrics
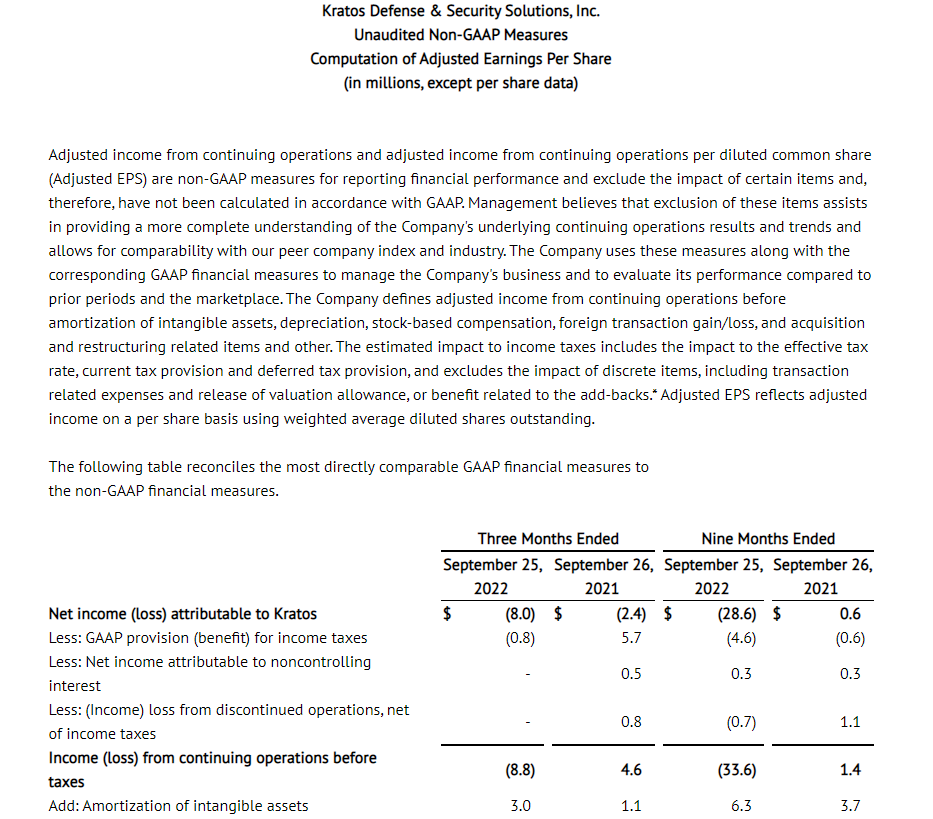
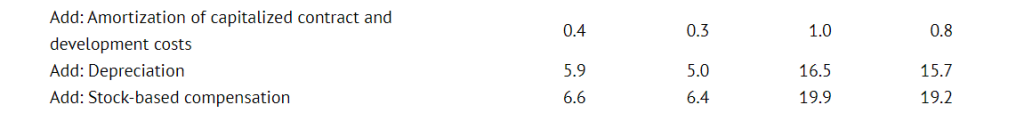
This news release contains non-GAAP financial measures, including Adjusted earnings per share (computed using income from continuing operations before income taxes, excluding income (loss) from discontinued operations, excluding income (loss) attributable to non-controlling interest, excluding depreciation, amortization of intangible assets, amortization of capitalized contract and development costs, stock-based compensation expense, acquisition and restructuring related items and other, which includes, but is not limited to, legal related items, non-recoverable rates and costs, and foreign transaction gains and losses, less the estimated impact to income taxes) and including Adjusted EBITDA (which includes net income (loss) attributable to noncontrolling interest and excludes, among other things, losses and gains from discontinued operations, acquisition and restructuring related items, stock compensation expense, foreign transaction gains and losses, and the associated margin rates). Additional non-GAAP financial measures include Free Cash Flow from Operations computed as Cash Flow from Operations less Capital Expenditures and Adjusted EBITDA related to our KUS and KGS businesses. Kratos believes this information is useful to investors because it provides a basis for measuring the Company’s available capital resources, the actual and forecasted operating performance of the Company’s business and the Company’s cash flow, excluding non-recurring items and non-cash items that would normally be included in the most directly comparable measures calculated and presented in accordance with GAAP. The Company’s management uses these non-GAAP financial measures, along with the most directly comparable GAAP financial measures, in evaluating the Company’s actual and forecasted operating performance, capital resources and cash flow. Non-GAAP financial measures should not be considered in isolation from, or as a substitute for, financial information presented in compliance with GAAP, and investors should carefully evaluate the Company’s financial results calculated in accordance with GAAP and reconciliations to those financial results. In addition, non-GAAP financial measures as reported by the Company may not be comparable to similarly titled amounts reported by other companies. As appropriate, the most directly comparable GAAP financial measures and information reconciling these non-GAAP financial measures to the Company’s financial results prepared in accordance with GAAP are included in this news release.
Another Performance Metric the Company believes is a key performance indicator in our industry is our Book to Bill Ratio as it provides investors with a measure of the amount of bookings or contract awards as compared to the amount of revenues that have been recorded during the period and provides an indicator of how much of the Company’s backlog is being burned or utilized in a certain period. The Book to Bill Ratio is computed as the number of bookings or contract awards in the period divided by the revenues recorded for the same period. The Company believes that the rolling or last twelve months’ Book to Bill Ratio is meaningful since the timing of quarter-to-quarter bookings can vary.
*The impact to income taxes is calculated by recasting income before income taxes to include the add-backs involved in determining Adjusted income from continuing operations before income taxes and recalculating the income tax provision (benefit), including current and deferred income taxes, using the Adjusted income from continuing operations before income taxes. The recalculation also adjusts for any discrete tax expense, including transaction related expenses and the release of valuation allowance, or benefit related to the add-backs.
CARLSBAD, Calif.–(BUSINESS WIRE)–Nov. 3, 2022– Lineage Cell Therapeutics, Inc. (NYSE American and TASE: LCTX), a clinical-stage biotechnology company developing allogeneic cell therapies for unmet medical needs, today announced that it will report its third quarter 2022 financial and operating results on Thursday, November 10, 2022, following the close of the U.S. financial markets. Lineage management will also host a conference call and webcast on Thursday, November 10, 2022, at 4:30 p.m. Eastern Time/1:30 p.m. Pacific Time to discuss its third quarter 2022 financial and operating results and to provide a business update.
Interested parties may access the conference call by dialing (800) 715-9871 from the U.S. and Canada and should request the “Lineage Cell Therapeutics Call” or provide conference ID number5262180. A live webcast of the conference call will be available online in the Investors section of Lineage’s website. A replay of the webcast will be available on Lineage’s website for 30 days and a telephone replay will be available through November 17, 2022, by dialing (800) 770-2030 from the U.S. and Canada and entering conference ID number 5262180.
About Lineage Cell Therapeutics, Inc.
Lineage Cell Therapeutics is a clinical-stage biotechnology company developing novel cell therapies for unmet medical needs. Lineage’s programs are based on its robust proprietary cell-based therapy platform and associated in-house development and manufacturing capabilities. With this platform Lineage develops and manufactures specialized, terminally differentiated human cells from its pluripotent and progenitor cell starting materials. These differentiated cells are developed to either replace or support cells that are dysfunctional or absent due to degenerative disease or traumatic injury or administered as a means of helping the body mount an effective immune response to cancer. Lineage’s clinical and preclinical programs are in markets with billion dollar opportunities and include five allogeneic (“off-the-shelf”) product candidates: (i) OpRegen, a retinal pigment epithelial cell therapy in development for the treatment of geographic atrophy secondary to age-related macular degeneration, is being developed under a worldwide collaboration with Roche and Genentech, a member of the Roche Group; (ii) OPC1, an oligodendrocyte progenitor cell therapy in Phase 1/2a development for the treatment of acute spinal cord injuries; (iii) VAC2, a dendritic cell therapy produced from Lineage’s VAC technology platform for immuno-oncology and infectious disease, currently in Phase 1 clinical development for the treatment of non-small cell lung cancer; (iv) ANP1, an auditory neuronal progenitor cell therapy for the potential treatment of auditory neuropathy; and (v) PNC1, a photoreceptor neural cell therapy for the potential treatment of vision loss due to photoreceptor dysfunction or damage. For more information, please visit www.lineagecell.com or follow the company on Twitter @LineageCell.
TORONTO–(BUSINESS WIRE)– Sierra Metals Inc. (TSX: SMT) (BVL or Bolsa de Valores de Lima: SMT) (NYSE AMERICAN: SMTS) (“Sierra Metals” or “the Company”) announces the filing at the BVL by its subsidiary, Sociedad Minera Corona S.A. (“Corona”) of its unaudited Financial Statements and the Management’s Discussion and Analysis (“MD&A”) for the third quarter of 2022 (“Q3 2022”).
The Company holds an 81.8% interest in Corona. The unaudited Financial Statements and MD&A can be viewed at:
To search for the Company’s financial statements, enter the following parameters in the empty fields:
Empresa: Sociedad Minera Corona S.A. Periodo: 2022 and Trimestre III
Sierra Metals will be releasing its Q3 2022 consolidated financial statements on Monday November 14th, 2022, with an investor conference call taking place on Tuesday November 15th, 2022.
About Sierra Metals
Sierra Metals Inc. is a diversified Canadian mining company with Green Metal exposure including copper production and base metal production with precious metals byproduct credits, focused on the production and development of its Yauricocha Mine in Peru, and Bolivar and Cusi Mines in Mexico. The Company is focused on increasing production volume and growing mineral resources. The Company has large land packages at all three mines with several prospective regional targets providing longer-term exploration upside and mineral resource growth potential.
The Company’s Common Shares trade on the Toronto Stock ESxchange and the Bolsa de Valores de Lima under the symbol “SMT” and on the NYSE American Exchange under the symbol “SMTS”.
For further information regarding Sierra Metals, please visit www.sierrametals.com.
This press release contains forward-looking information within the meaning of Canadian and United States securities legislation. Forward-looking information relates to future events or the anticipated performance of Sierra and reflect management’s expectations or beliefs regarding such future events and anticipated performance based on an assumed set of economic conditions and courses of action. In certain cases, statements that contain forward-looking information can be identified by the use of words such as “plans”, “expects”, “is expected”, “budget”, “scheduled”, “estimates”, “forecasts”, “intends”, “anticipates”, “believes” or variations of such words and phrases or statements that certain actions, events or results “may”, “could”, “would”, “might”, or “will be taken”, “occur” or “be achieved” or the negative of these words or comparable terminology. By its very nature forward-looking information involves known and unknown risks, uncertainties and other factors that may cause actual performance of Sierra to be materially different from any anticipated performance expressed or implied by such forward-looking information.
Forward-looking information is subject to a variety of risks and uncertainties, which could cause actual events or results to differ from those reflected in the forward-looking information, including, without limitation, the risks described under the heading “Risk Factors” in the Company’s annual information form dated March 16, 2022 for its fiscal year ended December 31, 2021 and other risks identified in the Company’s filings with Canadian securities regulators and the United States Securities and Exchange Commission, which filings are available at www.sedar.com and www.sec.gov, respectively.
The risk factors referred to above are not an exhaustive list of the factors that may affect any of the Company’s forward-looking information. Forward-looking information includes statements about the future and is inherently uncertain, and the Company’s actual achievements or other future events or conditions may differ materially from those reflected in the forward-looking information due to a variety of risks, uncertainties and other factors. The Company’s statements containing forward-looking information are based on the beliefs, expectations, and opinions of management on the date the statements are made, and the Company does not assume any obligation to update such forward-looking information if circumstances or management’s beliefs, expectations or opinions should change, other than as required by applicable law. For the reasons set forth above, one should not place undue reliance on forward-looking information.
Expects Fiscal 2023 Adjusted EBITDA1 to be in a range of $75 million to $80 million
Expects to Generate Free Cash Flow1 in Excess of $75 million in Fiscal Year 2023; Representing a More Than $135 Million Improvement as Compared to the Prior Year
(1 Refer to “Definitions of Non-GAAP Financial Measures” and the tables attached at the end of this press release for reconciliation of non-GAAP results to applicable GAAP results.)
JERICHO, N.Y.–(BUSINESS WIRE)– 1-800-FLOWERS.COM, Inc. (NASDAQ: FLWS), a leading provider of gifts designed to help inspire customers to give more, connect more, and build more and better relationships, today reported results for its Fiscal 2023 first quarter ended October 2, 2022.
Fiscal 2023 First Quarter Highlights
Total consolidated revenues decreased 1.9% to $303.6 million, compared with total consolidated revenues of $309.4 million in the prior year period.
Gross profit margin for the quarter was 33.4%, compared with 40.6% in the prior year period.
Operating expenses were 47.0% of total sales, as compared with 47.1% in the prior year period.
Net loss for the quarter was $33.7 million, or $(0.52) per share, compared with a net loss of $13.2 million, or $(0.20) per share in the prior year period.
Adjusted EBITDA loss1 for the quarter was $28.0 million, as compared to an Adjusted EBITDA loss1 of $5.3 million in the prior year period.
Chris McCann, CEO of 1-800-FLOWERS.COM, Inc., said, “Our first quarter results were slightly better than our expectations, benefitting from the strength in our Gourmet Foods and Gift Baskets business. During the quarter, we saw consumers purchasing fewer everyday gifts as they responded to the significant macro-inflationary pressures affecting their discretionary spending. However, as we look out to the holiday season and the balance of our fiscal year, we are cautiously optimistic that consumers will spend during the major gift giving holiday occasions, while we anticipate they will remain guarded on their spending otherwise.”
“Coming into Fiscal 2023, we expected a challenging macroeconomic backdrop to affect our performance during the first quarter. However, we expect to see a stabilization of our business during our second quarter and improvement during the second half of our fiscal year, as we cycle against the sharp inflationary period of a year ago. After growing revenues 77% since Fiscal 2019, we anticipate revenues to decline slightly in Fiscal 2023. The impact of this revenue decline on our earnings is partially mitigated by our initiatives to operate more efficiently, coupled with the decline that we are seeing in ocean freight costs. We expect the reduction of these costs to begin to provide a margin benefit in the second half of this fiscal year, and even more so next year.”
McCann added, “As a result of our decision to increase inventories of non-perishable items last fiscal year and the actions that we have taken over the last few years to operate more efficiently, we expect to generate more than $75 million in Free Cash Flow1 in Fiscal 2023. This represents an improvement of more than $135 million compared with last year.”
First Quarter 2023 Financial Results
Total consolidated revenues decreased 1.9% to $303.6 million, compared with total consolidated revenues of $309.4 million in the prior year period. Excluding contributions from Vital Choice® and Alice’s Table®, which were acquired in October 2021 and December 2021, respectively, total revenue for the quarter declined 3.6%, compared with the prior year period.
Gross profit margin for the quarter was 33.4%, a decline of 720 basis points, compared with 40.6% in the prior year period, primarily reflecting significantly increased costs for labor, shipping and commodities in the current year period. Operating expenses were 47.0% of total sales, as compared with 47.1% in the prior year period, primarily reflecting lower marketing costs, as the Company shifted its advertising investments to lower cost, higher return on investment areas of the marketing funnel, partially offset by higher depreciation associated with the Company’s automation and technology projects.
As a result, the Adjusted EBITDA loss1 was $28.0 million, as compared to an Adjusted EBITDA loss1 of $5.3 million in the prior year period. Net loss for the quarter was $33.7 million, or $(0.52) per share, compared with a net loss of $13.2 million, or $(0.20) per share, and an Adjusted Net Loss1 of $12.9 million, or $(0.20) per share, in the prior year period.
Segment Results:
The Company provides selected financial results for its Gourmet Foods and Gift Baskets, Consumer Floral and Gifts, and BloomNet segments in the tables attached to this release and as follows:
Gourmet Foods and Gift Baskets: Revenues for the quarter increased 11.0% to $108.2 million, compared with $97.5 million in the prior year period, reflecting the contributions of Vital Choice and improved wholesale product demand. Gross profit margin was 23.2%, compared with 35.0% in the prior year period, primarily reflecting increased commodities and transportation costs, as well as product mix reflecting the sharp sales increase in the lower-margin wholesale channel. As a result, segment contribution margin1 was a loss of $18.7 million, compared with a loss of $7.7 million a year ago.
Consumer Floral and Gifts: Revenues decreased 10.5% to $162.2 million, compared with $181.2 million in the prior year period. Gross profit margin decreased to 38.2%, compared with 41.9% in the prior year period, primarily due to increased transportation and commodity costs. Segment contribution margin1 was $10.8 million, compared with $19.2 million the prior year.
BloomNet: Revenues for the quarter increased 8.2% to $33.4 million, compared with $30.8 million in the prior year period. Gross profit margin decreased to 43.4%, compared with 50.0% in the prior year period, primarily due to product mix and higher shipping costs. Segment contribution margin1 was $9.5 million, compared with $10.9 million in the prior year period.
Company Guidance
The Company is providing the following guidance for Fiscal 2023. While the highly unpredictable nature of the current macro economy makes it difficult to forecast in this environment, the Company anticipates that after growing revenues 77% over the past two fiscal years, revenues will decline slightly in Fiscal 2023 on lower consumer confidence and cautious spending behavior. The Company anticipates that the combination of the investments it has made – and continues to make – in its business platform, along with strategic pricing programs and moderation of cost inputs, will enable it to gradually improve gross margins and bottom-line results during the latter half of the current fiscal year. Additionally, this guidance assumes the restoration of 100% bonus payout in Fiscal 2023, compared with a limited bonus payout in Fiscal 2022.
Full Year Fiscal 2023 Guidance
Total revenues to decline in the mid-single digit range on a percentage basis as compared with the prior year;
Adjusted EBITDA1 to be in a range of $75 million to $80 million; and
Free Cash Flow1 to exceed $75 million.
Conference Call:
The Company will conduct a conference call to discuss the above details and attached financial results today, Thursday, November 3, at 8:00 a.m. (ET). The conference call will be webcast from the Investors section of the Company’s website at www.1800flowersinc.com. A recording of the call will be posted on the Investors section of the Company’s website within two hours of the call’s completion. A telephonic replay of the call can be accessed beginning at 2:00 p.m. (ET) today, through November 10, 2022, at: (US) 1-877-344-7529; (Canada) 855-669-9658; (International) 1-412-317-0088; enter conference ID #: 5253715. If you have any questions regarding the above information, please contact the Investor Relations office at invest@1800flowers.com.
Definitions of non-GAAP Financial Measures:
We sometimes use financial measures derived from consolidated financial information, but not presented in our financial statements prepared in accordance with U.S. generally accepted accounting principles (“GAAP”). Certain of these are considered “non-GAAP financial measures” under the U.S. Securities and Exchange Commission rules. Non-GAAP financial measures referred to in this document are either labeled as “non-GAAP” or designated as such with a “1”. See below for definitions and the reasons why we use these non-GAAP financial measures. Where applicable, see the Selected Financial Information below for reconciliations of these non-GAAP measures to their most directly comparable GAAP financial measures. Reconciliations for forward-looking figures would require unreasonable efforts at this time because of the uncertainty and variability of the nature and amount of certain components of various necessary GAAP components, including, for example, those related to compensation, tax items, amortization or others that may arise during the year, and the Company’s management believes such reconciliations would imply a degree of precision that would be confusing or misleading to investors. For the same reasons, the Company is unable to address the probable significance of the unavailable information. The lack of such reconciling information should be considered when assessing the impact of such disclosures.
EBITDA and Adjusted EBITDA
We define EBITDA as net income (loss) before interest, taxes, depreciation, and amortization. Adjusted EBITDA is defined as EBITDA adjusted for the impact of stock-based compensation, Non-Qualified Plan Investment appreciation/depreciation, and for certain items affecting period-to-period comparability. See Selected Financial Information for details on how EBITDA and Adjusted EBITDA were calculated for each period presented. The Company presents EBITDA and Adjusted EBITDA because it considers such information meaningful supplemental measures of its performance and believes such information is frequently used by the investment community in the evaluation of similarly situated companies. The Company uses EBITDA and Adjusted EBITDA as factors to determine the total amount of incentive compensation available to be awarded to executive officers and other employees. The Company’s credit agreement uses EBITDA and Adjusted EBITDA to determine its interest rate and to measure compliance with certain covenants. EBITDA and Adjusted EBITDA are also used by the Company to evaluate and price potential acquisition candidates. EBITDA and Adjusted EBITDA have limitations as analytical tools and should not be considered in isolation or as a substitute for analysis of the Company’s results as reported under GAAP. Some of the limitations are: (a) EBITDA and Adjusted EBITDA do not reflect changes in, or cash requirements for, the Company’s working capital needs; (b) EBITDA and Adjusted EBITDA do not reflect the significant interest expense, or the cash requirements necessary to service interest or principal payments, on the Company’s debts; and (c) although depreciation and amortization are non-cash charges, the assets being depreciated and amortized may have to be replaced in the future and EBITDA does not reflect any cash requirements for such capital expenditures. EBITDA and Adjusted EBITDA should only be used on a supplemental basis combined with GAAP results when evaluating the Company’s performance.
Segment Contribution Margin
We define Segment Contribution Margin as earnings before interest, taxes, depreciation, and amortization, before the allocation of corporate overhead expenses. See Selected Financial Information for details on how Segment Contribution Margin was calculated for each period presented. When viewed together with our GAAP results, we believe Segment Contribution Margin provides management and users of the financial statements meaningful information about the performance of our business segments. Segment Contribution Margin is used in addition to and in conjunction with results presented in accordance with GAAP and should not be relied upon to the exclusion of GAAP financial measures. The material limitation associated with the use of Segment Contribution Margin is that it is an incomplete measure of profitability as it does not include all operating expenses or non-operating income and expenses. Management compensates for these limitations when using this measure by looking at other GAAP measures, such as Operating Income and Net Income.
Adjusted Net Income (Loss) and Adjusted or Comparable Net Income (Loss) Per Common Share:
We define Adjusted Net Income (Loss) and Adjusted or Comparable Net Income (Loss) Per Common Share as Net Income (Loss) and Net Income (Loss) Per Common Share adjusted for certain items affecting period-to-period comparability. See Selected Financial Information below for details on how Adjusted Net Income (Loss) Per Common Share and Adjusted or Comparable Net Income (Loss) Per Common Share were calculated for each period presented. We believe that Adjusted Net Income (Loss) and Adjusted or Comparable Net Income (Loss) Per Common Share are meaningful measures because they increase the comparability of period-to-period results. Since these are not measures of performance calculated in accordance with GAAP, they should not be considered in isolation of, or as a substitute for, GAAP Net Income (Loss) and Net Income (Loss) Per Common share, as indicators of operating performance and they may not be comparable to similarly titled measures employed by other companies.
Free Cash Flow:
We define Free Cash Flow as net cash provided by operating activities less capital expenditures. The Company considers Free Cash Flow to be a liquidity measure that provides useful information to management and investors about the amount of cash generated by the business after the purchases of fixed assets, which can then be used to, among other things, invest in the Company’s business, make strategic acquisitions, strengthen the balance sheet, and repurchase stock or retire debt. Free Cash Flow is a liquidity measure that is frequently used by the investment community in the evaluation of similarly situated companies. Since Free Cash Flow is not a measure of performance calculated in accordance with GAAP, it should not be considered in isolation or as a substitute for analysis of the Company’s results as reported under GAAP. A limitation of the utility of Free Cash Flow as a measure of financial performance is that it does not represent the total increase or decrease in the Company’s cash balance for the period.
1-800-FLOWERS.COM, Inc. is a leading provider of gifts designed to help inspire customers to give more, connect more, and build more and better relationships. The Company’s e-commerce business platform features an all-star family of brands, including: 1-800-Flowers.com®, 1-800-Baskets.com®, Cheryl’s Cookies®, Harry & David®, PersonalizationMall.com®, Shari’s Berries®, FruitBouquets.com®, Moose Munch®, The Popcorn Factory®, Wolferman’s Bakery®, Vital Choice®, Stock Yards® and Simply Chocolate®. Through the Celebrations Passport® loyalty program, which provides members with free standard shipping and no service charge across our portfolio of brands, 1-800-FLOWERS.COM, Inc. strives to deepen relationships with customers. The Company also operates BloomNet®, an international floral and gift industry service provider offering a broad-range of products and services designed to help members grow their businesses profitably; Napco℠, a resource for floral gifts and seasonal décor; DesignPac Gifts, LLC, a manufacturer of gift baskets and towers; and Alice’s Table®, a lifestyle business offering fully digital livestreaming and on demand floral, culinary and other experiences to guests across the country. 1-800-FLOWERS.COM, Inc. was recognized among the top 5 on the National Retail Federation’s 2021 Hot 25 Retailers list, which ranks the nation’s fastest-growing retail companies, and was named to the Fortune 1000 list in 2022. Shares in 1-800-FLOWERS.COM, Inc. are traded on the NASDAQ Global Select Market, ticker symbol: FLWS. For more information, visit 1800flowersinc.com or follow @1800FLOWERSInc on Twitter.
FLWS–COMP FLWS-FN
Special Note Regarding Forward Looking Statements:
This press release contains forward-looking statements within the meaning of the Private Securities Litigation Reform Act of 1995. These forward-looking statements represent the Company’s current expectations or beliefs concerning future events and can generally be identified using statements that include words such as “estimate,” “expects,” “project,” “believe,” “anticipate,” “intend,” “plan,” “foresee,” “forecast,” “likely,” “will,” “target” or similar words or phrases. These forward-looking statements are subject to risks, uncertainties, and other factors, many of which are outside of the Company’s control, which could cause actual results to differ materially from the results expressed or implied in the forward-looking statements, including, but not limited to, statements regarding the Company’s ability to achieve its guidance for full year Fiscal 2023; the impact of the Covid-19 pandemic on the Company; its ability to leverage its operating platform and reduce its operating expense ratio; its ability to sell through existing inventories; its ability to successfully integrate acquired businesses and assets; its ability to successfully execute its strategic initiatives; its ability to cost effectively acquire and retain customers; the outcome of contingencies, including legal proceedings in the normal course of business; its ability to compete against existing and new competitors; its ability to manage expenses associated with sales and marketing and necessary general and administrative and technology investments; its ability to reduce promotional activities and achieve more efficient marketing programs; and general consumer sentiment and industry and economic conditions that may affect levels of discretionary customer purchases of the Company’s products. The Company undertakes no obligation to publicly update any of the forward-looking statements, whether because of new information, future events or otherwise, made in this release or in any of its SEC filings. Consequently, you should not consider any such list to be a complete set of all potential risks and uncertainties. For a more detailed description of these and other risk factors, refer to the Company’s SEC filings, including the Company’s Annual Reports on Form 10-K and its Quarterly Reports on Form 10-Q.
Note: The following tables are an integral part of this press release without which the information presented in this press release should be considered incomplete.
(a) Segment performance is measured based on segment contribution margin or segment Adjusted EBITDA, reflecting only the direct controllable revenue and operating expenses of the segments, both of which are non-GAAP measurements. As such, management’s measure of profitability for these segments does not include the effect of corporate overhead, described above, depreciation and amortization, other income (net), and other items that we do not consider indicative of our core operating performance.
(b) Corporate expenses consist of the Company’s enterprise shared service cost centers, and include, among other items, Information Technology, Human Resources, Accounting and Finance, Legal, Executive and Customer Service Center functions, as well as Stock-Based Compensation. In order to leverage the Company’s infrastructure, these functions are operated under a centralized management platform, providing support services throughout the organization. The costs of these functions, other than those of the Customer Service Center, which are allocated directly to the above categories based upon usage, are included within corporate expenses as they are not directly allocable to a specific segment.