Release – The ODP Corporation Announces Second Quarter 2024 Results

Research News and Market Data on ODP

Second Quarter Revenue of $1.7 Billion with GAAP EPS of $(0.12); Adjusted EPS of $0.56

Progress on Project Core to Drive Future Cost Savings and Implementing Growth Initiatives

Company Repurchased $191 Million of Shares Year to Date

Company Provides Update on Varis Sale Process

BOCA RATON, Fla.–(BUSINESS WIRE)–Aug. 7, 2024– The ODP Corporation (“ODP,” or the “Company”) (NASDAQ:ODP), a leading provider of products, services, and technology solutions to businesses and consumers, today announced results for the second quarter ended June 29, 2024.

Second Quarter 2024 Summary(1)(2)(3)

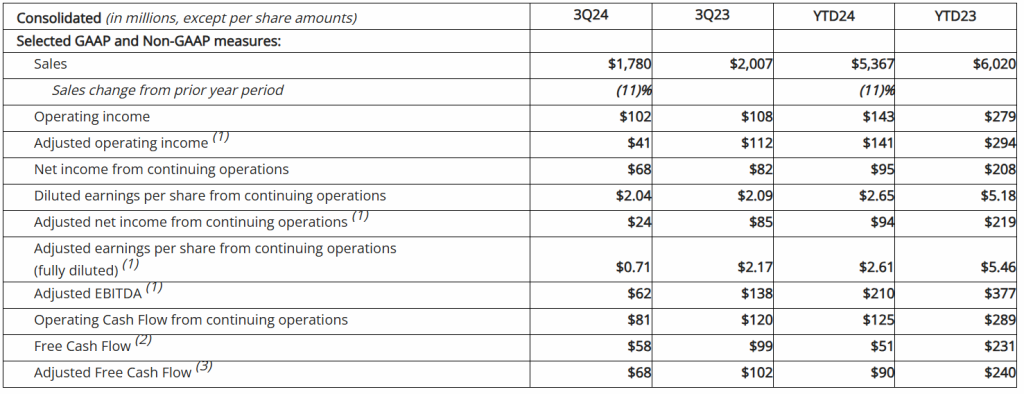
  • Total reported sales of $1.7 billion, down 10% versus the prior year on a reported basis. The decrease in reported sales is largely related to lower sales in its Office Depot Division, primarily due to 58 fewer retail locations in service compared to the previous year and reduced transactions, as well as lower sales in its ODP Business Solutions Division
  • GAAP operating income of approximately $400 thousand and net income (loss) from continuing operations of $(4) million, or $(0.12) per diluted share, versus $60 million and $43 million, respectively, or $1.09 per diluted share, in the prior year period
  • Adjusted operating income of $33 million, compared to $67 million in the second quarter of 2023; adjusted EBITDA of $57 million, compared to $95 million in the second quarter of 2023
  • Adjusted net income from continuing operations of $20 million, or adjusted diluted earnings per share from continuing operations of $0.56, versus $48 million or $1.22, respectively, in the prior year period
  • Operating cash flow from continuing operations of $(1) million and adjusted free cash flow of $5 million, versus $(8) million and $(24) million, respectively, in the prior year period
  • Repurchased nearly 2.4 million shares at a cost of $104 million in the second quarter of 2024; Repurchased a total of approximately $141 million of shares when including purchases made in the second quarter and post quarter through the current date
  • $831 million of total available liquidity including $190 million in cash and cash equivalents, of which $10 million is presented in Current assets held for sale related to the Varis Division, at quarter end

“We are executing Project Core while taking actions to improve top-line trends in both our B2B and B2C businesses,” said Gerry Smith, chief executive officer of The ODP Corporation. “Our performance in the quarter was below our expectations, impacted by more cautious business spending and weaker consumer activity, along with new customer onboarding challenges impacting revenue traction at ODP Business Solutions. Additionally, retail store traffic trends, while improving sequentially, remained sluggish. Although market challenges impacted Office Depot and ODP Business Solutions, we continued to see progress in Veyer, as they executed across their growth strategies, attracting new third-party customers and improving their external EBITDA. Furthermore, we continued to buy back our shares, returning over $100 million of our stock in the quarter and over $190 million year to date,” he added.

“While we are pacing below our prior expectations for the year, we are not standing still. We’re taking actions to improve our top-line trajectory and we remain focused on capturing the long-term opportunities derived by our strong value proposition, solid balance sheet, and flexible foundation. In addition to our efforts under Project Core, which we expect will create over $100 million in annual cost savings when fully implemented, we are executing on initiatives to accelerate sales pipeline conversion, drive additional avenues for growth with existing customers, and leverage our deep customer relationships to solve more of their procurement challenges. This is what we call the Power of 1 – the ability to add value to our customers through offering one more product or suite of products to help them succeed. For example, we recently were awarded a sizeable order for standalone air conditioning units for a government entity — something not top of mind when you think of ODP Business Solutions, but it showcases the trust customers have in our capabilities to source, deliver, and solution during a time of need – all through the Power of 1. Additionally, we are set early for the upcoming back-to-school season and well positioned with our Education 365 approach, connecting customers within the education sector.”

“Although we are disappointed by our first half performance and outlook for the remainder of the year, we are committed to driving growth back into the business, remaining focused on converting the numerous opportunities in our pipeline, strengthening our position in the second half of the year and having impact in 2025 and beyond. We have several prospects at both ODP Business Solutions and Veyer that we expect to close in the second half that will boost revenue growth velocity as we exit this year. With these opportunities, coupled with our full realization of Project Core, we expect to exit 2024 with a stronger profile,” he continued.

“Despite the near term top-line challenges, we remain committed and encouraged about the future and confident in our operational excellence approach. Our team remains focused on executing the necessary steps to position us for long term growth and profitability,” Smith concluded.

Consolidated Results

Reported (GAAP) Results
Total reported sales for the second quarter of 2024 were $1.7 billion, a decrease of 10% compared with the same period last year, driven by lower sales in both its consumer and business-to-business (B2B) divisions. Lower sales in its consumer division, Office Depot, was primarily due to 58 fewer stores in service compared to last year related to planned store closures, as well as lower retail and online consumer traffic and transactions. Sales at ODP Business Solutions Division were lower compared to last year, largely driven by macroeconomic factors causing more cautious spending among business customers, as well as continued challenges related to the onboarding of new customers and fewer transactions. Meanwhile, Veyer provided strong logistics support for the ODP Business Solutions and Office Depot Divisions and continued to execute across its growth strategy, delivering supply chain and procurement solutions to new third-party customers and driving external EBITDA.

The Company reported GAAP operating income of approximately $400 thousand in the second quarter of 2024, down compared to GAAP operating income of $60 million in the prior year period. Operating results in the second quarter of 2024 included $33 million of charges, primarily related to $25 million in net merger and restructuring expenses and $8 million non-cash asset impairment primarily related to the operating lease right-of-use (ROU) assets associated with the Company’s retail store locations. Net loss from continuing operations was $4 million, or $(0.12) per diluted share in the second quarter of 2024, down compared to net income from continuing operations of $43 million, or $1.09 per diluted share in the second quarter of 2023.

Adjusted (non-GAAP) Results(1)
Adjusted results for the second quarter of 2024 exclude charges and credits totaling $33 million as described above and the associated tax impacts.

  • Second quarter 2024 adjusted EBITDA was $57 million compared to $95 million in the prior year period. This included depreciation and amortization of $24 million and $25 million in the second quarter of 2024 and 2023, respectively
  • Second quarter 2024 adjusted operating income was $33 million, down compared to $67 million in the second quarter of 2023
  • Second quarter 2024 adjusted net income from continuing operations was $20 million, or $0.56 per diluted share, compared to $48 million, or $1.22 per diluted share, in the second quarter of 2023, a decrease of 54% on a per share basis

Division Results

ODP Business Solutions Division
Leading B2B distribution solutions provider serving small, medium and enterprise level companies with an annual trailing-twelve-month revenue of nearly $4 billion.

  • Reported sales were $917 million in the second quarter of 2024, down 8% compared to the same period last year. The decrease in sales was related primarily to weaker macroeconomic conditions, more cautious business spending, new customer onboarding challenges, and lower sales conversion
  • Total adjacency category sales, including cleaning and breakroom, furniture, technology, and copy and print, were 43% of total ODP Business Solutions’ sales
  • Continued strong pipeline of potential new business and implementing several initiatives to regain top-line traction
  • Operating income was $29 million in the second quarter of 2024, down 36% compared to the same period last year on a reported basis. As a percentage of sales, operating income margin was 3%, down 140 basis points compared to the same period last year

Office Depot Division
Leading provider of retail consumer and small business products and services distributed via Office Depot and OfficeMax retail locations and an eCommerce presence.

  • Reported sales were $799 million in the second quarter of 2024, down 12% compared to the prior year on a reported basis. Lower sales were partially driven by 58 fewer retail outlets in service associated with planned store closures, as well as lower demand relative to last year in major product categories and lower online sales. The Company closed 9 retail stores in the quarter and had 894 stores at quarter end. Sales were down 7% on a comparable store basis
  • Store and online traffic were lower year over year due to macroeconomic factors causing sluggish consumer activity
  • Operating income was $17 million in the second quarter of 2024, compared to operating income of $35 million during the same period last year, driven primarily by the flow through impact from lower sales. As a percentage of sales, operating income was 2%, down 170 basis points compared to the same period last year

Veyer Division
Nationwide supply chain, distribution, procurement and global sourcing operation supporting Office Depot and ODP Business Solutions, as well as third-party customers. Veyer’s assets and capabilities include 8 million square feet of infrastructure through a network of distribution centers, cross-docks, and other facilities throughout the United States; a global sourcing presence in Asia; a large private fleet of vehicles; and next-day delivery to 98.5% of US population.

  • In the second quarter of 2024, Veyer provided support for its internal customers, ODP Business Solutions and Office Depot, as well as its third-party customers, generating sales of $1.2 billion
  • Operating income was $5 million in the second quarter of 2024, compared to $6 million in the prior year period driven by the flow through impact of lower sales to internal customers partially offset by the contribution related to services to external third-party customers
  • In the second quarter of 2024, sales generated from third-party customers were in-line with the same period last year and EBITDA generated from third-party customers increased by 17% year over year, resulting in sales of $10 million and EBITDA of $4 million

Share Repurchases

The Company continued to execute under its previously announced $1 billion share repurchase authorization valid through March 31, 2027. During the second quarter of 2024, the Company repurchased nearly 2.4 million shares at a cost of $104 million. Since the end of the second quarter of 2024, the Company repurchased additional shares for $37 million.

“Our capital allocation strategy balances investing in the future of our business while continuing to enhance value for shareholders through share repurchases under our buyback authorization,” stated Anthony Scaglione, executive vice president and chief financial officer of The ODP Corporation. “We have executed under this approach, investing in our business and repurchasing over $190 million of our stock thus far in 2024. Moving forward, we will continue to balance our capital allocation strategy remaining mindful of market conditions and business performance as we continue to drive our low-cost business model through Project Core.”

The number of shares to be repurchased under the authorization in the future and the timing of such transactions will depend on a variety of factors, including market conditions, regulatory requirements, and other corporate considerations. The new share repurchase authorization could be suspended or discontinued at any time as determined by the Board of Directors.

Balance Sheet and Cash Flow

As of June 29, 2024, ODP had total available liquidity of approximately $831 million, consisting of $190 million in cash and cash equivalents, including $10 million that is presented in Current assets held for sale related to the Varis Division, and $641 million of available credit under the Fourth Amended Credit Agreement. Total debt was $183 million.

For the second quarter of 2024, cash used in operating activities of continuing operations was $1 million, which included $25 million in restructuring spend, compared to cash used in operating activities of continuing operations of $8 million in the second quarter of the prior year, which included $1 million in restructuring spend. The year-over-year change in operating cash flow is largely related to the timing of certain working capital items.

Capital expenditures in the second quarter of 2024 were $19 million versus $17 million in the prior year period, reflecting continued growth investments in the Company’s digital transformation, distribution network, and eCommerce capabilities. Adjusted Free Cash Flow(3) was $5 million in the second quarter of 2024, compared to $(24) million in the prior year period.

Progress on Project Core

As the Company previously announced, Project Core is a plan designed to create further efficiencies throughout its business, focused on driving enhanced operating results and shareholder value. This broad-based plan includes cost improvement actions across the entire enterprise, optimizing its organizational structure to support future growth of the business. The Company continues to make significant progress under Project Core and is in position to realize in-year savings of approximately $50 million and annualized savings of over $100 million when fully implemented. Restructuring and related charges associated with these actions are now estimated to be in the range of $40 million to $50 million, excluding those related to the Varis Division, and are expected to be substantially incurred throughout 2024.

Varis Division Update

The Company has entered into a non-binding term sheet agreement with a third-party for the sale of Varis. Under the proposed terms, the Company would retain an approximately 20% current stake in the entity. However, there can be no assurances regarding the ultimate timing of this proposed transaction or that such transaction will be completed.

“After a thorough process, we have arrived at a path forward for Varis that aligns with our stated objectives of finalizing our capital commitment to the business, while providing ODP with a continued invested interest in the opportunities ahead. We expect to announce further details of the proposed transaction upon close, which we expect to be completed in the third quarter,” added Smith.

2024 Guidance

“Our performance in the first half of the year was clearly below expectations, placing us behind our goals for the year,” said Smith. “The initiatives we are taking to improve our top-line trajectory, along with our low-cost model, high touch service approach, and strong value proposition, give us confidence in our ability to improve our performance and position us for greater stability and growth in the future. Considering our slow start to the first half of the year, as well as the uncertain macroeconomic environment and the potential variability of the timing of our initiatives, we are updating our 2024 guidance as follows”:

Updated full-year guidance for 2024

*Adjusted Earnings per Share (fully diluted) (EPS) guidance for 2024 excludes potential discrete (tax) items that may affect quarter to quarter fluctuations and includes expected impact from share repurchases

The Company’s full year guidance for 2024 includes non-GAAP measures, such as Adjusted EBITDA, Adjusted Operating Income, Adjusted Earnings per Share (fully diluted) and Adjusted Free Cash Flow. These measures exclude charges or credits not indicative of core operations, which may include but not be limited to restructuring charges, capital expenditures, acquisition-related costs, executive transition costs, asset impairments and other significant items that currently cannot be predicted without unreasonable efforts. The exact amount of these charges or credits are not currently determinable but may be significant. Accordingly, the Company is unable to provide equivalent GAAP measures or reconciliations from GAAP to non-GAAP for these financial measures.

“As a result of our first half performance, along with a continuing challenging macro environment and lower than anticipated sales pipeline conversion in ODP Business Solutions, we are lowering our full year outlook. While first half results were below our expectations, our team remains focused on executing upon opportunities in our business to grow our top line, leveraging our low-cost business model, strong balance sheet, and diverse routes to market,” said Scaglione.

The ODP Corporation will webcast a call with financial analysts and investors on August 7, 2024, at 9:00 am Eastern Time, which will be accessible to the media and the general public. To listen to the conference call via webcast, please visit The ODP Corporation’s Investor Relations website at investor.theodpcorp.com. A replay of the webcast will be available approximately two hours following the event.

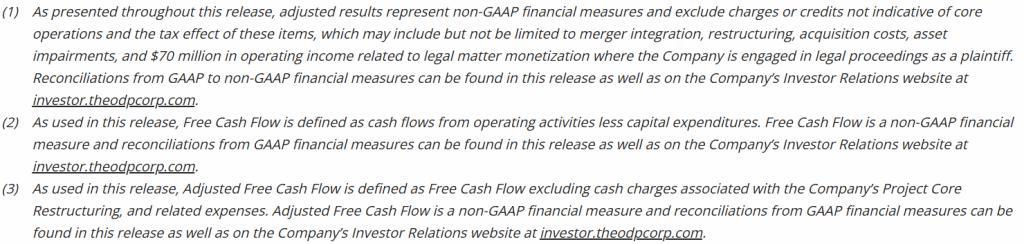
(1)As presented throughout this release, adjusted results represent non-GAAP financial measures and exclude charges or credits not indicative of core operations and the tax effect of these items, which may include but not be limited to merger integration, restructuring, acquisition costs, and asset impairments. Reconciliations from GAAP to non-GAAP financial measures can be found in this release as well as on the Company’s Investor Relations website at investor.theodpcorp.com.
(2)As used in this release, Free Cash Flow is defined as cash flows from operating activities less capital expenditures. Free Cash Flow is a non-GAAP financial measure and reconciliations from GAAP financial measures can be found in this release as well as on the Company’s Investor Relations website at investor.theodpcorp.com.
(3)As used in this release, Adjusted Free Cash Flow is defined as Free Cash Flow excluding cash charges associated with the Company’s Project Core Restructuring, and related expenses. Adjusted Free Cash Flow is a non-GAAP financial measure and reconciliations from GAAP financial measures can be found in this release as well as on the Company’s Investor Relations website at investor.theodpcorp.com.

About The ODP Corporation

The ODP Corporation (NASDAQ:ODP) is a leading provider of products, services, and technology solutions through an integrated business-to-business (B2B) distribution platform and omni-channel presence, which includes supply chain and distribution operations, dedicated sales professionals, online presence, and a network of Office Depot and OfficeMax retail stores. Through its operating companies ODP Business Solutions, LLC; Office Depot, LLC; and Veyer, LLC, The ODP Corporation empowers every business, professional, and consumer to achieve more every day. For more information, visit theodpcorp.com.

ODP and ODP Business Solutions are trademarks of ODP Business Solutions, LLC. Office Depot is a trademark of The Office Club, LLC. OfficeMax is a trademark of OMX, Inc. Veyer is a trademark of Veyer, LLC. Varis is a trademark of Varis, Inc. Grand&Toy is a trademark of Grand & Toy, LLC in Canada. ©2023 Office Depot, LLC. All rights reserved. Any other product or company names mentioned herein are the trademarks of their respective owners.

FORWARD LOOKING STATEMENTS
This communication may contain forward-looking statements within the meaning of the Private Securities Litigation Reform Act of 1995. These statements or disclosures may discuss goals, intentions and expectations as to future trends, plans, events, results of operations, cash flow or financial condition, or state other information relating to, among other things, the Company, based on current beliefs and assumptions made by, and information currently available to, management. Forward-looking statements generally will be accompanied by words such as “anticipate,” “believe,” “plan,” “could,” “estimate,” “expect,” “forecast,” “guidance,” “expectations”, “outlook,” “intend,” “may,” “possible,” “potential,” “predict,” “project,” “propose” or other similar words, phrases or expressions, or other variations of such words. These forward-looking statements are subject to various risks and uncertainties, many of which are outside of the Company’s control. There can be no assurances that the Company will realize these expectations or that these beliefs will prove correct, and therefore investors and stakeholders should not place undue reliance on such statements. Factors that could cause actual results to differ materially from those in the forward-looking statements include, among other things, highly competitive office products market and failure to differentiate the Company from other office supply resellers or respond to decline in general office supplies sales or to shifting consumer demands; competitive pressures on the Company’s sales and pricing; the risk that the Company is unable to transform the business into a service-driven, B2B platform or that such a strategy will not result in the benefits anticipated; the risk that the Company will not be able to achieve the expected benefits of its strategic plans, including a potential sale of Varis on the terms proposed or at all and benefits related to Project Core; the risk that the Company may not be able to realize the anticipated benefits of acquisitions due to unforeseen liabilities, future capital expenditures, expenses, indebtedness and the unanticipated loss of key customers or the inability to achieve expected revenues, synergies, cost savings or financial performance; the risk that the Company is unable to successfully maintain a relevant omni-channel experience for its customers; the risk that the Company is unable to execute the Maximize B2B Restructuring Plan successfully or that such plan will not result in the benefits anticipated; failure to effectively manage the Company’s real estate portfolio; loss of business with government entities, purchasing consortiums, and sole- or limited- source distribution arrangements; failure to attract and retain qualified personnel, including employees in stores, service centers, distribution centers, field and corporate offices and executive management, and the inability to keep supply of skills and resources in balance with customer demand; failure to execute effective advertising efforts and maintain the Company’s reputation and brand at a high level; disruptions in computer systems, including delivery of technology services; breach of information technology systems affecting reputation, business partner and customer relationships and operations and resulting in high costs and lost revenue; unanticipated downturns in business relationships with customers or terms with the suppliers, third-party vendors and business partners; disruption of global sourcing activities, evolving foreign trade policy (including tariffs imposed on certain foreign made goods); exclusive Office Depot branded products are subject to additional product, supply chain and legal risks; product safety and quality concerns of manufacturers’ branded products and services and Office Depot private branded products; covenants in the credit facility; general disruption in the credit markets; incurrence of significant impairment charges; retained responsibility for liabilities of acquired companies; fluctuation in quarterly operating results due to seasonality of the Company’s business; changes in tax laws in jurisdictions where the Company operates; increases in wage and benefit costs and changes in labor regulations; changes in the regulatory environment, legal compliance risks and violations of the U.S. Foreign Corrupt Practices Act and other worldwide anti-bribery laws; volatility in the Company’s common stock price; changes in or the elimination of the payment of cash dividends on Company common stock; macroeconomic conditions such as higher interest rates and future declines in business or consumer spending; increases in fuel and other commodity prices and the cost of material, energy and other production costs, or unexpected costs that cannot be recouped in product pricing; unexpected claims, charges, litigation, dispute resolutions or settlement expenses; catastrophic events, including the impact of weather events on the Company’s business; the discouragement of lawsuits by shareholders against the Company and its directors and officers as a result of the exclusive forum selection of the Court of Chancery, the federal district court for the District of Delaware or other Delaware state courts by the Company as the sole and exclusive forum for such lawsuits; and the impact of the COVID-19 pandemic on the Company’s business. The foregoing list of factors is not exhaustive. Investors and shareholders should carefully consider the foregoing factors and the other risks and uncertainties described in the Company’s Annual Reports on Form 10-K, Quarterly Reports on Form 10-Q, and Current Reports on Form 8-K filed with the U.S. Securities and Exchange Commission. The Company does not assume any obligation to update or revise any forward-looking statements.

Click here for full report

Release – Lifeway Foods to Report Second Quarter 2024 Results on August 13, 2024

Research News and Market Data on LWAY

MORTON GROVE, Ill., Aug. 6, 2024 /PRNewswire/ — Lifeway Foods, Inc. (Nasdaq: LWAY) (“Lifeway” or “the Company”), a leading U.S. supplier of kefir and fermented probiotic products to support the microbiome, today announced it will report financial results for the second quarter ended June 30, 2024 on August 13, 2024 before market hours.

A pre-recorded conference call and webcast with Julie Smolyanksy, Lifeway’s President and Chief Executive Officer, discussing these results with additional comments and details will be made available through the “Investor Relations” section of the Company’s website at https://lifewaykefir.com/webinars-reports/ upon dissemination of the second quarter results on August 13, 2024 before market hours.

About Lifeway Foods, Inc.
Lifeway Foods, Inc., which has been recognized as one of Forbes’ Best Small Companies, is America’s leading supplier of the probiotic, fermented beverage known as kefir. In addition to its line of drinkable kefir, the company also produces a variety of cheeses and a ProBugs line for kids. Lifeway’s tart and tangy fermented dairy products are now sold across the United States, Mexico, Ireland and France. Learn how Lifeway is good for more than just you at lifewayfoods.com.

Media:
Derek Miller 
Vice President of Communications, Lifeway Foods
Email: [email protected] 

General inquiries:
Lifeway Foods, Inc.
Phone: 847-967-1010
Email: [email protected]

Commercial Vehicle Group (CVGI) – Q2 Results: A Closer Look


Wednesday, August 07, 2024

Joe Gomes, CFA, Managing Director, Equity Research Analyst, Generalist , Noble Capital Markets, Inc.

Jacob Mutchler, Research Associate, Noble Capital Markets, Inc.

Refer to the full report for the price target, fundamental analysis, and rating.

Electrical Systems. To our surprise, the segment had a difficult quarter, revenue decreased $13.5 million, or 21.2%. The decrease was largely attributed to a slow down in the construction and agriculture industries, and new contract wins taking longer to ramp up and at lower than expected volumes. In our view, the company is well positioned to capitalize on the industry rebound, anticipated to take place in 2025 & 2026.

Vehicle Solutions. The segment experienced a decrease of $11.8 million, or 7.7%, from the prior year period, which was primarily driven by softer demand and reorganization. Notably, the company anticipated a more drastic decline in the business and closed a plant, shifting manufacturing to three other existing facilities, which should improve cost structure over the long-term.


Get the Full Report

Equity Research is available at no cost to Registered users of Channelchek. Not a Member? Click ‘Join’ to join the Channelchek Community. There is no cost to register, and we never collect credit card information.

This Company Sponsored Research is provided by Noble Capital Markets, Inc., a FINRA and S.E.C. registered broker-dealer (B/D).

*Analyst certification and important disclosures included in the full report. NOTE: investment decisions should not be based upon the content of this research summary. Proper due diligence is required before making any investment decision. 

Release – 1-800-FLOWERS.COM, Inc. to Release its Fiscal 2024 Fourth Quarter and Year-End Results on Thursday, August 29, 2024

Research News and Market Data on FLWS

Aug 06, 2024

JERICHO, N.Y.–(BUSINESS WIRE)– 1-800-FLOWERS.COM, Inc. (NASDAQ: FLWS) (the “Company”),a leading provider of gifts designed to help inspire customers to give more, connect more, and build more and better relationships, today announced that the Company will release financial results for its fiscal 2024 fourth quarter and year-end on Thursday, August 29, 2024. The press release will be issued prior to market opening and will be followed by a conference call with members of senior management at 8:00 a.m. (ET).

The conference call will be available via live webcast from the Investors section of the Company’s website at www.1800flowersinc.com/investors. A recording of the call will be posted on the website within two hours of the call’s completion. A telephonic replay of the call can be accessed beginning at 2:00 p.m. (ET) on August 29, 2024, through September 5, 2024, at: (US) 1-877-344-7529; (Canada) 855-669-9658; (International) 1-412-317-0088; enter conference ID: #5141252.

Special Note Regarding Forward-Looking Statements:

Some of the statements contained in the Company’s scheduled Thursday, August 29, 2024, press release and conference call regarding its results for its fiscal 2024 fourth quarter and year-end, other than statements of historical fact, may be forward-looking within the meaning of the Private Securities Litigation Reform Act of 1995. These statements involve risks and uncertainties that could cause actual results to differ materially from those expressed or implied in the applicable statements. For a more detailed description of these and other risk factors, please refer to the Company’s SEC filings including its Annual Reports and Forms 10K and 10Q available at the Investor Relations section of the Company’s website at 1800flowersinc.com. The Company expressly disclaims any intent or obligation to update any of the forward-looking statements made in the scheduled conference call and any recordings thereof, or in any of its SEC filings, except as may be otherwise stated by the Company.

About 1-800-FLOWERS.COM, Inc.

1-800-FLOWERS.COM, Inc. is a leading provider of gifts designed to help inspire customers to give more, connect more, and build more and better relationships. The Company’s e-commerce business platform features an all-star family of brands, including: 1-800-Flowers.com®, 1-800-Baskets.com®, Cheryl’s Cookies®, Harry & David®, PersonalizationMall.com®, Shari’s Berries®, FruitBouquets.com®, Things Remembered®Moose Munch®, The Popcorn Factory®, Wolferman’s Bakery®, Vital Choice®, and Simply Chocolate®. Through the Celebrations Passport® loyalty program, which provides members with free standard shipping and no service charge on eligible products across our portfolio of brands, 1-800-FLOWERS.COM, Inc. strives to deepen relationships with customers. The Company also operates BloomNet®, an international floral and gift industry service provider offering a broad-range of products and services designed to help members grow their businesses profitably; Napco℠, a resource for floral gifts and seasonal décor; DesignPac Gifts, LLC, a manufacturer of gift baskets and towers; and Alice’s Table®, a lifestyle business offering fully digital livestreaming and on demand floral, culinary and other experiences to guests across the country. 1-800-FLOWERS.COM, Inc. was recognized among America’s Most Trustworthy Companies by Newsweek. 1-800-FLOWERS.COM, Inc. was also recognized among the top 5 on the National Retail Federation’s 2021 Hot 25 Retailers list, which ranks the nation’s fastest-growing retail companies, and was named to the Fortune 1000 list in 2022. Shares in 1-800-FLOWERS.COM, Inc. are traded on the NASDAQ Global Select Market, ticker symbol: FLWS. For more information, visit 1800flowersinc.com.

FLWS-COMP
FLWS-FN

Investor Contact:

Andy Milevoj

(516) 237-4617

[email protected]

Media Contact:

Cherie Gallarello

[email protected]

Source: 1-800-FLOWERS.COM, Inc.

Release – CVG Reports Second Quarter 2024 Results

Research News and Market Data on CVGI

EPS of $(0.05), Adjusted EPS of $0.06, reflecting additional restructuring activity

Adjusted EBITDA of $10.0 million, free cash flow of $6.4 million

Strategic actions taken to strengthen Vehicle Solutions Business

Provides updated guidance for full year 2024

NEW ALBANY, Ohio, Aug. 05, 2024 (GLOBE NEWSWIRE) — CVG (NASDAQ: CVGI), a diversified industrial products and services company, today announced financial results for its second quarter ended June 30, 2024.

Second Quarter 2024 Highlights (Compared with prior year, where comparisons are noted)

  • Revenues of $229.9 million, down 12.3%, due primarily to a global softening in customer demand.
  • Operating income of $0.8 million, down 95.2%; adjusted operating income of $5.7 million, down 65.9%. The decrease in operating income was driven primarily by lower sales volumes, partially offset by reduced SG&A.
  • New business wins in the quarter of approximately $32 million when fully ramped, bringing the year-to-date total to $80 million; these wins were concentrated in our Electrical Systems segment, and includes meaningful wins in our Vehicle Solutions segment.
  • Net loss of $1.6 million, or $(0.05) per diluted share and adjusted net income of $2.1 million, or $0.06 per diluted share, compared to net income of $10.1 million, or $0.30 per diluted share and adjusted net income of $10.7 million, or $0.32 per diluted share.
  • Adjusted EBITDA of $10.0 million, down 51.9%, with an adjusted EBITDA margin of 4.3%, down from 7.9%.

James Ray, President and Chief Executive Officer, said, “CVG continues to drive its strategic transformation, despite second quarter results that were challenged due to multiple factors. In particular, we witnessed continued softening in the construction and agricultural end markets and reduced volumes in our new business win launches, impacting our key growth segment in Electrical Systems. We also experienced operational inefficiencies in our Vehicle Solutions segment resulting from a new product launch with a major customer across multiple sites as well as activities to prepare our Cab Structures Business for sale. We made incremental investments in both internal and external support teams deployed to the affected facilities and expect to achieve more stability during the balance of the year. These market dynamics and operational activities weighed on second quarter profitability. While we are disappointed with our second quarter performance, we are taking proactive steps to right-size our cost structure and improve operational execution as we navigate a lower demand environment.”

Mr. Ray concluded, “Despite these challenges in the second quarter, we continue to position CVG for future success. We maintained our strong track record of procuring new business wins in the quarter and recently announced the sale of our Cab Structures Business, that is expected to close in the second half of 2024, which will serve to further streamline our product portfolio and aligns with our transformation strategy to reduce cyclicality, balance customer concentration, and strengthen our Vehicle Solutions business. We expect the trend of OEM’s insourcing components of their cab manufacturing to continue, so monetizing the facility now will create value for shareholders and will allow us to redeploy capital in key areas to improve our operating model. Strategic actions like this one, combined with our ongoing cost reduction and business optimization efforts, are expected to position CVG to benefit from the anticipated improvement in market conditions.”

Andy Cheung, Chief Financial Officer, added, “We are taking swift action to respond to the end market and operational challenges through restructuring and headcount reduction efforts to improve profitability. We’ve incurred $6.8 million in restructuring expenses year-to-date and have reduced our headcount by more than 10%. Additionally, we have made progress on the strategic evaluation of our Industrial Automation segment, which we believe will culminate in the third quarter of this year and is reflected in our guidance. We are adjusting our annual guidance ranges for fiscal year 2024 to reflect current market trends to include the deterioration in global construction and agriculture markets, and we are providing an adjusted version of the updated guidance for the Cab Structures and Industrial Automation businesses. Following closing, we anticipate that the majority of the disposition proceeds will support debt paydown as we further strengthen our balance sheet.”

Second Quarter Financial Results
(amounts in millions except per share data and percentages)

Consolidated Results

Second Quarter 2024 Results

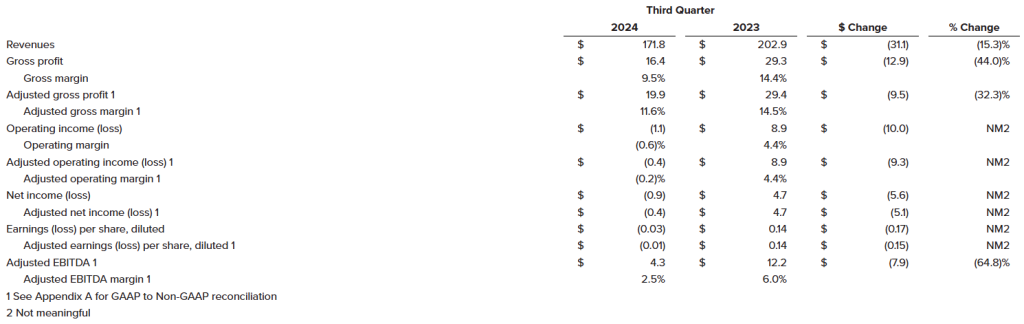
  • Second quarter 2024 revenues were $229.9 million, compared to $262.2 million in the prior year period, a decrease of 12.3%. The overall decrease in revenues was due to a softening in customer demand impacting all segments and the wind-down of certain programs in our Vehicle Solutions segment.
  • Operating income in the second quarter 2024 was $0.8 million compared to $15.9 million in the prior year period. The decrease in operating income was attributable to the impact of lower sales volumes, operational inefficiencies and increased restructuring charges. Second quarter 2024 adjusted operating income was $5.7 million, compared to $16.7 million in the prior year period.
  • Interest associated with debt and other expenses was $2.5 million and $2.8 million for the second quarter 2024 and 2023, respectively.
  • Net loss was $1.6 million, or $(0.05) per diluted share, for the second quarter 2024 compared to net income of $10.1 million, or $0.30 per diluted share, in the prior year period.

On June 30, 2024, the Company had $7.0 million of outstanding borrowings on its U.S. revolving credit facility and no outstanding borrowings on its China credit facility, $39.3 million of cash and $152.9 million of availability from the credit facilities, resulting in total liquidity of $192.2 million.

Second Quarter 2024 Segment Results

Vehicle Solutions Segment

  • Revenues were $140.9 million compared to $152.7 million for the prior year period, a decrease of 7.7%, due to lower customer demand and the wind-down of certain operations.
  • Operating income was $5.1 million, compared to $14.1 million in the prior year period, a decrease of 64.1%, primarily attributable to lower customer demand, operational remediation investments, and increased freight costs partially offset by lower SG&A. Second quarter 2024 adjusted operating income was $8.3 million compared to $14.5 million in the prior year period.

Electrical Systems Segment

  • Revenues were $50.2 million compared to $63.6 million in the prior year period, a decrease of 21.2%, primarily due to a global softening in the Construction & Agriculture end-markets and the phase out of certain lower margin business.
  • Operating income was $0.5 million compared to $7.7 million in the prior year period, a decrease of 93.4%. The decrease in operating income was primarily attributable to lower customer demand, restructuring costs, labor inflation, and unfavorable foreign exchange impacts. Second quarter 2024 adjusted operating income was $1.9 million compared to $7.7 million in the prior year period.

Aftermarket & Accessories Segment

  • Revenues were $33.9 million compared to $36.8 million in the prior year period, a decrease of 8.1%, primarily as a result of lower sales volume due to decreased customer demand and the reduction of backlog in the prior period.
  • Operating income was $4.5 million compared to $5.5 million in the prior year period, a decrease of 19.4%. The decrease in operating income was primarily attributable to lower sales volumes, product mix and higher labor and benefit costs. Second quarter 2024 adjusted operating income was $4.7 million compared to $5.5 million in the prior year period.

Industrial Automation Segment

  • Revenues were $5.0 million compared to $9.0 million in the prior year period, a decrease of 44.6%, as a result of lower sales volume due to decreased customer demand.
  • Operating loss was $1.0 million, compared to $2.1 million in the prior year period. The decrease in operating loss was primarily attributable to benefits from recently implemented restructuring programs. Second quarter 2024 adjusted operating loss was $0.9 million, compared to $1.7 million in the prior year period.

Outlook

CVG issued the following outlook for the full year 2024 which reflects both market developments and pending strategic portfolio actions:

MetricPrior 2024 OutlookRevised 2024 OutlookAdjusted
Revised 2024 Outlook (1)
Net Sales$915 – $1,015$900 – $960$730 – $780
Adjusted EBITDA$60 – $73$42 – $52$28 – $36

(1) This Adjusted Revised outlook excludes any contribution from CVG’s Cab Structures or Industrial Automation businesses in 2024. On July 31, 2024, CVG signed an asset purchase agreement for the sale of the Cab Structures business with closing expected in the second half of 2024. Separately, CVG is currently exploring strategic alternatives for the Industrial Automation business.

This outlook reflects, among others, current industry forecasts for North America Class 8 truck builds. According to ACT Research, 2024 North American Class 8 truck production levels are expected to be at 308,000 units. The 2023 actual Class 8 truck builds according to the ACT Research was 340,247 units.

Agriculture and construction market conditions have deteriorated relative to our prior update in March 2024. Based on industry data, we now project segments within global agriculture market demand to be down 15% to 20% and construction market demand to be down 10% to 15% in 2024.

GAAP to Non-GAAP Reconciliation

A reconciliation of GAAP to non-GAAP financial measures referenced in this release is included as Appendix A to this release.

Conference Call

A conference call to discuss this press release is scheduled for Tuesday, August 6, 2024, at 8:30 a.m. ET. Management intends to reference the Q2 2024 Earnings Call Presentation during the conference call. To participate, dial (800) 549-8228 using conference code 11335. International participants dial (289) 819-1520 using conference code 11335.

This call is being webcast and can be accessed through the “Investors” section of CVG’s website at ir.cvgrp.com, where it will be archived for one year.

A telephonic replay of the conference call will be available for a period of two weeks following the call. To access the replay, dial (+1) 888 660 6264 using access code 11335#.

Company Contact
Andy Cheung
Chief Financial Officer
CVG
[email protected]

Investor Relations Contact
Ross Collins or Stephen Poe
Alpha IR Group
[email protected]

About CVG

At CVG, we deliver real solutions to complex design, engineering and manufacturing problems while creating positive change for our customers, industries and communities we serve. Information about the Company and its products is available on the internet at www.cvgrp.com.

Forward-Looking Statements

This press release contains forward-looking statements that are subject to risks and uncertainties. These statements often include words such as “believe”, “anticipate”, “plan”, “expect”, “intend”, “will”, “should”, “could”, “would”, “project”, “continue”, “likely”, and similar expressions. In particular, this press release may contain forward-looking statements about the Company’s expectations for future periods with respect to closing of the recently announced sale of its Cab Structures Business, its plans to improve financial results, the future of the Company’s end markets, changes in the Class 8 and Class 5-7 North America truck build rates, performance of the global construction and agricultural equipment business, the Company’s prospects in the wire harness, warehouse automation and electric vehicle markets, the Company’s initiatives to address customer needs, organic growth, the Company’s strategic plans and plans to focus on certain segments, competition faced by the Company, volatility in and disruption to the global economic environment and the Company’s financial position or other financial information. These statements are based on certain assumptions that the Company has made in light of its experience as well as its perspective on historical trends, current conditions, expected future developments and other factors it believes are appropriate under the circumstances. Actual results may differ materially from the anticipated results because of certain risks and uncertainties, including those included in the Company’s filings with the SEC. There can be no assurance that statements made in this press release relating to future events will be achieved. The Company undertakes no obligation to update or revise forward-looking statements to reflect changed assumptions, the occurrence of unanticipated events or changes to future operating results over time. All subsequent written and oral forward-looking statements attributable to the Company or persons acting on behalf of the Company are expressly qualified in their entirety by such cautionary statements.

Other Information

Throughout this document, certain numbers in the tables or elsewhere may not sum due to rounding. Rounding may have also impacted the presentation of certain year-on-year percentage changes.

Click here for full report

Commercial Vehicle Group (CVGI) – First Look at 2Q24


Tuesday, August 06, 2024

Joe Gomes, CFA, Managing Director, Equity Research Analyst, Generalist , Noble Capital Markets, Inc.

Joshua Zoepfel, Research Associate, Noble Capital Markets, Inc.

Refer to the full report for the price target, fundamental analysis, and rating.

Still Challenging. 2Q24 revenue declined 12.3% y-o-y to $229.9 million due to softening global customer demand. We had projected $237.5 million. Operating income was $0.8 million and adjusted operating income totaled $5.7 million, down 65.9% y-o-y. CVGI reported a net loss of $1.6 million, or $0.05/sh, and adjusted net income of $2.1 million, or EPS of $0.06. We had forecast adjusted EPS of $0.21. Adjusted EBITDA of $10 million was down 51.9% y-o-y and short of our $16 million estimate.

Drivers. Second quarter results were challenged due to multiple factors. In particular, continued softening in the construction and agricultural end markets and reduced volumes in new business win launches, impacting the key growth segment in Electrical Systems. CVG also experienced operational inefficiencies in the Vehicle Solutions segment resulting from a new product launch with a major customer across multiple sites, as well as activities to prepare the Cab Structures business for sale.


Get the Full Report

Equity Research is available at no cost to Registered users of Channelchek. Not a Member? Click ‘Join’ to join the Channelchek Community. There is no cost to register, and we never collect credit card information.

This Company Sponsored Research is provided by Noble Capital Markets, Inc., a FINRA and S.E.C. registered broker-dealer (B/D).

*Analyst certification and important disclosures included in the full report. NOTE: investment decisions should not be based upon the content of this research summary. Proper due diligence is required before making any investment decision. 

Release – Bowlero Declares Common Stock Dividend

Research News and Market Data on BOWL

RICHMOND, Va.–(BUSINESS WIRE)– The Board of Directors of Bowlero Corp. (NYSE: BOWL), one of the world’s premier operators of location-based entertainment, declared a regular quarterly cash dividend of $0.055 per common share. The dividend is payable on September 6, 2024, to stockholders of record on August 23, 2024.

About Bowlero Corp.

Bowlero Corporation is one of the world’s premier operators of location-based entertainment. With over 350 locations across North America, the Company serves more than 40 million guest visits annually through a family of brands that include Lucky Strike, Bowlero and AMF. In 2019, Bowlero acquired the Professional Bowlers Association, the major league of bowling and a growing media property that boasts millions of fans around the globe. For more information on Bowlero, please visit BowleroCorp.com.

Forward Looking Statements

Some of the statements contained in this press release are forward-looking statements within the meaning of Section 27A of the Securities Act of 1933, as amended, and Section 21E of the Securities Exchange Act of 1934, as amended, that involve risk, assumptions and uncertainties, such as statements of our plans, objectives, expectations, intentions and forecasts. These forward-looking statements are generally identified by the use of forward-looking terminology, including the terms “anticipate,” “believe,” “confident,” “continue,” “could,” “estimate,” “expect,” “intend,” “likely,” “may,” “plan,” “possible,” “potential,” “predict,” “project,” “should,” “target,” “will,” “would” and, in each case, their negative or other various or comparable terminology. These forward-looking statements reflect our views with respect to future events as of the date of this release and are based on our management’s current expectations, estimates, forecasts, projections, assumptions, beliefs and information. Although management believes that the expectations reflected in these forward-looking statements are reasonable, it can give no assurance that these expectations will prove to have been correct. All such forward-looking statements are subject to risks and uncertainties, many of which are outside of our control, and could cause future events or results to be materially different from those stated or implied in this document. It is not possible to predict or identify all such risks. These risks include, but are not limited to: our ability to design and execute our business strategy; changes in consumer preferences and buying patterns; our ability to compete in our markets; the occurrence of unfavorable publicity; risks associated with long-term non-cancellable leases for our centers; our ability to retain key managers; risks associated with our substantial indebtedness and limitations on future sources of liquidity; our ability to carry out our expansion plans; our ability to successfully defend litigation brought against us; our ability to adequately obtain, maintain, protect and enforce our intellectual property and proprietary rights and claims of intellectual property and proprietary right infringement, misappropriation or other violation by competitors and third parties; failure to hire and retain qualified employees and personnel; the cost and availability of commodities and other products we need to operate our business; cybersecurity breaches, cyber-attacks and other interruptions to our and our third-party service providers’ technological and physical infrastructures; catastrophic events, including war, terrorism and other conflicts; public health emergencies and pandemics, such as the COVID-19 pandemic, or natural catastrophes and accidents; changes in the regulatory atmosphere and related private sector initiatives; fluctuations in our operating results; economic conditions, including the impact of increasing interest rates, inflation and recession; and other factors described under the section titled “Risk Factors” in the Company’s Annual Report on Form 10-K filed with the U.S. Securities and Exchange Commission (the “SEC”) by the Company on September 11, 2023, as well as other filings that the Company will make, or has made, with the SEC, such as Quarterly Reports on Form 10-Q and Current Reports on Form 8-K. These factors should not be construed as exhaustive and should be read in conjunction with the other cautionary statements that are included in this press release and in other filings. We expressly disclaim any obligation to publicly update or review any forward-looking statements, whether as a result of new information, future developments or otherwise, except as required by applicable law.

Bowlero Corp. Investor Relations
[email protected]Source: Bowlero Corp

ACCO Brands (ACCO) – 2Q 2024: A Closer Look


Monday, August 05, 2024

ACCO Brands Corporation is one of the world’s largest designers, marketers and manufacturers of branded academic, consumer and business products. Our widely recognized brands include AT-A-GLANCE®, Esselte®, Five Star®, GBC®, Kensington®, Leitz®, Mead®, PowerA®, Quartet®, Rapid®, Rexel®, Swingline®, Tilibra®, and many others. Our products are sold in more than 100 countries around the world. More information about ACCO Brands, the Home of Great Brands Built by Great People, can be found at www.accobrands.com.

Joe Gomes, CFA, Managing Director, Equity Research Analyst, Generalist , Noble Capital Markets, Inc.

Jacob Mutchler, Research Associate, Noble Capital Markets, Inc.

Refer to the full report for the price target, fundamental analysis, and rating.

Segment results. Americas revenue totaled $292.3 million in Q2, a decrease of 13.1% from the prior year period. Comparable sales were down 12.7%. International revenue was $146.0 million in Q2, a decrease of 7.1% from the prior period. Comparable sales decreased 5.1%. While revenue was modestly below our estimates, largely due to soft demand for business and consumer office products and a shift from lower margin products, we believe the Company’s outlook is favorable.

Cost reduction efforts. The company made significant progress towards its cost reduction target of $60 million in annualized savings, with $10 million in cost reductions realized so far this year, and $20 million of savings expected for full year 2024. Notably, the Company reduced inventory levels by 17% from the prior year with its technology enabled SKU rationalization.


Get the Full Report

Equity Research is available at no cost to Registered users of Channelchek. Not a Member? Click ‘Join’ to join the Channelchek Community. There is no cost to register, and we never collect credit card information.

This Company Sponsored Research is provided by Noble Capital Markets, Inc., a FINRA and S.E.C. registered broker-dealer (B/D).

*Analyst certification and important disclosures included in the full report. NOTE: investment decisions should not be based upon the content of this research summary. Proper due diligence is required before making any investment decision. 

Release – Commercial Vehicle Group Announces Sale of Cab Structures Business

Research News and Market Data on CVGI

Divestiture streamlines CVG’s focus
Important milestone in ongoing long-term growth strategy

NEW ALBANY, Ohio, Aug. 01, 2024 (GLOBE NEWSWIRE) — Commercial Vehicle Group (the “Company” or “CVG”) (NASDAQ: CVGI), a diversified industrial products and services company, today announced it reached an agreement to sell its Cab Structures business with operations in Kings Mountain, North Carolina to a Volvo Group company, effective July 31, 2024. The net proceeds of the transaction are expected to be $40 million, with closure expected in the second half of 2024. The Company expects the majority of proceeds to be used for debt paydown and other general corporate purposes.

The Cab Structures business primarily serves the Class 8 truck market. This transaction continues a trend of heavy truck OEMs insourcing their cab structure production in recent years.

James Ray, CVG President and Chief Executive Officer, said, “The strategic sale of our Cab Structures business marks another milestone on our journey to evolve our business towards higher-growth products and markets, in line with our ongoing strategic transformation plan, while simultaneously generating shareholder value. The sale of our Cab Structures business reduces our exposure to the cyclical Class 8 market, lowers our customer concentration, removes complexity from our business, and improves our return profile.”

About 230 CVG employees are expected to become employees of Volvo, as part of the transaction.

“We are very happy to see this plant in good hands,” said Mr. Ray. “Volvo brings proven operating experience. Kings Mountain employees will benefit from continuity of the plant’s operations and will have the unique opportunity to work for the OEM.”

Mr. Ray concluded, “This transaction also lowers our future capital investment needs and provides the opportunity to invest in high-growth opportunities moving forward. We will continue to closely review additional opportunities for value creation.”

CVG expects to update its full-year 2024 outlook to reflect the impact of the Cab Structures business divestiture in its second quarter 2024 earnings release expected to be released on August 5, 2024.

Company Contact
Andy Cheung
Chief Financial Officer
CVG
[email protected] 

Investor Relations Contact
Ross Collins or Stephen Poe
Alpha IR Group
[email protected] 

About CVG

At CVG, we deliver real solutions to complex design, engineering and manufacturing problems while creating positive change for our customers, industries and communities we serve. Information about the Company and its products is available on the internet at www.cvgrp.com.

Forward-Looking Statements

This press release contains forward-looking statements that are subject to risks and uncertainties. These statements often include words such as “believe”, “anticipate”, “plan”, “expect”, “intend”, “will”, “should”, “could”, “would”, “project”, “continue”, “likely”, and similar expressions. In particular, this press release may contain forward-looking statements about the Company’s expectations for future periods with respect to its plans to improve financial results, the future of the Company’s end markets, changes in the Class 8 and Class 5-7 North America truck build rates, performance of the global construction equipment business, the Company’s prospects in the wire harness, warehouse automation and electric vehicle markets, the Company’s initiatives to address customer needs, organic growth, the Company’s strategic plans and plans to focus on certain segments, competition faced by the Company, volatility in and disruption to the global economic environment and the Company’s financial position or other financial information. These statements are based on certain assumptions that the Company has made in light of its experience as well as its perspective on historical trends, current conditions, expected future developments and other factors it believes are appropriate under the circumstances. Actual results may differ materially from the anticipated results because of certain risks and uncertainties, including those included in the Company’s filings with the SEC. There can be no assurance that statements made in this press release relating to future events will be achieved. The Company undertakes no obligation to update or revise forward-looking statements to reflect changed assumptions, the occurrence of unanticipated events or changes to future operating results over time. All subsequent written and oral forward-looking statements attributable to the Company or persons acting on behalf of the Company are expressly qualified in their entirety by such cautionary statements.

Source: Commercial Vehicle Group, Inc.

Commercial Vehicle Group (CVGI) – A Strategic Sale


Friday, August 02, 2024

Joe Gomes, CFA, Managing Director, Equity Research Analyst, Generalist , Noble Capital Markets, Inc.

Joshua Zoepfel, Research Associate, Noble Capital Markets, Inc.

Refer to the full report for the price target, fundamental analysis, and rating.

Cab Structures. Yesterday, after the market close, Commercial Vehicle Group (CVG) announced the sale of its Kings Mountain, NC Cab Structures business. This is another step in the Company’s strategic plan to lessen the impact of the highly cyclical Class 8 truck business.

Details. Net proceeds of the transaction are expected to be $40 million, with closure in the second half of 2024. We expect the majority of the net proceeds to be used for debt paydown and other general corporate purposes. CVG did not release unit financial performance, but we do expect management to update its full-year 2024 outlook to reflect the impact of the business unit divesture during its 2Q24 earnings conference call on August 6th.


Get the Full Report

Equity Research is available at no cost to Registered users of Channelchek. Not a Member? Click ‘Join’ to join the Channelchek Community. There is no cost to register, and we never collect credit card information.

This Company Sponsored Research is provided by Noble Capital Markets, Inc., a FINRA and S.E.C. registered broker-dealer (B/D).

*Analyst certification and important disclosures included in the full report. NOTE: investment decisions should not be based upon the content of this research summary. Proper due diligence is required before making any investment decision. 

ACCO Brands (ACCO) – Reports 2Q24 Results


Friday, August 02, 2024

ACCO Brands Corporation is one of the world’s largest designers, marketers and manufacturers of branded academic, consumer and business products. Our widely recognized brands include AT-A-GLANCE®, Esselte®, Five Star®, GBC®, Kensington®, Leitz®, Mead®, PowerA®, Quartet®, Rapid®, Rexel®, Swingline®, Tilibra®, and many others. Our products are sold in more than 100 countries around the world. More information about ACCO Brands, the Home of Great Brands Built by Great People, can be found at www.accobrands.com.

Joe Gomes, CFA, Managing Director, Equity Research Analyst, Generalist , Noble Capital Markets, Inc.

Joshua Zoepfel, Research Associate, Noble Capital Markets, Inc.

Refer to the full report for the price target, fundamental analysis, and rating.

2Q24 Results. Reported results continue to be impacted by soft demand for ACCO products. In addition, the previously disclosed exit of certain lower margin business, primarily in the back-to-school categories, and a one-time impairment charge related to goodwill and intangible assets negatively impacted reported results.

Details. Revenue of $438.3 million was down 11.2% on a reported basis y-o-y, with comp sales off 10.2%, reflecting softer global business and consumer demand, although computer accessories saw growth. We had projected revenue of $455 million, in-line with consensus. Reported operating loss was $111.2 million reflecting $165.2 million of non-cash impairment charges. Adjusted operating income was $64.6 million, down from $66.2 million in 2Q23. GAAP net loss was $125.2 million, or $1.29/sh, with adjusted net income of $36.6 million, or $0.37/sh. In 2Q23, ACCO reported net income of $26.4 million, or $0.27/sh, and adjusted net income of $36.5 million, or $0.38/sh.


Get the Full Report

Equity Research is available at no cost to Registered users of Channelchek. Not a Member? Click ‘Join’ to join the Channelchek Community. There is no cost to register, and we never collect credit card information.

This Company Sponsored Research is provided by Noble Capital Markets, Inc., a FINRA and S.E.C. registered broker-dealer (B/D).

*Analyst certification and important disclosures included in the full report. NOTE: investment decisions should not be based upon the content of this research summary. Proper due diligence is required before making any investment decision. 

Release – FAT Brands Inc. Reports Second Quarter 2024 Financial Results

Research News and Market Data on FAT

LOS ANGELES, July 31, 2024 (GLOBE NEWSWIRE) — FAT (Fresh. Authentic. Tasty.) Brands Inc. (NASDAQ: FAT) (“FAT Brands” or the “Company”) today reported financial results for the fiscal second quarter ended June 30, 2024.

“Over the last three years, we have grown the FAT Brands portfolio to 18 iconic restaurant brands with approximately 2,300 units across 40 countries and 49 U.S. states,” said Andy Wiederhorn, Chairman of FAT Brands. “We have opened 45 restaurants year to date, including 24 that opened during the second quarter, and plan to open over 120 new restaurants in 2024. We are seeing strong new franchisee activity as well as continued demand from existing franchise partners to develop other brands within our portfolio and heightened interest from our franchise partners who are eager to explore additional co-branding opportunities that leverage synergies within our brand offerings.”

Ken Kuick, Co-Chief Executive Officer of FAT Brands, commented, “We have signed over 180 development deals year to date, compared to 226 deals for the entirety of 2023, bringing our current pipeline to approximately 1,100 locations.” Kuick continued, “Continuing in 2024 is our focus on the expansion of Twin Peaks. We opened four new lodges during the first half of 2024 and plan to open another 12 to 15 new Twin Peaks lodges in 2024, ending the year with approximately 125 lodges. Additionally, our first conversion of a Smokey Bones location is officially underway. We see this as the first of many sites we will use to fuel Twin Peaks’ fast-paced growth.”

Rob Rosen, Co-Chief Executive Officer of FAT Brands, concluded, “Opportunities in 2024 are abundant. Our long-term strategy is to create value through the organic expansion of our existing brands, acquire additional brands that strategically complement our portfolio, realize value from strategic divestments when appropriate to manage outstanding debt, and ultimately increase long-term value for our stakeholders.”

Fiscal Second Quarter 2024 Highlights

  • Total revenue improved 42.4% to $152.0 million compared to $106.8 million in the fiscal second quarter of 2023
    • System-wide sales growth of 8.6% in the fiscal second quarter of 2024 compared to the prior year fiscal quarter
      • Year-to-date system-wide same-store sales declined of 1.6% in the fiscal second quarter of 2024 compared to the prior year
    • 24 new store openings during the fiscal second quarter of 2024
  • Net loss of $39.4 million, or $2.43 per diluted share, compared to $7.1 million, or $0.53 per diluted share, in the fiscal second quarter of 2023
  • EBITDA(1) of $6.8 million compared to $25.6 million in the fiscal second quarter of 2023
  • Adjusted EBITDA(1) of $15.7 million compared to $23.1 million in the fiscal second quarter of 2023
  • Adjusted net loss(1) of $30.9 million, or $1.93 per diluted share, compared to adjusted net income(1) of $3.0 million, or

$0.08 per diluted share, in the fiscal second quarter of 2023

(1) EBITDA, adjusted EBITDA and adjusted net (loss) income are non-GAAP measures defined below, under “Non- GAAP Measures”. Reconciliation of GAAP net loss to EBITDA, adjusted EBITDA and adjusted net (loss) income are included in the accompanying financial tables.

Summary of Fiscal Second Quarter 2024 Financial Results

Total revenue increased $45.2 million, or 42.4%, in the second quarter of 2024 to $152.0 million compared to $106.8 million in the same period of 2023, driven by the acquisition of Smokey Bones in September 2023 and revenues from new restaurant openings.

Costs and expenses consist of general and administrative expense, cost of restaurant and factory revenues, depreciation and amortization, refranchising net loss and advertising fees. Costs and expenses increased $66.4 million, or 75.2%, in the second quarter of 2024 to $154.7 million compared to the same period in the prior year, primarily due to the acquisition of Smokey Bones in September 2023 and increased activity from Company-owned restaurants and the Company’s factory.

General and administrative expense increased $19.6 million, or 197.2%, in the second quarter of 2024 compared to $9.9 million in the same period in the prior year, primarily due to the acquisition of Smokey Bones in September 2023 and the recognition of
$12.7 million in Employee Retention Credits during the second quarter of fiscal year 2023, partially offset by the recognition of
$2.1 million in Employee Retention Credits during the second quarter of fiscal year 2024.

Cost of restaurant and factory revenues was related to the operations of the company-owned restaurant locations and dough factory and increased $40.6 million, or 68.3%, in the second quarter of 2024, primarily due to the acquisition of Smokey Bones in September 2023 and higher company-owned restaurant sales.

Depreciation and amortization increased $3.2 million, or 45.1% in the second quarter of 2024 compared to the same period in the prior year, primarily due to the acquisition of Smokey Bones in September 2023 and depreciation of new property and equipment at company-owned restaurant locations.

Refranchising net loss in the second quarter of 2024 of $0.2 million was comprised of $0.5 million in net loss related to the sale or closure of refranchised restaurants, offset by $0.3 million in restaurant food sales, net of operating costs. Refranchising net loss in the second quarter of 2023 of $0.2 million was comprised of $0.2 million in restaurant operating costs, net of food sales.

Advertising expenses increased $3.0 million in the second quarter of 2024 compared to the prior year period, primarily due to the acquisition of Smokey Bones in September 2023. Additionally, these expenses vary in relation to advertising revenues.

Total other expense, net, for the second quarter of 2024 and 2023 was $34.8 million and $24.2 million, respectively, which is inclusive of interest expense of $34.0 million and $24.3 million, respectively. This increase is primarily due to new debt issuances.

Adjusted net loss(1) of $30.9 million, or $1.93 per diluted share, compared to adjusted net income(1) of $3.0 million, or $0.08 per diluted share, in the fiscal second quarter of 2023.

Key Financial Definitions

New store openings – The number of new store openings reflects the number of stores opened during a particular reporting period. The total number of new stores per reporting period and the timing of stores openings has, and will continue to have, an impact on our results.

Same-store sales growth – Same-store sales growth reflects the change in year-over-year sales for the comparable store base, which we define as the number of stores open and in the FAT Brands system for at least one full fiscal year. For stores that were temporarily closed, sales in the current and prior period are adjusted accordingly. Given our focused marketing efforts and public excitement surrounding each opening, new stores often experience an initial start-up period with considerably higher than average sales volumes, which subsequently decrease to stabilized levels after three to six months. Additionally, when we acquire a brand, it may take several months to integrate fully each location of said brand into the FAT Brands platform. Thus, we do not include stores in the comparable base until they have been open and in the FAT Brands system for at least one full fiscal year.

System-wide sales growth – System wide sales growth reflects the percentage change in sales in any given fiscal period compared to the prior fiscal period for all stores in that brand only when the brand is owned by FAT Brands. Because of

acquisitions, new store openings and store closures, the stores open throughout both fiscal periods being compared may be different from period to period.

Conference Call and Webcast

FAT Brands will host a conference call and webcast to discuss its fiscal second quarter 2024 financial results today at 5:00 PM ET. Hosting the conference call and webcast will be Andy Wiederhorn, Chairman of the Board, and Ken Kuick, Co-Chief Executive Officer and Chief Financial Officer.

The conference call can be accessed live over the phone by dialing 1-844-826-3035 from the U.S. or 1-412-317-5195 internationally. A replay will be available after the call until Wednesday, August 21, 2024, and can be accessed by dialing 1-844-512-2921 from the U.S. or 1-412-317-6671 internationally. The passcode is 10189773. The webcast will be available at www.fatbrands.com under the “Investors” section and will be archived on the site shortly after the call has concluded.

About FAT (Fresh. Authentic. Tasty.) Brands

FAT Brands (NASDAQ: FAT) is a leading global franchising company that strategically acquires, markets, and develops fast casual, quick-service, casual dining, and polished casual dining concepts around the world. The Company currently owns 18 restaurant brands: Round Table Pizza, Fatburger, Marble Slab Creamery, Johnny Rockets, Fazoli’s, Twin Peaks, Smokey Bones, Great American Cookies, Hot Dog on a Stick, Buffalo’s Cafe & Express, Hurricane Grill & Wings, Pretzelmaker, Elevation Burger, Native Grill & Wings, Yalla Mediterranean and Ponderosa and Bonanza Steakhouses and franchises and owns approximately 2,300 units worldwide. For more information, please visit www.fatbrands.com.

Forward-Looking Statements

This press release contains forward-looking statements within the meaning of the Private Securities Litigation Reform Act of 1995, including statements relating to the future financial and operating results of the Company, the timing and performance of new store openings, our ability to conduct future accretive acquisitions and our pipeline of new store locations. Forward- looking statements generally use words such as “expect,” “foresee,” “anticipate,” “believe,” “project,” “should,” “estimate,” “will,” “plans,” “forecast,” and similar expressions, and reflect our expectations concerning the future. Forward-looking statements are subject to significant business, economic and competitive risks, uncertainties and contingencies, many of which are difficult to predict and beyond our control, which could cause our actual results to differ materially from the results expressed or implied in such forward-looking statements. We refer you to the documents that we file from time to time with the Securities and Exchange Commission, such as our reports on Form 10-K, Form 10-Q and Form 8-K, for a discussion of these and other risks and uncertainties that could cause our actual results to differ materially from our current expectations and from the forward-looking statements contained in this press release. We undertake no obligation to update any forward-looking statements to reflect events or circumstances occurring after the date of this press release.

Non-GAAP Measures (Unaudited)

This press release includes the non-GAAP financial measures of EBITDA, adjusted EBITDA and adjusted net (loss) income.

EBITDA is defined as earnings before interest, taxes, and depreciation and amortization. We use the term EBITDA, as opposed to income from operations, as it is widely used by analysts, investors, and other interested parties to evaluate companies in our industry. We believe that EBITDA is an appropriate measure of operating performance because it eliminates the impact of expenses that do not relate to business performance. EBITDA is not a measure of our financial performance or liquidity that is determined in accordance with generally accepted accounting principles (“GAAP”), and should not be considered as an alternative to net loss as a measure of financial performance or cash flows from operations as measures of liquidity, or any other performance measure derived in accordance with GAAP.

Adjusted EBITDA is defined as EBITDA (as defined above), excluding expenses related to acquisitions, refranchising loss, impairment charges, and certain non-recurring or non-cash items that the Company does not believe directly reflect its core operations and may not be indicative of the Company’s recurring business operations.

Adjusted net (loss) income is a supplemental measure of financial performance that is not required by or presented in accordance with GAAP. Adjusted net (loss) income is defined as net (loss) income plus the impact of adjustments and the tax effects of such adjustments. Adjusted net (loss) income is presented because we believe it helps convey supplemental information to investors regarding our performance, excluding the impact of special items that affect the comparability of results in past quarters to expected results in future quarters. Adjusted net (loss) income as presented may not be comparable to other similarly titled measures of other companies, and our presentation of adjusted net loss should not be construed as an inference that our future results will be unaffected by excluded or unusual items. Our management uses this non-GAAP financial measure to analyze changes in our underlying business from quarter to quarter based on comparable financial results.

Reconciliations of net loss presented in accordance with GAAP to EBITDA, adjusted EBITDA and adjusted net loss are set forth in the tables below.

Investor Relations:

ICR
Michelle Michalski
[email protected]
646-277-1224

Media Relations:

Erin Mandzik [email protected] 860-212-6509

FAT Brands Inc. Consolidated Statements of Operations

Click here for full report

FAT Brands (FAT) – Overview of 2Q24 Operating Results


Thursday, August 01, 2024

FAT Brands (NASDAQ: FAT) is a leading global franchising company that strategically acquires, markets, and develops fast casual, quick-service, casual dining, and polished casual dining concepts around the world. The Company currently owns 17 restaurant brands: Round Table Pizza, Fatburger, Marble Slab Creamery, Johnny Rockets, Fazoli’s, Twin Peaks, Great American Cookies, Hot Dog on a Stick, Buffalo’s Cafe & Express, Hurricane Grill & Wings, Pretzelmaker, Elevation Burger, Native Grill & Wings, Yalla Mediterranean and Ponderosa and Bonanza Steakhouses, and franchises and owns over 2,300 units worldwide. For more information on FAT Brands, please visit www.fatbrands.com.

Joe Gomes, CFA, Managing Director, Equity Research Analyst, Generalist , Noble Capital Markets, Inc.

Joshua Zoepfel, Research Associate, Noble Capital Markets, Inc.

Refer to the full report for the price target, fundamental analysis, and rating.

Note: FAT Brands has entered into an Equity Distribution Agreement with Noble Capital Markets relating to the potential sale of up to $10.335 million of Class A common stock and/or 8.25% Series B Cumulative Preferred stock. As a result, this report will just focus on a review of FAT Brands’ second quarter operating results.

2Q24 Results. FAT’s 2Q24 results were very similar to 1Q24 results. While we had hoped for some sequential improvement, given the overall industry challenges seen so far this reporting season, relatively flat results are not too bad. Revenue totaled $152 million, flat sequentially and up 42.4% y-o-y. Adjusted EBITDA totaled $15.7 million versus $23.1 million last year, with the decline reflecting lower employee retention credits this quarter. FAT reported a net loss of $41.3 million, or $2.43 per share, compared to a loss of $8.7 million, or a loss of $0.53/sh in 2Q23.


Get the Full Report

Equity Research is available at no cost to Registered users of Channelchek. Not a Member? Click ‘Join’ to join the Channelchek Community. There is no cost to register, and we never collect credit card information.

This Company Sponsored Research is provided by Noble Capital Markets, Inc., a FINRA and S.E.C. registered broker-dealer (B/D).

*Analyst certification and important disclosures included in the full report. NOTE: investment decisions should not be based upon the content of this research summary. Proper due diligence is required before making any investment decision.