NEW YORK–(BUSINESS WIRE)– Perfect Corp. (NYSE: PERF) (“Perfect” or the “Company”), a global leader in providing augmented reality (“AR”) and artificial intelligence (“AI”) Software-as-a-Service (“SaaS”) solutions to beauty and fashion industries, today announced that it filed its annual report on Form 20-F for the fiscal year ended December 31, 2025. The annual report can be accessed under the SEC Filing section on the Company’s investor relations website at https://ir.perfectcorp.com.
The Company will provide a hard copy of its annual report containing the audited consolidated financial statements, free of charge, to its shareholders upon request. Requests should be directed to 14F, No. 98 Minquan Road, Xindian District, New Taipei City 231, Taiwan, or via email at [email protected].
About Perfect Corp.
Perfect Corp. (NYSE: PERF) leverages ‘Beautiful AI’ innovations to make our world more beautiful. As a pioneer and leader in the space, Perfect Corp. works with over 650 partners around the globe to empower brands to embrace the digital-first world by transforming shopping journeys through digital tech innovations. Perfect Corp.’s suite of enterprise solutions delivers synergistic, technology-driven experiences that facilitate sustainable, ultra-personalized, and engaging shopping journeys through hyper-realistic virtual try-ons, AI-powered skin analyses, personalized product recommendation tools and many more Beautiful AI innovations. For more information, visit https://ir.perfectcorp.com.
TONMYA™ (cyclobenzaprine HCl sublingual tablets) launched November 17, 2025, for the treatment of fibromyalgia; through February 27, 2026, more than 1,500 healthcare providers have prescribed TONMYA to patients, approximately 2,500 patients have initiated treatment with TONMYA, and cumulative prescriptions totaled approximately 4,200
Expect to initiate U.S. field study in 2027 for TNX-4800 for seasonal prevention of Lyme disease pending FDA clearance
Completed $20.0 million registered direct offering with Point72 on December 29, 2025
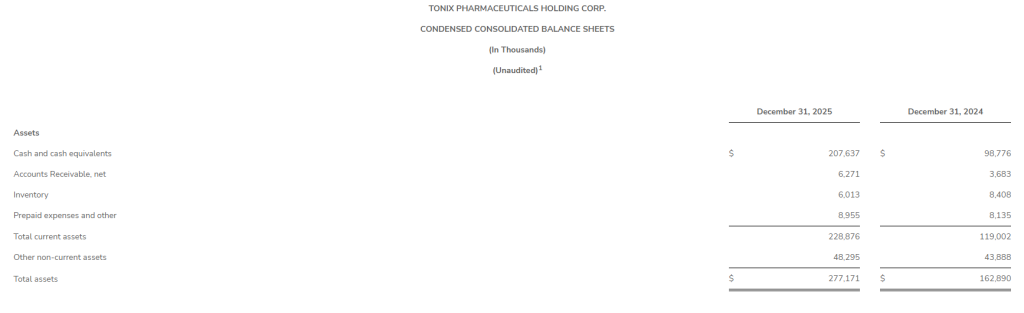
Approximately $207.6 million in cash and cash equivalents as of December 31, 2025
BERKELEY HEIGHTS, N.J., March 12, 2026 (GLOBE NEWSWIRE) — Tonix Pharmaceuticals Holding Corp. (Nasdaq: TNXP) (“Tonix” or the “Company”), a fully integrated, commercial biotechnology company, today announced financial results for the fourth quarter and full year ended December 31, 2025, and provided an overview of recent operational highlights.
“2025 was transformational for Tonix as we achieved FDA approval and began the U.S. commercial launch of TONMYA, our first fully in-house developed product and the first new medicine approved for fibromyalgia in more than 15 years,” said Seth Lederman, M.D., Chief Executive Officer of Tonix Pharmaceuticals. “TONMYA is a non-opioid analgesic designed for long-term, once-daily bedtime dosing. We believe TONMYA now provides an alternative medicine for the approximately 10 million adults in the U.S. who suffer from fibromyalgia. We have the capabilities to engage healthcare providers and patients, having launched the product and an approximately 90-member salesforce. Early prescription trends reflect favorable prescriber uptake and repeat utilization consistent with our internal launch expectations. Our experienced commercial team is committed to growing awareness and adoption, facilitating patient access, and obtaining payer coverage as we strive to improve the fibromyalgia journey for patients and healthcare providers.”
Dr. Lederman continued, “We also meaningfully advanced our robust clinical pipeline in 2025. Tonix in-licensed TNX-4800, a long-acting human monoclonal antibody for the seasonal prevention of Lyme disease, for which there are no FDA-approved vaccines or prophylactics. This program, developed by researchers at UMass Chan Medical School, anchors our clinical-stage infectious disease pipeline, and we plan to discuss Phase 2/3 development with the FDA this year. An additional highlight includes FDA clearance of the Investigational New Drug application (IND) for HORIZON, a potentially pivotal Phase 2 study of TNX-102 SL (cyclobenzaprine HCl sublingual tablets) in major depressive disorder, which is expected to initiate enrollment in mid-2026. Looking ahead, our priorities are clear. We are driven to continue our momentum in 2026 as we focus on the successful commercialization of TONMYA, pipeline progress, and sustainable long-term value for patients and shareholders.”
Commercial Updates
TONMYA (cyclobenzaprine HCl sublingual tablets): a centrally acting, non-opioid analgesic for the treatment of fibromyalgia in adults
In August 2025, the U.S. FDA approved TONMYA for the treatment of fibromyalgia in adults, making it the first new prescription medicine approved for this indication in more than 15 years. The approval was based on two double-blind, randomized, placebo-controlled Phase 3 clinical trials of nearly 1,000 patients that demonstrated statistically significant reduction in daily pain scores compared to placebo.
On November 17, 2025, TONMYA became commercially available at pharmacies by prescription in the U.S. Approximately 90 sales representatives were deployed in the field in advance of the launch. Early prescription trends reflect favorable adoption rates by prescribers and patients, with prescription volumes increasing each full month post launch. Launch metrics for the period November 17, 2025–February 27, 2026 (launch-to-date), are as follows:
More than 1,500 healthcare providers have prescribed TONMYA to patients.
Approximately 2,500 patients have initiated treatment with TONMYA.
Cumulative prescriptions totaled approximately 4,200. This includes bridge prescriptions that are facilitated through the Company’s specialty pharmacy channel. Bridge prescriptions represent initial patient fills provided while coverage determinations are pending and do not immediately generate net product revenue.
The Company has contracted with existing wholesalers and specialty pharmacies for distribution and with companies to assist with prescription fulfillment and patient access. Tonix also has a robust patient access program and support services in place, including TONMYA savings card, copay assistance, and prior authorization support, intended to reduce access barriers during early commercialization.
The Company is prioritizing expanding payer engagement and establishing contracts with commercial payers, while also progressing discussions with Medicare and Medicaid.
Infectious Disease Pipeline TNX-4800 (anti-OspA mAb): long-acting human monoclonal antibody in development for the seasonal prevention of Lyme disease, which has no FDA-approved vaccines or prophylactics
In December 2025, Tonix announced plans to meet with the FDA in 2026 to explore Phase 2/3 development options, including a Phase 2 field study and a Phase 2 controlled human infection model (CHIM) study, which is also called a human challenge study. The Company expects to have GMP investigational product available for clinical testing in early 2027. Pending FDA clearances, the field study is expected to initiate enrollment in 2027 and the CHIM study in 2028.
Central Nervous System (CNS) Pipeline TNX-102 SL (cyclobenzaprine HCl sublingual tablets): in development for major depressive disorder (MDD)
In November 2025, the FDA cleared the IND for TNX-102 SL 5.6 mg for the treatment of MDD in adults. The IND clearance enables Tonix to proceed with the HORIZON study, a potentially pivotal Phase 2, 6-week, randomized, double-blind, placebo-controlled study of TNX-102 SL as a first-line monotherapy in adults with MDD. About 360 patients will be enrolled at approximately 30 U.S. sites, with the primary endpoint being the MADRS total score change from baseline at Week 6. Tonix plans to initiate enrollment in mid-2026.
Prior studies of TNX-102 SL in fibromyalgia and post-traumatic stress disorder (PTSD) showed promising signals for improvement of depressive symptoms. TNX-102 SL treatment has been associated with a low incidence of side effects common with traditional antidepressants, including weight gain, blood pressure changes, sexual dysfunction, and cognitive issues.
TNX-102 SL for the treatment of acute stress reaction (ASR) and acute stress disorder (ASD), and prophylaxis against development of PTSD
The U.S. Department of Defense-funded Optimizing Acute Stress Reaction Interventions (OASIS) trial is being conducted by the University of North Carolina under an investigator-initiated IND application. The OASIS trial examines the safety and efficacy of TNX-102 SL to reduce adverse posttraumatic neuropsychiatric sequelae among patients in the emergency department after a motor vehicle collision. Topline data is expected to be reported in the second half of 2026.
Immunology Pipeline TNX-1500 (dimeric Fc modified anti-CD40L, humanized monoclonal antibody): third generation anti-CD40L for prophylaxis of kidney transplant rejection and treatment of autoimmune disorders
In November 2025, Tonix announced a collaboration with Massachusetts General Hospital to advance a Phase 2 open-label, investigator-initiated clinical trial of TNX-1500 in kidney transplant recipients, planned for initiation mid-year 2026 pending FDA clearance of the IND. The study is expected to enroll five adult kidney transplant recipients.
In October 2025, Tonix presented an update at the Japan Society for Transplantation annual congress, highlighting Phase 1 safety and pharmacokinetic and pharmacodynamic results and outlining next steps toward Phase 2 evaluation in allogenic kidney transplantation.
Rare Disease Pipeline TNX-2900 (intranasal potentiated oxytocin): in development for Prader-Willi syndrome, with Orphan Drug designation as well as Rare Pediatric Disease designation that could make Tonix eligible for a Priority Review Voucher upon approval
In September 2025, Tonix announced plans to initiate a Phase 2, randomized, double-blind, placebo-controlled trial in children and adolescents with Prader-Willi syndrome. The study is expected to initiate in the first quarter of 2027.
Financial: Recent Highlights
Tonix had approximately $207.6 million of cash and cash equivalents as of December 31, 2025, compared to approximately $98.8 million as of December 31, 2024. Net cash used in operations was approximately $99.8 million for the full year ended December 31, 2025, compared to $60.9 million for the same period in 2024. Cash paid for capital expenditures for the full year ended December 31, 2025, were approximately $3.4 million compared to $0.1 million for the same period in 2024.
In December 2025, Tonix completed a $20.0 million registered direct offering with Point72 Asset Management. The net proceeds are being used to fund commercialization of marketed products, pipeline development, and general working capital. TD Cowen acted as sole placement agent for the offering. A.G.P./Alliance Global Partners acted as a financial advisor.
Subsequent to year-end, the Company has raised $8.6 million proceeds using its at-the-market (ATM) facility.
The Company believes that its cash resources at December 31, 2025, will meet its planned operating and capital expenditure requirements into the first quarter of 2027.
As of March 11, 2026, the Company had 13,405,401 shares of common stock outstanding.
Full Year 2025 Financial Results
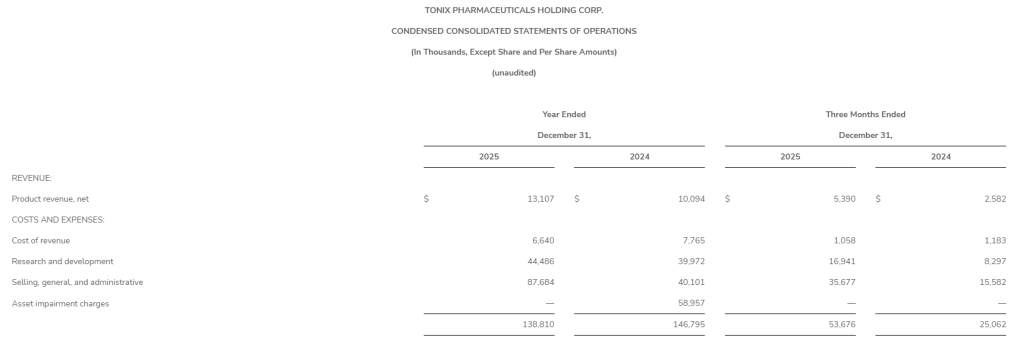
Net product revenue for the full year 2025 was approximately $13.1 million, compared to $10.1 million in 2024. Net revenue from sales of Zembrace®, SymTouch®, and Tosymra® for the full year 2025 was approximately $11.7 million, compared to $10.1 million in 2024. Net revenue from sales of TONMYA for the period from launch on November 17, 2025, to December 31, 2025, was approximately $1.4 million. Cost of sales for the full year 2025 was approximately $6.6 million, compared to $7.8 million in 2024.
Research and development expenses for the full year 2025 were approximately $44.5 million, compared to $40.0 million in 2024. This increase is predominately due to pipeline prioritization period over period, and increased headcount.
Selling, general, and administrative expenses for the full year 2025 were $87.7 million, compared to $40.1 million in 2024. The increase is predominately due to spending on sales and marketing related to TONMYA as well as increased headcount.
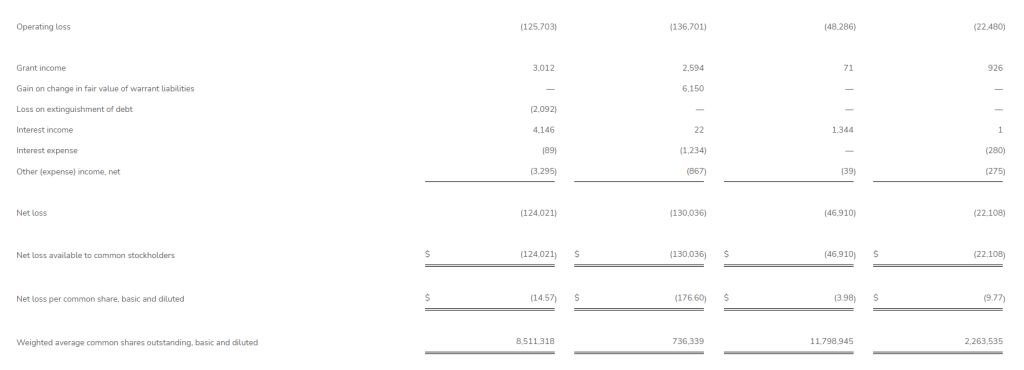
Net loss available to common stockholders was approximately $124.0 million, or $14.57 per basic and diluted share, for the full year 2025, compared to net loss available to common stockholders of $130.0 million, or $176.60 per basic and diluted share, in 2024. The basic and diluted weighted average common shares outstanding for the full year 2025 was 8,511,318 compared to 736,339 shares for 2024.
Fourth Quarter 2025 Financial Results
Net product revenue for the fourth quarter 2025 was approximately $5.4 million, compared to $2.6 million for the same period in 2024, and consisted of combined net sales of TONMYA™, Zembrace® SymTouch®, and Tosymra®. Cost of sales for the fourth quarter 2025 was approximately $1.1 million, compared to $1.2 million for the same period in 2024.
Research and development expenses for the fourth quarter 2025 were approximately $16.9 million, compared to $8.3 million for the same period in 2024. This increase is predominately due to pipeline prioritization period over period and increased headcount.
Selling, general, and administrative expenses for the fourth quarter 2025 were $35.7 million, compared to $15.6 million for the same period in 2024. The increase is predominately due to spending on sales and marketing related to TONMYA and increased headcount.
Net loss available to common stockholders was $46.9 million, or $3.98 per basic and diluted share, for the fourth quarter 2025, compared to net loss available to common stockholders of $22.1 million, or $9.77 per basic and diluted share, for the same period in 2024. The basic and diluted weighted average common shares outstanding for the fourth quarter 2025 was 11,798,945 compared to 2,263,535 shares for the same period in 2024.
Tonix Pharmaceuticals Holding Corp. Tonix Pharmaceuticals* is a fully-integrated, commercial-stage biotechnology company focused on central nervous system (CNS) and immunology treatments in areas of high unmet medical need. TONMYATM (cyclobenzaprine HCl sublingual tablets 2.8mg), the Company’s recently approved flagship medicine, is the first new treatment for fibromyalgia in more than 15 years. Tonix’s CNS commercial infrastructure supports its marketed products, including its acute migraine products, Zembrace® SymTouch® and Tosymra®. Tonix is maximizing the science behind TONMYA in Phase 2 clinical trials to evaluate its potential in major depressive disorder and acute stress disorder. In addition, the Company’s CNS portfolio includes TNX-2900, which is Phase 2 ready for the treatment of Prader-Willi syndrome, a rare disease. Tonix is also advancing a pipeline of immunology programs, including monoclonal antibody TNX-4800 for Lyme disease prophylaxis and TNX-1500, a third-generation CD40 ligand inhibitor for the prevention of kidney transplant rejection. To learn more, visit www.tonixpharma.com and follow the Company on LinkedIn and X.
*Tonix’s product development candidates are investigational new drugs or biologics; their efficacy and safety have not been established and have not been approved for any indication.
Zembrace SymTouch and Tosymra are registered trademarks of Tonix Medicines. TONMYA is a trademark of Tonix Pharma Limited. All other marks are property of their respective owners.
Forward Looking Statements Certain statements in this press release are forward-looking within the meaning of the Private Securities Litigation Reform Act of 1995 including those relating to the completion of the offering, the satisfaction of customary closing conditions, the intended use of proceeds from the offering and other statements that are predictive in nature. These statements may be identified by the use of forward-looking words such as “anticipate,” “believe,” “forecast,” “estimate,” “expect,” and “intend,” among others. These forward-looking statements are based on Tonix’s current expectations and actual results could differ materially as a result of a number of factors, including the ability of the Company to satisfy the conditions to the closing of the offering and the timing thereof, as well as those described in the Company’s Annual Report on Form 10-K for the year ended December 31, 2025, as filed with the SEC on March 12, 2026, and periodic reports filed with the SEC on or after the date thereof. Tonix does not undertake an obligation to update or revise any forward-looking statement. All of Tonix’s forward-looking statements are expressly qualified by all such risk factors and other cautionary statements. The information set forth herein speaks only as of the date thereof.
INDICATION TONMYA is indicated for the treatment of fibromyalgia in adults.
CONTRAINDICATIONS TONMYA is contraindicated: In patients with hypersensitivity to cyclobenzaprine or any inactive ingredient in TONMYA. Hypersensitivity reactions may manifest as an anaphylactic reaction, urticaria, facial and/or tongue swelling, or pruritus. Discontinue TONMYA if a hypersensitivity reaction is suspected. With concomitant use of monoamine oxidase (MAO) inhibitors or within 14 days after discontinuation of an MAO inhibitor. Hyperpyretic crisis seizures and deaths have occurred in patients who received cyclobenzaprine (or structurally similar tricyclic antidepressants) concomitantly with MAO inhibitors drugs. During the acute recovery phase of myocardial infarction, and in patients with arrhythmias, heart block or conduction disturbances, or congestive heart failure. In patients with hyperthyroidism.
WARNINGS AND PRECAUTIONS Embryofetal toxicity: Based on animal data, TONMYA may cause neural tube defects when used two weeks prior to conception and during the first trimester of pregnancy. Advise females of reproductive potential of the potential risk and to use effective contraception during treatment and for two weeks after the final dose. Perform a pregnancy test prior to initiation of treatment with TONMYA to exclude use of TONMYA during the first trimester of pregnancy.
Serotonin syndrome: Concomitant use of TONMYA with selective serotonin reuptake inhibitors (SSRIs), serotonin norepinephrine reuptake inhibitors (SNRIs), tricyclic antidepressants, tramadol, bupropion, meperidine, verapamil, or MAO inhibitors increases the risk of serotonin syndrome, a potentially life-threatening condition. Serotonin syndrome symptoms may include mental status changes, autonomic instability, neuromuscular abnormalities, and/or gastrointestinal symptoms. Treatment with TONMYA and any concomitant serotonergic agent should be discontinued immediately if serotonin syndrome symptoms occur and supportive symptomatic treatment should be initiated. If concomitant treatment with TONMYA and other serotonergic drugs is clinically warranted, careful observation is advised, particularly during treatment initiation or dosage increases.
Tricyclic antidepressant-like adverse reactions: Cyclobenzaprine is structurally related to TCAs. TCAs have been reported to produce arrhythmias, sinus tachycardia, prolongation of the conduction time leading to myocardial infarction and stroke. If clinically significant central nervous system (CNS) symptoms develop, consider discontinuation of TONMYA. Caution should be used when TCAs are given to patients with a history of seizure disorder, because TCAs may lower the seizure threshold. Patients with a history of seizures should be monitored during TCA use to identify recurrence of seizures or an increase in the frequency of seizures.
Atropine-like effects: Use with caution in patients with a history of urinary retention, angle-closure glaucoma, increased intraocular pressure, and in patients taking anticholinergic drugs.
CNS depression and risk of operating a motor vehicle or hazardous machinery: TONMYA monotherapy may cause CNS depression. Concomitant use of TONMYA with alcohol, barbiturates, or other CNS depressants may increase the risk of CNS depression. Advise patients not to operate a motor vehicle or dangerous machinery until they are reasonably certain that TONMYA therapy will not adversely affect their ability to engage in such activities. Oral mucosal adverse reactions: In clinical studies with TONMYA, oral mucosal adverse reactions occurred more frequently in patients treated with TONMYA compared to placebo. Advise patients to moisten the mouth with sips of water before administration of TONMYA to reduce the risk of oral sensory changes (hypoesthesia). Consider discontinuation of TONMYA if severe reactions occur.
ADVERSE REACTIONS The most common adverse reactions (incidence ≥2% and at a higher incidence in TONMYA-treated patients compared to placebo-treated patients) were oral hypoesthesia, oral discomfort, abnormal product taste, somnolence, oral paresthesia, oral pain, fatigue, dry mouth, and aphthous ulcer.
DRUG INTERACTIONS MAO inhibitors: Life-threatening interactions may occur.
Other serotonergic drugs: Serotonin syndrome has been reported.
CNS depressants: CNS depressant effects of alcohol, barbiturates, and other CNS depressants may be enhanced.
Tramadol: Seizure risk may be enhanced. Guanethidine or other similar acting drugs: The antihypertensive action of these drugs may be blocked.
USE IN SPECIFIC POPULATIONS Pregnancy: Based on animal data, TONMYA may cause fetal harm when administered to a pregnant woman. The limited amount of available observational data on oral cyclobenzaprine use in pregnancy is of insufficient quality to inform a TONMYA-associated risk of major birth defects, miscarriage, or adverse maternal or fetal outcomes. Advise pregnant women about the potential risk to the fetus with maternal exposure to TONMYA and to avoid use of TONMYA two weeks prior to conception and through the first trimester of pregnancy. Report pregnancies to the Tonix Medicines, Inc., adverse-event reporting line at 1-888-869-7633 (1-888-TNXPMED).
Lactation: A small number of published cases report the transfer of cyclobenzaprine into human milk in low amounts, but these data cannot be confirmed. There are no data on the effects of cyclobenzaprine on a breastfed infant, or the effects on milk production. The developmental and health benefits of breastfeeding should be considered along with the mother’s clinical need for TONMYA and any potential adverse effects on the breastfed child from TONMYA or from the underlying maternal condition.
Pediatric use: The safety and effectiveness of TONMYA have not been established.
Geriatric patients: Of the total number of TONMYA-treated patients in the clinical trials in adult patients with fibromyalgia, none were 65 years of age and older. Clinical trials of TONMYA did not include sufficient numbers of patients 65 years of age and older to determine whether they respond differently from younger adult patients.
Hepatic impairment: The recommended dosage of TONMYA in patients with mild hepatic impairment (HI) (Child Pugh A) is 2.8 mg once daily at bedtime, lower than the recommended dosage in patients with normal hepatic function. The use of TONMYA is not recommended in patients with moderate HI (Child Pugh B) or severe HI (Child Pugh C). Cyclobenzaprine exposure (AUC) was increased in patients with mild HI and moderate HI compared to subjects with normal hepatic function, which may increase the risk of TONMYA-associated adverse reactions.
Please see additional safety information in the full Prescribing Information. To report suspected adverse reactions, contact Tonix Medicines, Inc. at 1-888-869-7633, or the FDA at 1-800-FDA-1088 or www.fda.gov/medwatch.
Indication and Usage Zembrace® SymTouch® (sumatriptan succinate) injection (Zembrace) and Tosymra® (sumatriptan) nasal spray are prescription medicines used to treat acute migraine headaches with or without aura in adults who have been diagnosed with migraine.
Zembrace and Tosymra are not used to prevent migraines. It is not known if Zembrace or Tosymra are safe and effective in children under 18 years of age.
Important Safety Information Zembrace and Tosymra can cause serious side effects, including heart attack and other heart problems, which may lead to death. Stop use and get emergency help if you have any signs of a heart attack:
discomfort in the center of your chest that lasts for more than a few minutes or goes away and comes back
severe tightness, pain, pressure, or heaviness in your chest, throat, neck, or jaw
pain or discomfort in your arms, back, neck, jaw or stomach
shortness of breath with or without chest discomfort
breaking out in a cold sweat
nausea or vomiting
feeling lightheaded
Zembrace and Tosymra are not for people with risk factors for heart disease (high blood pressure or cholesterol, smoking, overweight, diabetes, family history of heart disease) unless a heart exam shows no problem.
Do not use Zembrace or Tosymra if you have:
history of heart problems
narrowing of blood vessels to your legs, arms, stomach, or kidney (peripheral vascular disease)
uncontrolled high blood pressure
hemiplegic or basilar migraines. If you are not sure if you have these, ask your provider.
had a stroke, transient ischemic attacks (TIAs), or problems with blood circulation
severe liver problems
taken any of the following medicines in the last 24 hours: almotriptan, eletriptan, frovatriptan, naratriptan, rizatriptan, ergotamines, or dihydroergotamine. Ask your provider for a list of these medicines if you are not sure.
are taking certain antidepressants, known as monoamine oxidase (MAO)-A inhibitors or it has been 2 weeks or less since you stopped taking a MAO-A inhibitor. Ask your provider for a list of these medicines if you are not sure.
an allergy to sumatriptan or any of the components of Zembrace or Tosymra
Tell your provider about all of your medical conditions and medicines you take, including vitamins and supplements.
Zembrace and Tosymra can cause dizziness, weakness, or drowsiness. If so, do not drive a car, use machinery, or do anything where you need to be alert.
Zembrace and Tosymra may cause serious side effects including:
changes in color or sensation in your fingers and toes
sudden or severe stomach pain, stomach pain after meals, weight loss, nausea or vomiting, constipation or diarrhea, bloody diarrhea, fever
cramping and pain in your legs or hips; feeling of heaviness or tightness in your leg muscles; burning or aching pain in your feet or toes while resting; numbness, tingling, or weakness in your legs; cold feeling or color changes in one or both legs or feet
increased blood pressure including a sudden severe increase even if you have no history of high blood pressure
medication overuse headaches from using migraine medicine for 10 or more days each month. If your headaches get worse, call your provider.
serotonin syndrome, a rare but serious problem that can happen in people using Zembrace or Tosymra, especially when used with anti-depressant medicines called SSRIs or SNRIs. Call your provider right away if you have: mental changes such as seeing things that are not there (hallucinations), agitation, or coma; fast heartbeat; changes in blood pressure; high body temperature; tight muscles; or trouble walking.
hives (itchy bumps); swelling of your tongue, mouth, or throat
seizures even in people who have never had seizures before
The most common side effects of Zembrace and Tosymra include: pain and redness at injection site (Zembrace only); tingling or numbness in your fingers or toes; dizziness; warm, hot, burning feeling to your face (flushing); discomfort or stiffness in your neck; feeling weak, drowsy, or tired; application site (nasal) reactions (Tosymra only) and throat irritation (Tosymra only).
Tell your provider if you have any side effect that bothers you or does not go away. These are not all the possible side effects of Zembrace and Tosymra. For more information, ask your provider.
This is the most important information to know about Zembrace and Tosymra but is not comprehensive. For more information, talk to your provider and read the Patient Information and Instructions for Use. You can also visit https://www.tonixpharma.com or call 1-888-869-7633.
You are encouraged to report adverse effects of prescription drugs to the FDA. Visit www.fda.gov/medwatch, or call 1-800-FDA-1088.
Peer-Reviewed Article Describes Clinical and Immunologic Rationale for Dual-Antigen MVA-Based Vaccine Designed to Address Limitations of First-Generation COVID-19 Vaccines in Highly Vulnerable Populations
ATLANTA, GA – March 12, 2026 – GeoVax Labs, Inc. (Nasdaq: GOVX), a clinical-stage biotechnology company developing vaccines and immunotherapies for infectious diseases and solid tumors, today announced the publication of a peer-reviewed article describing its next-generation COVID-19 vaccine candidate, GEO-CM04S1, in Medical Research Archives, the journal of the European Society of Medicine.
The article, titled “GEO-CM04S1: A Dual-Antigen COVID-19 Vaccine for Immunocompromised Patients,” provides a comprehensive review of the vaccine’s scientific rationale, preclinical studies, and clinical findings supporting its development as a vaccine designed specifically to protect immunocompromised individuals who often respond poorly to currently authorized COVID-19 vaccines.
The publication highlights how GEO-CM04S1’s dual-antigen design (Spike + Nucleocapsid) delivered via a Modified Vaccinia Ankara (MVA) viral vector is intended to generate antibody and T-cell responses that are both broad and durable, addressing limitations in such vulnerable populations of single-antigen vaccines that primarily target the spike protein.
The publication discusses how next-generation vaccines designed to stimulate more robust and durable cellular immunity may offer improved protection for these high-risk populations.
Scientific Highlights from the Publication
Key findings summarized in the publication include:
1. Dual-Antigen Design to Enhance Immune Breadth: GEO-CM04S1 expresses both the spike (S) and nucleocapsid (N) proteins of SARS-CoV-2, allowing the vaccine to stimulate immune responses against conserved viral targets that are less susceptible to mutation and immune escape.
2. Robust T-Cell Responses: Preclinical and clinical data show the vaccine induces strong CD4+ and CD8+ T-cell responses, which are critical for controlling viral infection and reducing progression to severe disease.
3. Favorable Safety and Immunogenicity: Early clinical studies demonstrated a benign safety profile and strong immunologic responses, including seroconversion and cellular immune activation across multiple dose levels.
4. Encouraging Results in Immunocompromised Patients: Early readouts from ongoing Phase 2 clinical trials in patients with hematologic malignancies receiving cell transplants, and individuals with chronic lymphocytic leukemia, indicate the vaccine can generate durable immune responses even in patients with impaired immune systems.
David Dodd, Chairman and Chief Executive Officer of GeoVax, stated: “This publication reinforces the scientific rationale for GEO-CM04S1 as a purpose-built vaccine for immunocompromised populations that remain inadequately protected by current COVID-19 vaccines. An estimated 40+ million patients in the U.S. are considered immunocompromised, including patients with cancer, transplant recipients, individuals receiving immunosuppressive therapies, and those with chronic diseases. These individuals may fail to mount adequate immune responses following vaccination and remain at higher risk of severe COVID-19 outcomes. Worldwide, an estimated 400 million patients have such weakened immune systems, rendering them at risk of severe infection, hospitalization and potential death.”
Mark J. Newman, PhD, Chief Scientific Officer of GeoVax and co-author of the publication, added: “A growing body of evidence demonstrates that strong and early T-cell responses play a critical role in controlling SARS-CoV-2 infection and preventing severe disease. GEO-CM04S1 was designed specifically to stimulate these responses, which may be particularly important for immunocompromised individuals who often fail to generate adequate antibody responses to existing vaccines. The MVA vector platform provides an ideal backbone for next-generation vaccines due to its ability to safely induce durable humoral and cellular immunity. Our dual-antigen strategy also expands immune recognition beyond the spike protein, and data from small animal studies indicates efficacy against variants is induced, reducing the need to continually update vaccines.”
About GEO-CM04S1
GEO-CM04S1 is a dual-antigen Modified Vaccinia Ankara (MVA)-vectored COVID-19 vaccine designed to induce durable T-cell and antibody responses against SARS-CoV-2.
The vaccine is currently being evaluated in multiple Phase 2 clinical trials, including:
Primary vaccination in immunocompromised individuals
Booster vaccination in patients with chronic lymphocytic leukemia (CLL)
The vaccine’s multi-antigen design and viral vector platform are intended to provide broader, more durable immune protection and improved efficacy in populations where first-generation vaccines have demonstrated reduced effectiveness.
About GeoVax
GeoVax Labs, Inc. is a clinical-stage biotechnology company focused on the development of vaccines and immunotherapies addressing high-consequence infectious diseases and solid tumor cancers. GeoVax’s priority program is GEO-MVA, a Modified Vaccinia Ankara (MVA)–based vaccine targeting mpox and smallpox. The program is advancing under an expedited regulatory pathway, with plans to initiate a pivotal Phase 3 clinical trial in the second half of 2026, to address critical global needs for expanded orthopoxvirus vaccine supply and biodefense preparedness. In oncology, GeoVax is developing Gedeptin®, a gene-directed enzyme prodrug therapy (GDEPT) designed to enhance immune checkpoint inhibitor activity. Gedeptin has completed a multicenter Phase 1/2 clinical trial in advanced head and neck cancer and is being advanced into combination strategies, including planned neoadjuvant and first-line settings. GeoVax’s broader pipeline includes the development of GEO-CM04S1, a next-generation COVID-19 vaccine candidate being evaluated in immunocompromised and other patient populations. GeoVax maintains a global intellectual property portfolio supporting its infectious disease and oncology programs and continues to evaluate strategic partnerships and funding opportunities aligned with its development priorities. For more information, visit www.geovax.com.
Forward-Looking Statements
This release contains forward-looking statements regarding GeoVax’s business plans. The words “believe,” “look forward to,” “may,” “estimate,” “continue,” “anticipate,” “intend,” “should,” “plan,” “could,” “target,” “potential,” “is likely,” “will,” “expect” and similar expressions, as they relate to us, are intended to identify forward-looking statements. We have based these forward-looking statements largely on our current expectations and projections about future events and financial trends that we believe may affect our financial condition, results of operations, business strategy and financial needs. Actual results may differ materially from those included in these statements due to a variety of factors, including whether: GeoVax is able to obtain acceptable results from ongoing or future clinical trials of its investigational products, GeoVax’s immuno-oncology products and preventative vaccines can provoke the desired responses, and those products or vaccines can be used effectively, GeoVax’s viral vector technology adequately amplifies immune responses to cancer antigens, GeoVax can develop and manufacture its immuno-oncology products and preventative vaccines with the desired characteristics in a timely manner, GeoVax’s immuno-oncology products and preventative vaccines will be safe for human use, GeoVax’s vaccines will effectively prevent targeted infections in humans, GeoVax’s immuno-oncology products and preventative vaccines will receive regulatory approvals necessary to be licensed and marketed, GeoVax raises required capital to complete development, there is development of competitive products that may be more effective or easier to use than GeoVax’s products, GeoVax will be able to enter into favorable manufacturing and distribution agreements, and other factors, over which GeoVax has no control.
Further information on our risk factors is contained in our periodic reports on Form 10-Q and Form 10-K that we have filed and will file with the SEC. Any forward-looking statement made by us herein speaks only as of the date on which it is made. Factors or events that could cause our actual results to differ may emerge from time to time, and it is not possible for us to predict all of them. We undertake no obligation to publicly update any forward-looking statement, whether as a result of new information, future developments or otherwise, except as may be required by law.
GROSSE POINTE FARMS, Mich., March 12, 2026 (GLOBE NEWSWIRE) — Saga Communications, Inc. (Nasdaq – SGA) (the “Company” or “Saga”) today reported that net revenue decreased 9.3% to $26.5 million for the quarter ended December 31, 2025 compared to $29.2 million for the same period last year. Digital revenue increased 25.8% to $4.3 million for the quarter ended December 31, 2025 compared to $3.5 million for the same period last year. Station operating expense decreased 1.9% for the quarter to $22.9 million compared to the same period last year. For the quarter, we had an operating loss of $9.5 million compared to operating income of $1.0 million for the same quarter last year and station operating income (a non-GAAP financial measure) decreased 38.7% to $3.6 million for the quarter ended December 31, 2025. Capital expenditures were $400 thousand for the quarter compared to $600 thousand for the same period last year. We had a net loss of $6.9 million for the quarter compared to net income of $1.3 million for the fourth quarter last year primarily as the result of an impairment charge disclosed below. Diluted loss per share was $1.07 in the fourth quarter of 2025 compared to income per share of $0.20 for the same period last year.
For the quarter, the Company recorded an impairment charge of $20.4 million based on an evaluation of goodwill and FCC license values. Without the impairment charge, operating income would have been $10.9 million for the quarter and net income would have been $8.2 million or $1.27 per share. The impairment was driven by lower than expected revenue growth seen in the fourth quarter of 2025 in our radio advertising and the industry as a whole which resulted in less than favorable market projections used in our annual impairment calculations performed in the fourth quarter. Following the impairment charge, no goodwill remains.
Net revenue decreased 5.1% to $107.1 million for the twelve-month period ended December 31, 2025 compared to $112.9 million for the same period last year. Digital revenue increased 19.1% to $16.9 million for the twelve-month period ended December 31, 2025 compared to $14.2 million for the same period last year. Station operating expense remained flat for the twelve-month period at $91.8 million compared to the same period last year. For the twelve-month period, we had an operating loss of $11.0 million compared to operating income of $2.4 million for the same period last year and station operating income (a non-GAAP financial measure) decreased 27.3% to $15.3 million. Capital expenditures for the twelve months were $3.0 million compared to $3.8 million for the same period last year. We had a net loss of $7.9 million for the twelve-month period ended December 31, 2025, compared to net income of $3.5 million for the same period last year primarily as the result of the impairment charge and the previously disclosed retroactive industry wide settlement with two music licensing organizations. Diluted loss per share was $1.22 for the twelve-months ended December 31, 2025 compared to income per share of $0.55 per share for the same period last year.
For the year ended December 31, 2025, the Company recorded an impairment charge of $20.4 million as reported above. Without the impairment charge, operating income would have been $9.4 million for the year and net income would have been $7.2 million or $1.11 per share.
For the year ended December 31, 2025, the Company recorded approximately $2.2 million in operating expenses that was the result of a settlement with two music licensing organizations (ASCAP and BMI) as a part of a retroactive industry wide rate adjustment from January 1, 2022 to December 31, 2025. Station operating expense would have decreased 2.0% for the year without this settlement. The impact to the quarter ended December 31, 2025 was approximately $135 thousand. Station operating income (a non-GAAP financial measure) would have been $3.7 million for the quarter and $17.6 million for the year ended December 31, 2025.
The Company had $254 thousand and $650 thousand in gross political revenue for the quarter and year ended December 31, 2025, respectively, compared to $2.0 million and $3.3 million, respectively, for the same periods last year, as is typical in non-election years. Excluding political revenue, gross revenue decreased 4.7% for the quarter and 3.6% for the year.
The Company closed on the sale of telecommunications towers and related property on October 17, 2025, recognizing a gain of $11.6 million. The total proceeds including both cash and non-cash was $15.1 million. The non-cash proceeds are the recognized value of the long-term, nominal cost leases we entered into as a part of the transaction as we continue to operate at each of the sites we sold. The net cash proceeds from the sale after expenses was $9.8 million. This does not include the approximately $400 thousand being held in an escrow account pending finalizing the landlord’s consent to the transfer of one final tower. We anticipate this transfer will take place in the second quarter of 2026. This transaction allowed the Company to monetize 24 owned towers that were not reaching the full potential of tower space leased to external tower space users. Additionally, the towers were monetized at a significantly higher valuation than was being recognized in the Company’s overall market valuation.
The Company paid a quarterly dividend of $0.25 per share on December 12, 2025. The aggregate value of the quarterly dividend was approximately $1.6 million. The Company declared a quarterly dividend of $0.25 per share on February 12, 2026 with a record date of February 26, 2026 and a payable date of March 20, 2026. With the most recent declared dividend, Saga will have paid over $143 million in dividends to shareholders since the first special dividend was paid in 2012.
The Company also repurchased 219,326 shares of its Class A Common Stock for $2.5 million during the year ended December 31, 2025.
The Company intends to pay regular quarterly cash dividends in the future. Consistent with its strategic objective of maintaining a strong balance sheet and with returning value to our shareholders, the Board of Directors will also continue to consider declaring special cash dividends, variable dividends and stock buybacks in the future.
The Company’s balance sheet reflects $31.8 million in cash and short-term investments as of December 31, 2025 and $31.5 million as of March 9, 2026. The Company expects to spend approximately $3.5 million to $4.5 million for capital expenditures during 2026.
Saga’s 2025 Fourth Quarter and Year-End conference call will be held on Thursday, March 12, 2026 at 11:00 a.m. Eastern Time. The dial-in number for the call is (973) 528-0008. Enter conference code 809825. A recording and transcript of the call will be posted to the Company’s website as soon as it is available after the call.
The Company requests that all parties that have a question that they would like to submit to the Company please email the inquiry by 10:00 a.m. on March 12, 2026 to [email protected]. The Company will discuss, during the limited period of the conference call, those inquiries it deems of general relevance and interest. Only inquiries made in compliance with the foregoing directions will be discussed during the call.
Saga utilizes certain financial measures that are not calculated in accordance with generally accepted accounting principles (GAAP) to assess its financial performance. The attached Selected Supplemental Financial Data tables disclose the Company’s reconciliation of non-GAAP measures: GAAP operating income (loss) to station operating income and GAAP net income (loss) to trailing twelve-month consolidated EBITDA as well as other financial data. Such non-GAAP measures include same station financial information, pro forma financial information, station operating income, trailing 12-month consolidated EBITDA, and leverage ratio. These non-GAAP measures are generally recognized by the broadcasting industry as measures of performance and are used by Saga to assess its financial performance including, but not limited to, evaluating individual station and market-level performance, evaluating overall operations, as a primary measure for incentive-based compensation of executives and other members of management and as a measure of financial position. Saga’s management believes these non-GAAP measures are used by analysts who report on the industry and by investors to provide meaningful comparisons between broadcasting groups, as well as an indicator of their market value. These measures are not measures of liquidity or of performance in accordance with GAAP and should be viewed as a supplement to and not as a substitute for the results of operations presented on a GAAP basis including net operating revenue, operating income, and net income. Reconciliations for all the non-GAAP financial measures to the most directly comparable GAAP measure are attached in the Selected Supplemental Financial Data tables.
This press release contains certain forward-looking statements within the meaning of the U.S. Private Securities Litigation Reform Act of 1995 that are based upon current expectations and involve certain risks and uncertainties. Words such as “will,” “may,” “believes,” “intends,” “expects,” “anticipates,” “guidance,” and similar expressions are intended to identify forward-looking statements. The material risks facing our business are described in the reports Saga periodically files with the U.S. Securities and Exchange Commission, including, in particular, Item 1A of our Annual Report on Form 10-K. Readers should note that forward-looking statements may be impacted by several factors, including global, national, and local economic changes and changes in the radio broadcast industry in general as well as Saga’s actual performance. Actual results may vary materially from those described herein and Saga undertakes no obligation to update any information contained herein that constitutes a forward-looking statement.
Saga is a media company whose business provides radio, digital, e-commerce, on-line news and non-traditional revenue initiatives. We provide services to national, regional and local advertisers to help them meet their growing advertising needs. For additional information, contact us at (313) 886-7070 or visit our website at www.sagacom.com
GLYFADA, Greece, March 12, 2026 (GLOBE NEWSWIRE) — Seanergy Maritime Holdings Corp. (the “Company” or “Seanergy”) (NASDAQ: SHIP) announced today that it has agreed to acquire two scrubber-fitted 181,500 dwt Capesize vessels to be constructed at a first-class shipyard in Japan and has entered into an agreement for the sale of the 2010-built M/V Squireship.
The transactions expand the Company’s newbuilding program to five vessels (four Capesizes and one Newcastlemax) totaling approximately $384.0 million and underscore its disciplined fleet renewal strategy, which focuses on reallocating capital from older vessels into modern, fuel-efficient tonnage with attractive delivery positions.
Acquisition of Two Japanese Newbuilding Capesizes
The Company entered into an agreement with an unaffiliated third party in Japan for the acquisition of a 181,500 dwt scrubber fitted Capesize newbuilding vessel with prompt delivery, constructed at a first-class Japanese Shipyard. The delivery is expected between the second and the third quarter of 2027.
In addition, the Company has entered into a 10-year bareboat-in contract for a second 181,500 dwt scrubber fitted Capesize dry bulk vessel to be constructed by the same first-class Japanese shipyard with delivery expected in the first quarter of 2029. Seanergy has the option to acquire the vessel starting at the end of year five until the end of the charter period.
The combined acquisition cost of the above vessels is estimated at approximately $158 million, assuming the exercise of the option to acquire the second vessel at the end of the 10-year period and excluding interest payments under the bareboat scheme.
The Company believes that securing a prompt 2027 delivery position from a top-tier Japanese yard represents a highly attractive strategic opportunity, given the limited availability of near-term construction slots and the strong expected demand for modern Capesize tonnage over the near and medium-term. In addition, the structure associated with the second Japanese Capesize vessel, provides Seanergy with advantageous fleet renewal optionality while maintaining capital flexibility.
Sale of M/V Squireship
Seanergy has agreed to sell the M/V Squireship, a 2010-built Capesize vessel constructed in South Korea with a cargo capacity of 170,018 dwt, to United Maritime Corporation, a related party, for a purchase price of $29.5 million, with delivery expected between end April to beginning of June 2026.
The transaction is expected to generate net cash proceeds of approximately $13.5 million after repayment of the associated debt, supporting the Company’s ongoing newbuilding program, while reducing Seanergy’s average fleet age. The vessel sale is expected to result in an accounting profit of around $4 million, which will be recorded in Seanergy’s second quarter financial results.
The transaction allows the Company to monetize the Squireship at an attractive market valuation. Following delivery, Seanergy will continue to provide technical and commercial management services to the vessel, facilitating the continuation of the vessel’s existing commercial employment.
Stamatis Tsantanis, the Company’s Chairman & Chief Executive Officer, stated:
“These transactions represent another step in the disciplined renewal of our fleet. By monetizing an older vessel at an attractive valuation and reinvesting in high-quality Japanese newbuildings with favorable delivery positions, we continue to enhance the long-term earnings capacity and efficiency of our fleet.
“Including our newbuilding orders in China, we expect to take delivery of five high-quality vessels with a total contract value of approximately $384 million, including three deliveries in mid-2027, one in mid-2028 and one in early-2029. We believe vessels delivering between 2027 and 2029 will be well positioned to benefit from strong Capesize fundamentals, an aging fleet and constrained vessel supply.
“Our strategy remains clear: reallocate capital from older assets into modern Capesize tonnage, maintain balance sheet discipline, and position the Company to capture long-term market upside. At the same time, we remain firmly committed to our capital return policy and expect to continue delivering meaningful returns to our shareholders.”
Commercial Performance Update
Further to the Company’s previous commercial updates provided in the FY 2025 Earnings Release, Seanergy has secured fixed rates for approximately 45% of its available operating days for the period Q2–Q4 2026, at an average gross daily rate of $29,300. These fixtures enhance forward earnings visibility while preserving meaningful exposure to market upside.
Sphinx – Economou Litigation Update
The Supreme Court of the Republic of the Marshall Islands affirmed the dismissal of the lawsuit brought by Sphinx Investment Corp., an affiliate of George Economou, upholding the prior decision of the High Court of the Republic of the Marshall Islands. The ruling brings this matter to a final resolution.
About Seanergy Maritime Holdings Corp.
Seanergy Maritime Holdings Corp. is a prominent pure-play Capesize ship-owner publicly listed in the U.S. Seanergy provides marine dry bulk transportation services through a modern fleet of Capesize vessels. The Company owns or finance leases 20 vessels (2 Newcastlemax and 18 Capesize) with an average age of approximately 14.7 years and an aggregate cargo carrying capacity of approximately 3,633,861 dwt. Following the sale of the M/V Squireship and the delivery of the newbuilding vessels, the Company will own or finance lease 24 vessels (3 Newcastlemax and 21 Capesize), with an aggregate cargo carrying capacity of approximately 4,400,343 dwt.
The Company is incorporated in the Republic of the Marshall Islands and has executive offices in Glyfada, Greece. The Company’s common shares trade on the Nasdaq Capital Market under the symbol “SHIP”. Please visit our company website at: www.seanergymaritime.com.
Forward-Looking Statements
This press release contains forward-looking statements (as defined in Section 27A of the Securities Act of 1933, as amended, and Section 21E of the Securities Exchange Act of 1934, as amended) concerning future events, including with respect to declaration of dividends, market trends and shareholder returns. Words such as “may”, “should”, “expects”, “intends”, “plans”, “believes”, “anticipates”, “hopes”, “estimates” and variations of such words and similar expressions are intended to identify forward-looking statements. These statements involve known and unknown risks and are based upon a number of assumptions and estimates, which are inherently subject to significant uncertainties and contingencies, many of which are beyond the control of the Company. Actual results differ materially from those expressed or implied by such forward-looking statements. Factors that could cause actual results to differ materially include, but are not limited to, the Company’s operating or financial results; the Company’s liquidity, including its ability to service its indebtedness; competitive factors in the market in which the Company operates; shipping industry trends, including charter rates, vessel values and factors affecting vessel supply and demand; future, pending or recent acquisitions and dispositions, business strategy, impacts of litigation, areas of possible expansion or contraction, and expected capital spending or operating expenses; risks associated with operations outside the United States; risks arising from trade disputes between the U.S. and China, including the re-imposition of reciprocal port fees; broader market impacts arising from trade disputes or war (or threatened war) or international hostilities, such as between the U.S. and Venezuela, Israel and Hamas or Iran, China and Taiwan and Russia and Ukraine; risks associated with the length and severity of pandemics; and other factors listed from time to time in the Company’s filings with the SEC, including its most recent annual report on Form 20-F. The Company’s filings can be obtained free of charge on the SEC’s website at www.sec.gov. Except to the extent required by law, the Company expressly disclaims any obligations or undertaking to release publicly any updates or revisions to any forward-looking statements contained herein to reflect any change in the Company’s expectations with respect thereto or any change in events, conditions or circumstances on which any statement is based.
DENVER–(BUSINESS WIRE)– The ONE Group Hospitality, Inc. (“The ONE Group” or the “Company”) (Nasdaq: STKS) today announced that Emanuel “Manny” Hilario, President and Chief Executive Officer, and Nicole Thaung, Chief Financial Officer, will host a conference call and webcast to discuss fourth quarter and fiscal year 2025 financial results on Friday, March 13, 2026, at 8:30 AM ET. A press release containing the fourth quarter and fiscal year 2025 financial results will be issued before market open that same morning.
The conference call can be accessed live over the phone by dialing 412-542-4186. A replay will be available after the call and can be accessed by dialing 412-317-6671; the passcode is 10206228. The replay will be available until Friday, March 27, 2026.
The webcast can be accessed from the Investor Relations tab of The ONE Group’s website at http://www.togrp.com/ under “News / Events”.
About The ONE Group
The ONE Group Hospitality, Inc. (Nasdaq: STKS) is an international restaurant company that develops and operates upscale and polished casual, high-energy restaurants and lounges and provides hospitality management services for hotels, casinos and other high-end venues both in the U.S. and internationally. The ONE Group is recognized as one of “America’s Greatest Companies” (NEWSWEEK, 2025) and Benihana honored as Forbes Best Brands for Value . The ONE Group’s focus is to be the global leader in Vibe Dining, and its primary restaurant brands and operations are:
STK, a modern twist on the American steakhouse concept with restaurants in major metropolitan cities in the U.S., Europe and the Middle East, featuring premium steaks, seafood and specialty cocktails in an energetic upscale atmosphere.
Benihana, an interactive dining destination with highly skilled chefs preparing food right in front of guests and served in an energetic atmosphere alongside fresh sushi and innovative cocktails. The Company franchises Benihanas in the U.S., Caribbean, Central America, and South America.
Samurai, an interactive dining experience located in sunny Miami, FL, provides a distinctive dining experience where skilled personal chefs masterfully perform the ancient art of teppanyaki right before your eyes.
Kona Grill, a polished casual, bar-centric grill concept with restaurants in the U.S., featuring American favorites, award-winning sushi, and specialty cocktails in an upscale casual atmosphere.
Salt Water Social is your gateway to the seven seas, featuring an array of signature and unique fresh seafood items, complemented by the highest quality beef dishes and elegant, delicious cocktails.
Benihana Express, a small footprint casual concept showcasing the best of Benihana but without teppanyaki tables or bar.
RA Sushi, a Japanese cuisine concept that offers a fun-filled, bar-forward, upbeat, and vibrant dining atmosphere with restaurants in the U.S. anchored by creative sushi, inventive drinks, and outstanding service.
ONE Hospitality, The ONE Group’s food and beverage hospitality services business develops, manages and operates premier restaurants and turnkey food and beverage services within high-end hotels and casinos currently operating venues in the U.S. and Europe.
Additional information about The ONE Group can be found at www.togrp.com.
PONTE VEDRA, Fla., March 12, 2026 (GLOBE NEWSWIRE) — Cadrenal Therapeutics, Inc. (Nasdaq: CVKD), a biopharmaceutical company developing innovative treatments for life-threatening immune and thrombotic conditions, today highlighted recent scientific findings demonstrating the potential of its first-in-class 12-lipoxygenase (12-LOX) inhibitor, CAD-1005, to target inflammatory consequences of obesity and Type 2 diabetes.
The study builds on prior animal research showing that inhibiting 12-LOX with CAD-1005 delays the onset of autoimmune diabetes in non-obese diabetic mice. The findings highlight 12-LOX as a key factor in obesity-associated inflammation and suggest that 12-LOX inhibition could be a therapeutic strategy to improve glucose homeostasis and peripheral inflammation in the setting of obesity and type 2 diabetes.
In the setting of obesity, 12-LOX overexpression leads to:
Adipocyte dysfunction following recruitment of pro-inflammatory macrophages into adipose tissue triggering an inflammatory reaction that impairs tissue insulin sensitivity.
Elevated 12-LOX activity in the pancreas causes oxidative stress and -cell dedifferentiation, hallmarks of Type 2 Diabetes progression.
In preclinical models, oral administration of CAD-1005 (formerly VLX-1005) demonstrated significant therapeutic benefits, including improved glycemic control, reduced pancreatic β-cell loss, reduced numbers of inflammatory cells in adipose (fat) and pancreatic tissues, and lower levels of pro-inflammatory cytokines in adipose tissues. Inhibiting 12-LOX acts as a selective “switch” to deactivate these pathways and interrupts a cycle of chronic inflammation, providing a dual benefit of restoring healthy metabolic signaling and protecting tissues from inflammatory damage.
Selective 12-LOX inhibition specifically targets important inflammatory signaling pathways that were previously difficult to reach, with potential applications across multiple areas. Unlike other treatments for obesity and diabetes, Cadrenal’s 12-LOX inhibitor is designed to block inflammatory signals in adipose tissues and the pancreas – key drivers of the metabolic derangements that accompany adiposity and diabetes. Cadrenal believes that CAD-1005 is the only product in clinical development that uses this mechanism to inhibit adipo-inflammatory signaling and potentially add to the benefits of existing GLP-1 obesity medications.
Cadrenal acquired the 12-LOX portfolio in December 2025. CAD-1005 is also being evaluated for suspected Heparin-Induced Thrombocytopenia (HIT), a severe pro-thrombotic reaction to heparin. The results of a recent Phase 2 trial demonstrated a reduction in thrombotic events in patients with HIT. Next-generation development includes CAD-2000, an orally bioavailable 12-LOX inhibitor.
“While our near-term priority remains the clinical development of CAD-1005 for HIT, these findings highlight the broader potential of 12-LOX inhibition in other inflammatory conditions,” said Quang X. Pham, CEO of Cadrenal Therapeutics. “We look forward to sharing our findings about 12-LOX in other disease areas with interested partners.”
About 12-LOX
Lipoxygenases are a family of enzymes involved in lipid metabolism that facilitate the incorporation of oxygen into polyunsaturated fatty acids. The enzymatic activity of 12-LOX ultimately produces 12-HETE, a lipid molecule that easily crosses cell membranes. Inside cells, 12-HETE promotes oxidative stress, while outside cells, it modulates various signaling pathways to regulate inflammation and provoke pro-inflammatory effects. In human blood, 12-LOX is primarily found in platelets and leukocytes; it is also overexpressed in the pancreas of patients with diabetes and in certain cancer cells. In HIT, 12-LOX plays a key role in platelet activation via the IgG receptor. Early efforts to develop 12-LOX inhibitors struggled because they lacked specificity for 12-LOX.
About CAD-1005
CAD-1005, an investigational therapy being evaluated for suspected HIT, is a potent, highly selective small molecule inhibitor of human 12-LOX. It is currently the only selective 12-LOX inhibitor in clinical development. CAD-1005 is designed to target 12-LOX specifically, a pathway crucial to the primary immune mechanisms that cause HIT. Unlike existing therapies for HIT, which mainly focus on preventing blood clots, this approach addresses the root cause of HIT. In preclinical models, CAD-1005 has been shown to prevent or treat HIT and stop the development of thrombocytopenia and blood clots. The drug has not been linked to increased bleeding in animals or healthy human volunteers. CAD-1005 has received Orphan Drug Designation (ODD) and Fast Track designation from the U.S. Food and Drug Administration, as well as orphan drug status from the European Medicines Agency.
About Cadrenal Therapeutics, Inc.
Cadrenal Therapeutics, Inc. (Nasdaq: CVKD) is a late-stage biopharmaceutical company advancing novel therapies for life-threatening immune and thrombotic conditions. Its lead program, CAD-1005, is a first-in-class 12-LOX inhibitor for the treatment of heparin-induced thrombocytopenia (HIT), a deadly immune-mediated thrombotic disorder. CAD-1005 has received Orphan Drug and Fast Track designations from the U.S. Food and Drug Administration and orphan drug status from the European Medicines Agency. Second-generation 12-LOX oral therapeutics are also under development for chronic indications.
The Company’s broader pipeline features tecarfarin, a late-stage oral vitamin K antagonist designed to prevent heart attacks, strokes, and deaths due to blood clots in patients requiring chronic anticoagulation, including for patients with end-stage kidney disease and left ventricular assist devices, and frunexian, a parenteral Factor XIa inhibitor intended for use in acute hospital settings.
Any statements in this press release about future expectations, plans, and prospects, as well as any other statements regarding matters that are not historical facts, may constitute “forward-looking statements.” The words “anticipate,” “believe,” “continue,” “could,” “estimate,” “expect,” “intend,” “may,” “plan,” “potentially,” “predict,” “project,” “should,” “target,” “will,” “would” and similar expressions are intended to identify forward-looking statements, although not all forward-looking statements contain these identifying words. These statements include Cadrenal developing innovative treatments for life-threatening immune and thrombotic conditions; CAD-1005 targeting inflammatory consequences of obesity and Type 2 diabetes; 12-LOX inhibition improving glucose homeostasis and peripheral inflammation in the setting of obesity and type 2 diabetes; 12-LOX inhibition having potential applications across multiple areas; Cadrenal’s 12-LOX inhibitor blocking inflammatory signals in adipose tissues and the pancreas – key drivers of the metabolic derangements that accompany adiposity and diabetes; CAD-1005 inhibiting adipo-inflammatory signaling and potentially add to the benefits of existing GLP-1 obesity medications; advancing the clinical development of CAD-1005 for the treatment of HIT; the development of CAD-2000, an orally bioavailable 12-LOX inhibitor; the broader potential of 12-LOX inhibition in other inflammatory conditions; sharing findings about 12-LOX in other disease areas with interested partners; CAD-1005 targeting 12-LOX specifically, a pathway crucial to the primary immune mechanisms that cause HIT, and addressing the root cause of HIT; CAD-1005 successfully preventing or treating HIT and stopping the development of thrombocytopenia and blood clots; Cadrenal advancing novel therapies for life-threatening immune and thrombotic conditions; Cadrenal developing second-generation 12-LOX oral therapeutics for chronic indications; tecarfarin preventing heart attacks, strokes, and deaths due to blood clots in patients requiring chronic anticoagulation, including for patients with end-stage kidney disease and left ventricular assist devices; and frunexian being used in acute hospital settings. Actual results may differ materially from those indicated by such forward-looking statements as a result of various important factors, including Cadrenal developing innovative treatments for life-threatening immune and thrombotic conditions; advancing the clinical development of CAD-1005 for the treatment of HIT; Cadrenal advancing novel therapies for life-threatening immune and thrombotic conditions; Cadrenal developing second-generation 12-LOX oral therapeutics for chronic indications; tecarfarin preventing heart attacks, strokes, and deaths due to blood clots in patients requiring chronic anticoagulation, including for patients with end-stage kidney disease and left ventricular assist devices; frunexian being used in acute hospital settings; Cadrenal’s ability to successfully complete clinical trials on time and achieve desired results and benefits as expected including support for CAD-1005’s potential to be a treatment option for HIT; Cadrenal’s ability to obtain regulatory approvals for commercialization of product candidates or to comply with ongoing regulatory requirements and the other risk factors described in the Company’s Annual Report on Form 10-K for the year ended December 31, 2024, and the Company’s subsequent filings with the Securities and Exchange Commission, including subsequent periodic reports on Quarterly Reports on Form 10-Q and Current Reports on Form 8-K. Any forward-looking statements contained in this press release speak only as of the date hereof and, except as required by federal securities laws, the Company specifically disclaims any obligation to update any forward-looking statement, whether as a result of new information, future events, or otherwise.
For more information, please contact: Cadrenal Therapeutics: Matthew Szot, CFO [email protected]
Full-year 2025 revenue increased 10% year-over-year to $116.6 million, within revised guidance range
Full year 2026 revenue guidance of $100.5 to $111.0 million
Entered into agreement to acquire Cullgen to gain targeted protein degradation platform and pipeline; transaction anticipated to close in the second quarter of 2026
Alignment with China’s Center for Drug Evaluation (CDE) on conditional approval filing and priority review eligibility for Hydronidone, subject to formal approval; New Drug Application (NDA) submission for conditional approval expected in the first half of 2026
Completed patient enrollment in the 52-week Phase 3 pirfenidone pneumoconiosis (PD) trial (272 patients across 18 sites)
Hydronidone U.S. Investigational New Drug (IND) application for MASH-associated liver fibrosis anticipated in 2026
SAN DIEGO, March 12, 2026 (GLOBE NEWSWIRE) — Gyre Therapeutics (Gyre or the Company) (Nasdaq: GYRE), an innovative, commercial-stage biopharmaceutical company dedicated to advancing fibrosis-first therapies across organ systems affected by chronic disease, today announced financial results for the fourth quarter and full year ended December 31, 2025 and provided a business update.
“2026 is expected to be a pivotal regulatory year for Gyre as we advance Hydronidone toward conditional approval in China following our alignment with China’s CDE,” said Ping Zhang, Executive Chairman and Interim Chief Executive Officer of Gyre Therapeutics. “Our planned NDA submission in the first half of 2026 underscores the strength of our Phase 3 data and the constructive progress achieved through regulatory engagement. In addition, we have completed enrollment in our 52-week Phase 3 pirfenidone trial in pneumoconiosis, further strengthening our late-stage respiratory portfolio. We have also incorporated the complete Phase 2 and Phase 3 clinical data from our CHB-associated liver fibrosis program into our U.S. development strategy and expect to submit an IND application in 2026 for MASH-associated liver fibrosis. Finally, we recently announced an agreement to acquire Cullgen, a company with a robust pipeline of degraders, targeting inflammatory diseases and cancers, as well as U.S.-based drug discovery and development capabilities. Collectively, these achievements support the continued advancement of our differentiated pipeline across both China and the United States.”
Fourth Quarter 2025 Business Highlights and Upcoming Milestones
Commercial Portfolio
ETUARY® (pirfenidone): Generated $106.1 million in sales of ETUARY® for the full year ended December 31, 2025, compared to $105.0 million for the same period in 2024.
Etorel® (nintedanib ethanesulfonate soft capsules): Launched in June 2025 and generated $4.6 million in sales for the full year ended December 31, 2025.
Contiva® (avatrombopag maleate tablets): Launched in March 2025 and generated $5.5 million in sales for the full year ended December 31, 2025.
Pipeline Development Updates
Hydronidone:
In November 2025, Gyre Pharmaceuticals Co., Ltd. (Gyre Pharmaceuticals) presented positive Phase 3 trial results evaluating Hydronidone for the treatment of liver fibrosis in chronic hepatitis B (CHB)-associated liver fibrosis at The Liver Meeting® 2025, the annual meeting of the American Association of the Study of Liver Diseases. The abstract was selected as a Poster of Distinction.
Following the Phase 3 trial results, Gyre Pharmaceuticals completed a Pre-NDA meeting with China’s CDE. Based on the discussions, the CDE indicated that the existing Phase 3 clinical data support a conditional approval filing and potential priority review eligibility, subject to formal acceptance and approval. The Company plans to submit an NDA for conditional approval in the first half of 2026.
In the United States, Gyre Therapeutics plans to conduct a hepatic impairment study under its active U.S. IND application to inform dose selection and enrollment criteria in patients with reduced hepatic function, supporting the Company’s broader U.S. development strategy.
Gyre Therapeutics remains on track to submit an IND application in 2026 with the U.S. Food & Drug Administration for Hydronidone in MASH-associated liver fibrosis, and, subject to IND clearance, initiate a Phase 2 clinical trial.
Pirfenidone:
In the third quarter of 2025, Gyre Pharmaceuticals completed patient enrollment in its 52-week Phase 3 clinical trial evaluating pirfenidone for the treatment of PD. The multicenter, randomized, double-blind, placebo-controlled trial enrolled 272 patients across 18 clinical research centers in China and is designed to assess the efficacy and safety of 52 weeks of pirfenidone treatment in patients with this chronic occupational lung disease characterized by progressive pulmonary fibrosis. The final patient is expected to complete the trial in the third quarter of 2026.
Following approval in March 2025 from China’s National Medical Products Association’s (NMPA) for a clinical trial evaluating pirfenidone in oncology-related pulmonary complications, Gyre Pharmaceuticals plans to initiate an adaptive Phase 2/3 trial in the first half of 2026 in China. This trial will evaluate pirfenidone for radiation-induced lung injury (RILI), including cases complicated by immune-related pneumonitis, at leading oncology centers.
Corporate Updates:
In March 2026, Gyre announced an agreement to acquire Cullgen Inc. (Cullgen), a privately-held, clinical-stage biopharmaceutical company focused on the discovery and development of targeted protein degrader and degrader antibody conjugate therapies, in an all-stock transaction valued at approximately $300 million. Following the closing of the acquisition, expected in the second quarter of 2026, the new combined entity is expected to be a fully integrated biopharmaceutical company with U.S.- and China-based capabilities spanning from discovery to manufacturing and commercialization and covering multiple therapeutic areas, including inflammatory diseases, cancers, and pain.
Financial Results
Cash Position
As of December 31, 2025, Gyre had cash, cash equivalents, short-term and long-term bank deposits of $75.9 million.
Financial Results for the Three Months Ended December 31, 2025
Revenues: Revenues for the three months ended December 31, 2025 were $37.2 million, compared to $27.9 million for the same period in 2024, representing an increase of $9.3 million, or 33.3% year-over-year. The growth was driven by $1.5 million in Etorel® sales and $2.5 million in Contiva® sales, as well as a $5.5 million increase in ETUARY® sales, partially offset by a $0.2 million decrease in generic drug revenue. The increase in ETUARY® sales reflects strengthened commercial execution and the reallocation of marketing resources during the second half of 2025.
Cost of Revenues: For the three months ended December 31, 2025, cost of revenues was $1.7 million, compared to $1.2 million for the same period in 2024. The $0.5 million increase was primarily driven by a $0.4 million increase in stock-based compensation expense, and a $0.1 million increase in cost of sales of Etorel® and Contiva®.
Selling and Marketing Expense: Selling and marketing expense for the three months ended December 31, 2025 was $23.8 million, compared to $16.9 million for the same period in 2024, representing an increase of $6.9 million, or 40.8% year-over-year. The increase was primarily attributable to expanded commercial activities, including a $2.9 million increase in personnel costs driven by higher sales headcount and commissions, a $2.2 million increase in stock-based compensation expense, a $1.7 million increase in conference and promotional activities, and a $0.1 million increase in travel and other expenses.
Research and Development Expense: For the three months ended December 31, 2025, research and development expense was $4.8 million, compared to $3.7 million for the same period in 2024. The $1.1 million increase was primarily driven by a $0.6 million increase in facilities, depreciation and other expenses, attributable mainly to professional and consulting fees incurred in connection with research and development operations, a $0.3 million increase in pre-clinical research costs, a $0.2 million increase in clinical trial costs and a $0.3 million increase in staff costs which included $0.2 million in stock-based compensation expenses, partially offset by a $0.3 million decrease in materials and utilities expenses.
General and Administrative Expense: For the three months ended December 31, 2025, general and administrative expense was $6.7 million, compared to $5.5 million for the same period in 2024. The $1.2 million increase was primarily driven by a $1.2 million increase in stock-based compensation expense and a $0.8 million increase in functional and administrative department’s personnel expense, partially offset by a $0.6 million decrease in professional service expense, a $0.1 million decrease in depreciation and amortization expense and a $0.1 million decrease in miscellaneous expense.
Income from Operations: For the three months ended December 31, 2025, income from operations was $0.1 million, compared to $0.7 million income from operations for the same period in 2024. The $0.6 million decrease in income from operations was driven primarily by a $9.9 million increase in total operating expenses, partially offset by a $9.3 million increase in revenue.
Net (Loss) Income: For the three months ended December 31, 2025, net loss was $1.4 million, compared to $0.6 million net income for the same period in 2024. The $2.0 million decrease was driven primarily by an increase in income tax expense of $1.1 million, an increase in operating expenses of $9.9 million and a decrease in other income of $0.3 million, partially offset by an increase in revenue of $9.3 million.
Non-GAAP Adjusted Net Income: For the three months ended December 31, 2025, non-GAAP adjusted net income was $4.3 million, compared to $1.1 million for the same period in 2024. The $3.2 million increase was primarily driven by an increase in revenue of $9.3 million partially offset by the increase in operating expenses of $5.8 million and an decrease in other income of $0.3 million.
Financial Results for the Full Year Ended December 31, 2025
Revenues: Revenues for the full year ended December 31, 2025 were $116.6 million, compared to $105.8 million for the same period in 2024, representing an increase of $10.8 million, or 10.2% year-over-year. The growth was driven by $5.5 million in Contiva® sales and $4.6 million in Etorel® sales, along with a $1.1 million increase in ETUARY® sales, partially offset by a $0.4 million decline in generic drug revenue.
Sales of Contiva® and Etorel®, which commenced commercialization in March 2025 and June 2025, respectively, were primarily driven by the targeted allocation of commercial and marketing resources to support their respective launches during the first half of 2025. The increase in ETUARY® sales reflects a strategic realignment of marketing efforts in the third quarter of 2025 to optimize product mix and address evolving market dynamics.
Cost of Revenues: For the full year ended December 31, 2025, cost of revenues was $5.4 million, compared to $3.9 million for the same period in 2024. The $1.5 million increase was primarily driven by a $0.8 million increase in ETUARY®‘s cost, due to higher plant, property and equipment depreciation from a plant renovation completed in the second half of 2024, a $0.6 million increase in the cost of Contiva® and Etorel®, in line with the corresponding increase in their sales, and a $0.5 million increase in stock-based compensation expense. These factors were partially offset by a $0.4 million decrease in costs related to generic drugs due to the decrease in sales.
Selling and Marketing Expense: For the full year ended December 31, 2025, selling and marketing expense was $65.2 million, compared to $57.5 million for the same period in 2024. This $7.7 million increase was primarily driven by a $2.5 million increase in conference expenses and promotional expenses, attributable to the launch of additional promotional campaigns in the current year—particularly for the Company’s new products, a $2.6 million increase in staff costs, which was driven by expanded headcount and higher sales commissions, consistent with the corresponding growth in revenue, a $2.3 million increase in stock-based compensation expense and a $0.3 million increase in traveling and other expense.
Research and Development Expense: For the full year ended December 31, 2025, research and development expense was $13.7 million, compared to $12.0 million for the same period in 2024. The $1.7 million increase was attributable to a $1.0 million increase in clinical trial costs, primarily as a result of data analysis costs for Hydronidone, PD and RILI, a $0.4 million increase in staff costs, which included $0.2 million in stock-based compensation expense, a $0.5 million increase in facilities, depreciation and other expenses, attributable mainly to professional and consulting fees incurred in connection with research and development operations, and a $0.4 million increase in pre-clinical research expenses. These expense increases were partially offset by a $0.6 million decrease in materials and utilities expenses.
General and Administrative Expense: For the full year ended December 31, 2025, general and administrative expense was $20.8 million, compared to $16.1 million for the same period in 2024. This $4.7 million increase was primarily driven by a $3.3 million increase in stock-based compensation expense, a $1.3 million increase in functional and administrative department’s personnel expense, and a $0.9 million increase in miscellaneous expense. These cost increases were partially offset by a $0.8 million decrease in professional service expenses.
Income from Operations: For the full year ended December 31, 2025, income from operations was $11.5 million, compared to $16.2 million in income for the same period in 2024. The $4.7 million decrease in income from operations was driven primarily by a $15.5 million increase in total operating expenses, partially offset by a $10.8 million increase in revenue.
Net Income: For the full year ended December 31, 2025, net income was $9.9 million, compared to $17.9 million net income for the same period in 2024. This $8.0 million decrease was driven primarily by the increase in operating expenses of $15.5 million and decrease in change in fair value of warrant liability of $4.5 million, partially offset by an increase in revenue of $10.8 million, an increase in other income of $0.4 million, and a decrease in income tax expense of $0.8 million.
Non-GAAP Adjusted Net Income: For the full year ended December 31, 2025, non-GAAP adjusted net income was $18.9 million, compared to $16.9 million for the same period in 2024. The increase was primarily driven by an increase in revenue of $10.8 million and an increase in other income of $0.4 million partially offset by an increase in operating expenses of $9.2 million.
Full Year 2026 Financial Guidance
For the full year 2026, the Company expects to generate revenues of $100.5 million to $111.0 million, representing a decline of approximately 13.8% to 4.8% compared to 2025.
The Company anticipates that 2026 will be a transition period, during which it plans to prioritize regulatory activities, including preparation for the planned NDA submission of Hydronidone.
In addition, given uncertainties associated with the National Centralized Drug Procurement program and evolving market dynamics, the Company expects to moderate promotional activities for Contiva® and Etorel®.
Please note the following regarding the total revenue guidance:
Guidance assumes a constant foreign currency exchange rate.
Guidance assumes no significant economic disruption or downturn.
Use of Non-GAAP Financial Measures by Gyre Therapeutics, Inc.
Gyre reports financial results in accordance with accounting principles generally accepted in the United States (“GAAP”). This release presents the financial measure “adjusted net income,” which is not calculated in accordance with GAAP. The most directly comparable GAAP measure for this non-GAAP financial measure is “net income.” Adjusted net income presents Gyre’s results of operations after excluding gain from change in fair value of warrants, stock-based compensation, and provision for income taxes. This is meant to supplement, and not substitute, Gyre’s financial information presented in accordance with GAAP. Adjusted net income as defined by Gyre may not be comparable to similar non-GAAP measures presented by other companies. Management believes that presenting adjusted net income provides investors with additional useful information in evaluating Gyre’s performance and valuation. See the reconciliation of adjusted net income to net income in the section titled “Reconciliation of GAAP to Non-GAAP Financial Measures” below.
About Hydronidone
Hydronidone is a novel, orally administered anti-fibrotic agent designed to target key liver fibrosis pathways. It attenuates hepatic stellate cell activation and fibrogenesis, at least in part, by suppressing Tumor Growth Transforming (TGF)-β1-induced signal transduction, including reduced p38γ phosphorylation and upregulated Smad7 expression. This upregulation of Smad7 subsequently leads to downregulation of TGF-βRI and inhibition of Smad2/3 activation, thereby disrupting canonical TGF-β/Smad signaling and reducing fibrotic gene expression in hepatic stellate cells.
The drug has completed Phase 3 clinical evaluation in China for chronic hepatitis B (CHB)-associated liver fibrosis, including early (compensated) cirrhosis, and is being evaluated for its potential applicability across additional fibrotic diseases in region-specific development programs.
About Gyre Pharmaceuticals
Gyre Pharmaceuticals is a commercial-stage biopharmaceutical company committed to the research, development, manufacturing and commercialization of innovative drugs for organ fibrosis. Its flagship product, ETUARY® (pirfenidone capsule), was the first approved treatment for IPF in China in 2011 and has maintained a prominent market share (2024 net sales of $105.8 million). In addition, Gyre Pharmaceuticals’ pipeline includes Hydronidone, a structural analogue of pirfenidone, which demonstrated statistically significant fibrosis regression after 52 weeks of treatment in a pivotal Phase 3 clinical trial in CHB-associated liver fibrosis in China. Hydronidone received Breakthrough Therapy designation by the NMPA CDE in March 2021. Gyre Pharmaceuticals is also developing treatments for PD, RILI with or without immune-related pneumonitis, chronic obstructive pulmonary disease (COPD), pulmonary arterial hypertension (PAH) and acute/acute-on-chronic liver failure (ALF/ACLF). As of December 31, 2025, Gyre Therapeutics owns a 69.7% equity interest in Gyre Pharmaceuticals.
About Gyre Therapeutics
Gyre Therapeutics is a biopharmaceutical company headquartered in San Diego, CA, primarily focused on the development and commercialization of Hydronidone for liver fibrosis, including MASH, in the United States Gyre’s strategy builds on its experience in mechanistic studies using MASH rodent models and clinical studies in CHB-induced liver fibrosis. In the People’s Republic of China, Gyre is advancing a broad pipeline through its indirect controlling interest in Gyre Pharmaceuticals, including therapeutic expansions of ETUARY®, and development programs for F573, F528, and F230.
Forward-Looking Statements
This press release contains “forward-looking statements” within the meaning of the “safe harbor” provisions of the Private Securities Litigation Reform Act of 1995, which statements are subject to substantial risks and uncertainties and are based on estimates and assumptions. All statements, other than statements of historical facts included in this press release, are forward-looking statements, including statements concerning: the expectations regarding Gyre’s research and development efforts, the anticipated timing of the submission of Gyre Therapeutics’ U.S. IND application for Hydronidone for the treatment of MASH-associated liver fibrosis, plans to conduct a hepatic impairment study of Hydronidone in U.S. subjects under Gyre Therapeutics’ active IND application, timing for the initiation of Gyre Pharmaceuticals’ Phase 2/3 trial in China for pirfenidone capsules for the treatment of RILI, including cases complicated by immune-related pneumonitis, the filing of an NDA with the NMPA and timing for potential commercial approval for Hydronidone for the treatment of CHB-associated liver fibrosis, expectations regarding conducting a confirmatory trial for Hydronidone in China, trial design of Gyre’s Phase 3 clinical trial evaluating pirfenidone for the treatment of pneumoconiosis, interactions with regulators, the structure, timing and completion of the proposed acquisition of Cullgen, the anticipated timing of closing of the acquisition of Cullgen, the future operations of the combined entity, the nature, strategy and focus of the combined Gyre and Cullgen entity, the development and commercial potential and potential benefits of any product candidates of the combined Gyre and Cullgen entity, Gyre’s ability to meet its expected revenue guidance and Gyre’s financial position and cash resources. In some cases, you can identify forward-looking statements by terms such as “may,” “might,” “will,” “objective,” “intend,” “should,” “could,” “can,” “would,” “expect,” “believe,” “design,” “estimate,” “predict,” “potential,” “plan” or the negative of these terms, and similar expressions intended to identify forward-looking statements. These statements reflect our plans, estimates, and expectations, as of the date of this press release. These statements involve known and unknown risks, uncertainties and other factors that could cause our actual results to differ materially from the forward-looking statements expressed or implied in this press release. Actual results and the timing of events could differ materially from those anticipated in such forward-looking statements as a result of these risks and uncertainties, which include, without limitation: Gyre’s ability to execute on its clinical development strategies; positive results from a clinical trial may not necessarily be predictive of the results of future or ongoing clinical trials; the timing or likelihood of regulatory filings and approvals; competition from competing products; the impact of general economic, health, industrial or political conditions in the United States or internationally; the sufficiency of Gyre’s capital resources and its ability to raise additional capital; supply chain and distribution delays and challenges. Additional risks and factors are identified under “Risk Factors” in Gyre’s Annual Report on Form 10-K for the year ended December 31, 2024, filed on March 17, 2025, and in subsequent filings with the Securities and Exchange Commission.
Gyre expressly disclaims any obligation to update any forward-looking statements whether as a result of new information, future events or otherwise, except as required by law.
Delivered Revenue Growth in Challenging Environment, Sixth Consecutive Year of Positive Adjusted EBITDA, and Strengthened Balance Sheet
NORWOOD, Mass., March 11, 2026 (GLOBE NEWSWIRE) — MariMed Inc. (“MariMed” or the “Company”) (CSE: MRMD) (OTCQX: MRMD), a leading multi-state cannabis operator focused on improving lives every day, today announced its financial results for the fourth quarter and year ended December 31, 2025.
Despite continued pricing pressure across many cannabis markets, the Company generated revenue growth and positive Adjusted EBITDA for the sixth consecutive year, reflecting the strength of its branded product portfolio and disciplined operational execution.
2025 Highlights
Revenue of $159.8 million
Sixth consecutive year of positive Adjusted EBITDA
Wholesale revenue increased 11%
Distribution expanded to 85% of dispensaries in core markets
Betty’s Eddies ranked #1 edible across four states
Completed restructuring of Series B obligation, extending maturity 4.6 years
MariMed CEO Jon Levine commented, “We’re pleased to report record revenues as well as positive adjusted EBITDA for the sixth consecutive year. Wholesale continued to be a growth engine for the Company in 2025, increasing sales by 11 percent and expanding our distribution footprint to 85 percent of the dispensaries in our core markets. Our brands continue to resonate with our customers, led by Betty’s Eddies™ fruit chews, which ranked as the top-selling edible across Massachusetts, Maryland, Delaware and Illinois, and Vibations™ drink mix, which ranked fourth among cannabis beverages of any kind sold across those states.”
“Looking ahead to 2026, we have a number of drivers to fuel our growth. These include: a full year of financial contribution following the launch of adult-use cannabis sales in Delaware last August and the launch of our brand distribution in Maine through a new licensing partner during the fourth quarter of 2025; and revenue generated by the new Columbus, Ohio, dispensary we intend to open during the year.”
MariMed CFO Mario Pinho added, ”MariMed was pleased to report revenue growth, protected margins, and stronger liquidity in 2025, reflecting disciplined execution across our platform against a broadly flat industry environment. Our successful brand distribution model, coupled with a clean balance sheet that contains no material debt maturities in the near-term, positions the Company to execute our growth strategy without near-term capital pressure. Our financial priorities remain consistent: protecting margins, deploying capital into the highest-return opportunities, and maintaining a strong liquidity profile. We believe this disciplined approach positions MariMed to continue generate long-term shareholder value while navigating near-term volatility across the sector.”
Financial Highlights1
The following table summarizes the Company’s consolidated financial highlights (in millions, except percentage amounts):
1 See the reconciliations of non-GAAP financial measures to the most directly comparable GAAP measures and additional information about non-GAAP measures in the section entitled “Discussion of Non-GAAP Financial Measures” below and in the financials information included herewith.
CONFERENCE CALL
MariMed management will host a conference call on Thursday, March 12, 2026 at 8:00 a.m. Eastern time, to discuss these results. The conference call may be accessed through MariMed’s Investor Relations website, or by clicking the following link: https://app.webinar.net/4okRloNdnZ8.
FOURTH QUARTER 2025 OPERATIONAL HIGHLIGHTS
During the fourth quarter, the Company announced the following developments in the implementation of its strategic growth plan:
October 23: Announced a licensing agreement with Farm 2 Hand, LLC, a New York State cannabis license holder. The agreement will enable the Company to distribute its portfolio of products throughout New York upon completion of a kitchen it is building with Farm 2 Hand and receipt of regulatory approvals.
October 28: Announced the Company’s exit from the Missouri market, following a strategic review of its business in the state, allowing MariMed to focus resources on higher-return opportunities within its core markets.
November 3: Announced manufacturing and distribution agreements to support the planned launch of the Company’s Vibations™ beverage brand into the hemp-derived THC market, beginning with Rhode Island in 2026.
OTHER DEVELOPMENTS
Subsequent to the end of the fourth quarter, the Company announced the following development:
March 2: Announced a Restructuring and Exchange Agreement with the holders of its $14.725 million Series B Convertible Preferred Stock. The Agreement eliminated the Company’s February 28. 2026 mandatory conversion date obligation and replaced it with a combination of long-dated instruments. The transaction extends the weighted average maturity of the obligation to 4.6 years, reducing near-term refinancing risk and enhancing the Company’s liquidity profile.
DISCUSSION OF NON-GAAP FINANCIAL MEASURES
MariMed’s management uses several different financial measures, both GAAP and non-GAAP, in analyzing and assessing the overall performance of its business, making operating decisions, and planning and forecasting future periods. The Company has provided in this release several non-GAAP financial measures: Non-GAAP Gross margin, Non-GAAP Net income (loss), Non-GAAP Adjusted EBITDA and non-GAAP Adjusted EBITDA margin, as supplements to Revenue, Gross margin, Net (loss) income and other financial measures prepared in accordance with GAAP.
Management believes these non-GAAP financial measures are useful in reviewing and assessing the performance of the Company, and when planning and forecasting future periods, as they provide meaningful operating results by excluding the effects of expenses that are not reflective of its operating business performance. In addition, the Company’s management uses these non-GAAP financial measures to understand and compare operating results across accounting periods and for financial and operational decision-making. The presentation of these non-GAAP measures is not intended to be considered in isolation or as a substitute for the financial information prepared in accordance with GAAP.
Management believes that investors and analysts benefit from considering non-GAAP financial measures in assessing the Company’s financial results and its ongoing business, as it allows for meaningful comparisons and analysis of trends in the business. In particular, non-GAAP adjusted EBITDA is used by many investors and analysts themselves, along with other metrics, to compare financial results across accounting periods and to those of peer companies.
As there are no standardized methods of calculating non-GAAP financial measures, the Company’s calculations may differ from those used by analysts, investors and other companies, even those within the cannabis industry, and therefore may not be directly comparable to similarly titled measures used by others.
Management defines non-GAAP Adjusted EBITDA as income (loss) from operations, determined in accordance with GAAP, excluding the following items:
depreciation of fixed assets;
amortization of acquired intangible assets;
Impairment or write-downs of intangible assets;
inventory revaluation;
stock-based compensation;
severance;
legal settlements; and
acquisition-related and other expenses.
For further information, please refer to the publicly available financial filings available on MariMed’s Investor Relations website, as filed with the U.S. Securities and Exchange Commission, or as filed with the Canadian securities regulatory authorities on the SEDAR website.
ABOUT MARIMED
MariMed Inc. is a leading multi-state cannabis operator, known for developing and managing state-of-the-art cultivation, production, and retail facilities. Our award-winning portfolio of cannabis brands, including Betty’s Eddies™, Bubby’s Baked™, Vibations™, InHouse™, and Nature’s Heritage™, sets us apart as an industry leader. These trusted brands, crafted with quality and innovation, are recognized and loved by consumers across the country. With a commitment to excellence, MariMed continues to drive growth and set new standards in the cannabis industry. For additional information, visit www.marimedinc.com.
IMPORTANT CAUTION REGARDING FORWARD-LOOKING STATEMENTS:
The information in this release contains “forward-looking” statements within the meaning of the U.S. Private Securities Litigation Reform Act of 1995, which are subject to several risks and uncertainties. All statements other than statements of historical facts contained in this release, including without limitation statements regarding projected financial results for 2023, including management’s belief that it will have its fourth consecutive year of positive operating cash flow, anticipated openings of dispensaries and facilities, timing of regulatory approvals, plans and objectives of management for future operations, are forward-looking statements. Without limiting the foregoing, the words “anticipates”, “believes”, “estimates”, “expects”, “expectations”, “intends”, “may”, “plans”, and other similar language, whether in the negative or affirmative, are intended to identify forward-looking statements, although not all forward-looking statements contain these identifying words.
Forward-looking statements are based on our current beliefs and assumptions regarding our business, timing of regulatory approvals, the ability to obtain new licenses, business prospects and strategic growth plan, and other future conditions. Because forward-looking statements relate to the future, they are subject to inherent uncertainties, risks and changes in circumstances that are difficult to predict. Our actual results may differ materially from those contemplated in these forward-looking statements due to various risks, uncertainties, and other important factors, including, among others, reductions in customer spending, our ability to recruit and retain key personnel, and disruptions from the integration efforts of acquired companies.
These factors are not intended to be an all-encompassing list of risks and uncertainties that may affect our business and results of operations. These statements are not a guarantee of future performance and involve risk and uncertainties that are difficult to predict, including, among other factors, changes in demand for the Company’s services and products, changes in the law and its enforcement, and changes in the economic environment. Additional information regarding these and other factors can be found in our reports filed with the U.S. Securities and Exchange Commission. In providing these forward-looking statements, the Company expressly disclaims any obligation to update these statements publicly or otherwise, whether as a result of new information, future events or otherwise, except as required by law.
All trademarks and service marks are the property of their respective owners.
Company Contact: Howard Schacter, Chief Communications Officer Email: [email protected] Phone: (781) 277-0007
Program Reaches Strategic Inflection Point as GEO-MVA Advances Toward Pivotal Phase 3 Study
Atlanta, GA – March 11, 2026 – GeoVax Labs, Inc. (Nasdaq: GOVX), a clinical-stage biotechnology company developing vaccines and immunotherapies against infectious diseases and cancer, today announced that it has begun engaging with global health and preparedness organizations to explore potential future procurement of its GEO-MVA vaccine candidate for mpox and smallpox preparedness programs.
GeoVax has initiated discussions and is soliciting interest from international organizations that influence or directly procure mpox/smallpox vaccines. These organizations play key roles in recommending or directly procuring vaccines for national preparedness stockpiles and international outbreak response programs.
The outreach reflects growing global recognition of the need to diversify supply of Modified Vaccinia Ankara (MVA) vaccines used for protection against mpox and smallpox. Currently, global supply of MVA vaccines is concentrated in a single commercial manufacturer.
Global preparedness programs for smallpox and mpox vaccines represent a potential multi-billion-dollar procurement market supported by national stockpiles, military preparedness programs, and international health organizations. Governments have invested billions of dollars in medical countermeasure stockpiles over the past two decades, and demand for MVA-based vaccines is expected to further expand as mpox continues to emerge as a recurring global health threat.
GeoVax believes that initiating engagement with procurement and preparedness organizations represents an important transition from development toward commercialization planning, reflecting growing confidence in the GEO-MVA program and the potential for the vaccine to contribute to global preparedness stockpiles following successful completion of the planned Phase 3 study, scheduled to initiate in the second half of 2026.
Advancing GEO-MVA Through an Expedited Regulatory Pathway
GeoVax’s GEO-MVA program has progressed through an extensive regulatory dialogue with the European Medicines Agency (EMA), culminating in scientific advice in support of an expedited development pathway based on a single immunobridging trial to the licensed MVA vaccine.
“The EMA carefully evaluated the scientific evidence over an extended period before confirming an expedited pathway. We believe their guidance validates both the scientific foundation of GEO-MVA and the growing recognition that expanding the global MVA vaccine supply is an important public health priority,” said David Dodd, Chairman and Chief Executive Officer of GeoVax.
“We have also been encouraged by the positive response we are receiving from global health organizations and preparedness agencies as we initiated these discussions,” Dodd continued. “We view this engagement as an endorsement of the progress we have made, our commitment to advancing GEO-MVA, and the potential of GEO-MVA to help address the current worldwide need for expanded MVA vaccine supply. Importantly, it also represents a critical step toward commercialization of GEO-MVA and the potential generation of meaningful revenues through government and global health procurement programs as the program advances through its final development stages.”
Implications for Global Preparedness and Biodefense Readiness
The discussions initiated by GeoVax occur amid growing policy dialogue regarding the strategic importance of expanding global MVA vaccine manufacturing capacity. GeoVax believes GEO-MVA has the potential to become a strategically important medical countermeasure supporting both global public health preparedness and national biodefense initiatives.
Recent mpox outbreaks have reinforced the understanding that mpox is not a single episodic event, but rather an evolving infectious disease threat with potential for continued geographic expansion and recurrence. As a result, governments and international health organizations are increasingly emphasizing the need for manufacturing diversification and supply redundancy for vaccines used in outbreak response and biodefense preparedness.
In the United States, policymakers and defense stakeholders have increasingly recognized that no domestic manufacturing capability currently exists for MVA vaccines, a gap with implications for both civilian preparedness and military readiness.
“Establishing additional MVA manufacturing capability is increasingly viewed as an important component of global preparedness,” said Dodd. “We are seeing growing interest from public health organizations, governments, and defense stakeholders who recognize the strategic importance of supply diversification.”
About GEO-MVA
GEO-MVA is GeoVax’s candidate vaccine for protection against mpox and smallpox based on the Modified Vaccinia Ankara (MVA) platform. Pending successful completion of the planned immunobridging trial, GEO-MVA could represent an important additional source of MVA vaccine supply for global preparedness, outbreak response, and biodefense programs.
About GeoVax
GeoVax Labs, Inc. is a clinical-stage biotechnology company focused on the development of vaccines and immunotherapies addressing high-consequence infectious diseases and solid tumor cancers. GeoVax’s priority program is GEO-MVA, a Modified Vaccinia Ankara (MVA)–based vaccine targeting mpox and smallpox. The program is advancing under an expedited regulatory pathway, with plans to initiate a pivotal Phase 3 clinical trial in the second half of 2026, to address critical global needs for expanded orthopoxvirus vaccine supply and biodefense preparedness. In oncology, GeoVax is developing Gedeptin®, a gene-directed enzyme prodrug therapy (GDEPT) designed to enhance immune checkpoint inhibitor activity. Gedeptin has completed a multicenter Phase 1/2 clinical trial in advanced head and neck cancer and is being advanced into combination strategies, including planned neoadjuvant and first-line settings. GeoVax’s broader pipeline includes the development of GEO-CM04S1, a next-generation COVID-19 vaccine candidate being evaluated in immunocompromised and other patient populations. GeoVax maintains a global intellectual property portfolio supporting its infectious disease and oncology programs and continues to evaluate strategic partnerships and funding opportunities aligned with its development priorities. For more information, visit www.geovax.com.
Forward-Looking Statements
This release contains forward-looking statements regarding GeoVax’s business plans. The words “believe,” “look forward to,” “may,” “estimate,” “continue,” “anticipate,” “intend,” “should,” “plan,” “could,” “target,” “potential,” “is likely,” “will,” “expect” and similar expressions, as they relate to us, are intended to identify forward-looking statements. We have based these forward-looking statements largely on our current expectations and projections about future events and financial trends that we believe may affect our financial condition, results of operations, business strategy and financial needs. Actual results may differ materially from those included in these statements due to a variety of factors, including whether: GeoVax is able to obtain acceptable results from ongoing or future clinical trials of its investigational products, GeoVax’s immuno-oncology products and preventative vaccines can provoke the desired responses, and those products or vaccines can be used effectively, GeoVax’s viral vector technology adequately amplifies immune responses to cancer antigens, GeoVax can develop and manufacture its immuno-oncology products and preventative vaccines with the desired characteristics in a timely manner, GeoVax’s immuno-oncology products and preventative vaccines will be safe for human use, GeoVax’s vaccines will effectively prevent targeted infections in humans, GeoVax’s immuno-oncology products and preventative vaccines will receive regulatory approvals necessary to be licensed and marketed, GeoVax raises required capital to complete development, there is development of competitive products that may be more effective or easier to use than GeoVax’s products, GeoVax will be able to enter into favorable manufacturing and distribution agreements, and other factors, over which GeoVax has no control.
Further information on our risk factors is contained in our periodic reports on Form 10-Q and Form 10-K that we have filed and will file with the SEC. Any forward-looking statement made by us herein speaks only as of the date on which it is made. Factors or events that could cause our actual results to differ may emerge from time to time, and it is not possible for us to predict all of them. We undertake no obligation to publicly update any forward-looking statement, whether as a result of new information, future developments or otherwise, except as may be required by law.
SKYX is Expected to Supply 10,000 of its Advanced Technologies to the New Pittsford Oaks Apartment Development in Pittsford, New York
The Development will include 171 Apartments with Top-of-the-Line Amenities including an In-House Clubhouse, Fitness Center, Erie Canal Trail Access, and Underground Garage Heated Parking
SKYX’s Technologies Expansion Provides Additional Opportunities for Future Recurring Revenues through Interchangeability, Upgrades, AI Services, Monitoring, Subscriptions, Among Others
MIAMI, March 11, 2026 (GLOBE NEWSWIRE) — SKYX Platforms Corp. (NASDAQ: SKYX) (d/b/a SKYX Technologies) (the “Company” or “SKYX”), a highly disruptive smart home platform technology company with over 100 pending and issued patents globally and 60 lighting and home décor websites, with a mission to make homes and buildings become safe and smart as the new standard, today announced that it will supply its technologies to a new contemporary residential project in Pittsford, New York. The apartment complex will include 171 new residential units.
The project is led by the Daniele Management & Development Group, which has over 20 years of experience developing mixed-use communities, apartment buildings, residential homes, and hotels in the New York area and beyond.
The project will include a range of amenities, including an in-house resident clubhouse, a state-of-the-art fitness center, modern meeting and conference facilities, landscaped green spaces, access to the Erie Canal walking trail, an outdoor community piazza, underground garage heated parking, and many other lifestyle-focused amenities.
SKYX is expected to supply 10,000 units of its advanced and smart plug & play technologies, including ceiling lighting, recessed lights, downlights, wall lights, EXIT signs, EMERGENCY lights, plug-in LED backlight mirrors and other SKYX products.
The development is designed to deliver modern apartments paired with lifestyle-focused amenities, offering residents premium finishes and thoughtfully curated community spaces.
Danny Daniele, President of Daniele Management & Development, said: “Our team is excited to collaborate with SKYX Platforms to bring this technology into our community. Pittsford Oaks Apartments will be the first of many new development projects where we expect to utilize SKYX’s innovative technologies as a valuable addition to our electronics and lighting construction package. We see significant short and long-term cost savings across both construction and ongoing maintenance including the added benefits of delivering superior products and services to our customers.”
Rani Kohen, Founder and Executive Chairman of SKYX Platforms, said: “We are very happy to work with innovative developers such as Daniele Management & Development on their new contemporary community in Pittsford, New York. We look forward to collaborating with them to enhance property and overall project value while creating safer, smarter, and more advanced homes for the future.”
As electricity is a standard in every home and building, our mission is to make homes and buildings become safe-advanced and smart as the new standard. SKYX has a series of highly disruptive advanced-safe-smart platform technologies, with over 100 U.S. and global patents and patent pending applications. Additionally, the Company owns 60 lighting and home decor websites for both retail and commercial segments. Our technologies place an emphasis on high quality and ease of use, while significantly enhancing both safety and lifestyle in homes and buildings. We believe that our products are a necessity in every room in both homes and other buildings in the U.S. and globally. For more information, please visit our website at https://skyplug.com/ or follow us on LinkedIn.
Forward-Looking Statements
Certain statements made in this press release are not based on historical facts but are forward-looking statements. These statements can be identified by the use of forward-looking terminology such as “aim,” “anticipate,” “believe,” “can,” “could,” “continue,” “estimate,” “expect,” “evaluate,” “forecast,” “guidance,” “intend,” “likely,” “may,” “might,” “objective,” “ongoing,” “outlook,” “plan,” “potential,” “predict,” “probable,” “project,” “seek,” “should,” “target” “view,” “will,” or “would,” or the negative thereof or other variations thereon or comparable terminology, although not all forward-looking statements contain these words. These statements reflect the Company’s reasonable judgment with respect to future events and are subject to risks, uncertainties and other factors, many of which have outcomes difficult to predict and may be outside our control, that could cause actual results or outcomes to differ materially from those in the forward-looking statements. Such risks and uncertainties include statements relating to the Company’s ability to successfully launch, commercialize, develop additional features and achieve market acceptance of its products and technologies and integrate its products and technologies with third-party platforms or technologies; the Company’s efforts and ability to drive the adoption of its products and technologies as a standard feature, including their use in homes, hotels, offices and cruise ships; the Company’s ability to capture market share; the Company’s estimates of its potential addressable market and demand for its products and technologies; the Company’s ability to raise additional capital to support its operations as needed, which may not be available on acceptable terms or at all; the Company’s ability to continue as a going concern; the Company’s ability to execute on any sales and licensing or other strategic opportunities; the possibility that any of the Company’s products will become National Electrical Code (NEC)-code or otherwise code mandatory in any jurisdiction, or that any of the Company’s current or future products or technologies will be adopted by any state, country, or municipality, within any specific timeframe or at all; risks arising from mergers, acquisitions, joint ventures and other collaborations; the Company’s ability to attract and retain key executives and qualified personnel; guidance provided by management, which may differ from the Company’s actual operating results; the potential impact of unstable market and economic conditions on the Company’s business, financial condition, and stock price; and other risks and uncertainties described in the Company’s filings with the Securities and Exchange Commission, including its periodic reports on Form 10-K and Form 10-Q. There can be no assurance as to any of the foregoing matters. Any forward-looking statement speaks only as of the date of this press release, and the Company undertakes no obligation to update or revise any forward-looking statements, whether as a result of new information, future events or otherwise, except as required by U.S. federal securities laws.
CULVER CITY, Calif., March 11, 2026 (GLOBE NEWSWIRE) — Snail, Inc. (Nasdaq: SNAL) (“Snail Games” or the “Company”), a leading global independent developer and publisher of interactive digital entertainment, hosted an invite-only event during the Game Developers Conference (GDC), offering media and industry partners an early look at upcoming gaming content, major milestones, and new projects. The private showcase featured new trailers, live developer discussions, and multiple franchise updates across the Company’s robust gaming pipeline portfolio.
The event kicked off by highlighting the steady cadence of new content coming to the ARK franchise. Studio Wildcard’s Jeremy Stieglitz introduced PixARK Worlds, a new title in development by Studio Sirens and Snail Games, created with guidance from Studio Wildcard, featuring revolutionary user-generated content designed to expand the ARK universe onto the Nintendo Switch 2. Stieglitz also revealed details about ARK: Survival Ascended content coming this year including ARK: Bob’s True Tales: Tides of Fortune (June), focused on physical sailing ships across a vast ocean world, ARK: Dragontopia (December), and a custom ARK World Creator (May) for consoles, while outlining continued franchise growth plans heading into 2027. Meanwhile, Studio Sirens’ Matt Kohl debuted an event-exclusive trailer for ARK: Survival of the Fittest, offering a renewed look at its standalone competitive esport-style gameplay.
The upcoming internally developed open-universe space survival RPG and AAA title, For The Stars, revealed an event exclusive trailer, providing a deeper look at its open-universe exploration, player-driven research systems, and evolving frontier civilization themes. Attendees were given a glimpse into the game’s expanding scope and ambitious world-building vision through a new trailer and early concept art.
Medieval survival strategy title Bellwright celebrated surpassing 1 million units sold, marking a major milestone on its path toward full 1.0 release and planned console port to Xbox and PlayStation. The game’s Creative Director and Project Lead, Florian “Chadz” Hofreither reflected on the journey through Early Access, emphasizing community feedback as a central force in shaping the game’s progression and long-term roadmap.
Meanwhile, Echoes of Elysium will be at the Snail booth #1238 celebrating its Early Access Steam launch from earlier this year. Developers will be discussing how player feedback has directly influenced feature prioritization, balance updates, and long-term design decisions.
Additionally, Snail Games highlighted its Interactive Films initiative, an innovative publishing model that repurposes high-engagement vertical narrative content into fully interactive RPG Full Motion Video experiences. The approach bridges digital storytelling formats with gameplay interactivity, positioning the project at the forefront of hybrid entertainment.
The GDC event reflects Snail Games’ continued investment in long-term franchise growth, indie innovation, and new media experimentation reinforcing its commitment to evolving alongside players and the broader interactive entertainment landscape.
Developers for all previously mentioned titles will be available for interviews at the GDC 2026 Expo floor, at Booth #1238. For press interested in scheduling an interview, please reach out to [email protected].
For creators interested in collaborating please reach out to [email protected]
About Snail, Inc. Snail, Inc. (Nasdaq: SNAL) is a leading, global independent developer and publisher of interactive digital entertainment for consumers around the world, with a premier portfolio of premium games designed for use on a variety of platforms, including consoles, PCs, and mobile devices. For more information, please visit: https://snail.com/
Forward-Looking Statements: This press release contains statements that constitute forward-looking statements within the meaning of the U.S. federal securities laws. Such statements are based upon various facts and derived utilizing numerous important assumptions and are subject to known and unknown risks, uncertainties and other factors that may cause actual results, performance, or achievements to be materially different from any future results, performance or achievements expressed or implied by such forward-looking statements. Statements preceded by, followed by or that otherwise include the words “believes,” “expects,” “anticipates,” “intends,” “projects,” “estimates,” “plans” and similar expressions or future or conditional verbs such as “will,” “should,” “would,” “may” and “could” are generally forward-looking in nature and not historical facts, although not all forward-looking statements include the foregoing. The forward-looking statements include statements regarding the steady cadence of new content coming to the ARK franchise, the planned release of Gobby Gang, discussing at the Snail booth how player feedback has directly influenced Echoes of Elysium’s feature prioritization, balance updates, and long-term design decisions, the Company continuing to invest in long-term franchise growth, indie innovation, and new media experimentation and reinforcing the Company’s commitment to evolving alongside players and the broader interactive entertainment landscape. Any forward-looking statements included herein reflect our current views, and they involve certain risks and uncertainties, including, among others, acceptance of our titles in the marketplace and the successful development, marketing or sale of our titles and our ability to retain our key employees or maintain our Nasdaq listing. These risks should not be construed as exhaustive and should be read together with the other cautionary statement included in our Annual Report on Form 10-K for the year ended December 31, 2024, subsequent Quarterly Reports on Form 10-Q and current reports on Form 8-K filed with the Securities and Exchange Commission. Any forward-looking statement speaks only as of the date on which it was initially made. We undertake no obligation to publicly update or revise any forward-looking statement, whether as a result of new information, future events, changed circumstances or otherwise, unless required by law.
Investor Contact: John Yi and Steven Shinmachi Gateway Group, Inc. 949-574-3860 [email protected]
BRENTWOOD, Tenn., March 11, 2026 (GLOBE NEWSWIRE) — CoreCivic, Inc. (NYSE: CXW) (“CoreCivic”) announced today that it has received approval for a Special Use Permit (SUP) at the Company’s 1,033-bed Midwest Regional Reception Center in Leavenworth, Kansas. The facility has been undergoing reactivation since a new contract was awarded in the third quarter of 2025 but experienced a temporary delay in the intake process as we worked through legal challenges and the SUP approval process.
Now that the SUP has been approved, we expect to begin accepting detainees at the Midwest Regional Reception Center in the coming weeks. In preparation for reactivation last year, we initiated hiring efforts and attracted a strong candidate pool. We subsequently paused hiring in December 2025 while the SUP application was under review, reflecting a disciplined approach to aligning staffing with regulatory timing and operational readiness. Taking into account start-up activities and the phased commencement of intake operations, we currently expect this facility to contribute approximately $0.05 to $0.06 in incremental earnings per share for the remainder of 2026.
Patrick D. Swindle, CoreCivic’s President and Chief Executive Officer, commented, “I would like to thank the Leavenworth City Commission for their collaboration and trust. We value our longstanding relationship with the Leavenworth community and are pleased with the outcome of the SUP application process. This approval allows us to move ahead with reactivation of the Midwest Regional Reception Center as we continue to deliver safe, effective solutions for our government partners.”
About CoreCivic
CoreCivic is a diversified, government-solutions company with the scale and experience needed to solve tough government challenges in flexible, cost-effective ways. We provide a broad range of solutions to government partners that serve the public good through high-quality corrections and detention management, a network of residential and non-residential alternatives to incarceration to help address America’s recidivism crisis, and government real estate solutions. We are the nation’s largest owner of partnership correctional, detention and residential reentry facilities, and one of the largest operators of such facilities in the United States. We have been a flexible and dependable partner for government for more than 40 years. Our employees are driven by a deep sense of service, high standards of professionalism and a responsibility to help government better the public good. Learn more at www.corecivic.com.
This press release includes statements as to our beliefs and expectations of the outcome of future events that are forward-looking statements within the meaning of Section 21E of the Securities Exchange Act of 1934, as amended, and the Private Securities Litigation Reform Act of 1995, as amended. These forward-looking statements may include such words as “anticipate,” “estimate,” “expect,” “project,” “plan,” “intend,” “believe,” “may,” “will,” “should,” “can have,” “likely,” and other words and terms of similar meaning in connection with any discussion of the timing or nature of future operating or financial performance or other events. Such forward-looking statements may be affected by risks and uncertainties in CoreCivic’s business and market conditions. These forward-looking statements are subject to risks and uncertainties that could cause actual results to differ materially from the statements made. Important factors that could cause actual results to differ are described in the filings made from time to time by CoreCivic with the Securities and Exchange Commission (“SEC”) and include the risk factors described in CoreCivic’s Annual Report on Form 10-K for the fiscal year ended December 31, 2025, filed with the SEC on February 20, 2026. Except as required by applicable law, CoreCivic undertakes no obligation to update forward-looking statements made by it to reflect events or circumstances occurring after the date hereof or the occurrence of unanticipated events.