Release – Codere Online Reports Financial Results for the First Quarter 2026

Codere Online logo

Research News and Market Data on CDRO

05/07/2026

The Company delivered record quarterly net gaming revenue of €64.4 million and Adj. EBITDA of €6.0 million

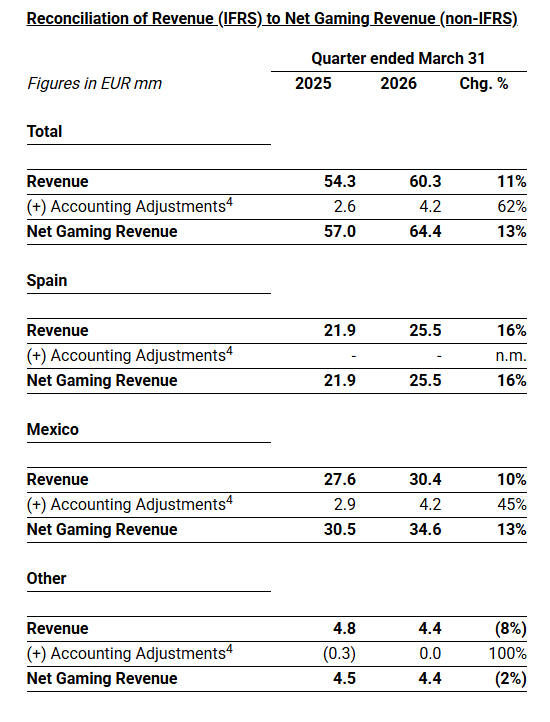
  • Total revenue was €60.3 mm in Q1 2026, while net gaming revenue1 was €64.4 mm, 13% above Q1 2025.
  • Spain revenue and net gaming revenue were €25.5 mm in Q1 2026, 16% above Q1 2025.
  • Mexico revenue was €30.4 mm in Q1 2026, while net gaming revenue was €34.6 mm, 13% above Q1 2025.
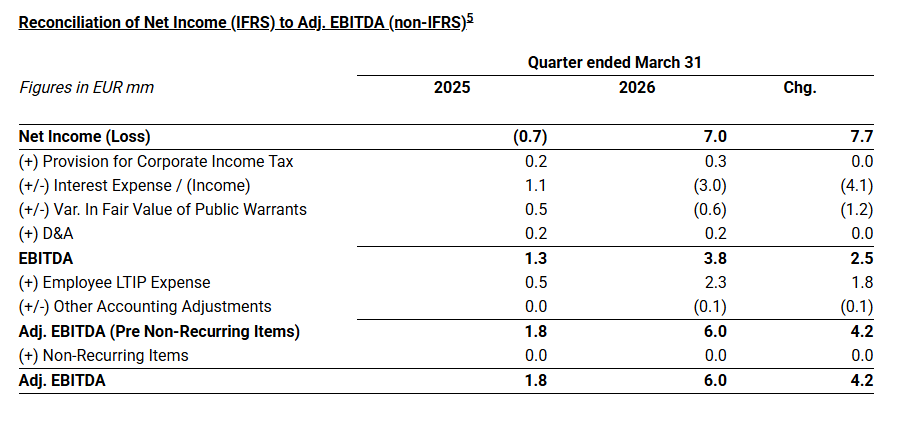
  • Adj. EBITDA reached €6.0 mm in Q1 2026, €4.2 mm above Q1 2025.
  • Net income was €7.0 mm in Q1 2026 versus a net loss of €0.7 mm in Q1 2025.
  • Total cash position of €56.2 mm and no financial debt as of March 31, 2026.
  • Unchanged outlook for FY 2026: Net gaming revenue of €235-245 mm and Adj. EBITDA2 of €15-20 mm.

Madrid, Spain and Tel Aviv, Israel, May 7, 2026 – (GLOBE NEWSWIRE) Codere Online (Nasdaq: CDRO / CDROW, the “Company”), a leading online gaming operator in Spain and Latin America, has released its preliminary unaudited3 financial results for the quarter ended March 31, 2026.

Below are the main financial and operating metrics of the period.

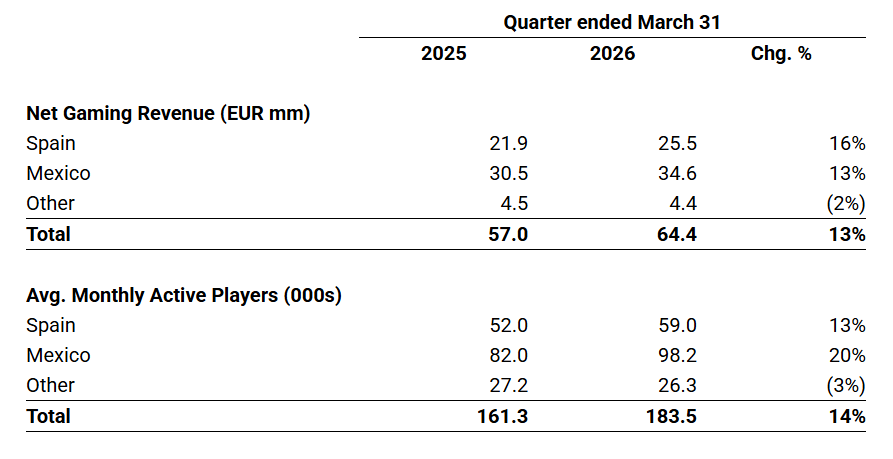
Aviv Sher, Chief Executive Officer of Codere Online, commented, “We delivered a very strong start to 2026, achieving record quarterly net gaming revenue of €64.4 million, up 13% year‑on‑year. In Spain, performance accelerated meaningfully, with net gaming revenue growing 16%, reflecting a clear continuation and acceleration of the positive trends we began to see in the second half of 2025, particularly in the fourth quarter. Mexico also continued to deliver double‑digit growth on the back of a 20% increase in the number of active customers”.

Marcus Arildsson, CFO of Codere Online, commented, “Q1 2026 marked a clear step forward in profitability, with Adjusted EBITDA reaching €6.0 million, €4.2 million above the same period last year and a net profit of €7.0 million. We closed the quarter with a solid total cash position of €56.2 million and no financial debt, providing a strong balance sheet. Based on this performance, we reiterate our outlook for full year 2026, with expected net gaming revenue of €235–245 million and Adjusted EBITDA of €15–20 million”.

Recent Events

Filings with the U.S. Securities and Exchange Commission

  • On April 28, 2026, the Company filed its 2025 annual report on Form 20-F;
  • On May 5, 2026, the Company filed its forms S-8 relating to the Company’s long term incentive plans.


Conference Call Information

Codere Online’s management will host a conference call to discuss the results and provide a business update at 8:30 am US Eastern Time today, May 7, 2026. Access links to the audio webcast and presentation will be accessible on Codere Online’s website at www.codereonline.com. A recording of the webcast will also be available following the conference call.

About Codere Online 

Codere Online refers, collectively, to Codere Online Luxembourg, S.A. and its subsidiaries. Codere Online, launched in 2014 as part of the renowned casino operator Codere Group, offers online sports betting and online casino through its state-of-the art website and mobile applications. Codere Online currently operates in its core markets of Spain, Mexico, Colombia, Panama and Argentina; this online business is complemented by Codere Group’s physical presence in Spain and throughout Latin America, forming the foundation of the leading omnichannel gaming and casino presence.

About Codere Group
Codere Group is a multinational group dedicated to entertainment and leisure. It is a leading player in the private gaming industry, with four decades of experience and with presence in seven countries in Europe (Spain and Italy) and Latin America (Argentina, Colombia, Mexico, Panama, and Uruguay).

Note on Rounding. Due to decimal rounding, numbers presented throughout this report may not add up precisely to the totals and subtotals provided, and percentages may not precisely reflect the absolute figures.

Forward-Looking Statements
Certain statements in this document may constitute “forward-looking statements” within the meaning of the “safe harbor” provisions of the United States Private Securities Litigation Reform Act of 1995. Forward-looking statements include, but are not limited to, statements regarding Codere Online Luxembourg, S.A. and its subsidiaries (collectively, “Codere Online”) or Codere Online’s or its management team’s expectations, hopes, beliefs, intentions or strategies regarding the future. In addition, any statements that refer to projections, forecasts or other characterizations of future events or circumstances, including any underlying assumptions, are forward-looking statements. The words “anticipate,” “believe,” “continue,” “could,” “estimate,” “expect,” “intends,” “may,” “might,” “plan,” “possible,” “potential,” “predict,” “project,” “should,” “would” and similar expressions may identify forward-looking statements, but the absence of these words does not mean that a statement is not forward-looking. Forward-looking statements in this document may include, for example, statements about Codere Online’s financial performance and, in particular, the potential evolution and distribution of its net gaming revenue; any prospective and illustrative financial information; and changes in Codere Online’s strategy, future operations and target addressable market, financial position, estimated revenues and losses, projected costs, prospects and plans.

These forward-looking statements are based on information available as of the date of this document and current expectations, forecasts and assumptions, and involve a number of judgments, risks and uncertainties. Accordingly, forward-looking statements should not be relied upon as representing Codere Online’s or its management team’s views as of any subsequent date, and Codere Online does not undertake any obligation to update forward-looking statements to reflect events or circumstances after the date they were made, whether as a result of new information, future events or otherwise, except as may be required under applicable securities laws.

As a result of a number of known and unknown risks and uncertainties, Codere Online’s actual results or performance may be materially different from those expressed or implied by these forward-looking statements. There may be additional risks that Codere Online does not presently know or that Codere Online currently believes are immaterial that could also cause actual results to differ from those contained in the forward-looking statements. Some factors that could cause actual results to differ include (i) changes in applicable laws or regulations, including online gaming, privacy, data use and data protection rules and regulations as well as consumers’ heightened expectations regarding proper safeguarding of their personal information, (ii) the impacts and ongoing uncertainties created by regulatory restrictions, changes in perceptions of the gaming industry, changes in policies and increased competition, and geopolitical events such as war, (iii) the ability to implement business plans, forecasts, and other expectations and identify and realize additional opportunities, (iv) the risk of downturns and the possibility of rapid change in the highly competitive industry in which Codere Online operates, (v) the risk that Codere Online and its current and future collaborators are unable to successfully develop and commercialize Codere Online’s services, or experience significant delays in doing so, (vi) the risk that Codere Online may never achieve or sustain profitability, (vii) the risk that Codere Online will need to raise additional capital to execute its business plan, which may not be available on acceptable terms or at all, (viii) the risk that Codere Online experiences difficulties in managing its growth and expanding operations, (ix) the risk that third-party providers, including the Codere Group, are not able to fully and timely meet their obligations, (x) the risk that the online gaming operations will not provide the expected benefits due to, among other things, the inability to obtain or maintain online gaming licenses in the anticipated time frame or at all, (xi) the risk that Codere Online is unable to secure or protect its intellectual property, (xii) the risk that Codere Online’s securities may be delisted from Nasdaq and (xiii) the possibility that Codere Online may be adversely affected by other political, economic, business, and/or competitive factors. Additional information concerning certain of these and other risk factors is contained in Codere Online’s filings with the U.S. Securities and Exchange Commission (the “SEC”). All subsequent written and oral forward-looking statements concerning Codere Online or other matters and attributable to Codere Online or any person acting on their behalf are expressly qualified in their entirety by the cautionary statements above.

Financial Information and Non-GAAP Financial Measures
Codere Online’s financial statements are prepared in accordance with International Financial Reporting Standards as issued by the International Accounting Standards Board (“IFRS”), which can differ in certain significant respects from generally accepted accounting principles in the United States of America (“U.S. GAAP”).

This document includes certain financial measures not presented in accordance with U.S. GAAP or IFRS (“non-GAAP”), such as, without limitation, net gaming revenue, Adjusted EBITDA and constant currency information. These non-GAAP financial measures are not measures of financial performance in accordance with U.S. GAAP or IFRS and may exclude items that are significant in understanding and assessing Codere Online’s financial results. Therefore, these measures should not be considered in isolation or as an alternative to revenue, net income, cash flows from operations or other measures of profitability, liquidity or performance under U.S. GAAP or IFRS. You should be aware that Codere Online’s presentation of these measures may not be comparable to similarly-titled measures used by other companies. In addition, the audit of Codere Online’s financial statements in accordance with PCAOB standards, may impact how Codere Online currently calculates its non-GAAP financial measures, and we cannot assure you that there would not be differences, and such differences could be material.

Codere Online believes that the use of these non-GAAP financial measures provides an additional tool for investors to use in evaluating ongoing operating results and trends in comparing Codere Online’s financial measures with other similar companies, many of which present similar non-GAAP financial measures to investors. These non-GAAP financial measures are subject to inherent limitations as they reflect the exercise of judgments by management about which expense and income are excluded or included in determining these non-GAAP financial measures. Reconciliations of non-GAAP financial measures to their most directly comparable measure under IFRS are included herein.

This document may include certain projections of non-GAAP financial measures. Codere Online is unable to quantify certain amounts that would be required to be included in the most directly comparable U.S. GAAP or IFRS financial measures without unreasonable effort, due to the inherent difficulty and variability of accurately forecasting the occurrence and financial impact of the various adjusting items necessary for such comparable measures or such reconciliation that have not yet occurred, are out of our control, or cannot be reasonably predicted, ascertained or assessed, which could have a material impact on its future IFRS financial results. Consequently, no disclosure of estimated comparable U.S. GAAP or IFRS measures is included and no reconciliation of the forward-looking non-GAAP financial measures is included.

Use of Projections
This document contains financial forecasts with respect to Codere Online’s business and projected financial results, including net gaming revenue and adjusted EBITDA. Codere Online’s independent auditors have not audited, reviewed, compiled or performed any procedures with respect to the projections for the purpose of their inclusion in this document, and accordingly, they did not express an opinion or provide any other form of assurance with respect thereto for the purpose of this document. These projections should not be relied upon as being necessarily indicative of future results. The assumptions and estimates underlying the prospective financial information are inherently uncertain and are subject to a wide variety of significant business, economic and competitive risks and uncertainties that could cause actual results to differ materially from those contained in the prospective financial information. See “Forward-Looking Statements” above. Accordingly, there can be no assurance that the prospective results are indicative of the future performance of Codere Online or that actual results will not differ materially from those presented in the prospective financial information. Inclusion of the prospective financial information in this document should not be regarded as a representation by any person that the results contained in the prospective financial information will be achieved.

For further information on the limitations and assumptions underlying these projections, please refer to Codere Online’s filings with the SEC.

Preliminary Information
This document contains figures, financial metrics, statistics and other information that is preliminary and subject to change (the “Preliminary Information”). The Preliminary Information has not been audited, reviewed, or compiled by any independent registered public accounting firm. This Preliminary Information is subject to ongoing review including, where applicable, by Codere Online’s independent auditors. Accordingly, no independent registered public accounting firm has expressed an opinion or any other form of assurance with respect to the Preliminary Information. During the course of finalizing such Preliminary Information, adjustments to such Preliminary Information presented herein may be identified, which may be material. Codere Online undertakes no obligation to update or revise the Preliminary Information set forth in this document as a result of new information, future events or otherwise, except as otherwise required by law. The Preliminary Information may differ from actual results. Therefore, you should not place undue reliance upon this Preliminary Information. The Preliminary Information is not a comprehensive statement of financial results, and should not be viewed as a substitute for full financial statements prepared in accordance with IFRS. In addition, the Preliminary Information is not necessarily indicative of the results to be achieved in any future period.

No Offer or Solicitation
This document does not constitute an offer to sell or the solicitation of an offer to buy any securities, nor will there be any sale of securities in any states or jurisdictions in which such offer, solicitation or sale would be unlawful prior to registration or qualification under the securities laws of any such jurisdiction. No offering of securities will be made except by means of a prospectus meeting the requirements of section 10 of the Securities Act of 1933, as amended, or an exemption therefrom.

Trademarks
This document may contain trademarks, service marks, trade names and copyrights of Codere Online or other companies, which are the property of their respective owners. Solely for convenience, some of the trademarks, service marks, trade names and copyrights referred to in this document may be listed without the TM, SM, © or ® symbols, but Codere Online will assert, to the fullest extent under applicable law, the rights of the applicable owners, if any, to these trademarks, service marks, trade names and copyrights.

Industry and Market Data
In this document, Codere Online relies on and refers to certain information and statistics obtained from publicly available information and third-party sources, which it believes to be reliable. Codere Online has not independently verified the accuracy or completeness of any such publicly-available and third-party information, does not make any representation as to the accuracy or completeness of such data and does not undertake any obligation to update such data after the date of this document. You are cautioned not to give undue weight to such industry and market data.

Contacts:

Investors and Media
Guillermo Lancha
Director, Investor Relations and Communications
[email protected]
(+34) 628.928.152


1 Net Gaming Revenue is a non-IFRS measure; please see reconciliation of Net Gaming Revenue to Revenue at the end of the report.

2 Adjusted EBITDA is a non-IFRS measure; please see reconciliation of Adjusted EBITDA to Net Income at the end of the report. Net gaming revenue and Adjusted EBITDA outlooks are forward-looking non-IFRS measures; please see important disclaimers at the end of the report.
3 See “Preliminary Information” below.

4 Figures primarily reflect differences in recognition of revenue related to certain partner and affiliate agreements in place in Colombia, VAT impact from entry fees in Mexico and the impact from the application of inflation accounting (IAS 29) in Argentina.
5 Please refer to page 24 of our Q1 2026 Earnings Presentation for further details regarding this reconciliation.

Primary Logo

Source: Codere Online Luxembourg, S.A.

Release – 1-800-FLOWERS.COM, Inc. Reports Fiscal 2026 Third Quarter Results

Research News and Market Data on FLWS

May 07, 2026

Reports Revenue of $293.0 million, a Net Loss of $100.1 million, which includes a $45.2 millionnon-cash goodwill and intangible impairment charge, and an Adjusted EBITDA1 Loss of $31.2 million

JERICHO, N.Y.–(BUSINESS WIRE)– 1-800-FLOWERS.COM, Inc. (NASDAQ: FLWS), a leading provider of thoughtful expressions designed to help inspire customers to give more, connect more, and build more and better relationships, today reported results for its Fiscal 2026 third quarter ended March 29, 2026.

“During the third quarter, we continued to make meaningful progress on our strategic initiatives as we strengthen the business and position it for long-term, profitable growth,” said Adolfo Villagomez, Chief Executive Officer. “We delivered significantly improved performance across key customer experience metrics for Valentine’s Day, reflecting stronger execution and a clear focus on the customer. Importantly, we are beginning to see tangible evidence that these actions are improving performance across the business. We also made significant progress on our cost savings initiatives, achieving our previously announced two-year target ahead of plan, which reflects the discipline and execution across the organization. As we realize these savings, we are thoughtfully deploying them, including reinvesting a portion back into the business as we shift toward a more balanced approach and begin testing targeted marketing investments to support stabilization and future growth. While our work is not complete, we are encouraged by the progress we are making.”

Fiscal 2026 Third Quarter Performance

  • Total consolidated revenues decreased 11.6% to $293.0 million, compared with the prior year period, primarily reflecting a strategic shift to improve marketing effectiveness and profitability. Consumer Floral & Gifts revenues declined 18.7%, while Gourmet Foods & Gift Baskets revenues were essentially flat, benefitting from the timing of Easter. Performance in the Consumer Floral & Gifts segment reflects the more pronounced impact of prior-year inefficient marketing spend, along with ongoing changes in search engine results pages and pressure on direct traffic.
  • Gross profit margin increased 150 basis points to 33.2%, compared with 31.7% in the prior year period. Excluding the impact of system implementation issues in the year ago period, gross profit margin improved 10 basis points as compared with the prior year period.
  • Operating expenses decreased $106.6 million year-over-year to $191.9 million. Results for the current period include a $45.2 million non-cash goodwill and intangible impairment charge related to the Company’s Consumer Floral & Gifts segment and its Personalization Mall trademark. Excluding non-recurring charges and the impact of the Company’s non-qualified deferred compensation plan in both periods, operating expenses decreased $16.4 million as compared with the prior year to $144.3 million, primarily due to lower marketing and labor costs.
  • Net loss for the quarter was $(100.1) million, or $(1.56) per diluted share, as compared to a net loss of $(178.2) million, or $(2.80) per share, in the prior year period.
  • Adjusted net loss1 was $(49.6) million, or $(0.77) per diluted share, compared with an Adjusted net loss1 of $(44.9) million, or $(0.71) per share, in the prior year period.
  • Adjusted EBITDA1 for the quarter was $(31.2) million, compared with Adjusted EBITDA1 of $(34.9) million in the prior year period.
  1. Refer to “Definitions of Non-GAAP Financial Measures” and the tables attached at the end of this press release for reconciliation of non-GAAP results to applicable GAAP results.

Segment Results

The Company provides Fiscal 2026 third quarter selected financial results for its Gourmet Foods & Gift Baskets, Consumer Floral & Gifts, and BloomNet® segments in the tables attached to this release and as follows:

  • Gourmet Foods & Gift Baskets: For the quarter, revenues were $106.9 million, essentially flat compared with the prior year period. Excluding system implementation costs in the prior year period, gross profit margin increased 10 basis points to 22.6%, as cost reduction initiatives offset higher tariffs and commodity costs. The segment contribution margin1 loss was $(15.8) million, compared with $(22.3) million in the prior year period, excluding severance and system implementation costs.
  • Consumer Floral & Gifts: For the quarter, revenues declined 18.7% to $159.4 million, as compared with the prior year period. Gross profit margin increased 120 basis points from the prior year period to 38.0%, reflecting improved pricing discipline, more targeted promotional activity, and better alignment between florist-fulfilled and direct shipment offerings, partially offset by higher tariffs. The segment contribution marginwas $10.4 million, compared with $6.5 million in the prior year period, excluding severance and impairment costs.
  • BloomNet: For the quarter, revenues decreased 5.9% to $26.9 million, as compared with the prior year period. Gross profit margin declined 50 basis points from the prior year period to 46.4%. The segment contribution margin1 was $7.5 million, compared with $8.5 million in the prior year period, excluding severance costs.

Fiscal Year 2026 Outlook

The Company continues to view Fiscal 2026 as a foundational year focused on stabilizing the business, improving execution, and building a stronger platform for long-term growth through its strategic priorities, including enhancing its customer-first approach, expanding third-party distribution, improving marketing efficiency, and driving structural cost savings. These actions are strengthening the foundation for sustainable revenue and profit growth over time.

For Fiscal Year 2026, the Company expects revenue to decline by approximately 10% to 12% as compared with the prior year and Adjusted EBITDA to be approximately breakeven, within a range of plus or minus $2 million, which includes approximately $22 million of anticipated incentive compensation and consultant costs incurred during the fiscal year. These expectations reflect the continued impact of a more disciplined marketing strategy, changes in search engine results pages affecting organic traffic, and the ongoing transition toward a more efficient demand-generation model.

Conference Call

The Company will conduct a conference call to discuss its financial results today, May 7, 2026, at 8:00 a.m. (ET). The conference call will be webcast from the Investors section of the Company’s website at www.1800flowersinc.com. A recording of the call will be posted on the Investors section of the Company’s website within two hours of the call’s completion.

Definitions of non-GAAP Financial Measures:

We sometimes use financial measures derived from consolidated financial information, but not presented in our financial statements prepared in accordance with U.S. generally accepted accounting principles (“GAAP”). Certain of these are considered “non-GAAP financial measures” under the U.S. Securities and Exchange Commission rules. Non-GAAP financial measures referred to in this document are either labeled as “non-GAAP,” “adjusted” or designated as such with a “1”. See below for definitions and the reasons why we use these non-GAAP financial measures. Where applicable, see the Selected Financial Information below for reconciliations of these non-GAAP measures to their most directly comparable GAAP financial measures. Reconciliations for forward-looking figures would require unreasonable efforts at this time because of the uncertainty and variability of the nature and amount of certain components of various necessary GAAP components, including, for example, those related to compensation, tax items, amortization or others that may arise during the year, and the Company’s management believes such reconciliations would imply a degree of precision that would be confusing or misleading to investors. For the same reasons, the Company is unable to address the probable significance of the unavailable information. The lack of such reconciling information should be considered when assessing the impact of such disclosures.

EBITDA and Adjusted EBITDA:

We define EBITDA as net income (loss) before interest, taxes, depreciation, and amortization. Adjusted EBITDA is defined as EBITDA adjusted for the impact of stock-based compensation, Non-Qualified Deferred Compensation Plan (“NQDC”) investment appreciation/depreciation, and for certain items affecting period-to-period comparability. See Selected Financial Information for details on how EBITDA and Adjusted EBITDA were calculated for each period presented. The Company presents EBITDA and Adjusted EBITDA because it considers such information meaningful supplemental measures of its performance and believes such information is frequently used by the investment community in the evaluation of similarly situated companies. The Company uses EBITDA and Adjusted EBITDA as factors to determine the total amount of incentive compensation available to be awarded to executive officers and other employees. The Company’s credit agreement uses EBITDA and Adjusted EBITDA-related items to determine its interest rate and to measure compliance with certain covenants. EBITDA and Adjusted EBITDA are also used by the Company to evaluate and price potential acquisition candidates. EBITDA and Adjusted EBITDA have limitations as analytical tools and should not be considered in isolation or as a substitute for analysis of the Company’s results as reported under GAAP. Some of the limitations are: (a) EBITDA and Adjusted EBITDA do not reflect changes in, or cash requirements for, the Company’s working capital needs; (b) EBITDA and Adjusted EBITDA do not reflect the interest expense, or the cash requirements necessary to service interest or principal payments, on the Company’s debts; and (c) although depreciation and amortization are non-cash charges, the assets being depreciated and amortized may have to be replaced in the future and EBITDA does not reflect any cash requirements for such capital expenditures. EBITDA and Adjusted EBITDA should only be used on a supplemental basis combined with GAAP results when evaluating the Company’s performance.

Segment Contribution Margin and Adjusted Segment Contribution Margin:

We define Segment Contribution Margin as earnings before interest, taxes, depreciation, and amortization, before the allocation of corporate overhead expenses. Adjusted Segment Contribution Margin is defined as Segment Contribution Margin adjusted for certain items affecting period-to-period comparability. See Selected Financial Information for details on how Segment Contribution Margin and Adjusted Segment Contribution Margin were calculated for each period presented. When viewed together with our GAAP results, we believe Segment Contribution Margin and Adjusted Segment Contribution Margin provide management and users of the financial statements meaningful information about the performance of our business segments. Segment Contribution Margin and Adjusted Segment Contribution Margin are used in addition to and in conjunction with results presented in accordance with GAAP and should not be relied upon to the exclusion of GAAP financial measures. The material limitation associated with the use of Segment Contribution Margin and Adjusted Segment Contribution Margin is that they are an incomplete measure of profitability as they do not include all operating expenses or non-operating income and expenses. Management compensates for this limitation when using these measures by looking at other GAAP measures, such as Operating Income (Loss) and Net Income (Loss).

Adjusted Net Income (Loss) and Adjusted or Comparable Net Income (Loss) Per Common Share:

We define Adjusted Net Income (Loss) and Adjusted or Comparable Net Income (Loss) Per Common Share as Net Income (Loss) and Net Income (Loss) Per Common Share adjusted for certain items affecting period-to-period comparability. See Selected Financial Information below for details on how Adjusted Net Income (Loss) Per Common Share and Adjusted or Comparable Net Income (Loss) Per Common Share were calculated for each period presented. We believe that Adjusted Net Income (Loss) and Adjusted or Comparable Net Income (Loss) Per Common Share are meaningful measures because they increase the comparability of period-to-period results. Since these are not measures of performance calculated in accordance with GAAP, they should not be considered in isolation of, or as a substitute for, GAAP Net Income (Loss) and Net Income (Loss) Per Common Share, as indicators of operating performance and they may not be comparable to similarly titled measures employed by other companies.

Free Cash Flow:

We define Free Cash Flow as net cash provided by (used in) operating activities less capital expenditures. The Company considers Free Cash Flow to be a liquidity measure that provides useful information to management and investors about the amount of cash generated by the business after the purchases of fixed assets, which can then be used to, among other things, invest in the Company’s business, make strategic acquisitions, strengthen the balance sheet, and repurchase stock or retire debt. Free Cash Flow is a liquidity measure that is frequently used by the investment community in the evaluation of similarly situated companies. Since Free Cash Flow is not a measure of performance calculated in accordance with GAAP, it should not be considered in isolation or as a substitute for analysis of the Company’s results as reported under GAAP. A limitation of the utility of Free Cash Flow as a measure of financial performance is that it does not represent the total increase or decrease in the Company’s cash balance for the period.

About 1-800-FLOWERS.COM, Inc.

1-800-FLOWERS.COM, Inc. is a leading provider of thoughtful expressions designed to help inspire customers to give more, connect more, and build more and better relationships. The Company’s e-commerce business platform features an all-star family of brands, including: 1-800-Flowers.com®, 1-800-Baskets.com®, Card Isle®, Cheryl’s Cookies®, Harry & David®, PersonalizationMall.com®, Shari’s Berries®, FruitBouquets.com®, Things Remembered®, Moose Munch®, The Popcorn Factory®, Wolferman’s Bakery®, Vital Choice®, Simply Chocolate® and Scharffen Berger®. Through the Celebrations Passport® loyalty program, which provides members with free standard shipping and no service charge on eligible products across our portfolio of brands, 1-800-FLOWERS.COM, Inc. strives to deepen relationships with customers. The Company also operates BloomNet®, an international floral and gift industry service provider offering a broad-range of products and services designed to help members grow their businesses profitably; Napco℠, a resource for floral gifts and seasonal décor; and DesignPac®, a manufacturer of gift baskets and towers. 1-800-FLOWERS.COM, Inc. was recognized among America’s Most Trustworthy Companies by Newsweek for 2024. 1-800-FLOWERS.COM, Inc. was also recognized as one of America’s Most Admired Workplaces for 2025 by Newsweek and was named to the Fortune 1000 list in 2022. Shares in 1-800-FLOWERS.COM, Inc. are traded on the NASDAQ Global Select Market, ticker symbol: FLWS. For more information, visit 1800flowersinc.com.

FLWS-COMP
FLWS-FN

Special Note Regarding Forward Looking Statements:

This press release contains forward-looking statements within the meaning of the Private Securities Litigation Reform Act of 1995. These forward-looking statements represent the Company’s current expectations or forecasts concerning future events; they do not relate strictly to historical or current facts. Such statements can generally be identified by words such as “anticipate,” “estimate,” “expect,” “project,” “intend,” “plan,” “believe,” “foresee,” “forecast,” “likely,” “should,” “will,” “target,” or similar words or phrases. These forward-looking statements are subject to risks, uncertainties, and other factors, many of which are outside of the Company’s control, which could cause actual results to differ materially from the results expressed or implied in the forward-looking statements, including, but not limited to, statements relating to future actions; the Company’s ability to leverage its operating platform and reduce its operating expense ratio; its ability to successfully integrate acquired businesses and assets; its ability to successfully execute its strategic priorities; its ability to cost effectively acquire and retain customers and drive purchase frequency; the outcome of contingencies, including legal proceedings in the normal course of business; its ability to compete against existing and new competitors; its ability to manage expenses associated with sales and marketing and necessary general and administrative and technology investments; its ability to reduce promotional activities and achieve more efficient marketing programs; and general consumer sentiment and industry and economic conditions that may affect levels of discretionary customer purchases of the Company’s products. The Company cannot guarantee that any forward-looking statement will be realized. Achievement of future results is subject to risk, uncertainties and potentially inaccurate assumptions. Should known or unknown risks or uncertainties materialize, or should underlying assumptions prove inaccurate, actual results could differ materially from past results and those anticipated, estimated or projected. You should bear this in mind as you consider forward-looking statements. The Company undertakes no obligation to publicly update any of the forward-looking statements, whether because of new information, future events or otherwise, made in this release or in any of its SEC filings. Consequently, you should not consider any such list to be a complete set of all potential risks and uncertainties. For a more detailed description of these and other risk factors, refer to the Company’s SEC filings, including the Company’s Annual Reports on Form 10-K and its Quarterly Reports on Form 10-Q.

View full release here.

Investor Contact:

Andy Milevoj

[email protected]

Media Contact:

[email protected]

Source: 1-800-FLOWERS.COM, Inc.

Release – Gyre Therapeutics Reports First Quarter 2026 Results and Provides Business Update

Research News and Market Data on GYRE

May 7, 2026

PDF Version

Q1 2026 revenue of $22.5 million; GAAP basic EPS: $(0.10)

Full year 2026 revenue guidance of $100.5 to $111.0 million affirmed

NDA for F351 (hydronidone) for CHB-associated liver fibrosis submitted to China’s CDE in March 2026

Completed acquisition of Cullgen in an approximately $300 million all-stock transaction, expanding pipeline into inflammatory diseases and cancers

First patient enrolled in Phase 2/3 trial evaluating ETUARY for radiation-induced lung injury, including immune-related pneumonitis

SAN DIEGO, May 07, 2026 (GLOBE NEWSWIRE) — Gyre Therapeutics, Inc. (Gyre, the Company or Gyre Therapeutics) (Nasdaq: GYRE), an innovative, commercial stage biopharmaceutical company with operations in the United States and China, today announced financial results for the first quarter ended March 31, 2026, and provided a business update.

“Building on our successful pre-NDA meeting with China’s CDE at the beginning of the year, we are particularly encouraged by the NMPA’s priority review designation for F351, reinforcing both the strength of our clinical data and the significant unmet need in liver fibrosis,” said Ying Luo, Chief Executive Officer of Gyre Therapeutics. “In parallel, our acquisition of Cullgen expands our capabilities into targeted protein degradation, positioning Gyre to drive long-term innovation beyond fibrosis. We believe these achievements strengthen our foundation as a fully integrated, multi-national biopharmaceutical company as we advance our mission to deliver transformative therapies to patients worldwide.”

First Quarter Business Highlights and Upcoming Milestones

Commercial Products:

ETUARY (pirfenidone), the Company’s primary product, generated $21.0 million in sales for the quarter ended March 31, 2026, compared to $21.7 million for the same period in 2025. Etorel (nintedanib ethanesulfonate soft capsules), which was launched in June 2025, generated $0.7 million in sales for the quarter ended March 31, 2026. Contiva (avatrombopag maleate tablets), launched in March 2025, generated $0.8 million in sales for the quarter ended March 31, 2026, compared to $0.3 million for the same period in 2025.

Pipeline Development Updates

Hydronidone (F351):

In March 2026, Gyre announced that the Center for Drug Evaluation (CDE) of China’s National Medical Products Administration (NMPA) granted priority review designation to F351 for the treatment of chronic hepatitis B (CHB)-associated liver fibrosis. Subsequently, Gyre, through its majority-owned subsidiary Gyre Pharmaceuticals Co., Ltd., submitted a New Drug Application (NDA) to the CDE to seek conditional approval for this indication, which is currently under completeness review for acceptance.

Pirfenidone (ETUARY):

A Phase 3 trial of pirfenidone for the treatment of pneumoconiosis (PD) in the People’s Republic of China (PRC) completed enrollment in 2025. A total of 272 patients were enrolled evaluating the efficacy and safety of 52 weeks of pirfenidone capsule treatment in patients with PD versus placebo. The final patient is expected to complete the study in the third quarter of 2026.

In April 2026, Gyre initiated its adaptive Phase 2/3 clinical trial in oncology-related pulmonary complications, with the first patient enrolled. The trial is evaluating pirfenidone for radiation-induced lung injury (RILI), including cases complicated by immune-related pneumonitis, at leading oncology centers.

Corporate Updates:

  • In March 2026, Gyre announced its acquisition of Cullgen Inc., a clinical-stage biopharmaceutical company, to create a fully integrated biopharmaceutical company with U.S.- and China-based capabilities. The transaction was completed in May 2026. The acquisition will supplement Gyre’s fibrosis-focused pipeline with novel targeted protein degrader and degrader antibody conjugate product candidates designed to eliminate therapeutically relevant proteins in patients for the treatment of critical conditions including inflammatory diseases and cancers.
  • Concurrent with the acquisition of Cullgen, Gyre is undertaking a comprehensive evaluation of its pipeline and clinical development strategy to prioritize programs across the combined organization. The Company intends to provide further updates regarding its strategic direction upon completion of this evaluation.

Financial Results

Cash Position

As of March 31, 2026, Gyre held $37.5 million in cash and cash equivalents, $12.3 million in short-term bank deposits, and $29.4 million in long-term certificates of deposit, totaling $79.2 million. Compared to $75.9 million as of December 31, 2025, total cash increased by $3.3 million, or 4%, primarily driven by higher customer collections and reduced tax payments.
Financial Results for the Three Months Ended March 31, 2026

  • Revenues: Revenues for the three months ended March 31, 2026 were $22.5 million, compared to $22.1 million for the same period in 2025. The $0.4 million, or 2%, increase was primarily due to the increase in Contiva and Etorel sales by approximately $0.5 million and $0.7 million, respectively, partially offset by the decrease in ETUARY sales and other products sales by approximately $0.7 million and $0.1 million, respectively. Contiva was launched in March 2025, and Etorel was not commercially launched until June 2025. ETUARY revenue declined by approximately 3% year-over-year, primarily attributable to the seasonal fluctuation in 2026 compared to 2025.
  • Cost of Revenues: For the three months ended March 31, 2026, cost of revenues was $1.2 million, compared to $0.9 million for the same period in 2025. The $0.3 million, or 37%, increase was primarily driven by to a $0.3 million rise in early production costs for Etorel cost of sales and a $0.2 million increase in stock-based compensation expense, partially offset by a $0.2 million decrease in ETUARY cost of sales.
  • Selling and Marketing Expense: For the three months ended March 31, 2026, selling and marketing expense was $14.1 million, compared to $10.8 million for the same period in 2025. The $3.3 million, or 30%, increase was primarily driven by to a $2.9 million increase in promotion expenses for Etorel and Contiva, and early-stage preparation activities for F351 commercial launch, and a $1.0 million increase in stock-based compensation expense, partially offset by a $0.5 million decrease in staff cost due to a decrease in bonus and a $0.1 million decrease in travel and other expenses.
  • Research and Development Expense: For the three months ended March 31, 2026, research and development expense was $6.7 million, compared to $3.1 million for the same period in 2025. The $3.6 million, or 118%, increase was primarily attributable to Gyre Pharmaceuticals and was driven by a $2.0 million increase in clinical research expenses, primarily relating to the Phase 3c and other clinical trial for F351 in the PRC requested by NMPA. The increase also reflects a $0.5 million increase in materials and utilities expenses, and a $1.1 million increase attributable to Gyre Therapeutics’ pre-clinical activities for future investigational new drug (IND) filings in the United States. These costs represent planned investments and are expected to continue in the near- to medium-term.
  • General and Administrative Expense: For the three months ended March 31, 2026, general and administrative expense was $7.3 million, compared to $5.0 million for the same period in 2025. The $2.3 million, or 46%, increase was primarily driven by a $0.8 million increase in stock-based compensation costs, a $0.9 million increase in staff costs due to the Company’s internal realignment of responsibilities and compensation adjustments, and a $0.6 million increase in miscellaneous expenses.
  • Transaction Costs: For the three months ended March 31, 2026, $2.5 million transaction costs were incurred in connection with the acquisition of Cullgen. As the merger transaction closed in early May 2026, we expect there will be additional non-recurring transaction costs incurred after the first quarter of 2026.
  • (Loss) Income from Operations: For the three months ended March 31, 2026, loss from operations was $9.4 million, compared to income from operations of $2.3 million for the same period in 2025. The $11.7 million decrease was primarily driven by $12.1 million increase in total operating expense driven by transactions costs, increased stock based compensation, expanded marketing expenses for Etorel and Contiva, early-stage preparation activities for ETUARY and Phase 3c and other clinical trial and pre-clinical activities, partially offset by a $0.4 million increase in revenue.
  • Net (Loss) Income: For the three months ended March 31, 2026, net loss was $9.9 million, compared to net income of $3.7 million for the same period in 2025. The $13.6 million decrease was primarily driven by an increase in operating expenses of $12.1 million, a decrease in other income of $2.2 million, partially offset by a decrease in income tax expense of $0.3 million, and an increase in revenue of $0.4 million.
  • Non-GAAP Adjusted Net (Loss) Income: For the three months ended March 31, 2026, non-GAAP adjusted net loss was $4.2 million, compared to non-GAAP adjusted net income of $2.9 million for the same period in 2025. The $7.1 million decrease was primarily driven by the increase in operating expenses of $5.6 million and a decrease in other income of $2.2 million, offset by an increase in revenue of $0.4 million and a decrease in income tax expenses of $0.3 million.

Use of Non-GAAP Financial Measures by Gyre Therapeutics, Inc.

Gyre reports financial results in accordance with accounting principles generally accepted in the United States (“GAAP”). This release presents the financial measure “adjusted net income,” which is not calculated in accordance with GAAP. The most directly comparable GAAP measure for this non-GAAP financial measure is “net income.” Adjusted net income presents Gyre’s results of operations after excluding gain from change in fair value of warrants, stock-based compensation, and provision for income taxes. This is meant to supplement, and not substitute, Gyre’s financial information presented in accordance with GAAP. Adjusted net income as defined by Gyre may not be comparable to similar non-GAAP measures presented by other companies. Management believes that presenting adjusted net income provides investors with additional useful information in evaluating Gyre’s performance and valuation. See the reconciliation of adjusted net income to net income in the section titled “Reconciliation of GAAP to Non-GAAP Financial Measures” below.

About F351

F351 is Gyre’s lead development candidate for the treatment of liver fibrosis that is being developed for two different indications. It is a structurally modified derivative of pirfenidone designed to optimize metabolic properties while targeting the TGF-β1 signaling pathway, a key mediator of fibrogenesis. Gyre is developing F351 for two primary indications: Chronic hepatitis B (CHB)-associated liver fibrosis in the PRC and MASH-associated liver fibrosis initially in the United States.

In the United States, Gyre has completed a Phase 1 clinical trial in healthy volunteers evaluating F351’s safety, tolerability, and PK. Gyre plans to file an Investigational New Drug (IND) application in the U.S. by the end of 2026, and, if the IND becomes effective, initiate a Phase 2 clinical trial.

About Gyre Pharmaceuticals

Gyre Pharmaceuticals is a commercial-stage biopharmaceutical company committed to the research, development, manufacturing and commercialization of innovative drugs for organ fibrosis. Its flagship product, ETUARY, was the first approved treatment for idiopathic pulmonary fibrosis in the PRC in 2011 and has maintained a prominent market share (2025 net sales of $116.6 million). In addition, Gyre Pharmaceuticals’ pipeline includes F351, a structural analogue of pirfenidone, which demonstrated statistically significant fibrosis regression after 52 weeks of treatment in a pivotal Phase 3 clinical trial in CHB-associated liver fibrosis in the PRC. F351 received Breakthrough Therapy designation by the NMPA CDE in March 2021. CDE granted priority review status to the NDA for F351 in March 2026. In March 2026, Gyre Pharmaceuticals Co., Ltd., submitted its NDA to the CDE to seek conditional approval for F351. Gyre Pharmaceuticals is also developing treatments for pneumoconiosis, RILI with or without immune-related pneumonitis, chronic obstructive pulmonary disease, pulmonary arterial hypertension and acute/acute-on-chronic liver failure. As of the first quarter of 2026, Gyre Therapeutics owns a 69.7% equity interest in Gyre Pharmaceuticals.

About Gyre Therapeutics

Gyre Therapeutics is a commercial-stage biopharmaceutical company headquartered in San Diego, CA focused on the development and commercialization of small-molecule therapeutics with its most advanced programs addressing organ fibrosis and inflammatory diseases.

Gyre’s wholly-owned subsidiary, Cullgen Inc., is a clinical-stage biopharmaceutical company focused on the discovery and development of targeted protein degrader and degrader-antibody conjugate (DAC) therapies for critical conditions including cancer and inflammatory diseases. Cullgen has created a portfolio of highly selective targeted protein degrader and DAC product candidates designed to potently and efficiently eliminate therapeutically relevant proteins in patients.

Forward-Looking Statements

This press release contains “forward-looking statements” within the meaning of the “safe harbor” provisions of the Private Securities Litigation Reform Act of 1995, which statements are subject to substantial risks and uncertainties and are based on estimates and assumptions. All statements, other than statements of historical facts included in this press release, are forward-looking statements, including statements concerning: the expectations regarding Gyre’s research and development efforts and the timing of expected clinical readouts and regulatory filings, including the timing of the CDE’s review of Gyre Pharmaceuticals’ submission of formal NDA for F351 as a treatment for CHB-induced liver fibrosis and Gyre Pharmaceuticals’ adaptive Phase 2/3 trial of pirfenidone for the treatment of RILI, the future operations of Gyre, the nature, strategy and focus of Gyre, the development and commercial potential and potential benefits of any product candidates of Gyre, the ability of Cullgen’s degraders and DACs to strengthen Gyre’s asset portfolio and the additional expected benefits of the acquisition, including Gyre’s ability to successfully integrate the businesses and operations of Gyre and Cullgen. In some cases, you can identify forward-looking statements by terms such as “may,” “might,” “will,” “objective,” “intend,” “should,” “could,” “can,” “would,” “expect,” “believe,” “design,” “estimate,” “predict,” “potential,” “plan” or the negative of these terms, and similar expressions intended to identify forward-looking statements. These statements reflect our plans, estimates, and expectations, as of the date of this press release. These statements involve known and unknown risks, uncertainties and other factors that could cause our actual results to differ materially from the forward-looking statements expressed or implied in this press release. Actual results and the timing of events could differ materially from those anticipated in such forward-looking statements as a result of these risks and uncertainties, which include, without limitation: Gyre’s ability to execute on its clinical development strategies; positive results from a clinical trial may not necessarily be predictive of the results of future or ongoing clinical trials; the timing or likelihood of regulatory filings and approvals; competition from competing products; the impact of general economic, health, industrial or political conditions in the United States or internationally; the sufficiency of Gyre’s capital resources and its ability to raise additional capital; supply chain and distribution delays and challenges. Additional risks and factors are identified under “Risk Factors” in Gyre’s Annual Report on Form 10-K for the year ended December 31, 2025 filed on March 13, 2026 and in other filings with the Securities and Exchange Commission.

Gyre expressly disclaims any obligation to update any forward-looking statements whether as a result of new information, future events or otherwise, except as required by law.

Contact:

Ying Luo, Chief Executive Officer and President

[email protected]

View full release here.

Healthcare Staffing Leader Cross Country Healthcare Agrees to $437M Buyout — And Walks Away From Nasdaq

Cross Country Healthcare (Nasdaq: CCRN), a Boca Raton-based healthcare workforce solutions company, announced Tuesday it has entered into a definitive agreement to be taken private by San Francisco-based investment firm Knox Lane in an all-cash transaction valued at approximately $437 million. The deal represents one of the more notable small-cap M&A events in the healthcare sector so far in 2026, and it signals continued private equity appetite for AI-enabled workforce technology platforms.

Knox Lane will acquire all outstanding shares of CCRN at $13.25 per share — a 31% premium to the stock’s closing price on May 6 and a 45% premium to its 90-day volume-weighted average price. For shareholders who have been watching the stock lag in a difficult staffing market, the premium offers a meaningful exit at a price the public markets had not recently rewarded.

Once the deal closes — expected in Q3 2026, pending stockholder approval and regulatory sign-off — Cross Country Healthcare will delist from Nasdaq and operate as a privately held platform company within Knox Lane’s portfolio. The company will retain its name and brand.

At the core of this acquisition is Cross Country’s proprietary technology stack, particularly its Intellify® platform — a cloud-based workforce and vendor management system that integrates with hospital infrastructure to give health system leaders real-time visibility across both internal and contingent labor. The platform spans nursing, allied health, non-clinical, and locum tenens staffing and uses AI-driven analytics to help organizations forecast demand, reduce labor costs, and optimize workforce utilization. For a private equity firm, that kind of deeply embedded, data-rich platform is exactly the type of asset that becomes considerably more valuable away from the quarterly earnings pressure of the public markets.

Knox Lane’s investment thesis here is straightforward: take a company with four decades of operational credibility and a defensible technology moat, remove the public market constraints, and accelerate growth with additional strategic capital and operator support. The firm has built a reputation around exactly this playbook — pairing financial resources with sector expertise in areas like human capital, AI transformation, and supply chain optimization.

For the broader healthcare staffing market, this transaction is a signal worth watching. The industry has faced persistent headwinds since the post-pandemic surge in travel nurse demand normalized, compressing margins across the sector. CCRN’s stock had reflected that pressure. But the fact that a growth-oriented PE firm is willing to pay a 45% premium to the 90-day average suggests there is conviction that the demand cycle is closer to a floor than a peak — and that the right platform, properly capitalized and focused, can emerge from this environment in a significantly stronger position.

BofA Securities advised Cross Country Healthcare on the deal, with Davis Polk & Wardwell as legal counsel. Knox Lane was advised by MTS Health Partners, with Kirkland & Ellis serving as legal counsel.

The transaction is expected to close in the third quarter of 2026.

The GEO Group (GEO) – A Beat and a Raise


Thursday, May 07, 2026

Joe Gomes, CFA, Managing Director, Equity Research Analyst, Generalist , Noble Capital Markets, Inc.

Refer to the full report for the price target, fundamental analysis, and rating.

Overview. The GEO Group reported better than expected 1Q26 results. The outperformance reflects significant revenue growth from the contracts entered into throughout 2025. Operating expenses were favorably impacted by lower-than-expected labor costs compared to previous expectations. Management continues to expect 2026 to be very active as well on a contract basis and therefore believes the Company has upside potential across the diversified business segments.

1Q26 Results. Revenue increased 17% to $705.2 million, exceeding our $680 million estimate. First quarter 2026 adjusted EBITDA was $131.4  million, compared to $99.8  million for 1Q25, reflecting a 32% increase and above our $108.8 million estimate. GEO reported net income attributable to GEO operations of $38.3  million, or $0.29/sh, compared to net income attributable to GEO Operations of $19.6  million, or $0.14/sh, for 1Q25. We were at $29.2 million and $0.21/sh.


Get the Full Report

Equity Research is available at no cost to Registered users of Channelchek. Not a Member? Click ‘Join’ to join the Channelchek Community. There is no cost to register, and we never collect credit card information.

This Company Sponsored Research is provided by Noble Capital Markets, Inc., a FINRA and S.E.C. registered broker-dealer (B/D).

*Analyst certification and important disclosures included in the full report. NOTE: investment decisions should not be based upon the content of this research summary. Proper due diligence is required before making any investment decision. 

Star Equity Holdings, Inc. (STRR) – Proposal to Acquire GEE Group


Thursday, May 07, 2026

Joe Gomes, CFA, Managing Director, Equity Research Analyst, Generalist , Noble Capital Markets, Inc.

Refer to the full report for the price target, fundamental analysis, and rating.

An Offer. After disclosing a 5.4% equity holding in GEE Group back on January 22nd and announcing a desire to engage in merger discussions, Star Equity upped the ante yesterday, announcing a proposal to acquire GEE for $0.30 per share or about $33 million. The proverbial ball is now in GEE’s Board of Directors collective hands. We believe the combination makes sense from a strategic viewpoint, with the elimination of public company costs an added benefit.

Details. Star, subject to terms and conditions, is offering to acquire 100% of GEE’s common shares for $0.30 a share, with the purchase price paid in Star’s 10% Series A Cumulative Perpetual Preferred stock (NASDAQ: STRRP). The proposed price represents an approximate 40% premium to GEE’s January 21st stock price. As part of the deal, Star expects GEE’s top management to forego change in control payments, but the executives would receive payment of a year’s salary and target bonus, also in STRRP shares.


Get the Full Report

Equity Research is available at no cost to Registered users of Channelchek. Not a Member? Click ‘Join’ to join the Channelchek Community. There is no cost to register, and we never collect credit card information.

This Research is provided by Noble Capital Markets, Inc., a FINRA and S.E.C. registered broker-dealer (B/D).

*Analyst certification and important disclosures included in the full report. NOTE: investment decisions should not be based upon the content of this research summary. Proper due diligence is required before making any investment decision. 

Power Metallic Mines Inc. (PNPNF) – Drilling Reveals Exceptional Grade and Scale Potential at the Lion Zone


Thursday, May 07, 2026

Mark Reichman, Managing Director, Equity Research Analyst, Natural Resources, Noble Capital Markets, Inc.

Refer to the full report for the price target, fundamental analysis, and rating.

Drilling continues to reveal exceptional grades. Power Metallic Mines reported another strong set of drill results from the Lion Zone, highlighted by Hole PML 26-095, which returned 22 meters grading 11.46% copper equivalent, including two ultra high-grade intervals above 18% copper equivalent. The results reinforce the Lion Zone as an emerging polymetallic discovery with grades that exceed global copper mining averages.

New results confirm the growing scale of the deposit. The latest drilling confirms both the continuity and expansion potential of the deposit, with high-grade mineralization extending from near surface to depths of roughly 600 meters. This is important as the company advances toward its inaugural Mineral Resource Estimate expected in the third quarter of 2026, as strong continuity and scale could materially enhance future project economics and valuation.


Get the Full Report

Equity Research is available at no cost to Registered users of Channelchek. Not a Member? Click ‘Join’ to join the Channelchek Community. There is no cost to register, and we never collect credit card information.

This Research is provided by Noble Capital Markets, Inc., a FINRA and S.E.C. registered broker-dealer (B/D).

*Analyst certification and important disclosures included in the full report. NOTE: investment decisions should not be based upon the content of this research summary. Proper due diligence is required before making any investment decision. 

NN (NNBR) – First Look 1Q26


Thursday, May 07, 2026

Joe Gomes, CFA, Managing Director, Equity Research Analyst, Generalist , Noble Capital Markets, Inc.

Refer to the full report for the price target, fundamental analysis, and rating.

Overview. NN delivered a strong start to 2026, with first-quarter results rising to the high side of expectations across many metrics, including sales growth, adjusted EBITDA, margin rates, and new business wins. Management’s focus on targeted growth in new, higher-margin growth markets and ongoing operational improvements is paying off.

1Q26 Results. Net sales were up 12.1% to $118.5 million in 1Q26, driven primarily by the contribution of new business launches, precious metals pass-through pricing, higher volumes in certain areas, and favorable foreign exchange. Adjusted gross margin rose to 19.5% from 16.9%. Adjusted EBITDA was $14.1  million, an increase of 33.0%, compared to 1Q25 adjusted EBITDA of $10.6  million, driven primarily by improved sales mix and operating performance. NN adjusted net income was $1.0  million, or $0.02 per diluted common share, compared to adjusted net loss of $1.4  million, or ( $0.03) per diluted common share, in 1Q25.


Get the Full Report

Equity Research is available at no cost to Registered users of Channelchek. Not a Member? Click ‘Join’ to join the Channelchek Community. There is no cost to register, and we never collect credit card information.

This Company Sponsored Research is provided by Noble Capital Markets, Inc., a FINRA and S.E.C. registered broker-dealer (B/D).

*Analyst certification and important disclosures included in the full report. NOTE: investment decisions should not be based upon the content of this research summary. Proper due diligence is required before making any investment decision. 

Lucky Strike Entertainment (LUCK) – Cost Discipline and Consumer Resilience Set Stage for 2027 Upside


Thursday, May 07, 2026

Michael Kupinski, Director of Research, Equity Research Analyst, Digital, Media & Technology , Noble Capital Markets, Inc.

Jacob Mutchler, Research Associate, Noble Capital Markets, Inc.

Refer to the full report for the price target, fundamental analysis, and rating.

Lackluster fiscal Q3. The company reported revenue of $342.2 million, representing a 0.7% increase over the prior year, with same-store sales up 0.2%, marking a second consecutive quarter of positive comps. Net income improved year-over-year, while adjusted EBITDA of $109.0 million declined from the prior year, reflecting margin pressure. Profitability was impacted by elevated payroll costs and macro-related demand softness during the quarter.

Consumer resiliency. Performance was affected by weather disruptions and weaker corporate demand, particularly in tech-heavy West Coast markets. However, retail and league segments remained resilient, with leagues continuing to generate low single-digit growth and retail trends stabilizing. Importantly, management indicated that trends improved as the quarter ended, with early signs of stabilization observed in April.


Get the Full Report

Equity Research is available at no cost to Registered users of Channelchek. Not a Member? Click ‘Join’ to join the Channelchek Community. There is no cost to register, and we never collect credit card information.

This Company Sponsored Research is provided by Noble Capital Markets, Inc., a FINRA and S.E.C. registered broker-dealer (B/D).

*Analyst certification and important disclosures included in the full report. NOTE: investment decisions should not be based upon the content of this research summary. Proper due diligence is required before making any investment decision. 

DLH Holdings (DLHC) – First Look Fiscal 2Q26


Thursday, May 07, 2026

Joe Gomes, CFA, Managing Director, Equity Research Analyst, Generalist , Noble Capital Markets, Inc.

Refer to the full report for the price target, fundamental analysis, and rating.

Overview. Fiscal 2026 is a transition year for DLH. The previously disclosed conversion of legacy contracts to small businesses continues to impact y-o-y results, but the transition of these contracts is expected to be complete in the Company’s third quarter. In response, management proactively right-sized the cost structure to align with the current base business, protecting margins.  

2Q26 Results. Revenue of $59.3 million was slightly above our $58 million projection, but down 33.5% y-o-y. Adjusted EBITDA totaled $5.33 million, or a 9.0% margin, compared to $9.38 million, or a 10.5% margin in 2Q25. We were at $4.95 million. DLH reported a net loss of $2.5 million, or $0.17/sh, in the quarter, compared to EPS of $878,000, or $0.06/sh, last year. We had projected a net loss of $2.25 million, or $0.16/sh.


Get the Full Report

Equity Research is available at no cost to Registered users of Channelchek. Not a Member? Click ‘Join’ to join the Channelchek Community. There is no cost to register, and we never collect credit card information.

This Company Sponsored Research is provided by Noble Capital Markets, Inc., a FINRA and S.E.C. registered broker-dealer (B/D).

*Analyst certification and important disclosures included in the full report. NOTE: investment decisions should not be based upon the content of this research summary. Proper due diligence is required before making any investment decision. 

CoreCivic, Inc. (CXW) – First Look 1Q26


Thursday, May 07, 2026

Joe Gomes, CFA, Managing Director, Equity Research Analyst, Generalist , Noble Capital Markets, Inc.

Refer to the full report for the price target, fundamental analysis, and rating.

Overview. CoreCivic reported strong first quarter financial results, driven by the activation of four previously idled facilities since the first quarter of 2025. Notably, revenue from ICE grew 96.2% over the first quarter of 2025, reflecting the activation of the previously idle facilities and the acquisition of the Farmville Detention Center. Revenue from state customers increased 3.6% compared with the year-ago quarter, highlighted by per diem increases under a number of state contracts and population growth within the states of Georgia, Montana, and Colorado.

1Q26 Results. Revenue in 1Q26 totaled $614.7 million, up from $488.6 million in 1Q25. Reported net income was $37.9 million, or $0.38/sh, up from $25.1 million, or $0.23/sh, in 1Q25. Adjusted EPS increased to $0.40 from $0.23. Adjusted EBITDA in 1Q26 totaled $110.1 million, compared to $81 million last year.


Get the Full Report

Equity Research is available at no cost to Registered users of Channelchek. Not a Member? Click ‘Join’ to join the Channelchek Community. There is no cost to register, and we never collect credit card information.

This Company Sponsored Research is provided by Noble Capital Markets, Inc., a FINRA and S.E.C. registered broker-dealer (B/D).

*Analyst certification and important disclosures included in the full report. NOTE: investment decisions should not be based upon the content of this research summary. Proper due diligence is required before making any investment decision. 

Commercial Vehicle Group (CVGI) – Post Call Commentary


Thursday, May 07, 2026

Joe Gomes, CFA, Managing Director, Equity Research Analyst, Generalist , Noble Capital Markets, Inc.

Refer to the full report for the price target, fundamental analysis, and rating.

Growth Avenue. In Electrical Systems, CVG continues to pursue a differentiated solutions strategy, positioning the Company to increase content per vehicle. For example, due to the redundant nature from a safety perspective, the electrical content in an autonomous vehicle is almost double that of an ICE vehicle. This provides CVG with a significant growth opportunity, in our opinion. Similarly, in CVG’s legacy markets, as vehicles develop more content for either autonomous operation or feature comfort additions, that increases the content per vehicle.

End Markets. CVG’s key end markets, Electrical Systems and the Class 8 truck market, are showing signs of improvement. Management continues to expect the Electrical Systems market to expand by more than 10% in 2026. The Class 8 truck market is projected to grow by 9% in 2026, with recent orders suggesting the possibility of even greater growth.


Get the Full Report

Equity Research is available at no cost to Registered users of Channelchek. Not a Member? Click ‘Join’ to join the Channelchek Community. There is no cost to register, and we never collect credit card information.

This Company Sponsored Research is provided by Noble Capital Markets, Inc., a FINRA and S.E.C. registered broker-dealer (B/D).

*Analyst certification and important disclosures included in the full report. NOTE: investment decisions should not be based upon the content of this research summary. Proper due diligence is required before making any investment decision. 

Italian Pharma Giant Angelini Pays $4.1 Billion for Coral Gables-Based Catalyst Pharmaceuticals — and Gets a U.S. Beachhead in the Process

Catalyst Pharmaceuticals (Nasdaq: CPRX), the Coral Gables-based rare disease biopharmaceutical company, is being acquired by Rome-headquartered Angelini Pharma in an all-cash deal valued at approximately $4.1 billion — or $31.50 per share. The transaction, unanimously approved by both boards, marks one of the largest biopharma acquisitions of a U.S.-listed rare disease company so far in 2026, and it carries particular significance for Angelini: it’s the Italian pharma group’s formal entry into the U.S. market after more than a century of operations centered in Europe.

The deal price represents a 21% premium to Catalyst’s unaffected closing share price on April 22 — the last trading day before deal speculation began leaking into the market — and a 28% premium to the 30-day volume-weighted average price through that same date. Blackstone funds are participating in the transaction alongside select international partners, with BNP Paribas acting as sole global coordinator and underwriter of the financing package. The acquisition is not subject to a financing condition, and closing is expected in the third quarter of 2026.

For Angelini, the strategic logic is hard to argue with. Catalyst has spent over two decades quietly building one of the more defensible portfolios in rare neurology. Its flagship product, FIRDAPSE® (amifampridine), remains the only FDA-approved, evidence-based treatment for Lambert-Eaton myasthenic syndrome — a rare and debilitating autoimmune disorder — in patients aged six and up. Its second major asset, AGAMREE® (vamorolone), received FDA approval in 2023 as a novel corticosteroid for Duchenne Muscular Dystrophy in patients as young as two. Rounding out the portfolio is FYCOMPA® (perampanel), an antiepileptic drug for partial-onset and generalized tonic-clonic seizures, the U.S. rights to which Catalyst acquired from Eisai in 2023.

That portfolio — three FDA-approved products, all in neurological rare disease, all with established commercial infrastructure — is precisely what Angelini has been building toward. The company has spent the last five years pivoting its global strategy around central nervous system disorders and brain health, including a partnership with Blackstone Life Sciences in GRIN Therapeutics. Acquiring Catalyst doesn’t just add products; it adds a fully operational U.S. commercial engine that would take years and considerable capital to replicate organically.

There’s one additional wrinkle worth noting. Separately from the acquisition announcement, Catalyst disclosed it has resolved pending patent litigation with Hetero USA over a generic FIRDAPSE challenge. The settlement — terms of which are confidential and subject to FTC and DOJ review as required by law — eliminates a key IP overhang that had lingered over the company’s most critical revenue-generating asset. The timing of that resolution, announced alongside a $4.1 billion buyout, is not coincidental. Clean IP, commercial scale, and a motivated foreign buyer: Catalyst’s management team played this about as well as a rare disease company could.

For CPRX shareholders, the deal delivers immediate, certain cash value at a meaningful premium after the stock had already performed well relative to the broader small-cap biotech landscape. Once the deal closes, Catalyst will operate as a wholly owned subsidiary of Angelini Pharma and delist from Nasdaq.

J.P. Morgan advised Catalyst. Centerview Partners, BNP Paribas, and Morgan Stanley co-advised Angelini Pharma.