Mark Reichman, Managing Director, Equity Research Analyst, Natural Resources, Noble Capital Markets, Inc.
Hans Baldau, Associate Analyst, Noble Capital Markets, Inc.
Refer to the full report for the price target, fundamental analysis, and rating.
Double E Pipeline growth. Summit recently signed two new long-term take-or-pay agreements totaling 540 MMcf/d of incremental firm capacity on the Double E Pipeline, an 11-year, 210 MMcf/d contract with a large investment-grade shipper and an 11-year, 230 MMcf/d agreement with an undisclosed shipper, alongside the previously announced 100 MMcf/d Producers Midstream II commitment, which received an affirmative FID during the quarter. These contracts are expected to grow the Permian Segment Adj. EBITDA from ~$34 million in 2025 to ~$60 million by 2029.
2026 guidance. Summit expects full-year 2026 Adj. EBITDA of $225 million to $265 million, with total capital expenditures of $85 million to $105 million, including approximately $35 million attributable to Double E. The outlook assumes WTI at approximately $64 per barrel and Henry Hub at approximately $3.40 per MMBtu, both materially below current strip prices, suggesting meaningful upside if the commodity environment is sustained. The company expects 116 to 126 well connections supported by seven active rigs and approximately 90 DUCs.
Equity Research is available at no cost to Registered users of Channelchek. Not a Member? Click ‘Join’ to join the Channelchek Community. There is no cost to register, and we never collect credit card information.
This Research is provided by Noble Capital Markets, Inc., a FINRA and S.E.C. registered broker-dealer (B/D).
*Analyst certification and important disclosures included in the full report. NOTE: investment decisions should not be based upon the content of this research summary. Proper due diligence is required before making any investment decision.
Snail is a leading, global independent developer and publisher of interactive digital entertainment for consumers around the world, with a premier portfolio of premium games designed for use on a variety of platforms, including consoles, PCs and mobile devices.
Michael Kupinski, Director of Research, Equity Research Analyst, Digital, Media & Technology , Noble Capital Markets, Inc.
Jacob Mutchler, Research Associate, Noble Capital Markets, Inc.
Refer to the full report for the price target, fundamental analysis, and rating.
Strategic updates ahead of Q4 Earnings Call. At the Game Developers Conference (GDC) in San Francisco last week, the company provided updates across its game portfolio, outlining a steady pipeline of ARK franchise releases, expansions for existing titles, and new indie projects. The announcements were delivered ahead of the company’s Q4 and full-year 2025 earnings call scheduled for March 19, 2026, at 4:30 p.m. ET, providing a preview of its strategic product developments.
Strong Early Access sales. Notably, Bellwright has surpassed 1 million units sold on Steam during Early Access, demonstrating strong player engagement ahead of its 1.0 launch and planned expansion to Xbox and PlayStation. As a reminder, development is now fully in-house following the acquisition and integration of Donkey Crew, the Poland-based studio behind Bellwright, strengthening the franchise’s long-term potential.
Equity Research is available at no cost to Registered users of Channelchek. Not a Member? Click ‘Join’ to join the Channelchek Community. There is no cost to register, and we never collect credit card information.
This Company Sponsored Research is provided by Noble Capital Markets, Inc., a FINRA and S.E.C. registered broker-dealer (B/D).
*Analyst certification and important disclosures included in the full report. NOTE: investment decisions should not be based upon the content of this research summary. Proper due diligence is required before making any investment decision.
Mark Reichman, Managing Director, Equity Research Analyst, Natural Resources, Noble Capital Markets, Inc.
Hans Baldau, Associate Analyst, Noble Capital Markets, Inc.
Refer to the full report for the price target, fundamental analysis, and rating.
Updated feasibility study. Century recently filed its updated 2026 NI 43-101 feasibility study for its 100%-owned Angel Island Lithium Project in Nevada. The updated study reflects engineering optimization and improvements that materially strengthen the project’s economic profile and highlight Angel Island as one of the most significant and economically robust sedimentary lithium developments in the United States.
Lower initial capital expenditures. Phase I initial capital expenditures are estimated to be $997 million, a significant reduction from the $1.5 billion outlined in the 2024 Study. The updated study streamlines development into a two-phase approach. Phase I contemplates 7,500 tonnes per day (tpd) of mill feed, expanding to 15,000 tpd in Phase II beginning in Year 5. Phase II expansion capital is estimated at $660 million. A previously planned third expansion phase was eliminated, lowering overall capital requirements. The economic analysis is based on a 40-year production schedule, with planned life-of-mine average production of 26,500 tonnes per annum of battery-grade lithium carbonate.
Equity Research is available at no cost to Registered users of Channelchek. Not a Member? Click ‘Join’ to join the Channelchek Community. There is no cost to register, and we never collect credit card information.
This Company Sponsored Research is provided by Noble Capital Markets, Inc., a FINRA and S.E.C. registered broker-dealer (B/D).
*Analyst certification and important disclosures included in the full report. NOTE: investment decisions should not be based upon the content of this research summary. Proper due diligence is required before making any investment decision.
Jensen Huang doesn’t do small numbers. But the figure he dropped this week at Nvidia’s annual GTC conference in San Jose may be the most consequential projection in the history of the semiconductor industry — and the ripple effects extend well beyond one company’s balance sheet.
On Monday, Huang forecast that Nvidia’s flagship AI processors would generate $1 trillion in sales through 2027, citing computing demand that has increased “by 1 million times in the last two years.” Then on Tuesday he raised the stakes further, clarifying that the $1 trillion figure doesn’t even capture Nvidia’s full product portfolio. The company has “strong confidence of $1 trillion-plus,” Huang told an audience of analysts and investors, adding that Nvidia expects to close, book and ship more than $1 trillion in total business.
For context, Nvidia had previously forecast $500 billion in data center sales through the end of 2026. The new projection doubles that cumulative figure and extends the window another year — a signal that Huang sees no near-term ceiling on AI infrastructure demand.
Wall Street’s immediate reaction was measured. Nvidia shares jumped as much as 4.8% on Monday before leveling off, trading virtually unchanged by Tuesday afternoon. Some analysts flagged that extending the timeline to 2027 to reach $1 trillion doesn’t necessarily signal accelerating growth — it could simply mean a longer runway to the same destination.
But the more interesting story for small and microcap investors isn’t what happens to Nvidia’s stock. It’s what a $1 trillion AI buildout means for the hundreds of smaller companies that sit inside that ecosystem.
Huang used the conference to announce a significant expansion of Nvidia’s addressable market. The company is pushing deeper into central processing units — territory long dominated by Intel — and introduced semiconductors incorporating technology acquired from chip startup Groq. Nvidia also revealed it is developing chips designed specifically for data centers in outer space, opening an entirely new frontier for AI compute infrastructure.
Each of these moves creates downstream opportunities. CPU expansion pressures Intel and AMD but simultaneously creates openings for smaller, specialized chip designers and manufacturers. The Groq acquisition signals that Nvidia is willing to buy rather than build when speed to market demands it — a dynamic that historically elevates valuations across the small cap semiconductor and AI hardware landscape as larger players scout for targets.
On the capital allocation front, Nvidia’s CFO Colette Kress announced the company plans to direct approximately 50% of free cash flow toward buybacks and dividends in the second half of 2026, once current investment commitments are fulfilled. That shift from aggressive reinvestment toward shareholder returns is a maturity signal — one that typically pushes institutional capital to look further down the market cap spectrum for the growth rates that Nvidia itself once offered.
The AI infrastructure buildout is still in its early innings. A $1 trillion demand signal from the dominant player in the space is not just a headline — it is a directional marker for where capital, talent and M&A activity will flow for the next several years. Small cap investors who understand the supply chain beneath Nvidia stand to benefit most.
BERKELEY HEIGHTS, N.J., March 17, 2026 (GLOBE NEWSWIRE) — Tonix Pharmaceuticals Holding Corp. (Nasdaq: TNXP) (“Tonix” or the “Company”), a fully integrated, commercial biotechnology company, today announced an oral presentation and two poster presentations on its preclinical immuno-oncology portfolio at the American Association for Cancer Research (AACR) Annual Meeting 2026, being held April 17–22, 2026, in San Diego, California.
Oral Presentation Details
Title: TFF2 deficiency amplifies IL-1β-driven inflammation and promotes aging-associated gastric tumor progression Abstract #: 6822 Date and Time: April 21, 2026, 2:30–4:30 p.m. PT (5:30-7:30 p.m. ET) Session Category: Tumor Biology Session Title: Aging Micro- and Macro-Environments in Tumor Progression and Therapy Presenters: Shuang Li, MD, PhD, and Timothy C. Wang, MD, Herbert Irving Comprehensive Cancer Center, Columbia University Medical Center (Tonix co-authors: Seth Lederman, MD, Chief Executive Officer, and Bruce L. Daugherty, PhD, MBA, Executive Vice President of Research)
Poster Presentation Details
Title: In vitro characterization of fully human antagonistic anti-BTLA monoclonal antibodies Poster #: 6550 Date and Time: April 21, 2026, 2:00-5:00 p.m. PT (5:00-8:00 p.m. ET) Session Category: Clinical Research Session Title: Immune Checkpoint Blockade Location: Poster Section 44, Board 16 Presenter: Bruce Daugherty, PhD, MBA, Executive Vice President of Research, Tonix
Title: Pharmacokinetics of TNX-1700 in non-human primates and human FcRn/serum albumin transgenic mice Poster #: 7940 Date and Time: April 22, 2026, 9:00 a.m.–12:00 p.m. PT (12:00-3:00 p.m. ET) Session Category: Clinical Research Session Title: Tumor Microenvironment Modulators Location: Poster Section 49, Board 15 Presenter: Bruce Daugherty, PhD, MBA, Executive Vice President of Research, Tonix
About TNX-1700 TNX-1700, a fusion protein of TFF2 and albumin, is in preclinical development for the treatment of gastric and colorectal cancer in combination with PD-1 blockade. TNX-1700, in-licensed from Columbia University, is in the pre-Investigational New Drug (IND) stages of development.
Tonix Pharmaceuticals Holding Corp. Tonix Pharmaceuticals* is a fully-integrated, commercial-stage biotechnology company focused on central nervous system (CNS) and immunology treatments in areas of high unmet medical need. TONMYA® (cyclobenzaprine HCl sublingual tablets 2.8 mg), is the first new treatment for fibromyalgia in adults in more than 15 years. Tonix’s CNS commercial infrastructure supports its marketed products, including its acute migraine products, Zembrace® Symtouch® (sumatriptan injection 3 mg) and Tosymra® (sumatriptan nasal spray 10 mg). Tonix is investigating TONMYA in Phase 2 clinical trials to evaluate its potential in major depressive disorder and acute stress disorder. In addition, the company’s CNS portfolio includes TNX-2900, which is Phase 2 ready for the treatment of Prader-Willi syndrome, a rare disease. Tonix is also advancing a pipeline of immunology programs, including monoclonal antibody TNX-4800 for Lyme disease prophylaxis and TNX-1500, a third-generation CD40 ligand inhibitor for the prevention of kidney transplant rejection. To learn more, visit www.tonixpharma.com and follow the Company on LinkedIn and X.
*Tonix’s product development candidates are investigational new drugs or biologics; their efficacy and safety have not been established and have not been approved for any indication.
Zembrace SymTouch and Tosymra are registered trademarks of Tonix Medicines. TONMYA is a trademark of Tonix Pharma Limited. All other marks are property of their respective owners.
Forward Looking Statements Certain statements in this press release are forward-looking within the meaning of the Private Securities Litigation Reform Act of 1995 including those relating to the completion of the offering, the satisfaction of customary closing conditions, the intended use of proceeds from the offering and other statements that are predictive in nature. These statements may be identified by the use of forward-looking words such as “anticipate,” “believe,” “forecast,” “estimate,” “expect,” and “intend,” among others. These forward-looking statements are based on Tonix’s current expectations and actual results could differ materially as a result of a number of factors, including the ability of the Company to satisfy the conditions to the closing of the offering and the timing thereof, as well as those described in the Company’s Annual Report on Form 10-K for the year ended December 31, 2025, as filed with the SEC on March 12, 2026, and periodic reports filed with the SEC on or after the date thereof. Tonix does not undertake an obligation to update or revise any forward-looking statement. All of Tonix’s forward-looking statements are expressly qualified by all such risk factors and other cautionary statements. The information set forth herein speaks only as of the date thereof.
2025 Was a Transformative Year due to Merger Completed in Q3
OLD GREENWICH, Conn., March 17, 2026 (GLOBE NEWSWIRE) — Star Equity Holdings, Inc. (Nasdaq: STRR and STRRP) (“Star” or the “Company”), a diversified holding company, announced today financial results for the fourth quarter and full year ended December 31, 2025.
2025Fourth Quarter Summary
Revenue of $56.8 million increased 69% from the fourth quarter of 2024.
Gross profit of $24.2 million increased 38% from the fourth quarter of 2024.
Net loss attributable to common shareholders of $2.4 million, or $0.67 loss per diluted share, versus net loss attributable to common shareholders of $0.6 million, or $0.20 loss per diluted share, in the fourth quarter of 2024. Adjusted net loss attributable to common shareholders per diluted share (Non-GAAP measure)* was $0.10 compared to adjusted net income attributable to common shareholders per diluted share of $0.04 in the fourth quarter of 2024.
Adjusted EBITDA (Non-GAAP measure)* increased to $2.2 million, versus adjusted EBITDA of $0.9 million in the fourth quarter of 2024.
2025 Full-Year Summary
Revenue of $172.2 million increased 23% from 2024. Full year 2025 pro forma (“PF”)(1) revenue of $224.7 million increased 7% from 2024.
Gross profit of $79.9 million increased 14% from 2024. PF gross profit of $95.0 million increased 6% from 2024
Net loss attributable to common shareholders of $6.7 million, or 2.08 loss per diluted share, compared to net loss of $4.8 million, or $1.59 loss per diluted share, in 2024. Adjusted net loss attributable to common shareholders per diluted share (Non-GAAP measure)* of $0.20 increased from adjusted net loss attributable to common shareholders per diluted share of $0.49 in the prior year.
Adjusted EBITDA (Non-GAAP measure)* was $4.2 million, versus adjusted EBITDA of $0.9 million in 2024. PF adjusted EBITDA of $12.6 million increased from $4.4 million in 2024.
Total cash including restricted cash was $13.4 million at December 31, 2025.
Jeff Eberwein, Chief Executive Officer at Star, said, “Our fourth quarter and full-year financial results reflect positive momentum and improvement over the prior year quarter, largely attributable to the addition of the Building Solutions and Energy Services divisions which occurred with the merger that closed in August 2025.”
Jake Zabkowicz, Global CEO of Hudson Talent Solutions (“HTS”), noted, “HTS delivered a 4.8% revenue increase in the fourth quarter Full-year revenues remained relatively flat compared to 2024 despite macroeconomic challenges and significant ongoing pressure in the talent market. In 2025, we expanded our service offering with the implementation of agentic AI, positioning us at the forefront of the talent industry’s digital transformation.”
Rick Coleman, COO of Star, added, “Residential and commercial building demand were relatively soft throughout the year, but our Building Solutions segment delivered strong results, including significantly higher sales and profitability. Energy Services division performance was also strong as ADT expanded market share across all core markets with particularly robust growth in mining and geothermal. These results highlight the team’s ability to combine strong execution with innovation across a broad range of end markets and applications.”
Mr. Eberwein concluded, “2025 was a transformational year for Star. The merger that closed in August strengthened our operating and financial position, accelerated our growth strategy, and reinforced our conviction that our stock remains undervalued. To that end, we repurchased more than $2.6 million of stock during 2025 and expect to continue utilizing buybacks to enhance shareholder value.”
* The Company provides non-GAAP measures as a supplement to financial results based on accounting principles generally accepted in the United States (“GAAP”). Adjusted EBITDA, EBITDA, adjusted net income or loss, and adjusted net income or loss per diluted share are defined in the segment tables at the end of this release and a reconciliation of such non-GAAP measures to the most directly comparable GAAP measures is included within such segment tables.
Segment Highlights
Building Solutions
Fourth quarter 2025 Building Solutions revenue was $18.0 million and gross profit was $4.6 million. Fourth quarter Adjusted EBITDA was $1.9 million.
Full year 2025 Building Solutions revenue was $27.6 million and gross profit was $6.3 million. Full year 2025 Adjusted EBITDA was $2.5 million.
Full year 2025 PF Building Solutions revenue was $71.9 million, up from $60.1 million in 2024, and full year 2025 PF gross profit was $18.0 million versus $14.0 million in the prior year. Full year 2025. PF adjusted EBITDA was $7.2 million, up from adjusted EBITDA of $5.3 million a year ago.
Building Solutions backlog as of December 31, 2025 was $9.6 million, and the trailing 12-month book-to-bill ratio was 0.89.
Business Services
Fourth quarter 2025 Business Services revenue was $35.2 million, up from $33.6 million in the prior year quarter, while gross profit was $18.1 million, up from $17.6 million in the prior year quarter. Business Services adjusted EBITDA was $0.9 million, down from $1.5 million in the prior year quarter.
Full year 2025 Business Services revenue was $139.7 million, down from $140.1 million in the prior year, while gross profit was $71.8 million, up from $70.2 million in the prior year. Full year 2025 Business Services adjusted EBITDA was $5.0 million, up from $4.3 million in the prior year.
Regionally, APAC and Americas gross profit for full year 2025 grew 11.7% and 4.4%, respectively. This growth was offset by EMEA, where gross profit declined by (18.7)%.
Energy Services
Fourth quarter 2025 Energy Services revenue was $3.6 million. Fourth quarter 2025 gross profit was $1.6 million, and adjusted EBITDA was $0.9 million.
Full year 2025 Energy Services revenue was $4.9 million. Full year 2025 gross profit was $1.9 million and adjusted EBITDA was $1.0 million.
PF Energy Services revenue for full year 2025 was $13.2 million, up from $10.1 million in 2024, while PF gross profit was $5.5 million, down from $5.7 million in 2024. Full year 2025 PF adjusted EBITDA was $2.9 million, up from $2.1 million in 2024.
(1) PF Building Solutions, Energy Services, and Investments results from Star Operating Companies, Inc. for the full year of 2025 and 2024. PF Building Solutions reflects results from Timber Technologies for the full year in 2024. Timber Technologies was acquired by Star Operating Companies on May 17, 2024. PF Energy Services in 2025 and 2024 reflects Alliance Drilling Tools results, which was acquired by Star Operating Companies on March 3, 2025.
Corporate Costs
The Company’s corporate costs of $1.9 million for the fourth quarter of 2025 excluded $0.3 million of non-recurring expenses. This compares to corporate costs of $0.6 million in the fourth quarter of 2024, which excluded $0.0 million of non-recurring expenses.
The Company’s corporate costs of $4.9 million for full year 2025 excluded $2.5 million of non-recurring expenses. This compares to corporate costs of $3.4 million for full year 2024, which excluded $0.9 million of non-recurring expenses.
Liquidity and Capital Resources
The Company ended the fourth quarter of 2025 with $13.4 million in cash, including $3.1 million in restricted cash. The Company used $3.9 million in cash flow from operations in the fourth quarter of 2025 compared to $2.0 million generated in the fourth quarter of 2024. For full year 2025, the company used $7.3 million in cash flow from operations compared to $2.8 million in cash flow from operations in 2024. Year-end 2025 working capital excluding cash was $22.4 million, representing a temporary build-up that is expected to decline in the first quarter of 2026.
Share Repurchase Program
In the fourth quarter of 2025, the Company repurchased 5,964 shares for approximately $66,000. For the full year 2025, the Company repurchased 280,886 shares for approximately $2.6 million and has repurchased about $10 million of common stock since 2020. As of year-end 2025, the Company has $2.5 million remaining under its $3 million repurchase program authorized in September 2025 and continues to view share repurchases as an attractive use of capital.
NOL Carryforward
As of December 31, 2025, Star had $215 million of usable net operating losses (“NOL”) in the U.S., which the Company considers to be a very valuable asset for its stockholders. In order to protect the value of the NOL for all stockholders, the Company has a rights agreement and charter amendment in place that limit beneficial ownership of Star Equity common stock to 4.99%. Stockholders who wish to own more than 4.99% of Star Equity common stock, or who already own more than 4.99% of Star Equity common stock and wish to buy more, may only acquire additional shares with the Board’s prior written approval.
Preferred Stock Dividends
In Q4 2025, the Company’s board of directors (the “Board”) declared a quarterly cash dividend to holders of the Company’s 10% Series A Cumulative Perpetual Preferred Stock of $0.25 per share, paid on December 10, 2025 to the shareholders of record as of December 1, 2025.
In addition, on February 13, 2026, the Board declared a cash dividend to holders of the Company’s 10% Series A Cumulative Perpetual Preferred Stock of $0.25 per share. The record date for this dividend was March 1, 2026, and the payment date was March 10, 2026.
Conference Call/Webcast
The Company will conduct a conference call tomorrow, March 18, 2026, at 10:00 a.m. ET to discuss this announcement. Individuals wishing to listen can access the webcast on the investor information section of the Company’s web site at www.starequity.com.
If you wish to join the conference call, please use the dial-in information below:
Toll-Free Dial-In Number: 1 (833) 890-6161
International Dial-In Number: 1 (412) 504-9848
The archived call will be available on the investor information section of the Company’s web site at www.starequity.com.
About Star Equity Holdings, Inc.
Star Equity Holdings, Inc. is a diversified holding company that seeks to build long-term shareholder value by acquiring, managing, and growing businesses with strong fundamentals and market opportunities. Its current structure comprises four segments: Building Solutions, Business Services, Energy Services, and Investments. For more information visit www.starequity.com.
On August 22, 2025, the Company completed its previously announced acquisition of Star Operating Companies, Inc. (“Star Operating”, formerly known as Star Equity Holdings, Inc.), pursuant to the Agreement and Plan of Merger, dated as of May 21, 2025 (the “Merger Agreement”), by and among the Company, Star Operating and HSON Merger Sub, Inc., a wholly owned subsidiary of the Company (“Merger Sub”). Upon the terms and subject to the conditions of the Merger Agreement, on August 22, 2025, at the effective time of the merger pursuant to the Merger Agreement (the “Merger”), Merger Sub merged with and into Star Operating, with Star Operating continuing as the surviving corporation of the Merger as a wholly owned subsidiary of the Company. Effective September 5, 2025, the Company changed (i) its name to Star Equity Holdings, Inc. and (ii) its trading symbols on Nasdaq to STRR and STRRP.
Building Solutions The Building Solutions division operates in three niches: (i) modular building manufacturing; (ii) structural wall panel and wood foundation manufacturing, including building supply distribution operations; and (iii) glue-laminated timber (glulam) column, beam, and truss manufacturing.
Business Services The Business Services division provides flexible and scalable recruitment solutions to a global clientele, servicing organizations at all levels, from entry-level positions to the C-suite. The division focuses on mid-market and enterprise organizations worldwide, partnering consultatively with talent acquisition, HR, and procurement leaders to build diverse, high-impact teams and drive business success.
Energy Services The Energy Services division engages in the rental, sale, and repair of downhole tools used in the oil and gas, geothermal, mining, and water-well industries.
Investments The Investments division manages and finances the Company’s real estate assets as well as its investment positions in private and public companies.
This press release contains statements that the Company believes to be “forward-looking statements” within the meaning of Section 27A of the Securities Act of 1933, as amended, Section 21E of the Securities Exchange Act of 1934, as amended, and the Private Securities Litigation Reform Act of 1995. All statements other than statements of historical fact included in this press release, including statements regarding the Company’s future financial condition, results of operations, business operations and business prospects, are forward-looking statements. Words such as “anticipate,” “estimate,” “expect,” “project,” “intend,” “plan,” “predict,” “believe,” and similar words, expressions, and variations of these words and expressions are intended to identify forward-looking statements. All forward-looking statements are subject to important factors, risks, uncertainties, and assumptions, including industry and economic conditions that could cause actual results to differ materially from those described in the forward-looking statements. Such factors, risks, uncertainties, and assumptions include, but are not limited to, (1) global economic fluctuations, (2) changes in the cost and availability of commodities, materials, and equipment, (3) risks related to providing uninterrupted service to clients, (4) the ability of clients to terminate their relationship with the Company at any time, (5) risks associated with real estate ownership, (6) the Company’s ability to successfully achieve its strategic initiatives, (7) risks related to fluctuations in the Company’s operating results from quarter to quarter, (8) risks related to potential acquisitions or dispositions of businesses by the Company, (9) our profitability and growth being tied to the success of our operating businesses, (10) risks associated with our financial investments in other businesses, (11) our ability to improve existing products and services and develop, introduce, and market new products and services successfully, (12) the loss of or material reduction in our business with any of the Company’s largest customers, (13) competition in the Company’s markets, (14) risks related to potential decreases in demand for products, (15) our ability to maintain costs at an acceptable level, (16) the negative cash flows and operating losses that may recur in the future, (17) risks related to international operations, including foreign currency fluctuations, political events, trade wars, natural disasters or health crises, including the Russia-Ukraine war, and potential conflict in the Middle East, (18) risks relating to how future credit facilities may affect or restrict our operating flexibility, (19) our ability to generate or borrow sufficient cash to make payments on our indebtedness, (20) risks related to indebtedness, (21) risks associated with the Company’s investment strategy, (22) the Company’s dependence on key management personnel, (23) the Company’s ability to attract and retain highly skilled professionals, management, and advisors, (24) the Company’s ability to collect accounts receivable, (25) the Company’s exposure to legal proceedings, investigations and disputes, and limits on related insurance coverage, (26) the Company’s ability to utilize net operating loss carryforwards, (27) the potential for goodwill impairment, (28) volatility of the Company’s stock price, (29) risks related to our historically low trading volume, (30) risks related to securities or industry analysts, (31) the Company’s ability to declare dividends, (32) risks associated with failure to pay dividends on our Series A Preferred Stock, (33) our history of annual net losses, (34) risks related to our international operations, (35) risks related to compliance with federal and state laws, regulations, and other rules, (36) our exposure to employment-related claims, legal liability, and costs from clients, employees, and regulatory authorities, (37) risks related to the imposition of licensing or tax requirements or new regulations, (38) the effect of Anti-takeover provisions in our organizational documents, (39) the effect of the protective amendment contained in our Restated Certificate of Incorporation, (40) the impact of our stockholder rights plan, or “poison pill,” on stockholder decision making, (41) risks related to our scaled disclosure requirements as a smaller reporting company, (42) risks related to evolving ESG and DEI rules and regulations, (43) the Company’s heavy reliance on information systems and the impact of potentially losing or failing to develop technology, (44) the adverse impacts of cybersecurity threats and attacks, and (45) risks related to the use of new and evolving technologies, and (46) those risks set forth in “Risk Factors in the Company’s Annual Report on Form 10-K for the year ended December 31, 2025.” The foregoing list should not be construed to be exhaustive. Actual results could differ materially from the forward-looking statements contained in this press release. In view of these uncertainties, you should not place undue reliance on any forward-looking statements, which are based on our current expectations. These forward-looking statements speak only as of the date of this press release. The Company assumes no obligation, and expressly disclaims any obligation, to update any forward-looking statements, whether as a result of new information, future events or otherwise.
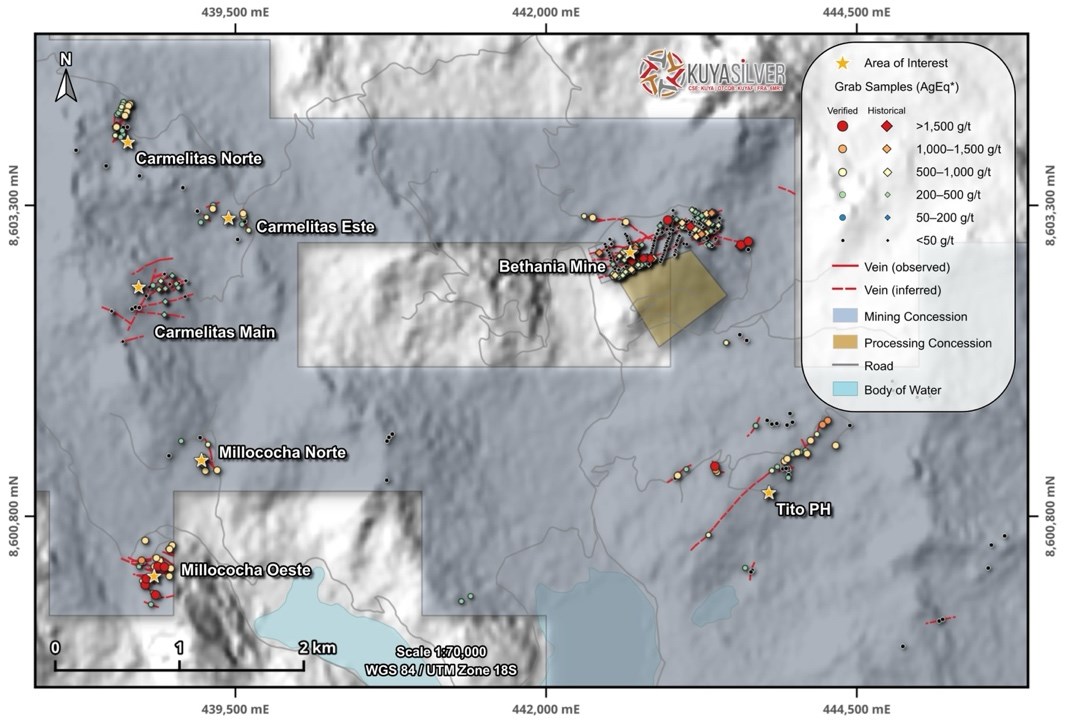
Toronto, Ontario–(Newsfile Corp. – March 17, 2026) – Kuya Silver Corporation (CSE: KUYA) (OTCQB: KUYAF) (FSE: 6MR1) (the “Company” or “KuyaSilver“) is pleased to announce an expansion of its fully-funded 2026 drill program at the Bethania Silver Project in central Peru designed to unlock value by focusing on delineating mineralized silver vein systems which have been historically underexplored. The program, expected to total approximately 20,000 metres combined underground and surface diamond drilling, would represent the largest drill program ever at the Bethania project.
The surface drill program is planned for approximately 10,000 metres and will focus on priority targets associated with historical artisanal mining areas identified during the Company’s recent regional exploration work, located outside the immediate Bethania mine area (Figure 1 below). These targets represent potential additions to the district-scale mineralized system and may also have potential for future production. Over the coming months Kuya Silver plans to conduct additional work to prioritize targets for the 2026 drill program which may include any of the six previously identified regional silver vein systems (e.g. Carmelitas, Tito PH, Millococha)
The Company also plans to expand on its previously announced underground drilling program to approximately 10,000 metres in 2026 (from 5,000 metres announced previously). Drilling will be conducted from established mine levels and is designed to test extensions of known mineralized structures that remain open along strike and at depth. This approach allows the Company to expand resources adjacent to current mine infrastructure while testing high-priority targets at relatively low cost and improving the geological continuity of the known vein system.
The combined surface and underground programs are expected to improve the geological understanding of the mineralized systems and support the Company’s ongoing efforts to grow resources within the broader Bethania district. Initial results from the underground drilling campaign are expected in Q2 2026 and additional drill results from underground and initial surface drilling results are expected over the second half of 2026.
“Following encouraging surface exploration results across the Bethania property, we are excited to begin the next phase of drilling,” stated Osbaldo Zamora, VP Exploration of Kuya Silver. “By combining surface drilling with underground drilling from existing workings, we are able to efficiently test both district-scale targets and near-mine extensions that could meaningfully expand the project’s resource base.”
David Stein, Kuya Silver’s President and CEO also remarked, “The Company is excited to embark on a much larger drill campaign covering multiple targets across the Bethania district. Given our significant cash position in excess of USD $25 million and expected cash flow from the Bethania mine, this more aggressive exploration strategy should be fully funded from internal sources and can be maintained and expanded over the coming years as we grow our silver mining operations.”
Figure 1: Bethania historical surface exploration results up to February 2026 showing all sample locations.
Surface drilling is expected to commence in the coming months following final permitting and logistical preparations. Over the past five plus years, Kuya Silver has consolidated in excess of 4,500 ha surrounding the Bethania mine. Various surface prospecting campaigns over the past several years has identified six different silver vein systems characterized by historical evidence of artisanal mining and outcropping veins with silver-polymetallic mineralization which have been mapped and sampled by Kuya Silver’s geologists. These additional vein systems can be subdivided into three areas located south (Tito PH), west (Carmelitas) and southwest (Millococha) of the Bethania silver mine.
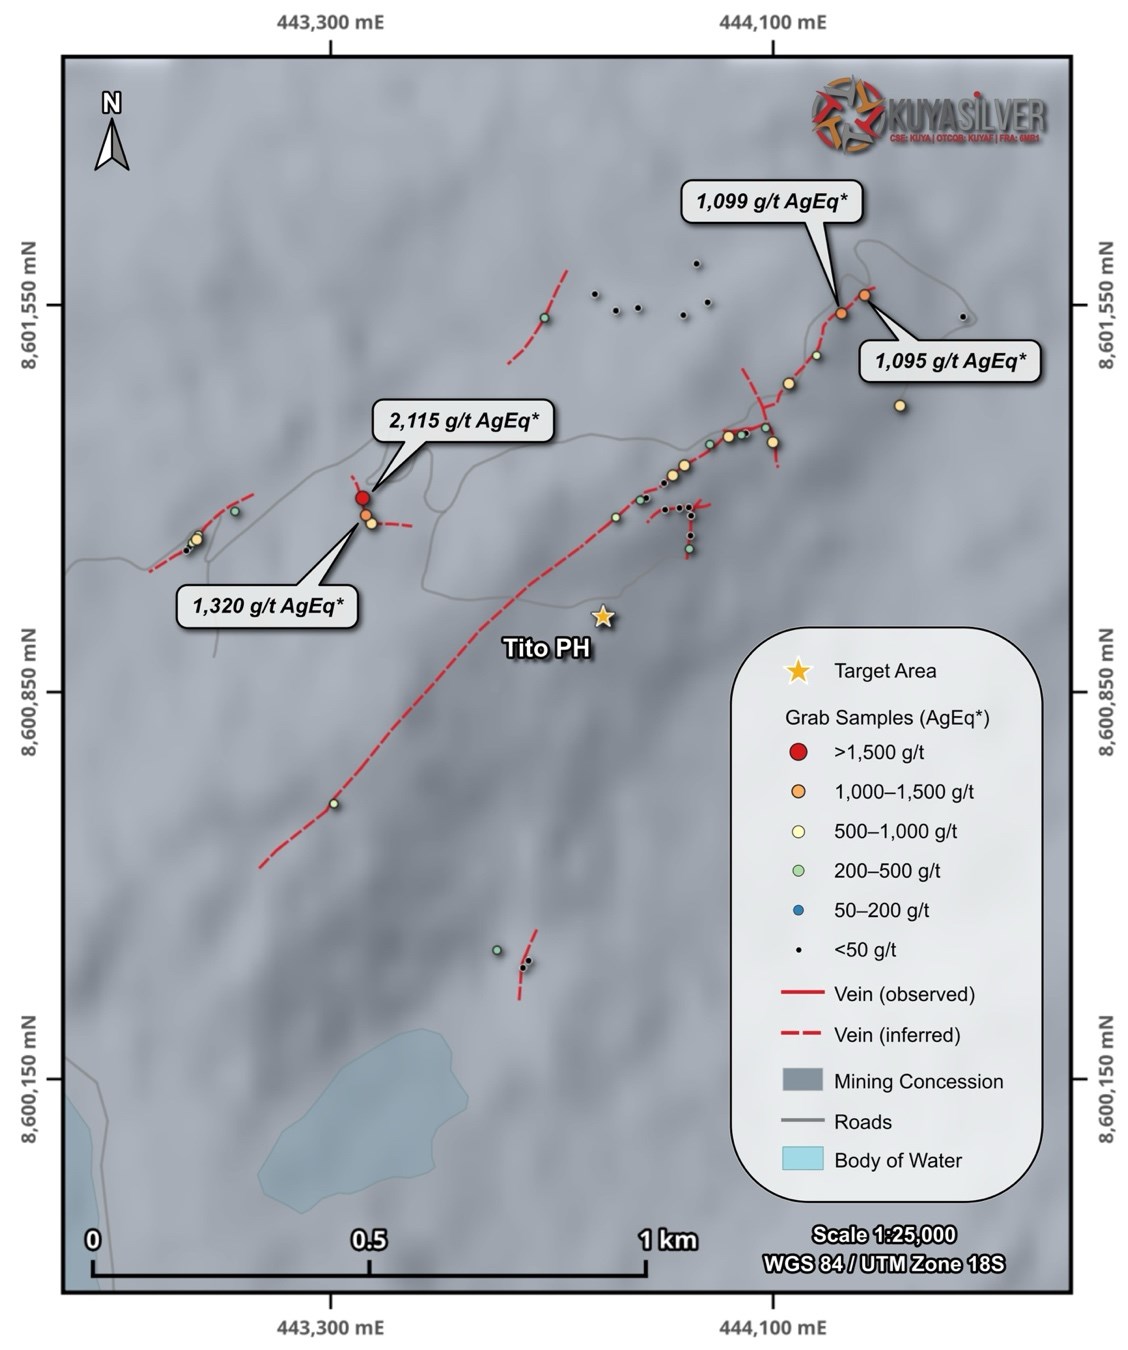
Tito PH
Tito PH is a priority exploration target consisting of one main vein and at least seven additional subparallel veins (Figure 2 below). The main vein has been mapped over approximately 600 metresof strike and may extend up to 1,500 metres, although a 700 metres gap in surface exposure remains to be tested by drilling.
Minor artisanal workings, including two shallow adits and an open stope, occur along the vein cluster. A total of 55grab samples collected by Kuya Silver geologists returned an arithmetic average grade of 285.7 g/t AgEq* and a maximum value of 2,114.7 g/t AgEq*. The interpreted strike length and high-grade surface samples suggest the system could be comparable in scale to the veins currently mined at Bethania.
Figure 2. Detailed map showing interpreted veins, grab sample locations, and assays at the Tito PH prospect.
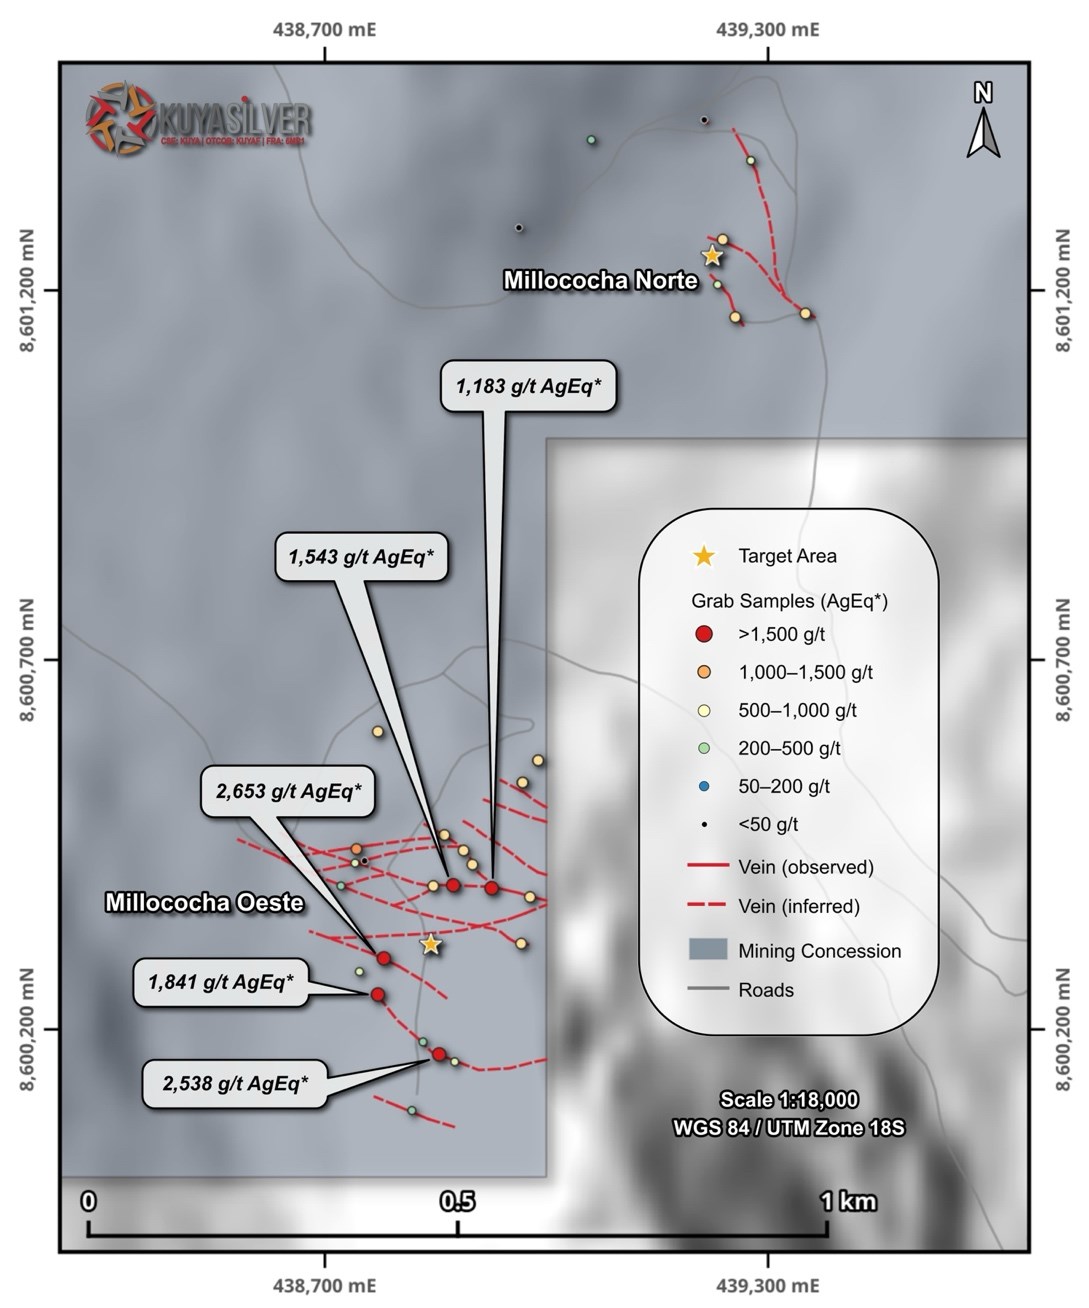
Millococha Oeste is one of the most prospective targets identified within the Bethania land package due to the presence of more than 10 mapped veins with consistently high grades. A total of 40 grab samples collected by Kuya Silver geologists returned an arithmetic average grade of 690.4 g/t AgEq* and a maximum value of 2,652.7 g/t AgEq* (Figure 3 below).
Artisanal workings on Kuya Silver’s claims represent the most significant historic activity outside the Santa Elena concession, but remain relatively shallow and poorly explored, highlighting the potential for additional mineralization at depth.
Figure 3. Detailed map showing interpreted veins, grab sample locations, and assays at the Millococha prospect.
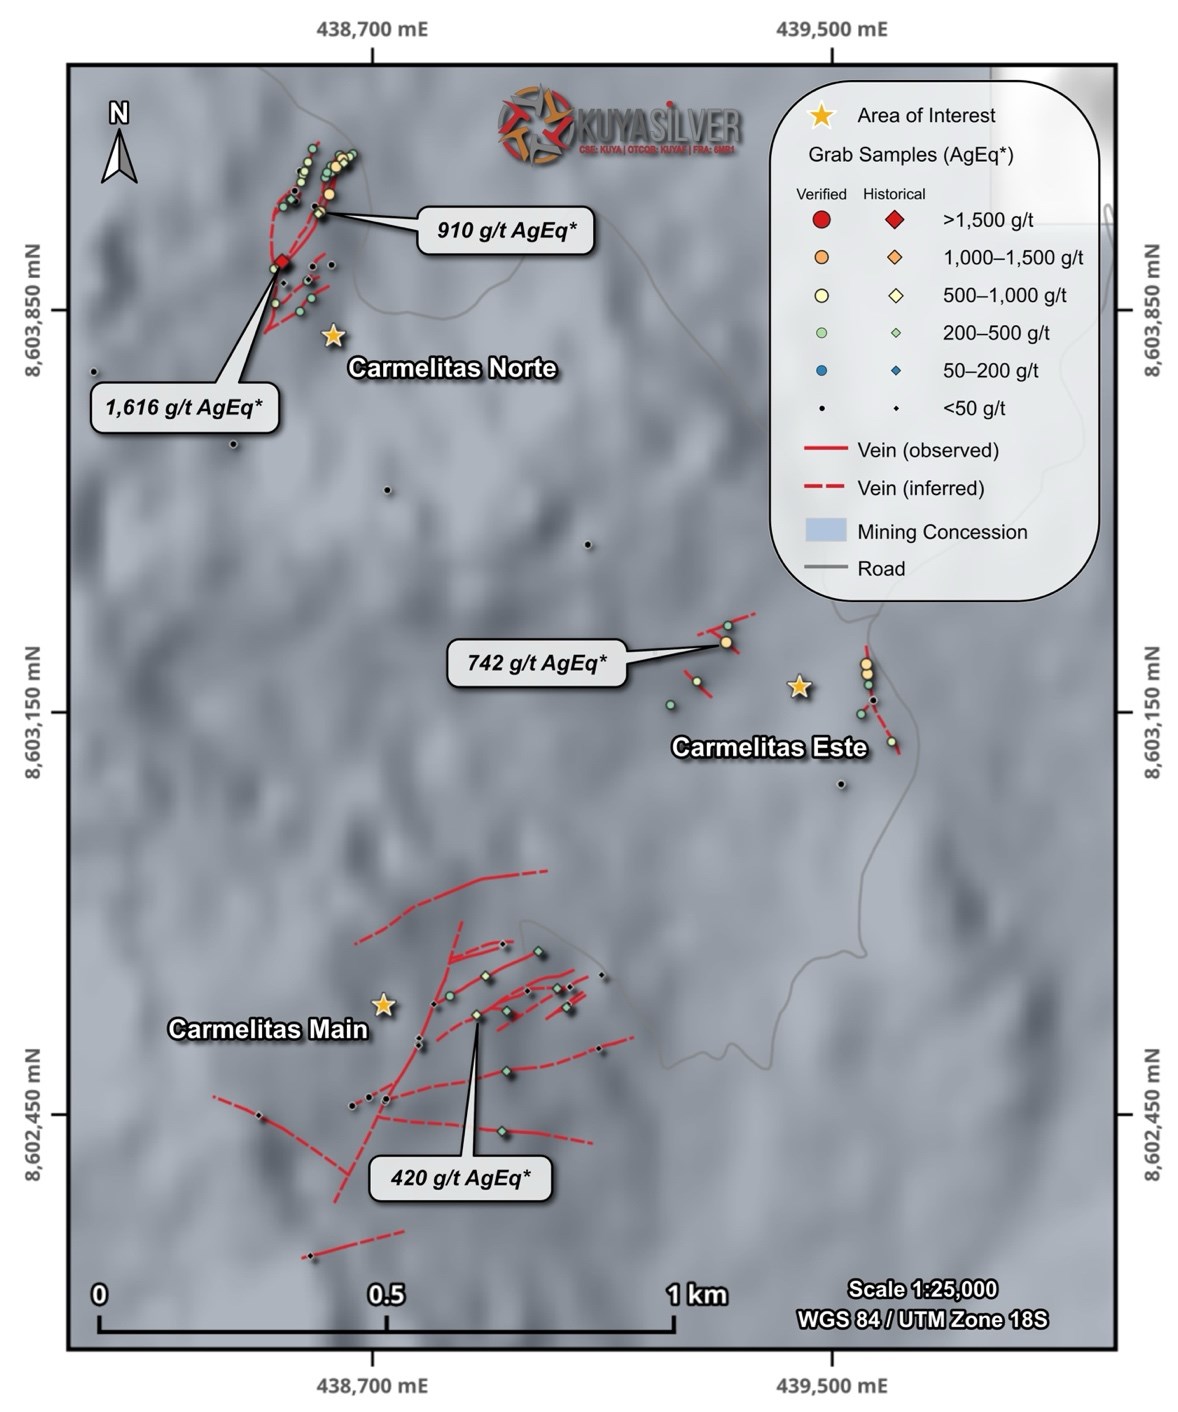
The Carmelitas prospect includes three vein clusters within an area of approximately 800 metres, comprising the main Carmelitas artisanal mine as well as the Carmelitas Norte and Carmelitas Este showings (Figure 4 below). A total of 125 grab samples collected by Kuya Silver returned grades up to 1,771.5 g/t Ag and an arithmetic average of 145.2g/t AgEq*.
Although vein density is lower than at other targets, the prospect remains attractive due to the presence of high-grade mineralization and potential structural connections between the three vein clusters.
*Silver Equivalency (AgEq) was calculated using silver ($85.74 USD/troy oz), gold ($5,177.70 USD/troy oz), copper ($12,815.48 USD/tonne), lead ($1,892.0 USD/tonne) and zinc ($3,286.76 USD/tonne) values, obtained on March 3, 2026 from Kitco, and do not consider metal recovery.
Figure 4. Detailed map showing interpreted veins, grab sample locations, and assays at the Carmelitas prospect.
A total of 940 grab samples (plus QA/QC) were collected in different exploration campaigns from 2021 to 2026. Only 192 samples collected from 2024 to 2026 count with proper QA/QC assessment. The coordinates of the locations of each sample were measured by handheld GPS and the samples dispatched to the ALS Peru S.A. laboratory in Lima for geochemical analysis. The analyses were carried out using the following methods:
ME-OG61a – Multi-acid digestion with ICP-AES detection for 33 elements
Au-AA23 – Fire assay for gold
Ag-OG62 – Four-acid digestion with ICP-AES detection for overlimit silver
All QA/QC standards were acceptable and within two standard deviations of certified values.
As these samples include a mix of early-stage grab, chip, and channel samples and do not include details on vein width, they are not fully representative of total vein mineralization.
National Instrument 43-101 Disclosure
The technical content of this news release has been reviewed and approved by Osbaldo Zamora, PhD., P.Geo., Vice President Exploration with Kuya Silver Corp. and a Qualified Person as defined by National Instrument 43-101.
About Kuya Silver Corporation
Kuya Silver is a Canadian‐based, growth-oriented mining company with a focus on silver. Kuya Silver operates the Bethania silver mine in Peru, while developing district-scale silver projects in mining-friendly jurisdictions including Peru and Canada.
This news release contains statements that constitute “forward-looking information,” including statements regarding the plans, intentions, beliefs, and current expectations of the Company, its directors, or its officers with respect to the future business activities of the Company. The words “may,” “would,” “could,” “will,” “intend,” “plan,” “anticipate,” “believe,” “estimate,” “expect,” “must,” “next,” “propose,” “new,” “potential,” “prospective,” “target,” “future,” “verge,” “favorable,” “implications,” and “ongoing,” and similar expressions, as they relate to the Company or its management, are intended to identify such forward-looking information. Investors are cautioned that statements including forward-looking information are not guarantees of future business activities and involve risks and uncertainties, and that the Company’s future business activities may differ materially from those described in the forward-looking information as a result of various factors, including but not limited to fluctuations in market prices, successes of the operations of the Company, continued availability of capital and financing, and general economic, market, and business conditions. There can be no assurances that such forward-looking information will prove accurate, and therefore, readers are advised to rely on their own evaluation of the risks and uncertainties. The Company does not assume any obligation to update any forward-looking information except as required under the applicable securities laws.
Neither the Canadian Securities Exchange nor the Investment Industry Regulatory Organization of Canada accepts responsibility for the adequacy or accuracy of this release.
HOUSTON, March 16, 2026 /PRNewswire/ — Summit Midstream Corporation (NYSE: SMC) (“Summit”, “SMC” or the “Company”) announced today its financial and operating results for fourth quarter and full-year 2025, Permian and Rockies segment growth update, and provided full-year 2026 financial guidance.
Highlights
Fourth quarter net loss of $7.3 million, Adjusted EBITDA of $58.5 million, cash flow available for distributions (“Distributable Cash Flow” or “DCF”) of $33.7 million and free cash flow (“FCF”) of $17.0 million
Recently signed three 10+-year firm take-or-pay contracts on Double E that are expected to drive Permian Segment Adjusted EBITDA from $34 million in 2025 to approximately $60 million in 2029
Launched a binding open season on Double E to secure market commitments to support a mainline compression project to increase firm capacity by up to 50% from 1.6 Bcf/d to approximately 2.4 Bcf/d
Refinanced Double E capital structure1 with a new term loan that will fund Double E capital projects (including the mainline compression project) and provide an $85 million one-time distribution to Summit to pay down debt and repay $45 million of arrears on its corporate Series A Preferred Stock
Executed a new 10-year crude oil gathering agreement covering more than 200,000 acres in the Williston
Active customer base with seven rigs running, approximately 90 DUCs and 116 to 126 wells expected in 2026
Provided 2026 full-year financial guidance range of $225 million to $265 million in Adjusted EBITDA and total capital expenditures of $85 million to $105 million, including $35 million attributable to Double E
Management Commentary
Heath Deneke, President, Chief Executive Officer and Chairman, commented, “We are pleased with the commercial and financial progress achieved over the past two quarters, which underscore the strategic value of our infrastructure, embedded growth opportunities, and our continued focus on execution with financial discipline. With the signing of major long-term agreements on the Double E Pipeline and in the Williston Basin, we are building on strong commercial momentum in our Permian and Rockies segments, while maintaining steady operational performance, strengthening our balance sheet and allocating capital prudently. We’re also further advancing Double E’s growth with a new open season to support a mainline compression project that could expand pipeline capacity by 50% by the end of 2028. Additionally, the Double E refinancing underscores Summit’s financial flexibility and ability to execute on important growth initiatives while continuing to maintain focus on reaching long-term corporate leverage targets. The planned repayment of the arrears on the Series A Preferred Stock further simplifies Summit’s balance sheet and is also an important step towards enabling a sustainable return of capital program for our shareholders in the future.
Operationally, despite the earlier oil price headwinds, we maintained an active customer base with seven rigs currently running behind our systems, approximately 90 DUCs and between 116 to 126 wells expected to be turned in line in 2026. Our 2026 outlook reflects sustained activity across our systems and incremental investment in high-return growth projects, which we expect will drive EBITDA growth in 2027 and beyond. Furthermore, given the mid-$60 oil price assumption embedded in our 2026 guidance, we are optimistic that customer activity levels could further increase in the second half of the year if the recent spike in oil prices continues to lift the backend of the forward price curve.”
Double E Commercial Update
Producers Midstream II reached a final investment decision on Train II of its Dude processing plant in Lea County, New Mexico, which was a condition precedent to the commencement of the previously announced 10-year, 100 MMcf/d firm transportation agreement. The new contract is expected to commence service in the fourth quarter of 2026.
Double E Pipeline entered into a new 11-year take-or-pay natural gas firm transportation agreement with a large, investment-grade shipper for 210 MMcf/d of capacity, including 80 MMcf/d expected to commence in the fourth quarter of 2026 and an additional 130 MMcf/d expected to commence in the second half of 2028. These commitments also expand Double E’s downstream connectivity with new delivery points into the Transwestern Central Pool, the Hugh Brinson Pipeline and a planned future connection with the Desert Southwest Pipeline. The new delivery points will significantly broaden Double E Shipper’s access to diverse and growing end use markets in addition to the multiple interconnects with downstream egress pipelines connecting the Waha Hub to Gulf Coast markets.
Double E Pipeline also entered into a new 11+ year natural gas transportation agreement with an undisclosed shipper for 230 MMcf/d of firm capacity, with 100 MMcf/d expected to start in the fourth quarter of 2027, 80 MMcf/d in the fourth quarter of 2028, and an additional 50 MMcfd in the second quarter of 2029. The agreement is contingent upon satisfaction of certain customary conditions precedent and is subject to shipper providing notice of its final investment decision to construct an expansion of its processing facility prior to October 1, 2026.
With the additional contracts, Summit expects its 70% interest in Double E to generate approximately $60 million of Segment Adjusted EBITDA in 2029, representing an approximate 76% increase to the $34 million of Segment Adjusted EBITDA generated in 2025. These projects are expected to cost approximately $50 million, net to Summit’s 70% interest, with approximately $35 million expected in 2026 and the remainder in 2027. These capital requirements are expected to be fully funded with the new term loan at Summit Permian Transmission which is non-recourse to Summit. Further, Double E has launched a binding open season to secure market commitments to support a mainline compression project to expand the pipeline’s capacity from approximately 1.6 Bcf/d to over 2.4 Bcf/d by the end of 2028. The compression expansion remains subject to additional commercial support via incremental long-term take-or-pay agreements and FERC and other regulatory approvals.
Double E Refinancing Transaction
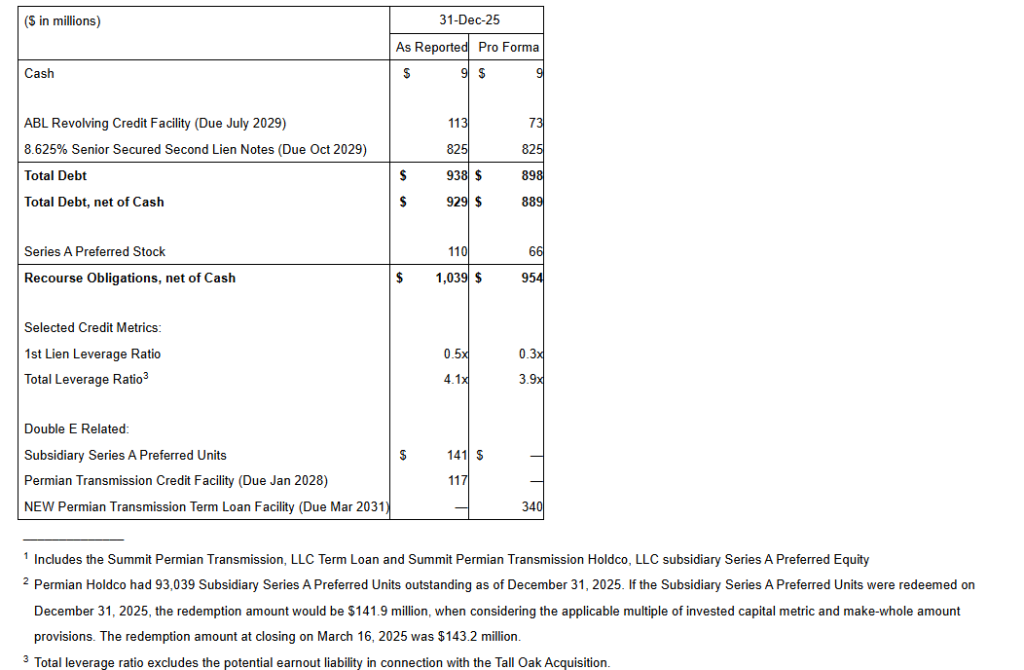
Subsequent to quarter-end, Summit refinanced the Summit Permian Transmission, LLC and Summit Permian Transmission Holdco, LLC capital structure with a new $440 million term loan facility, including a $340 million borrowing at closing, $50 million committed delayed draw facility used to fund the Producers Midstream and other expansion projects, as well as a $50 million uncommitted accordion to fund the expected mainline compression expansion project. Proceeds from the new facility were used to refinance the $112.7 million Summit Permian Transmission term loan, $141.9 million Summit Permian Transmission Holdco’s preferred units2, an $85 million one-time distribution to Summit, and pay other fees and expenses. Summit intends to use the $85 million one-time distribution to pay down approximately $45 million of accrued and unpaid dividends on its Series A Preferred Stock and approximately $40 million of ABL borrowings. Repayment of the accrued and unpaid dividends represents a critical step of Summit’s objective to resume dividend payments on its common stock once Summit achieves its long-term leverage target of 3.5x. In addition, the $40 million ABL repayment reduces Summit’s leverage by approximately 0.2x, aligning with its continued focus on corporate de-levering.
Pro Forma Capitalization
Williston Commercial Update
During the fourth quarter, Summit executed a new 10-year crude gathering agreement with a Bakken producer, anchored by a large Area of Dedication covering more than 200,000 acres across its existing footprint in Divide County, North Dakota. The first new pad — consisting of four 3-mile laterals — is expected to be turned in line in the first quarter of 2026. This agreement meaningfully expands Summit’s dedicated acreage and long-term economic inventory supporting its infrastructure, while positioning the Company to pursue additional development opportunities across northern Williams and southern Divide Counties. With the efficiency gains associated with 3-mile laterals, these areas have become economically attractive in the current oil price environment. As Bakken producers continue expanding activity in the northern and western portions of the basin, Summit expects increasing commercial momentum and growth around its Polar and Divide systems.
Fourth Quarter 2025 Business Highlights
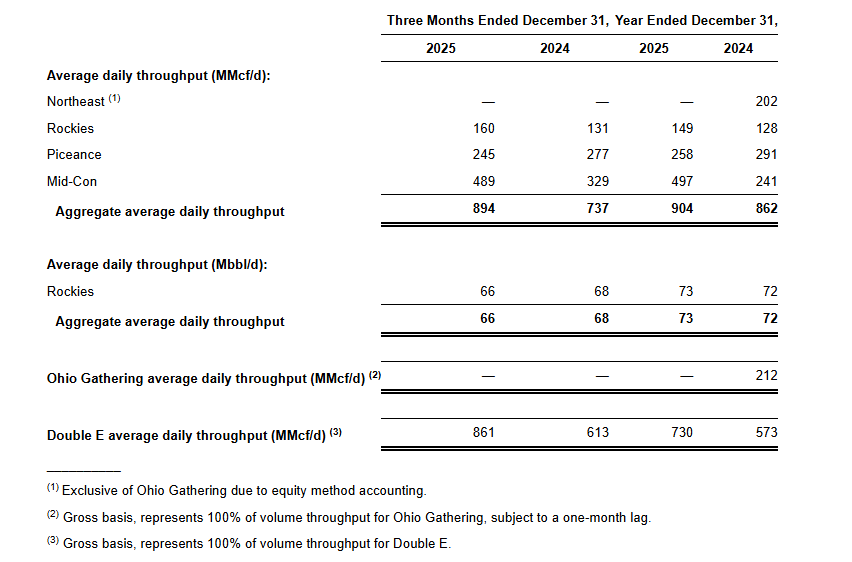
SMC’s average daily natural gas throughput on its wholly owned operated systems decreased 3.4% to 894 MMcf/d, while liquids volumes decreased 8.3% to 66 Mbbl/d, relative to the third quarter of 2025. Double E pipeline transported an average of 861 MMcf/d and contributed $8.7 million in Adjusted EBITDA, net to SMC, for the fourth quarter of 2025.
Natural gas price-driven segments:
Natural gas price-driven segments generated $31.5 million in combined Segment Adjusted EBITDA, a $4.6 million decrease relative to the third quarter and combined capital expenditures of $9.2 million.
Mid-Con Segment Adjusted EBITDA totaled $21.5 million, a decrease of $2.1 million relative to the third quarter of 2025, primarily due to a decrease in volume throughput on the system. Volume throughput on the system decreased by 3.7% primarily due to natural production declines partially offset by six new well connections in the Arkoma. Subsequent to quarter end, six new wells were connected in the Arkoma. There is currently one rig running in the Arkoma, with 21 DUCs behind the system, including 17 DUCs in the Barnett, which are all expected to come online in 2026.
Piceance Segment Adjusted EBITDA totaled $10.0 million, a decrease of $2.5 million relative to the third quarter of 2025, primarily due to realization of previously deferred revenue in the third quarter and a 5.4% decrease in volume throughput. There were no new wells connected to the system during the fourth quarter.
Oil price-driven segments:
Oil price-driven segments generated $36.6 million of combined Segment Adjusted EBITDA, representing a $1.1 million decrease relative to the third quarter of 2025, and had combined capital expenditures of $9.0 million.
Rockies Segment Adjusted EBITDA totaled $27.8 million, a decrease of $1.2 million relative to the third quarter of 2025, primarily driven by a 8.3% decrease in liquids volume throughput, partially offset by a 1.3% increase in natural gas volume throughput, relative to the third quarter of 2025. The decrease in liquids volumes was primarily driven by natural production declines and no new well connections in the Williston Basin during the quarter. Natural gas volume growth was supported by 33 new well connections in the DJ Basin, which are expected to reach peak production in the second quarter of 2026. There are currently six rigs running and approximately 65 DUCs behind the system.
Permian Segment Adjusted EBITDA totaled $8.8 million, an increase of $0.1 million relative to the third quarter of 2025, primarily due to a 20.9% increase in volumes shipped on the Double E Pipeline leading to an increase in proportionate Adjusted EBITDA from our Double E joint venture.
The following table presents average daily throughput by reportable segment for the periods indicated:
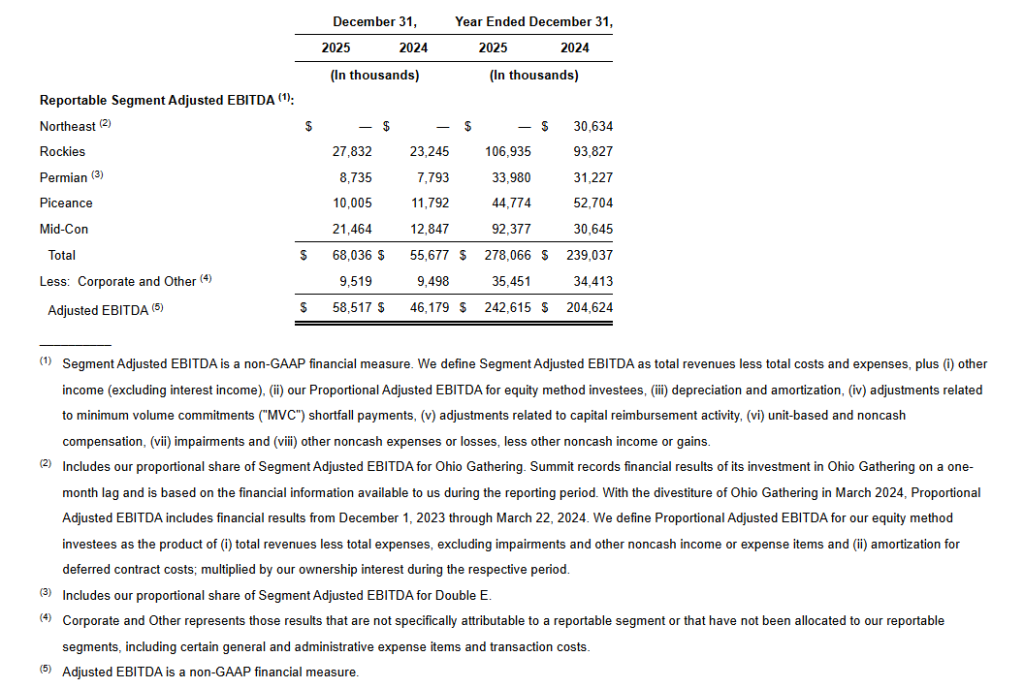
The following table presents Adjusted EBITDA by reportable segment for the periods indicated:
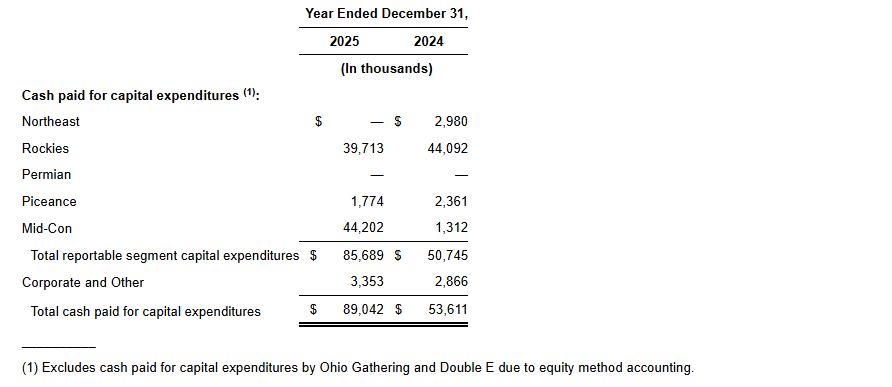
Capital Expenditures
Capital expenditures totaled $19.1 million in the fourth quarter of 2025, inclusive of maintenance capital expenditures of $4.0 million. Capital expenditures in the fourth quarter of 2025 were primarily related to pad connections in the Rockies and Mid-Con segments.
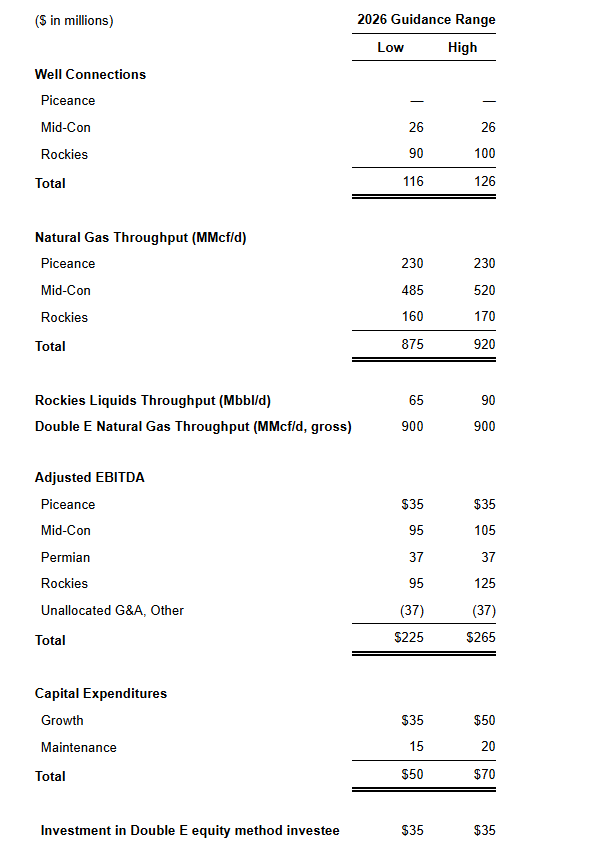
2026 Guidance
SMC is releasing guidance for 2026, which is summarized in the table below. These projections are subject to risks and uncertainties as described in the “Forward-Looking Statements” section at the end of this release.
SMC’s guidance range is anchored by recent drilling and completion schedules provided by its customers and is reflective of the current commodity price environment. The Company’s approach to its 2026 guidance is consistent with the framework used for its 2025 guidance range. If SMC’s producer customers hit their production targets and timing of planned well connects, the Company would expect to be near the high end of the 2026 guidance range. The midpoint of the guidance range reflects a conservative, yet appropriate, level of risking to the most recent drill schedules and volume forecasts provided by its customers. The low end of the guidance range reflects additional delays to customer drilling and completion schedules and planned well connects.
SMC expects approximately 116 to 126 well connections in 2026. Of the expected well connections in 2026, approximately 20% are natural gas-oriented wells and approximately 80% are crude oil-oriented wells. Customers are currently running seven rigs behind SMC systems, with approximately 90 DUCs, providing line of sight to the 2026 estimated well connections and associated volume growth.
SMC expects its natural gas gathering system throughput to range from 875 MMcf/d to 920 MMcf/d. Double E existing take-or-pay contracts of 1,115 MMcf/d is expected to increase to 1,285 MMcf/d when the Producers Midstream II and other projects are placed into service, as early as the fourth quarter of 2026. Liquids volumes are expected to range from 65 Mbbl/d to 90 Mbbl/d.
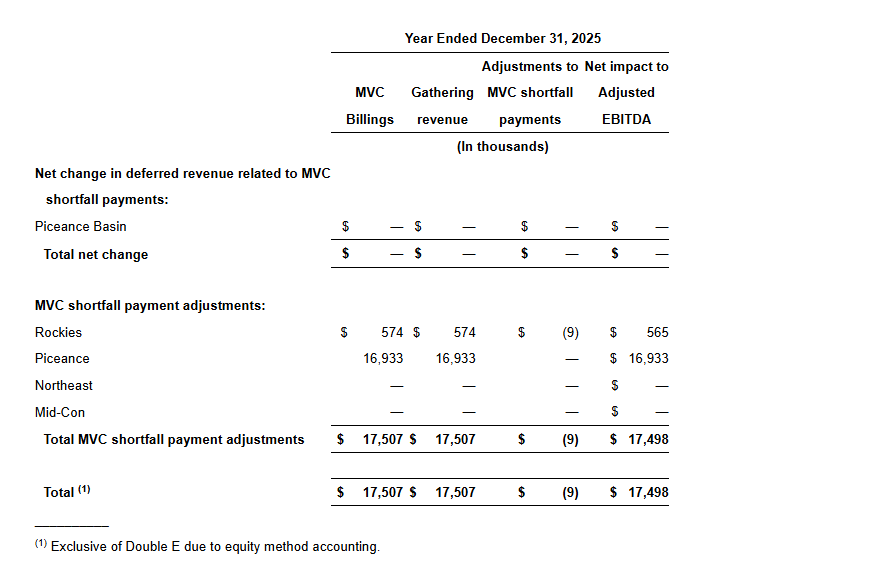
The guidance outlook also reflects a reduction in MVC shortfall payments in the Piceance from $16.9 million in 2025 to approximately $13.0 million in 2026, and excludes approximately $2 million of deferred revenue that benefited 2025 results.
The midpoint of the guidance range assumes strip commodity prices as of February 19, 2026, implying an average 2026 Henry Hub price of approximately $3.40 per MMBtu and WTI of approximately $64 per barrel.
Adjusted EBITDA is expected to range from $225 million to $265 million. SMC’s 2026 capital expenditure guidance of $50 million to $70 million, excluding Double E, includes capital reimbursements related to specific development projects with certain customers. The Company’s full year 2026 growth capex guidance range is primarily related to new pad connections in the Rockies and Mid-Con segments. Included in this range is approximately $15 million to $20 million of maintenance capex. Double E capital expenditures for 2026 are expected to be approximately $35 million, net to SMC, primarily related to a new plant connection and downstream connections associated with the recently announced shipper contracts.
Capital & Liquidity
As of December 31, 2025, SMC had $9.3 million in unrestricted cash on hand and $113 million drawn under its $500 million ABL Revolver with $386 million of borrowing availability, after accounting for $0.8 million of issued, but undrawn letters of credit. As of December 31, 2025, SMC’s gross availability based on the borrowing base calculation in the credit agreement was $810 million, which is $310 million greater than the $500 million of lender commitments to the ABL Revolver. As of December 31, 2025, SMC was in compliance with all financial covenants, including interest coverage of 2.7x relative to a minimum interest coverage covenant of 2.0x and first lien leverage ratio of 0.5x relative to a maximum first lien leverage ratio of 2.5x. As of December 31, 2025, SMC reported a total leverage ratio of approximately 4.1x, excluding the potential earnout liability in connection with the Tall Oak Acquisition.
As of January 2, 2026, the Permian Transmission Credit Facility balance was $112.7 million a reduction of $4.3 million relative to the September 30, 2025 balance of $117.0 million due to scheduled mandatory amortization. Summit Midstream Permian has $3.8 million of cash-on-hand as of January 2, 2026.
Subsequent to quarter-end, Summit Permian Transmission, LLC entered into a new $440 million senior secured term facility, which includes a $50 million committed accordion feature and a $50 million uncommitted accordion feature (the “Term Facility”) maturing in March 2031. Proceeds from the Term Facility were used to refinance Summit Permian Transmission’s existing credit facility, Summit Permian Transmission Holdco’s preferred units, fund an $85 million restricted payment to SMC, provide liquidity to fund SMC’s share of capital expenditures including those associated with the recently announced expansion projects, and pay other fees and expenses.
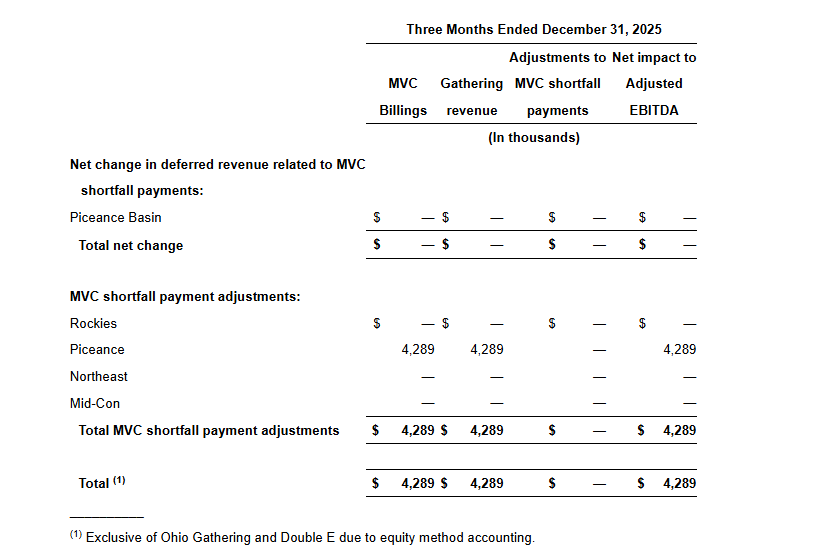
MVC Shortfall Payments
SMC billed its customers $4.3 million in the fourth quarter of 2025 related to MVC shortfalls. For those customers that do not have MVC shortfall credit banking mechanisms in their gathering agreements, the MVC shortfall payments are accounted for as gathering revenue in the period in which they are earned. In the fourth quarter of 2025, SMC recognized $4.3 million of gathering revenue associated with MVC shortfall payments. SMC had no adjustments to MVC shortfall payments in the fourth quarter of 2025. SMC’s MVC shortfall payment mechanisms contributed $4.3 million of total Adjusted EBITDA in the fourth quarter of 2025.
Quarterly Dividend
The Board of Directors of Summit Midstream Corporation continued to suspend cash dividends payable on the common stock for the period ended December 31, 2025. The quarterly cash dividend on the Series A Preferred Stock, for the period ended March 14, 2026, will be paid to preferred shareholders of record as of the close of business on March 2, 2026.
The Board of Directors approved the full repayment of all previously deferred Series A Preferred Stock dividends, payable on March 27, 2026 to holders of record as of the close of business on March 17, 2026.
Fourth Quarter 2025 Earnings Call Information
SMC will host a conference call at 10:00 a.m. Eastern on March 17, 2026, to discuss its quarterly operating and financial results. The call can be accessed via teleconference at the following link: Q4 2025 Summit Midstream Corporation Earnings Conference Call (https://register-conf.media-server.com/register/BI12ac80a058874aaa998fdc335346beed). Once registration is completed, participants will receive a dial-in number along with a personalized PIN to access the call. While not required, it is recommended that participants join 10 minutes prior to the event start. The conference call, live webcast and archive of the call can be accessed through the Investors section of SMC’s website at www.summitmidstream.com.
Use of Non-GAAP Financial Measures
We report financial results in accordance with U.S. generally accepted accounting principles (“GAAP”). We also present Adjusted EBITDA, Segment Adjusted EBITDA, Distributable Cash Flow, and Free Cash Flow, non-GAAP financial measures.
Adjusted EBITDA
We define Adjusted EBITDA as net income or loss, plus interest expense, income tax expense, depreciation and amortization, our Proportional Adjusted EBITDA for equity method investees, adjustments related to MVC shortfall payments, adjustments related to capital reimbursement activity, unit-based and noncash compensation, impairments, items of income or loss that we characterize as unrepresentative of our ongoing operations and other noncash expenses or losses, income tax benefit, income (loss) from equity method investees and other noncash income or gains. Because Adjusted EBITDA may be defined differently by other entities in our industry, our definition of this non-GAAP financial measure may not be comparable to similarly titled measures of other entities, thereby diminishing its utility.
Management uses Adjusted EBITDA in making financial, operating and planning decisions and in evaluating our financial performance. Furthermore, management believes that Adjusted EBITDA may provide external users of our financial statements, such as investors, commercial banks, research analysts and others, with additional meaningful comparisons between current results and results of prior periods as they are expected to be reflective of our core ongoing business.
Adjusted EBITDA is used as a supplemental financial measure to assess:
the ability of our assets to generate cash sufficient to make future potential cash dividends and support our indebtedness;
the financial performance of our assets without regard to financing methods, capital structure or historical cost basis;
our operating performance and return on capital as compared to those of other entities in the midstream energy sector, without regard to financing or capital structure;
the attractiveness of capital projects and acquisitions and the overall rates of return on alternative investment opportunities; and
the financial performance of our assets without regard to (i) income or loss from equity method investees, (ii) the impact of the timing of MVC shortfall payments under our gathering agreements or (iii) the timing of impairments or other income or expense items that we characterize as unrepresentative of our ongoing operations.
Adjusted EBITDA has limitations as an analytical tool and investors should not consider it in isolation or as a substitute for analysis of our results as reported under GAAP. For example:
certain items excluded from Adjusted EBITDA are significant components in understanding and assessing an entity’s financial performance, such as an entity’s cost of capital and tax structure;
Adjusted EBITDA does not reflect our cash expenditures or future requirements for capital expenditures or contractual commitments;
Adjusted EBITDA does not reflect changes in, or cash requirements for, our working capital needs; and
although depreciation and amortization are noncash charges, the assets being depreciated and amortized will often have to be replaced in the future, and Adjusted EBITDA does not reflect any cash requirements for such replacements.
We compensate for the limitations of Adjusted EBITDA as an analytical tool by reviewing the comparable GAAP financial measures, understanding the differences between the financial measures and incorporating these data points into our decision-making process.
We define Segment Adjusted EBITDA as total revenues less total costs and expenses; plus (i) other income excluding interest income, (ii) our proportional adjusted EBITDA for equity method investees, (iii) depreciation and amortization, (iv) adjustments related to MVC shortfall payments, (v) adjustments related to capital reimbursement activity, (vi) stock-based and noncash compensation, (vii) impairments and (viii) other noncash expenses or losses, less other noncash income or gains. We define Proportional Adjusted EBITDA for our equity method investees as the product of (i) total revenues less total expenses, excluding impairments and other noncash income or expense items and (ii) amortization for deferred contract costs; multiplied by our ownership interest during the respective period.
Distributable Cash Flow
We define Distributable Cash Flow as Adjusted EBITDA, as defined above, less cash interest paid, cash paid for taxes, net interest expense accrued and paid on the senior notes, and maintenance capital expenditures.
Free Cash Flow
We define free cash flow as distributable cash flow attributable to common and preferred shareholders less growth capital expenditures, less investments in equity method investees, less dividends to common and preferred shareholders. Free cash flow excludes proceeds from asset sales and cash consideration paid for acquisitions.
We do not provide the GAAP financial measures of net income or loss or net cash provided by operating activities on a forward-looking basis because we are unable to predict, without unreasonable effort, certain components thereof including, but not limited to, (i) income or loss from equity method investees and (ii) asset impairments. These items are inherently uncertain and depend on various factors, many of which are beyond our control. As such, any associated estimate and its impact on our GAAP performance and cash flow measures could vary materially based on a variety of acceptable management assumptions.
About Summit Midstream Corporation
SMC is a value-driven corporation focused on developing, owning and operating midstream energy infrastructure assets that are strategically located in the core producing areas of unconventional resource basins, primarily shale formations, in the continental United States. SMC provides natural gas, crude oil and produced water gathering, processing and transportation services pursuant to primarily long-term, fee-based agreements with customers and counterparties in five unconventional resource basins: (i) the Williston Basin, which includes the Bakken and Three Forks shale formations in North Dakota; (ii) the Denver-Julesburg Basin, which includes the Niobrara and Codell shale formations in Colorado and Wyoming; (iii) the Fort Worth Basin, which includes the Barnett Shale formation in Texas; (iv) the Arkoma Basin, which includes the Woodford and Caney shale formations in Oklahoma; and (v) the Piceance Basin, which includes the Mesaverde formation as well as the Mancos and Niobrara shale formations in Colorado. SMC has an equity method investment in Double E Pipeline, LLC, which provides interstate natural gas transportation service from multiple receipt points in the Delaware Basin to various delivery points in and around the Waha Hub in Texas. SMC is headquartered in Houston, Texas.
Forward-Looking Statements
This press release includes certain statements concerning expectations for the future that are forward-looking within the meaning of the federal securities laws. Forward-looking statements include, without limitation, any statement that may project, indicate or imply future results, events, performance or achievements and may contain the words “expect,” “intend,” “plan,” “anticipate,” “estimate,” “believe,” “will be,” “will continue,” “will likely result,” and similar expressions, or future conditional verbs such as “may,” “will,” “should,” “would” and “could.” In addition, any statement concerning future financial performance (including future revenues, earnings or growth rates), payment of dividends on any series of stock, ongoing business strategies and possible actions taken by SMC or its subsidiaries are also forward-looking statements. Forward-looking statements also contain known and unknown risks and uncertainties (many of which are difficult to predict and beyond management’s control) that may cause SMC’s actual results in future periods to differ materially from anticipated or projected results. An extensive list of specific material risks and uncertainties affecting SMC is contained in its 2025 Annual Report on Form 10-K filed with the Securities and Exchange Commission (the “SEC”) on March 16, 2026, as amended and updated from time to time. Any forward-looking statements in this press release are made as of the date of this press release and SMC undertakes no obligation to update or revise any forward-looking statements to reflect new information or events.
CULVER CITY, Calif., March 17, 2026 (GLOBE NEWSWIRE) — Snail, Inc. (Nasdaq: SNAL) (“Snail Games” or the “Company”), a leading global independent developer and publisher of interactive digital entertainment, will hold a conference call and webcast on Thursday, March 19, 2026 at 4:30 p.m. Eastern time (1:30 p.m. Pacific time) to discuss its financial results for the fourth quarter and full year ended December 31, 2025.
Snail, Inc. management will host the conference call and webcast, followed by a question-and-answer period. Participants may listen to the live webcast and replay via the link here or on the Company’s investor relations website at https://investor.snail.com/.
About Snail, Inc. Snail, Inc. (Nasdaq: SNAL) is a leading, global independent developer and publisher of interactive digital entertainment for consumers around the world, with a premier portfolio of premium games designed for use on a variety of platforms, including consoles, PCs, and mobile devices. For more information, please visit: https://snail.com/.
Investor Contact: John Yi and Steven Shinmachi Gateway Group, Inc. 949-574-3860 SNAL@gateway-grp.com
OVERLAND PARK, Kan.–(BUSINESS WIRE)– SelectQuote, Inc. (NYSE: SLQT) (the “Company”), a leading distributor of Medicare insurance policies and owner of a rapidly-growing healthcare services platform, today announced an initiative to expand its reach and complement its existing, telephonic insurance distribution model.
SelectQuote Local will leverage the Company’s industry-leading marketing, technology, customer service, and carrier relationships to offer consumers its senior health and life insurance products through a franchise model offering local sales and support. SelectQuote Local provides consumers the opportunity to meet with local representatives while still offering the Company’s same affordable and simple way to quickly and easily find the type of insurance to meet their unique needs. Franchise owners will have an opportunity to purchase rights to operate their SelectQuote Local franchise in a particular geographic region, providing a compelling business opportunity for them and an exciting new growth opportunity for the Company.
“We see SelectQuote Local as a natural extension of our existing SelectQuote business. With over four decades as a pioneering insurance brokerage, we have optimized our approach to marketing, shopping, selling, and customer service. We’ve helped millions of customers find the best insurance coverage to meet their unique needs. We believe SelectQuote Local creates an opportunity to extend our reach to more consumers, namely those who wish to do business with someone in their local market,” said Bill Grant, SelectQuote’s Chief Operating Officer. “It’s the perfect complement to our existing platform and, given our diversified business model that extends across senior health and healthcare services as well as term life and final expense product offerings, SelectQuote is uniquely positioned to deliver on this market opportunity. No one else can match our breadth of offerings, our capabilities, our experience, or our expertise.”
SelectQuote Chief Financial Officer Ryan Clement added, “From a financial perspective, we think SelectQuote Local provides an exciting and cash efficient opportunity to leverage our proven technology and carrier platform to drive increased scale to our insurance distribution business. We expect the SelectQuote Local model to require a low level of capital investment from the Company and, over time, to create a recurring royalty stream providing compelling cash-on-cash returns for shareholders. In addition, our highly-complementary SelectRx pharmacy and healthcare services business continues to grow more cash generative. We are already projecting meaningful operating cash flow for this fiscal year and expect cash generation to increase in the quarters and years to come. When paired with our recently finalized $415 million credit facility, SelectQuote Local, alongside our growing healthcare services business, provides a path to increasing scale and to accelerating our progress toward de-levering the business.”
This release contains forward-looking statements. These forward-looking statements reflect our current views with respect to, among other things, future events and our financial performance. These statements are often, but not always, made through the use of words or phrases such as “may,” “should,” “could,” “predict,” “potential,” “believe,” “will likely result,” “expect,” “continue,” “will,” “anticipate,” “seek,” “estimate,” “intend,” “plan,” “projection,” “would” and “outlook,” or the negative version of those words or other comparable words or phrases of a future or forward-looking nature. These forward-looking statements are not historical facts, and are based on current expectations, estimates and projections about our industry, management’s beliefs and certain assumptions made by management, many of which, by their nature, are inherently uncertain and beyond our control. Accordingly, we caution you that any such forward-looking statements are not guarantees of future performance and are subject to risks, assumptions and uncertainties that are difficult to predict. Although we believe that the expectations reflected in these forward-looking statements are reasonable as of the date made, actual results may prove to be materially different from the results expressed or implied by the forward-looking statements. There are or will be important factors that could cause our actual results to differ materially from those indicated in these forward-looking statements, including, but not limited to, the following: our reliance on a limited number of insurance carrier partners and any potential termination of those relationships or failure to develop new relationships; existing and future laws and regulations affecting the health insurance market; changes in health insurance products offered by our insurance carrier partners and the health insurance market generally; insurance carriers offering products and services directly to consumers; changes to commissions paid by insurance carriers and underwriting practices; competition with brokers, exclusively online brokers and carriers who opt to sell policies directly to consumers; competition from government-run health insurance exchanges; developments in the U.S. health insurance system; our dependence on revenue from carriers in our senior segment and downturns in the senior health as well as life, automotive and home insurance industries; our ability to develop new offerings and penetrate new vertical markets; risks from third-party products; failure to enroll individuals during the Medicare annual enrollment period; our ability to attract, integrate and retain qualified personnel; our dependence on lead providers and ability to compete for leads; failure to obtain and/or convert sales leads to actual sales of insurance policies; access to data from consumers and insurance carriers; accuracy of information provided from and to consumers during the insurance shopping process; cost-effective advertisement through internet search engines; ability to contact consumers and market products by telephone; global economic conditions, including inflation; disruption to operations as a result of future acquisitions; significant estimates and assumptions in the preparation of our financial statements; impairment of goodwill; potential litigation and other legal proceedings or inquiries; our existing and future indebtedness; our ability to maintain compliance with our debt covenants; access to additional capital; failure to protect our intellectual property and our brand; fluctuations in our financial results caused by seasonality; accuracy and timeliness of commissions reports from insurance carriers; timing of insurance carriers’ approval and payment practices; factors that impact our estimate of the constrained lifetime value of commissions per policyholder; changes in accounting rules, tax legislation and other legislation; disruptions or failures of our technological infrastructure and platform; failure to maintain relationships with third-party service providers; cybersecurity breaches or other attacks involving our systems or those of our insurance carrier partners or third-party service providers; our ability to protect consumer information and other data; failure to market and sell Medicare plans effectively or in compliance with laws; and other factors related to our pharmacy business, including manufacturing or supply chain disruptions, access to and demand for prescription drugs, changes in reimbursement rates under our contracts with pharmacy benefit managers, and regulatory changes or other industry developments that may affect our pharmacy operations. For a further discussion of these and other risk factors that could impact our future results and performance, see the section entitled “Risk Factors” in the most recent Annual Report on Form 10-K (the “Annual Report”) and subsequent periodic reports filed by us with the Securities and Exchange Commission. Accordingly, you should not place undue reliance on any such forward-looking statements. Any forward-looking statement speaks only as of the date on which it is made, and, except as otherwise required by law, we do not undertake any obligation to publicly update or review any forward-looking statement, whether as a result of new information, future developments or otherwise.
About SelectQuote
Founded in 1985, SelectQuote (NYSE: SLQT) pioneered the model of providing unbiased comparisons from multiple, highly-rated insurance companies, allowing consumers to choose the policy and terms that best meet their unique needs. Two foundational pillars underpin SelectQuote’s success: a strong force of highly-trained and skilled agents who provide a consultative needs analysis for every consumer, and proprietary technology that sources and routes high-quality leads. Today, the Company operates an ecosystem offering high touchpoints for consumers across insurance, pharmacy, and virtual care.
With an ecosystem offering engagement points for consumers across insurance, Medicare, pharmacy, and value-based care, the company now has three core business lines: SelectQuote Senior, SelectQuote Healthcare Services, and SelectQuote Life. SelectQuote Senior serves the needs of a demographic that sees around 10,000 people turn 65 each day with a range of Medicare Advantage and Medicare Supplement plans. SelectQuote Healthcare Services is comprised of the SelectRx Pharmacy, a Patient-Centered Pharmacy Home™ (PCPH) accredited pharmacy, SelectPatient Management, a provider of chronic care management services, and Healthcare Select, which proactively connects consumers with a wide breadth of healthcare services supporting their needs.
SAN DIEGO, March 17, 2026 (GLOBE NEWSWIRE) — Gyre Therapeutics, Inc. (Gyre or Gyre Therapeutics) (Nasdaq: GYRE), a San Diego-based innovative commercial stage biopharmaceutical company with operations in the United States and China, today announced that the Center for Drug Evaluation (CDE) of China’s National Medical Products Administration (NMPA) has granted priority review status to the New Drug Application (NDA) for Hydronidone (F351) as a treatment for chronic hepatitis B (CHB)-induced liver fibrosis, which is liver damage resulting from the infection of the hepatitis B virus (HBV). This decision by CDE was made following the pre-NDA communication meeting previously announced on January 5, 2026 and is a major milestone in the NDA process. Gyre, through its majority-owned subsidiary, Gyre Pharmaceuticals Co., Ltd. (Gyre Pharmaceuticals), plans to submit a formal NDA in the near future.
Mr. Ping Zhang, Executive Chairman of Gyre, stated, “I am very pleased to see the decision by the Chinese CDE to grant priority review to our NDA for F351. It underscores both the urgency of the medical need to treat liver fibrosis and the potential of F351 as an innovative therapeutic option. HBV infection affects tens of millions of patients in China and a significant number of them will develop liver fibrosis and eventually cirrhosis. If approved, F351 could address the need for these patients. We thank the agency for their continued support to advance therapies for liver fibrosis patients in need of treatment and look forward to working closely with CDE to move F351 toward approval.”
About Priority Review Designation by the NMPA in China
Priority review was established in China in 2017 to facilitate drug registration and accelerate the development of new drugs with clinical value under the guidance of Opinions on Encouraging Pharmaceutical Innovation via Priority Review & Approval. According to these guidelines, the NMPA will prioritize the review of these applications and allocate additional evaluation resources, which is expected to accelerate the review process.
About Hydronidone (F351)
Hydronidone, also known as F351, is a novel, orally administered anti-fibrotic agent designed to target key liver fibrosis pathways. It attenuates hepatic stellate cell activation and fibrogenesis, at least in part, by suppressing TGF-β1-induced signal transduction, including reduced p38γ phosphorylation and upregulated Smad7 expression. This upregulation of Smad7 subsequently leads to downregulation of TGF-βRI and inhibition of Smad2/3 activation, thereby disrupting canonical TGF-β/Smad signaling and reducing fibrotic gene expression in HSCs.
The drug has completed Phase 3 clinical evaluation in China for CHB-associated liver fibrosis, including early (compensated) cirrhosis, and is being evaluated for its potential applicability across additional fibrotic diseases in region-specific development programs.
About CHB-Induced Liver Fibrosis
CHB-induced liver fibrosis is the accumulation of scar tissue (collagen) in the liver caused by persistent inflammation from hepatitis B virus. According to the World Health Organization, approximately 254 million people worldwide were living with CHB infection in 2022, with 1.2 million new infections each year, and 1.3 million deaths globally. CHB is the leading aetiology of liver fibrosis and liver cancer globally, with up to 36% of all CHB patients globally developing cirrhosis. CHB prevalence varies across geographies with China and the United States estimated to have among the highest number of CHB cases.
About Gyre Pharmaceuticals
Gyre Pharmaceuticals is a commercial-stage biopharmaceutical company committed to the research, development, manufacturing and commercialization of innovative drugs for organ fibrosis. Its flagship product, ETUARY® (pirfenidone capsule), was the first approved treatment for IPF in the PRC in 2011 and has maintained a prominent market share (2024 net sales of $105.8 million). In addition, Gyre Pharmaceuticals’ pipeline includes Hydronidone, a structural analogue of pirfenidone, which demonstrated statistically significant fibrosis regression after 52 weeks of treatment in a pivotal Phase 3 clinical trial in CHB-associated liver fibrosis in the PRC. Hydronidone received Breakthrough Therapy designation by the NMPA Center for Drug Evaluation in March 2021. Gyre Pharmaceuticals is also developing treatments for PD, RILI with or without immune-related pneumonitis, COPD, PAH and ALF/ACLF. As of the third quarter of 2025, Gyre Therapeutics owns a 69.7% equity interest in Gyre Pharmaceuticals.
About Gyre Therapeutics
Gyre Therapeutics is a biopharmaceutical company headquartered in San Diego, CA, primarily focused on the development and commercialization of Hydronidone for liver fibrosis including MASH in the U.S. Gyre’s strategy builds on its experience in mechanistic studies using MASH rodent models and clinical studies in CHB-induced liver fibrosis. In the PRC, Gyre is advancing a broad pipeline through its indirect controlling interest in Gyre Pharmaceuticals, including therapeutic expansions of ETUARY, and development programs for F573, F528, and F230. On March 2, 2026 Gyre announced its agreement to acquire Cullgen Inc., a privately-held, clinical-stage biopharmaceutical company focused on the discovery and development of targeted protein degraders and degrader antibody conjugate therapies.
Forward-Looking Statements
This press release contains “forward-looking statements” within the meaning of the “safe harbor” provisions of the Private Securities Litigation Reform Act of 1995, which statements are subject to substantial risks and uncertainties and are based on estimates and assumptions. All statements, other than statements of historical facts included in this press release, are forward-looking statements, including statements concerning: the expectations regarding Gyre’s research and development efforts and the timing of expected clinical readouts and regulatory filings, including the anticipated timing of the filing of Gyre’s NDA with the NMPA for the conditional approval of Hydronidone for the treatment of CHB-associated liver fibrosis and early cirrhosis and the initiation of the confirmatory Phase 3c clinical trial of Hydronidone to support full approval in China. In some cases, you can identify forward-looking statements by terms such as “may,” “might,” “will,” “objective,” “intend,” “should,” “could,” “can,” “would,” “expect,” “believe,” “design,” “estimate,” “predict,” “potential,” “plan” or the negative of these terms, and similar expressions intended to identify forward-looking statements. These statements reflect our plans, estimates, and expectations, as of the date of this press release. These statements involve known and unknown risks, uncertainties and other factors that could cause our actual results to differ materially from the forward-looking statements expressed or implied in this press release. Actual results and the timing of events could differ materially from those anticipated in such forward-looking statements as a result of these risks and uncertainties, which include, without limitation: Gyre’s ability to execute on its clinical development strategies; positive results from a clinical trial may not necessarily be predictive of the results of future or ongoing clinical trials; the timing or likelihood of regulatory filings and approvals; competition from competing products; the impact of general economic, health, industrial or political conditions in the United States or internationally; the sufficiency of Gyre’s capital resources and its ability to raise additional capital; supply chain and distribution delays and challenges. Additional risks and factors are identified under “Risk Factors” in Gyre’s Annual Report on Form 10-K for the year ended December 31, 2025 filed on March 13, 2026 and in other filings with the Securities and Exchange Commission.
Gyre expressly disclaims any obligation to update any forward-looking statements whether as a result of new information, future events or otherwise, except as required by law.
STAFFORD, Texas, March 17, 2026 (GLOBE NEWSWIRE) — Greenwich LifeSciences, Inc. (Nasdaq: GLSI) (the “Company”), a clinical-stage biopharmaceutical company focused on its Phase III clinical trial, FLAMINGO-01, which is evaluating GLSI-100, an immunotherapy to prevent breast cancer recurrences, today provided a preliminary update showing a continued reduction in the recurrence rate in the fully enrolled, 250 patient, open label non-HLA-A*02 arm of FLAMINGO-01.
6 Months of Additional Patient Data Since Last Update Shows Recurrence Rate of <1% per Year in Non-HLA-A*02 Patients Treated with GLSI-100, Following Completion of Primary Immunization Series (PIS)
This <1% Annual Recurrence Rate Observed in Non-HLA-A*02 Patients is Statistically Significantly Smaller Than a 4% Annual Recurrence Rate Over a Similar Time Period Observed in the Katherine Study (Kadcyla Treated Arm) Yielding an Approximately 70-80% Reduction in Recurrence Rate as Explained Below
The non-HLA-A*02 arm does not have a direct placebo comparator arm, thus a Kaplan Meier survival analysis is not possible, and the following method was used:
The <1% recurrence rate per year of these 250 treated patients after completing the PIS was compared to the expected historical recurrence rate per year reported for a similar population in the Katherine study who received TDM1 (Kadcyla), which is about 4% recurrences per year or higher in the initial years of the Katherine study. The majority of the treated patients in FLAMINGO-01 also received TDM1 followed by GLSI-100.
As of this data cut, the current recurrence rate of the non-HLA-A*02 patients treated with GLSI-100, following completion of the PIS over an average of 1.2 years of patient exposure, is statistically significantly smaller than a 4% annual recurrence rate over a similar time period observed in the Katherine study (0.7% versus 4% annual recurrence rate over 1.2 patient-years, 83% reduction in recurrence rate, Chi Square, p < 0.005). This preliminary data will continue to be updated and cleaned, so future and final results may vary. Future updates may be presented at upcoming conferences.
This observation is trending similarly to the Phase IIb trial results and hazard ratio where HLA-A*02 patients were treated and where breast cancer recurrences were reduced up to 80% compared to a 20-50% reduction in recurrence rate by other approved products.
Additional information about the non-HLA-A*02 arm follows:
Virtually all of the non-HLA-A*02 patients have completed the primary immunization series, which is the first 6 monthly vaccinations in the study.
Every 6 months approximately 110 patient-years are added to the non-HLA-A*02 patient data base.
Enhertu (T-DXd) treated patients can be enrolled in FLAMINGO-01. In the future, if Enhertu is approved for high risk patients in the adjuvant setting, more Enhertu treated patients could be enrolled in FLAMINGO-01 and may recur at a lower rate than if treated with Kadcyla. The recurrence rate assumptions in the design of FLAMINGO-01 include this possibility as well as other potential improvements in standard of care.
Analysis of the open label data from FLAMINGO-01 has been conducted in a manner that maintains the study blind. The open label recurrence rate, immune response, and safety data is based on the patients enrolled to date in FLAMINGO-01 and the data provided by the clinical sites so far, which is not completed or fully reviewed, and is thus preliminary. While comparing any preliminary FLAMINGO-01 data to the Phase IIb clinical trial data may be possible, these preliminary results are not a prediction of future results, and the results at the end of the study may differ.
About FLAMINGO-01 Open Label Phase III Data
More than 1,000 patients have been screened with a current screen rate of approximately 800 patients per year. The 250 patient non-HLA-A*02 arm is now fully enrolled, where all patients received GLSI-100, which is 5 times more treated patients and recurrence rate data than the approximately 50 patients treated in the Phase IIb trial. The Primary Immunization Series (PIS), which includes the first 6 GLSI-100 injections over the first 6 months and is required to reach peak protection, is followed by 5 booster injections given every 6 months to prolong the immune response, thereby providing longer-term protection.
In the non-HLA-A*02 arm, a preliminary analysis of recurrence rates after the PIS is completed compared to the recurrence rates comparable to those observed in the Katherine study of Kadcyla shows an approximately 70-80% reduction in recurrence rate.
This non-HLA-A*02 arm observation is trending similarly to the Phase IIb trial results and hazard ratio where HLA-A*02 patients were treated and where breast cancer recurrences were reduced up to 80% compared to a 20-50% reduction in recurrence rate by other approved products.
The immune response at baseline prior to any GLSI-100 treatment, the increasing immune response during the PIS, and the safety profile of non-HLA-A*02 patients is trending similarly to the HLA-A*02 arms of FLAMINGO-01 and to the Phase IIb study.
Analysis of the open label data from FLAMINGO-01 has been conducted in a manner that maintains the study blind. The open label recurrence rate, immune response, and safety data is based on the patients enrolled to date in FLAMINGO-01 and the data provided by the clinical sites so far, which is not completed or fully reviewed, and is thus preliminary. While comparing any preliminary FLAMINGO-01 data to the Phase IIb clinical trial data may be possible, these preliminary results are not a prediction of future results, and the results at the end of the study may differ.
About GLSI-100 Phase IIb Study
In the prospective, randomized, single-blinded, placebo-controlled, multi-center (16 sites led by MD Anderson Cancer Center) Phase IIb clinical trial of HLA-A*02 breast cancer patients, 46 HER2/neu 3+ over-expressor patients were treated with GLSI-100, and 50 placebo patients were treated with GM-CSF alone. After 5 years of follow-up, there was an 80% or greater reduction in cancer recurrences in the HER2/neu 3+ patients who were treated with GLSI-100, followed, and remained disease free over the first 6 months, which we believe is the time required to reach peak immunity and thus maximum efficacy and protection. The Phase IIb results can be summarized as follows:
80% or greater reduction in metastatic breast cancer recurrence rate over 5 years of follow-up with a peak immune response at 6 months and well-tolerated safety profile.
The PIS elicited a potent immune response as measured by local skin tests and immunological assays.
About FLAMINGO-01 and GLSI-100
FLAMINGO-01 (NCT05232916) is a Phase III clinical trial designed to evaluate the safety and efficacy of Fast Track designated GLSI-100 (GP2 + GM-CSF) in HER2 positive breast cancer patients who had residual disease or high-risk pathologic complete response at surgery and who have completed both neoadjuvant and postoperative adjuvant trastuzumab based treatment. The trial is led by Baylor College of Medicine and currently includes US and European clinical sites from university-based hospitals and academic and cooperative networks with plans to open up to 150 sites globally. In the double-blinded arms of the Phase III trial, approximately 500 HLA-A*02 patients are planned to be randomized to GLSI-100 or placebo, and up to 250 patients of other HLA types are planned to be treated with GLSI-100 in a third arm. The trial has been designed to detect a hazard ratio of 0.3 in invasive breast cancer-free survival, where 28 events will be required. An interim analysis for superiority and futility will be conducted when at least half of those events, 14, have occurred. This sample size provides 80% power if the annual rate of events in placebo-treated subjects is 2.4% or greater.
For more information on FLAMINGO-01, please visit the Company’s website here and clinicaltrials.gov here. Contact information and an interactive map of the majority of participating clinical sites can be viewed under the “Contacts and Locations” section. Please note that the interactive map is not viewable on mobile screens. Related questions and participation interest can be emailed to: flamingo-01@greenwichlifesciences.com
About Breast Cancer and HER2/neu Positivity
One in eight U.S. women will develop invasive breast cancer over her lifetime, with approximately 300,000 new breast cancer patients and 4 million breast cancer survivors. HER2 (human epidermal growth factor receptor 2) protein is a cell surface receptor protein that is expressed in a variety of common cancers, including in 75% of breast cancers at low (1+), intermediate (2+), and high (3+ or over-expressor) levels.
About Greenwich LifeSciences, Inc.
Greenwich LifeSciences is a clinical-stage biopharmaceutical company focused on the development of GP2, an immunotherapy to prevent breast cancer recurrences in patients who have previously undergone surgery. GP2 is a 9 amino acid transmembrane peptide of the HER2 protein, a cell surface receptor protein that is expressed in a variety of common cancers, including expression in 75% of breast cancers at low (1+), intermediate (2+), and high (3+ or over-expressor) levels. Greenwich LifeSciences has commenced a Phase III clinical trial, FLAMINGO-01. For more information on Greenwich LifeSciences, please visit the Company’s website at www.greenwichlifesciences.com and follow the Company’s Twitter at https://twitter.com/GreenwichLS.
Forward-Looking Statement Disclaimer
Statements in this press release contain “forward-looking statements” that are subject to substantial risks and uncertainties. All statements, other than statements of historical fact, contained in this press release are forward-looking statements. Forward-looking statements contained in this press release may be identified by the use of words such as “anticipate,” “believe,” “contemplate,” “could,” “estimate,” “expect,” “intend,” “seek,” “may,” “might,” “plan,” “potential,” “predict,” “project,” “target,” “aim,” “should,” “will,” “would,” or the negative of these words or other similar expressions, although not all forward-looking statements contain these words. Forward-looking statements are based on Greenwich LifeSciences Inc.’s current expectations and are subject to inherent uncertainties, risks and assumptions that are difficult to predict, including statements regarding the intended use of net proceeds from the public offering; consequently, actual results may differ materially from those expressed or implied by such forward-looking statements. Further, certain forward-looking statements are based on assumptions as to future events that may not prove to be accurate. These and other risks and uncertainties are described more fully in the section entitled “Risk Factors” in Greenwich LifeSciences’ Annual Report on the most recent Form 10-K for the year ended December 31, 2024, and other periodic reports filed with the Securities and Exchange Commission. Forward-looking statements contained in this announcement are made as of this date, and Greenwich LifeSciences, Inc. undertakes no duty to update such information except as required under applicable law.
Investor & Public Relations Contact for Greenwich LifeSciences Dave Gentry RedChip Companies Inc. Office: 1-800-RED CHIP (733 2447) Email: dave@redchip.com
Robert LeBoyer, Senior Vice President, Equity Research Analyst, Biotechnology, Noble Capital Markets, Inc.
Refer to the full report for the price target, fundamental analysis, and rating.
Presigious Journal Publishes The Phase 2b PARDIGM Study. JAMA Neurology has published an article dissussing the Phase 2b PARDIGM clinical trial. This peer-reviewed journal is published by the American Medical Association and regarded as one of the most prestigious journals in the field of neurology. We see this as a validation the clinical results and an acknowledgement of the impact PrimeC had on the amyotrophic lateral sclerosis (ALS) patients in the study.
PrimeC Addresses Important Mechanisms Of Neuron Degeneration. PrimeC is a proprietary fixed-dose oral combination of celecoxib and ciprofloxacin. These drugs target pathways of neuronal cell death, including regulation of microRNA synthesis, reduction in neuroinflammation, and modulation of iron accumulation. Additional testing by NeuroSense determined the optimal dosage combination of the two drugs for human studies and the extended releaase formulaton.
Equity Research is available at no cost to Registered users of Channelchek. Not a Member? Click ‘Join’ to join the Channelchek Community. There is no cost to register, and we never collect credit card information.
This Company Sponsored Research is provided by Noble Capital Markets, Inc., a FINRA and S.E.C. registered broker-dealer (B/D).
*Analyst certification and important disclosures included in the full report. NOTE: investment decisions should not be based upon the content of this research summary. Proper due diligence is required before making any investment decision.