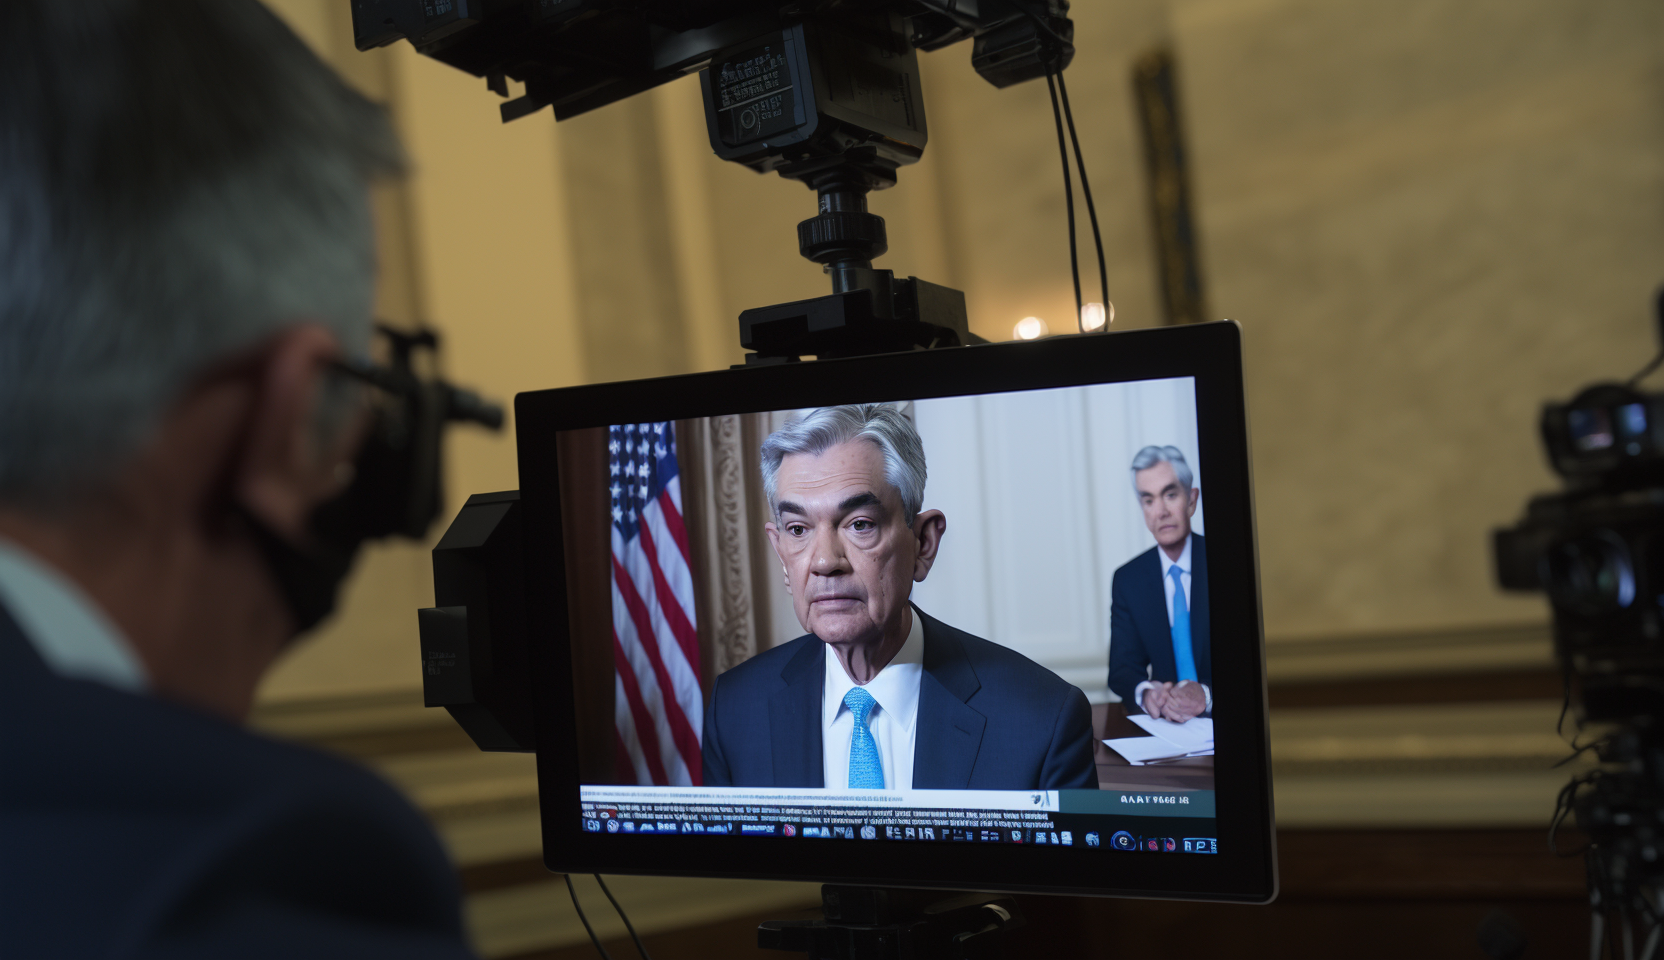
Investors Await Powell’s Speech for Cues on Future Rate Hikes

Federal Reserve Chair Jerome Powell is set to deliver a closely watched speech on Thursday before the Economic Club of New York that could offer critical guidance on the future path of monetary policy.

Markets are looking for clarity from Powell on how the Fed plans to balance improving inflation data against surging Treasury yields and risks of recession. His remarks come at a precarious time – inflation shows early signs of easing but remains well above the Fed’s 2% target, while rapidly rising interest rates threaten to slow economic growth.

Powell faces the tricky task of conveying that the Fed remains vigilant in combating inflation while avoiding cementing expectations for further aggressive rate hikes that could hammer markets.

“Powell has to present himself to investors as the dispassionate neutral leader and allow others to be more aggressive,” said Jeffrey Roach, chief economist at LPL Financial. “They’re not going to declare victory, and that is one reason why Powell is going to continue to talk somewhat hawkish.”

Cues from within the Fed have been mixed recently. Several officials, including Philadelphia Fed President Patrick Harker, have advocated holding fire on rate hikes temporarily to evaluate incoming data. This “wait and see” approach comes after a torrent of large rate increases this year, with the Fed Funds rate now sitting at a 15-year high of 3.75%-4%.

But hawkish voices like New York Fed President John Williams insist the Fed must keep policy restrictive for some time to combat inflation. Markets hope Powell will provide definitive guidance on the prevailing consensus within the central bank.

Policymakers are navigating a complex environment. Inflation data has been gradually improving from 40-year highs earlier this year. But inflation expectations remain uncomfortably high, pointing to the need for further tightening.

“Powell has to present the recent inflation data as welcome news, but not evidence that the job is done,” said Ryan Sweet, chief U.S. economist at Oxford Economics. “The Fed still has more work to do.”

At the same time, the rapid rise in Treasury yields in recent weeks has already tightened financial conditions substantially. Another massive rate hike could be unnecessary overkill.

According to Krishna Guha of Evercore ISI, Powell will likely underscore “that the data has been coming in stronger than expected, but there has also been a big move in yields, which has tightened financial conditions, so no urgency for a policy response in November.”

Markets are currently pricing in a 65% chance that rates remain on hold at next month’s policy meeting. But there is still roughly a one-in-three chance of another 0.75 percentage point hike.

All eyes will be parsing Powell’s speech for any clues or direct guidance on the Fed’s next steps. While he is expected to avoid concrete commitments, his language choices will be dissected for shifts in tone or any hints at changes in thinking around the policy trajectory.

Powell’s remarks will also be scrutinized for takeaways on how long the Fed may need to keep rates elevated before ultimately cutting. Luke Tilley of Wilmington Trust expects Powell “to keep talking about staying vigilant” and the need for rates to remain higher for longer to ensure inflation comes down sustainably.

With growing recession fears on Main Street and Wall Street, Powell faces a defining moment to communicate a clear roadmap of where monetary policy is headed, while retaining flexibility. Walking this tightrope will be critical to shoring up the Fed’s credibility and avoiding unnecessary market turmoil.

All eyes are on the Fed chair tomorrow as investors and economists eagerly await guidance from the man himself holding the levers over the world’s most influential interest rate.

The FOMC Minutes Show Officials Divided on Need for More Rate Hikes

The Federal Reserve released the full minutes from its pivotal September policy meeting on Wednesday, providing critical behind-the-scenes insight into how officials view the path ahead for monetary policy.

The minutes highlighted a growing divergence of opinions within the Fed over whether additional large interest rate hikes are advisable or if it’s time to ease off the brakes. This debate reflects the balancing act the central bank faces between taming still-high inflation and avoiding tipping the economy into recession.

No Agreement on Further Tightening

The September gathering concluded with the Fed voting to lift rates by 0.75 percentage point for the third straight meeting, taking the federal funds target range to 3-3.25%. This brought total rate increases to 300 basis points since March as the Fed plays catch up to curb demand and cool price pressures.

However, the minutes revealed central bankers were split regarding what comes next. They noted “many participants” judged another similar-sized hike would likely be appropriate at upcoming meetings. But “some participants” expressed reservations about further rate increases, instead preferring to monitor incoming data and exercise optionality.

Markets are currently pricing in an additional 75 basis point hike at the Fed’s December meeting, which would fulfill the desires of the hawkish camp. But nothing is guaranteed, with Fed Chair Jerome Powell emphasizing policy will be determined meeting-by-meeting based on the dataflow.

Concerns Over Slowing Growth, Jobs

According to the minutes, officials in favor of maintaining an aggressive policy stance cited inflation remaining well above the Fed’s 2% goal. The labor market also remains extremely tight, with 1.7 job openings for every unemployed person in August.

On the flip side, officials hesitant about more hikes mentioned that monetary policy already appears restrictive thanks to higher borrowing costs and diminished liquidity in markets. Some also voiced concerns over economic growth slowing more abruptly than anticipated along with rising joblessness.

The consumer price index rose 8.3% in August compared to a year ago, only slightly lower than July’s 40-year peak of 8.5%. However, the Fed pays close attention to the services and wage growth components which indicate whether inflation will be persistent.

Data Dependency is the Mantra

The minutes emphasized Fed officials have coalesced around being nimble and reacting to the data rather than sticking to a predefined rate hike plan. Members concurred they can “proceed carefully” and adjust policy moves depending on how inflation metrics evolve.

Markets and economists will closely monitor upcoming October and November inflation reports, including wage growth and inflation expectations, to determine if Fed policy is gaining traction. Moderating housing costs will be a key tell.

Officials also agreed rates should remain restrictive “for some time” until clear evidence emerges that inflation is on a sustainable path back to the 2% target. Markets are pricing in rate cuts in late 2023, but the Fed wants to avoid a premature policy reversal.

While Americans continue opening their wallets, officials observed many households now show signs of financial strain. Further Fed tightening could jeopardize growth and jobs, arguments made by dovish members.

All About Inflation

At the end of the day, the Fed’s policy decisions will come down to the inflation data. If price pressures continue slowly cooling, the case for further large hikes diminishes given the policy lags.

But if inflation remains sticky and elevated, particularly in the services sector or wage growth, hawks will maintain the pressure to keep raising rates aggressively. This uncertainty means volatility is likely in store for investors.

For now, the Fed is split between officials who want to maintain an aggressive tightening pace and those worried about going too far. With risks rising on both sides, Chairman Powell has his work cut out for him in charting the appropriate policy course.

Fed Keeping Rates Higher Despite Pausing Hikes For Now

The Federal Reserve left interest rates unchanged on Wednesday but projected keeping them at historically high levels into 2024 and 2025 to ensure inflation continues falling from four-decade highs.

The Fed held its benchmark rate steady in a target range of 5.25-5.5% following four straight 0.75 percentage point hikes earlier this year. But officials forecast rates potentially peaking around 5.6% by year-end before only gradually declining to 5.1% in 2024 and 4.6% in 2025.

This extended timeframe for higher rates contrasts with prior projections for more significant cuts starting next year. The outlook underscores the Fed’s intent to keep monetary policy restrictive until inflation shows clearer and more persistent signs of cooling toward its 2% target.

“We still have some ways to go,” said Fed Chair Jerome Powell in a press conference, explaining why rates must remain elevated amid still-uncertain inflation risks. He noted the Fed has hiked rates to restrictive levels more rapidly than any period in modern history.

The Fed tweaked its economic forecasts slightly higher but remains cautious on additional tightening until more data arrives. The latest projections foresee economic growth slowing to 1.5% next year with unemployment ticking up to 4.1%.

Core inflation, which excludes food and energy, is expected to fall from 4.9% currently to 2.6% by late 2023. But officials emphasized inflation remains “elevated” and “unacceptably high” despite moderating from 40-year highs earlier this year.

Consumer prices rose 8.3% in August on an annual basis, down from the 9.1% peak in June but well above the Fed’s 2% comfort zone. Further cooling is needed before the Fed can declare victory in its battle against inflation.

The central bank is proceeding carefully, pausing rate hikes to assess the cumulative impact of its rapid tightening this year while weighing risks. Additional increases are likely but the Fed emphasized future moves are data-dependent.

“In coming months policy will depend on the incoming data and evolving outlook for the economy,” Powell said. “At some point it will become appropriate to slow the pace of increases” as the Fed approaches peak rates.

For now, the Fed appears poised to hold rates around current levels absent a dramatic deterioration in inflation. Keeping rates higher for longer indicates the Fed’s determination to avoid loosening prematurely before prices are fully under control.

Powell has reiterated the Fed is willing to overtighten to avoid mistakes of the 1970s and see inflation fully tamed. Officials continue weighing risks between high inflation and slower economic growth.

“Restoring price stability while achieving a relatively modest increase in unemployment and a soft landing will be challenging,” Powell conceded. “No one knows whether this process will lead to a recession.”

Nonetheless, the Fed chief expressed optimism that a severe downturn can still be avoided amid resilient household and business spending. The labor market also remains strong with unemployment at 3.7%.

But the housing market continues to soften under the weight of higher rates, a key channel through which Fed tightening slows the economy. And risks remain tilted to the downside until inflation demonstrably falls closer to target.

For markets, clarity that rates will stay elevated through 2024 reduces uncertainty. Stocks bounced around after the Fed’s announcement as investors processed the guidance. The path forward depends on incoming data, but the Fed appears determined to keep rates higher for longer.

The Perfect Storm Brewing in US Housing

A perfect storm is brewing in the US housing market. Mortgage rates have surged above 7% just as millennials, the largest generation, reach peak homebuying age. This collision of rising interest rates and unmet demand is causing substantial disruption, as seen in the sharp decline in home sales, cautious builders and a looming affordability crisis that threatens the broader economy.

Mortgage rates have taken off as the Federal Reserve aggressively raises interest rates to fight inflation. The average 30-year fixed rate recently hit 7.18%, according to Freddie Mac, the highest level since 2001. This has severely hampered housing affordability and demand. Fannie Mae, the mortgage finance giant, forecasts total home sales will drop to 4.8 million this year, the slowest pace since 2011 when the housing market was still recovering from the Great Recession.

Fannie Mae expects sales to struggle through 2024 as rates remain elevated. It predicts the US economy will enter a recession in early 2024, further dragging down the housing market. Home prices are also likely to drop as high rates impede sales. This could hurt consumer confidence and discretionary spending, considering the critical role housing plays in household wealth.

Higher rates have pumped up monthly mortgage payments and made homes less affordable. Take a $500,000 home purchased with a 20% down payment. At a 2.86% mortgage rate two years ago, the monthly payment would have been $1,656. With rates now at 7.18%, that same home has a monthly cost of $3,077, according to calculations by Axios. That 87% payment surge makes purchasing unattainable for many buyers.

These affordability challenges are hitting just as millennials reach peak homebuying age. The largest cohorts of this generation were born in the late 1980s and early 1990s, making them between 32 and 34 years old today. That’s when marriage, childbearing and demand for living space typically accelerate.

However, homebuilders have been reluctant to significantly ramp up construction with rates so high. Housing starts experienced a significant decline of 11.3% in August, according to Census Bureau data, driven by a decline in apartment buildings. Single-family starts dipped 4.3% to an annual pace of 941,000, 16% below the average from mid-2020 to mid-2022. Homebuilder sentiment has also plunged, according to the National Association of Home Builders.

Take a look at Orion Group Holdings Inc., a leading specialty construction company servicing the infrastructure, industrial and building sectors.

This pullback in new construction comes even as there is strong interest from millennials and other buyers. Though mortgage rates moderated the overheated housing market earlier this year, national home prices remain just below their all-time highs, up 13.5% from two years ago, according to the S&P Case-Shiller index.

Some analysts say the only solution is to significantly boost supply. But that seems unlikely with builders cautious and financing costs high. The housing crisis has no quick fix and will continue to be an anchor on the broader economy. Millennials coming of age and mortgage rates spiraling upwards have sparked a perfect storm, broken the housing market, and darkened the country’s economic outlook.

U.S. National Debt Tops $33 Trillion

The U.S. national debt surpassed $33 trillion for the first time ever this week, hitting $33.04 trillion according to the Treasury Department. This staggering sum exceeds the size of the entire U.S. economy and equals about $100,000 per citizen.

For investors, the ballooning national debt raises concerns about future tax hikes, inflation, and government spending cuts that could impact markets. While the debt level itself may seem abstract, its trajectory has real implications for portfolios.

Over 50% of the current national debt has accumulated since 2019. Massive pandemic stimulus programs, tax cuts, and a steep drop in tax revenues all blew up the deficit during Covid-19. Interest costs on the debt are also piling up.

Some level of deficit spending was needed to combat the economic crisis. But years of expanding deficits have brought total debt to the highest level since World War II as a share of GDP.

With debt now exceeding the size of the economy, there is greater risk of reduced economic output from crowd-out effects. High debt levels historically hamper GDP growth.

Economists worry that high debt will drive up borrowing costs for consumers and businesses as the government competes for limited capital. The Congressional Budget Office projects interest costs will soon become the largest government expenditure as rates rise.

Higher interest rates will consume more tax revenue just to pay interest, leaving less funding available for programs and services. Taxes may have to be raised to cover these costs.

Rising interest costs will also put more pressure on the Federal Reserve to keep rates low and monetize the debt through quantitative easing. This could further feed inflation.

If interest costs spiral, government debt could eventually reach unsustainable levels and require restructuring. But well before that, the debt overhang will influence policy and markets.

As debt concerns mount, investors may rotate to inflation hedges like gold and real estate. The likelihood of higher corporate and individual taxes could hit equity valuations and consumer spending.

But government spending cuts to social programs and defense would also ripple through the economy. Leaner budgets would provide fiscal headwinds reducing growth.

With debt limiting stimulus options, creative monetary policy would be needed in the next recession. More radical measures by the Fed could introduce volatility.

While the debt trajectory is troubling, a crisis is not imminent. Still, prudent investors should account for fiscal risks in their portfolio positioning and outlook. The ballooning national debt will shape policy and markets for years to come.

The Fed’s Tightrope Walk Between Inflation and Growth

The Federal Reserve is stuck between a rock and a hard place as it aims to curb high inflation without inflicting too much damage on economic growth. This precarious balancing act has major implications for both average citizens struggling with rising prices and investors concerned about asset values.

For regular households, the current bout of high inflation straining budgets is public enemy number one. Prices are rising at 8.3% annually, squeezing wages that can’t keep pace. Everything from groceries to rent to healthcare is becoming less affordable. Meanwhile, rapid Fed rate hikes intended to tame inflation could go too far and tip the economy into recession, slowing the job market and risking higher unemployment.

However, new economic research suggests the Fed also needs to be cognizant of rate hikes’ impact on the supply side of the economy. Supply chain bottlenecks and constrained production have been key drivers of this inflationary episode. Aggressive Fed action that suddenly squelches demand could backfire by inhibiting business investment, innovation, and productivity growth necessary to expand supply capacity.

For example, sharply higher interest rates make financing more expensive, deterring business investment in new factories, equipment, and technologies. Tighter financial conditions also restrict lending to startups and venture capital for emerging technologies. All of this could restrict supply, keeping prices stubbornly high even in a weak economy.

This means the Fed has to walk a tightrope, moderating demand enough to curb inflation but not so much that supply takes a hit. The goal is to lower costs without forcing harsh rationing of demand through high unemployment. A delicate balance is required.

For investors, rapidly rising interest rates have already damaged asset prices, bringing an end to the long-running stock market boom. Higher rates make safe assets like bonds more appealing versus risky bets like stocks. And expectations for Fed hikes ahead impact share prices and other securities.

But stock markets could stabilize if the Fed manages to engineering the elusive “soft landing” – bringing down inflation while avoiding recession. The key is whether moderating demand while supporting supply expansion provides stable growth. However, uncertainty remains high on whether the Fed’s policies will thread this narrow needle.

Overall, the Fed’s inflation fight has immense stakes for Americans’ economic security and investors’ asset values. Walking the tightrope between high inflation and very slow growth won’t be easy. Aggressive action risks supply problems and recession, but moving too slowly could allow inflation to become entrenched. It’s a delicate dance with high stakes riding on success.

Jobless Claims Drop to Lowest Since February as Labor Market Holds Up

New applications for U.S. unemployment benefits fell unexpectedly last week to the lowest level since mid-February, signaling the job market remains tight even as broader economic headwinds build.

Initial jobless claims declined by 13,000 to 216,000 in the week ended September 2, the Labor Department reported Thursday. That was below economist forecasts for a rise to 234,000 and marked the fourth straight week of declines.

Continuing claims, which track ongoing unemployment, also dropped to 1.679 million for the week ended August 26. That was the lowest point since mid-July.

The downward trend in both initial and continuing claims points to ongoing resilience in the labor market amid strong employer demand for workers.

There are some emerging signs of softness, however. The unemployment rate ticked higher to 3.8% in August as labor force participation increased. Job growth also moderated in the latest month, though remains healthy.

Worker productivity rebounded at a 3.5% annualized pace in the second quarter, the fastest rise since 2020. Moderating labor cost growth could also help the Federal Reserve combat high inflation.

While jobless claims remain near historic lows, economists will keep a close eye on any notable changes that could indicate potential layoffs, although the Federal Reserve has recently taken a more measured approach to rate hikes aimed at moderating economic demand.

Currently, the most recent data confirms a remarkably robust job market, despite concerns about inflation and slowing growth. This resilience provides hope that any potential economic downturn in the future might be less severe than previously anticipated.

An Increased Need for Treasury Borrowing Will Impact All Markets

Stocks, Bonds, and Real Estate Markets are All Impacted By U.S. Debt Levels

Who will buy all the U.S. Treasury debt issuance? This week the Treasury Department hinted at its borrowing needs estimate for the third quarter. Its estimated need is $1 trillion-plus, the largest third-quarter need ever. At the same time, the Federal Reserve is reducing its holdings of U.S. debt by a cumulative $90 billion each month, and the U.S. dollar is on a weakening trend which reduces demand for dollar-denominated assets. There are now concerns being raised about the extent to which domestic and foreign demand for U.S. debt issuance will be able to grow to match issuance.

More details surrounding the Treasuries financing needs will be released at 8:30 on Wednesday August 2nd. The large estimate already shared in advance, $1.007 trillion, has analysts beginning to conclude that the U.S. could become hampered with a deteriorating fiscal deficit outlook amid continuing pressure to borrow more.

Two months ago, analysts at Fitch Ratings, a bond credit rating company, put the United States on Rating Watch Negative (RWN) citing, among other things, “fiscal and debt trajectories.” The initial ratings watch came at a time when there was uncertainty about whether the U.S. debt ceiling would be raised. It was not only increased, on June 2nd President Biden signed Congresses bill removing any upper limit on debt issuance until January 2025. The increase in debt, reduced number of buyers, lack of fiscal guardrails, and already higher interest rates on rollover debt could have consequences for all markets. Fitch may be prompted to replace the AAA rating on US Treasuries by assigning a lower rating.

At stake for the broader fixed-income market is that most corporate debt issuance is spread to U.S. Treasury rates of similar duration bonds. If large ongoing auctions over the third quarter deplete demand at market levels Treasury yields would have to trade higher, or government debt would face being illiquid or even default.

In the past U.S. Treasury borrowing need has been met by the perceived safety in the country’s ability to prosper and pay its debts, as well as the reliability of the U.S. dollar as a reserve currency. It’s unclear with less stable relations with China (a large holder of U.S. debt) and the BRICS nations plans to create a gold-based fiat currency, if demand will shrink or grow while U.S. debt issuance climbs.

At stake for the broader real estate market, which is heavily leveraged and therefore greatly impacted by interest rate expenses, is for the cost of borrowing to rise should demand for Treasuries not meet new issuance levels. Thirty-year residential loans are spread off ten-year Treasuries. Further increases in mortgage rates would serve to slow down real estate transactions.

The stock market would likely become bifurcated with stocks tied to big ticket items, typically bought by securing financing, weakening, and stocks that benefit from a strong dollar (higher comparative rates strengthen a native currency) could also do well. These stocks include companies that don’t have a large overseas customer base — if they are net importers, they may benefit even more. Companies that have large borrowing needs, will find their cost of capital has increased as they compete with U.S. Treasury rates. This is why small cap companies, that have very little borrowing needs, tend to perform better than large-cap companies with high debt levels in similar industries.

One Federal government expense that it can’t exercise immediate control over is the interest rate expense of its debt. Over $32 trillion in debt, spread out to mature through 30 years, now holds an average rate of near 2.50%. New debt is issued with almost double that interest rate. This is evident in the chart above that shows interest on debt from 2020 until today increased by $400 billion – with no expected change in its growth rate.

In a Tuesday note title “Treasury Tsunami,” rates strategists at Barclays Anshul Pradhan and Andres Mok wrote, the “Treasury’s latest financing estimates point to a worsening fiscal profile” and “the fiscal picture has worsened significantly since last year.” They point to the likelihood of “a sharp increase in the supply of notes and bonds over the coming quarters,” and cautioned investors against expecting “a typical end-of-cycle bond market rally.”

Whether or not the Fed continues to remain hawkish, if this recipe of greater U.S. debt issuance need continues on its trajectory, with fewer buyers, interest rates will rise. For investors with the common 60/40 portfolios, that is to say 40% in bonds, higher rates will mathematically cause prices of their fixed income holdings to decline. They may receive interest payments every six months, but if interest rates keep increasing, what others are willing to pay for that payment stream declines. In this way, bonds and other fixed income is only the place to hide if you want to be certain of declining values of your holdings.

Take Away

The Fed could stop tightening, and still there would be upward pressure on Treasury rates because of increased supply. Interestingly, this would serve to create a normally sloped yield curve (not inverted) which, according to many that were saying this year’s inverted yield curve is an unmistakable sign of impending recession, they would have another chance at being wrong again by saying an upwardly sloping yield curve is signs the market expects robust growth. Taken in the context of all of 2023s market dynamics and manipulations, neither textbook simplification fits.

If the scenario of higher rates out on the curve unfolds, a higher cost of capital will impact some industries more than others, and international companies differently than pure domestic operations. Consider this as you make your own interest rate and economic projections and adjust your holdings accordingly.

Paul Hoffman

Managing Editor, Channelchek

Sources

https://www.fitchratings.com/research/sovereigns/despite-debt-limit-agreement-us-aaa-rating-remains-on-negative-watch-02-06-2023#:~:text=Fitch%20Ratings%2DNew%20York%2D02,and%20the%20outlook%20for%20medium%2D

https://fiscaldata.treasury.gov/datasets/average-interest-rates-treasury-securities/average-interest-rates-on-u-s-treasury-securities

https://www.morningstar.com/news/marketwatch/20230801306/eye-popping-borrowing-need-from-us-treasury-raises-risk-of-buyers-fatigue

Five Ways Higher Interest Rates Impact Stocks

Interest Rate Increases are Less Frightening When the Impact is Understood

The fixed income market, and the interest rates market in general have a pronounced role in shaping stock market dynamics and equity investor sentiment. At a minimum, higher rates, the cost of money, when increasing, will most directly impact businesses that borrow as part of their normal activity. Other industries find that growing profits is more difficult in a less direct way. And then there are actually sectors that can benefit from an upward-sloping yield curve. Below we cover five different ways that higher interest rates impact stocks, and mention sectors that may be especially hurt, and some that could even thrive if the rates continue to climb higher.

Background

The U.S. central bank, The Federal Reserve has raised overnight interest rates from nearly 0.00% to near 5.25%. Longer-term rates have not followed in lock-step as other dynamics such as future economic expectations, flight to quality, and Fed yield-curve-control have caused longer rates to continue to lag below short-term interest rates.

In recent days there has been some selling in bonds which has driven longer interest rates up. The overall reason is the rekindled belief that the Fed is not finished tightening after the FOMC minutes from June indicated such. But other factors such as investors doing break-even analysis on longer term bonds and then raealizing they may not be getting paid enough interest to offset inflation, or to benefit them more than rolling shorter maturities that may be paying 200bp higher.

The sudden increase in rates, especially the ten-year US Treasury Note which is a benchmark for many lending rates, including mortgages, has caused stock market participants to feel unsettled. Some of their fears may be justified, some may not be.

Five Ways Higher Interest Rates Impact Equities

#1 Higher Rates Impact on Equity Valuations

One of the primary concerns for stock market investors, when interest rates rise, is the potential impact on equity valuations. As interest rates increase, the discount rate used to value future cash flows is then higher. This can put downward pressure on equity valuations, particularly for stocks with high price-to-earnings ratios. Investors become concerned about the potential decline in stock prices and the overall effect on the market’s valuation levels.

#2 Profitability of Interest Rate-Sensitive Sectors

Some sectors are particularly interest rate sensitive. Utilities for example, might have a couple of things working against them. First off, they are notorious for carrying a high level of debt. As this debt needs to be refinanced (as bonds mature), the new bonds need to be issued at higher rates, increasing the utility’s cost of doing business.

Utilities also are popular investments among dividend investors. As yields on bonds increase, there is more competition for income investors to choose from, at times with lower risk, which makes utility stocks less attractive.

As one might imagine REITs, by definition, all have real estate as underlying assets. Rising interest rates can increase borrowing costs for REITs involved in property acquisitions and development. This can potentially affect their profitability and underlying property valuations.

As with utilities, the REIT sector attracts income investors; if bonds become a more attractive alternative, this creates lower demand for REIT investing.

Financial institutions are certainly impacted, however, depending on the segment within financials, some may benefit from increased profit margins, while others are weighed down by increased costs. Basic banking is borrowing short and lending out longer, then managing the risk of maturity mismatch. As longer-term rates rise relative to shorter rates, these institutions find their earnings spread increases.

In recent years the trend has been, especially for larger banks, to create loans and then sell them. They profit on the servicing side, or administrative fees to create the loan. In this way they are shielded from interest rate mismatch risk, and they can make more loans on the same deposit base (selling the loans replenished the funds they can loan from). So the benefit of rising rates on benchmark securities relative to the banks deposit rates could have much less positive impact than it might have if they held the loans. What may actually happen within these institutions is that they experience fewer loans as consumers and business borrow take fewer loans, thus earning less fee income.

#3 Investors Lean Toward Bond Investments

The return on anything is the present value, versus future value, over time held. Higher interest rates can make fixed-income investments more attractive than low rates compared to stocks. When interest rates rise, more investors prefer a known return in terms of interest payments than an unknown move in stocks valuations. This shift in investor preferences can lead to reduced demand for equities and potentially impact stock market performance.

Investors buying bonds as rates are rising will experience a decrease in the value of their fixed income securities. So, they may be surprised to learn that they avoided stocks because stocks may go down in value, and instead invested in fixed income which mathematically will go down in value when rates rise.

#4 Borrowing Costs for Companies

As mentioned earlier, rising interest rates increase the borrowing costs for companies. This can impact corporate profitability and investment decisions, which in turn can affect stock prices. Companies that rely heavily on debt financing may experience higher interest expenses, potentially squeezing profit margins. Investors become concerned about the potential impact on corporate earnings and the overall financial health of companies in a higher interest rate environment.

Analyzing a company’s capital structure, and looking for signs of low debt levels, or long-term debt that is locked in at the low interest rates of the early 2020’s, may be a good way to filter companies that have a profit advantage over their competitors

#5 Consumer Spending and Business Investment

Consumer spending levels are a direct driver in consumer stocks. When borrowing becomes more expensive, consumers may reduce their discretionary spending. This can impact businesses that rely on consumer demand, potentially leading to lower revenues and profitability. The stocks that tend to hold up more when spending levels decrease are those that produce necessities.

Business investment during periods of rising interest rates can influence investment decisions for businesses. As borrowing costs increase, companies may reduce or delay capital investments, expansions, or acquisitions. This cautious approach can impact economic growth and overall industry development, which can in turn affect its performance, for much longer than a quarter or two.

Take Away

Stock market investors have legitimate concerns about the impact of higher interest rates on their investments. The potential effects on equity valuations, profitability of interest rate-sensitive sectors, investor preferences for fixed-income investments, borrowing costs for companies, and consumer spending/business investment are key factors that contribute to investor apprehension. It is as important for investors to monitor interest rate trends and understand the impacts as it is for them to monitor.

Paul Hoffman

Managing Editor, Channelchek

The Record Levels of Cash Held by Investors May Not Indicate a Bear Market

Image Credit: Pictures of Money (Flickr)

Investors Receiving a 5% Yield are Losing to Inflation

The CPI inflation report and the Fed’s relentless increases in Fed funds levels have pushed the six-month US Treasury Bill (T-Bill) above 5%. This is the first time since 2007 that this low-risk investment has topped 5%. Last year on this date, the six-month T-Bill was 0.76%. While the stock market is concerned that higher borrowing costs will have the Fed’s intended effect of slowing demand, rates are reaching a point where another concern creeps in. The concern is will traditional stock investors lay back and be satisfied getting paid interest.  

More likely, the high cash position represents “dry powder” waiting for an opportunity.

Short Term Rates

Money Market fund assets were $4.81 trillion for the week ended Wednesday, February 8, according to the Investment Company Institute. Just shy of the record MF balances reported in January. Higher than average cash levels have often been thought of as a bullish sign as it represents potential to drive stock prices up when flows toward equities increase.

This may be part of the situation as we come off a dismal 2022 for equities, but there is likely something else incentivizing the retreat to safety. The higher interest rates are in the short end of the curve, investors are getting paid to retreat. High-yielding cash equivalents with six-month T-Bills now at 5% (10-year Treasuries are only 3.75%) may be more than a parking place. It may represent an alternative investment with a much more assured return.

Ten Year Quarterly Returns S&P 500

Source: Macrotrends

Is 5% an Acceptable Return?

With inflation at 6.4%, the answer is no. But it is definitely preferable to seven of the periods on the 10-year chart above. And with January’s consumer price index (CPI) report revealing signs of sticky to reaccelerating inflation, the Federal Reserve is more likely to be hiking rates for longer than expected.

For investors looking to invest for longer periods, the stock market handily beats inflation. In other words, for the various time frames below, S&P 500 investors did not see their assets erode due to inflation.

Beating inflation is foundational to investing. Far exceeding it is the goal of many. Investors are not doing this choosing cash, in fact they are choosing to lose buying power rather than risk that the market doesn’t perform as it has historically.

S&P 500 Return for Periods 5-Years to 30-Years

Source: Macrotrends

Take Away

Data released on Tuesday February 14 showed the inflation rate (CPI) slowed to 6.4% in January. The cost of goods and services rose 0.5% during the month. The half percentage is the largest one month erosion of purchasing power in three months.

Investors content with 4%-5% returns should consider that they are losing ground to persistent inflation.

Investors with a five-year time horizon or longer should weigh the risks of earning yields below the inflation rate to the ups and downs of stocks. In fact, as more do, the 4-5 trillion in cash can make or quite a bull market.

Paul Hoffman

Managing Editor, Channelchek

Sources

https://home.treasury.gov/resource-center/data-chart-center/interest-rates/TextView?type=daily_treasury_yield_curve&field_tdr_date_value=2022

https://www.bls.gov/news.release/archives/cpi_01162008.pdf

https://www.cnbc.com/2023/01/18/investors-are-holding-near-record-levels-of-cash-and-may-be-poised-to-snap-up-stocks.html

https://www.ici.org/research/stats/mmf

https://www.nerdwallet.com/article/investing/average-stock-market-return#:~:text=The%20average%20stock%20market%20return%20is%20about%2010%25%20per%20year,other%20years%20it%20returns%20less.

When Will Monetary Policy Finally Score?

Image Credit: Pixabay (Pexels)

Why the Fed Needs to Gain Trust, Gain Momentum, and Gain More Yards

Monetary policy and its implementation is as much sport as science. Economics is actually a social science, so it relies on human behavior to mimic past behaviors as its prediction guide. But as in sports, victory is difficult if there is distrust in the coach that’s calling the shots (in this case Powell), or if there are people on your side that have reason to work against you, (an example would be Yellen). Consistency in blocking and tackling (doing the right thing) and not giving up, over time, wins games. Knowing what to expect from the opposing team (consumers) wins a healthy economy.

One repeated trait in monetary policy is that there is a lag between implementation (easing or tightening) and a change in economic conditions. It isn’t a short lag, and the impact varies. Since it could take more than a year for a policy change to begin to impact the economy, the Fed usually moves at a slow and measured pace in order to not overdo it.

The slow pace allows policymakers to observe the impact of their moves and change tactics (positions on the playing field) mid-game.  

Federal-Funds Rate During Tightening Cycles

Note: From December 2008, midpoint of target range. December 2015 hike excluded from 2016-18 cycle

Source: Federal Reserve

Over the past nine months, we have been in a tightening cycle. During this period, the Fed has raised rates by 3.75%. On average (since 1975), when the Fed has tightened rates, they are notched up by 5.00% over 20 months.

The Fed’s current pace is faster than average. This is because inflation took them by surprise, and rose rapidly. Putting up a strong defense against inflation that has been rampant is necessary to not be shut out and allow the Fed to gain control over the outcome.

Because one has to be able to reflect back more than 40 years to have experienced the Fed raising rates this fast. Many have lost confidence in its ability, and are in their own way working against a winning outcome.

Pace of Fed Hiking Cycles

Note: From December 2008, the midpoint of target range

Source: Federal Reserve

The stock and bond markets move in group anticipation of expected policy moves by the Fed. This has been more pronounced in recent years as the Fed has basically shared its expectations after each meeting, setting up for the next. Higher rates make bonds and bank deposits more attractive. Higher rates also weaken the economy and corporate profits, and that induces investors to move away from stocks and even real estate.

Bonds now offer the highest yields since 2007. The stock market may have anticipated what was to come as it peaked in early January of this year, more than two months before the Fed began hiking in March.

Fed Hikes and S&P 500 Bear Markets

Sources: Federal Reserve; Dow Jones Market Data

Sources: Federal Reserve; Dow Jones Market Data

Employment

The Fed is concerned with a wage-price spiral feeding on itself. It likely won’t be  satisfied that its tightening has been sufficient until it can be confident that it has avoided a wage-price storm on the economy.

Ideally, this would happen without unemployment rising. Soft landings took place in 1983-84 and 1994-95. But when inflation starts out too high, as it is now, unemployment usually rises notably, and a recession occurs.

Historically, this doesn’t happen until several years after the first increase. This time it is hoped it will be different, since the Fed is playing more aggressively.

Periods of Fed Hiking and Rising Unemployment

Note: The unemployment rate rose to 3.7% in October, up from the pandemic low of 3.5% a month earlier.
Sources: Federal Reserve; Labor Department

Inflation

Historically, inflation has only fallen to acceptable levels after unemployment has increased, and long after the first rate increase – the exact timing has varied. If the fall in core inflation (which excludes the volatile food and energy components) between September and October continues, and September proves to be the peak, the time between the first Fed increase and the high point of inflation will be one of the shortest of any Fed hiking cycle.

Often, the break in inflation has been accompanied by a recession. The economy receded in each of the first two quarters and then grew in the third. The changes in the inflation component in Gross Domestic Product may have borrowed from one quarter and have been additive to the next. The fourth quarter reading should help level the growth averages out to see if we were indeed in a shallow recession.

Proximity of Peak Inflation and Recessions to Initial Rate Hikes, from Year Hiking Cycle Began

Note: Inflation refers to core CPI.

Sources: Federal Reserve; Labor Department

Take  Away

As in many team sports, once one side gets momentum, they are difficult to stop . The Fed needs to gain the trust of the individual players in the economy in order to be successful. Saying one thing, then doing another, would undermine this trust. So far, despite the Fed originally being wrong about inflation, the Fed has done what it has said it would do. Stock and bond markets, which are a considerable part of the economy, have been slow to understand the Fed’s resolve.

It has been implementing the balance sheet run-off plan and raising rates toward a level it believes would equate to a future 2% inflation rate. Like so many other things in the social sciences, widely held expectations of the future become self-fulfilling.

Paul Hoffman

Managing Editor, Channelchek

Sources

https://www.wsj.com/articles/move-over-inflation-here-comes-the-earnings-crunch-11668300124?mod=article_inline

https://www.wsj.com/articles/fed-raises-interest-rates-for-first-time-since-2018-11647453603?mod=article_inline

https://www.wsj.com/articles/feds-aggressive-rate-hikes-are-a-game-changer-11669006579?mod=economy_lead_pos5

www.BLS.gov

Are U.S. Treasuries Jeopardizing Other Markets?

Image Credit: Pixabay (Pexels)

How Liquid Has the Treasury Market Been in 2022?

The health of the US Treasury market impacts almost all other markets. This is because the “risk-free” market (US Treasuries) and its relationship to the US dollar is the foundation from which other markets stand. If it is in trouble, all markets suffer. The “health” measure most associated with securities like treasuries is liquidity or whether money can be raised when needed. Other measures include market spread between the bid and the ask, trading activity levels, and price impact or how a large transaction impacts the price.

A just released report by New York Fed economists Michael Fleming and Claire Nelson discuss the current state of the U.S. Treasury markets from the unique point of view and access to information of the New York Fed.

The report follows:

How Liquid Has the Treasury Market Been in 2022?

Policymakers and market participants are closely watching liquidity conditions in the U.S. Treasury securities market. Such conditions matter because liquidity is crucial to the many important uses of Treasury securities in financial markets. But just how liquid has the market been and how unusual is the liquidity given the higher-than-usual volatility? In this post, we assess the recent evolution of Treasury market liquidity and its relationship with price volatility and find that while the market has been less liquid in 2022, it has not been unusually illiquid after accounting for the high level of volatility.

Why Liquidity Matters

The U.S. Treasury securities market is the largest and most liquid government securities market in the world. Treasury securities are used to finance the U.S. government, to manage interest rate risk, as a risk-free benchmark for pricing other financial instruments, and by the Federal Reserve in implementing monetary policy. Having a liquid market is important for all these purposes and thus of great interest to market participants and policymakers alike.

Measuring Liquidity

Liquidity typically refers to the cost of quickly converting an asset into cash (or vice versa) and is measured in a variety of ways. We consider three commonly used measures, calculated using high-frequency data from the interdealer market: bid-ask spreads, order book depth, and price impact. The measures are for the most recently auctioned

(on-the-run) two-, five-, and ten-year notes (the three most actively traded Treasury securities, as shown in this post) and are calculated for New York trading hours (defined as 7 a.m. to 5 p.m.). Our data source is BrokerTec, which is estimated to account for 80 percent of trading in the electronic interdealer broker market.

The Market Has Been Relatively Illiquid in 2022

The bid-ask spread—the difference between the lowest ask price and the highest bid price for a security—is one of the most popular liquidity measures. As shown in the chart below, bid-ask spreads have widened out in 2022, but have remained well below the levels observed during the COVID-related disruptions of March 2020 (examined in this post). The widening has been somewhat greater for the two-year note relative to its average and relative to its level in March 2020.

Bid-Ask Spreads Have Widened Modestly

Liberty Street Economics chart plots the five-day moving averages of average daily bid-ask spreads for the two-, five-, and ten-year notes in the interdealer market from January 2, 2019, to October 31, 2022.

Source: Authors’ calculations, based on data from BrokerTec.

Notes: The chart plots five-day moving averages of average daily bid-ask spreads for the on-the-run two-, five-, and ten-year notes in the interdealer market from January 2, 2019, to October 31, 2022. Spreads are measured in 32nds of a point, where a point equals one percent of par.

The next chart plots order book depth, measured as the average quantity of securities available for sale or purchase at the best bid and offer prices. Depth levels again point to relatively poor liquidity in 2022, but with the differences across securities more striking. Depth in the two-year note has been at levels commensurate with those of March 2020, whereas depth in the five-year note has remained somewhat higher—and depth in the ten-year note appreciably higher—than the levels of March 2020.

Order Book Depth Lowest since March 2020

Liberty Street Economics chart plots five-day moving averages of average daily depth for the two-, five-, and ten-year notes in the interdealer market from January 2, 2019, to October 31, 2022.

Source: Authors’ calculations, based on data from BrokerTec.

Notes: The chart plots five-day moving averages of average daily depth for the on-the-run two-, five-, and ten-year notes in the interdealer market from January 2, 2019, to October 31, 2022. Data are for order book depth at the inside tier, averaged across the bid and offer sides. Depth is measured in millions of U.S. dollars par.

Measures of the price impact of trades also suggest a notable deterioration of liquidity. The next chart plots the estimated price impact per $100 million in net order flow (that is, buyer-initiated trading volume less seller-initiated trading volume). A higher price impact suggests reduced liquidity. Price impact has been high this year, and again more notably so for the two-year note relative to the March 2020 episode. That said, price impact looks to have peaked in late June and July, and to have declined most recently (in October).

Price Impact Highest since March 2020

Liberty Street Economics chart plots the estimated price impact per $100 million in net order flow for the two-, five-, and ten-year notes in the interdealer market from January 2, 2019, to October 31, 2022. Source: Authors’ calculations, based on data from BrokerTec.

Notes: The chart plots five-day moving averages of slope coefficients from daily regressions of one-minute price changes on one-minute net order flow (buyer-initiated trading volume less seller-initiated trading volume) for the on-the-run two-, five-, and ten-year notes in the interdealer market from January 2, 2019, to October 31, 2022. Price impact is measured in 32nds of a point per $100 million, where a point equals one percent of par.

Note that we start our analysis of liquidity in this post in 2019 and not earlier. One reason is to highlight the developments in 2022. Another reason is that the minimum price increment for the two-year note was halved in late 2018, creating a break in the note’s bid-ask spread and depth series. Longer time series of bid-ask spreads, order book depth, and price impact are plotted in this post and this paper. The longer history indicates that the price impact in the two-year note is currently at levels comparable to those seen during the 2007-09 global financial crisis, as well as in March 2020.

Volatility Has Also Been High

Pandemic-induced supply disruptions, high inflation, policy uncertainty, and geopolitical conflict have led to a sizable increase in uncertainty about the expected path of interest rates, resulting in high price volatility in 2022, as shown in the next chart. As with liquidity, volatility has been especially high lately for the two-year note relative to its history, likely reflecting the importance of near-term monetary policy uncertainty in explaining the current episode. Volatility has caused market makers to widen their bid-ask spreads and post less depth at any given price (to manage the increased risk of taking on positions), and for the price impact of trades to increase, illustrating the well-known negative relationship between volatility and liquidity.

Price Volatility Highest Since March 2020

Liberty Street Economics chart plots five-day moving averages of price volatility for the two-, five-, and ten-year notes in the interdealer market from January 2, 2019, to October 31, 2022.

Source: Authors’ calculations, based on data from BrokerTec.

Notes: The chart plots five-day moving averages of price volatility for the on-the-run two-, five-, and ten-year notes in the interdealer market from January 2, 2019, to October 31, 2022. Price volatility is calculated for each day by summing squared one-minute returns (log changes in midpoint prices) from 7 a.m. to 5 p.m., annualizing by multiplying by 252, and then taking the square root. It is reported in percent.

Liquidity Has Tracked Volatility

To assess whether liquidity has been unusual given the level of volatility, we provide a scatter plot of price impact against volatility for the five-year note in the chart below. The chart shows that the 2022 observations (in blue) fall in line with the historical relationship. That is, the current level of liquidity is consistent with the current level of volatility, as implied by the historical relationship between these two variables. This is true for the ten-year note as well, whereas for the two-year note the evidence points to somewhat higher-than-expected price impact given the volatility in 2022 (as also occurred in fall 2008 and March 2020).

Liquidity and Volatility in Line with Historical Relationship

Liberty Street Economics chart plots price impact against price volatility by week for the five-year note from January 2, 2005, to October 28, 2022. 

Source: Authors’ calculations, based on data from BrokerTec.

Notes: The chart plots price impact against price volatility by week for the on-the-run five-year note from January 2, 2005, to October 28, 2022. The weekly measures for both series are averages of the daily measures plotted in the preceding two charts. Fall 2008 points are for September 21, 2008 – January 3, 2009, March 2020 points are for March 1, 2020 – March 28, 2020, and 2022 points are for January 2, 2022 – October 29, 2022.

The preceding analysis is based on realized price volatility—that is, on how much prices are actually changing. We repeated the analysis with implied (or expected) price volatility, as measured by the ICE BofAML MOVE Index, and found similar results for 2022. That is, liquidity for the five- and ten-year notes is in line with the historical relationship between liquidity and expected volatility, whereas liquidity is somewhat worse for the two-year note.

Note also that while liquidity may not be especially high relative to volatility, one might then ask whether volatility itself is unusually high. Answering this question is beyond our scope here, although we will note that there are good reasons for volatility to be high, as discussed above.

Trading Volume Has Been High

Despite the high volatility and illiquidity, trading volume has held up this year. High trading volume amid high illiquidity is common in the Treasury market, and was also observed during the market disruptions around the near-failure of Long-Term Capital Management (see this paper), during the 2007-09 financial crisis (see this paper), during the October 15, 2014, flash rally (see this post), and during the COVID-19-related disruptions of March 2020 (see this post). Periods of high uncertainty are associated with high volatility and illiquidity but also high trading demand.

Nothing to Be Concerned About?

Not exactly. While Treasury market liquidity has been in line with volatility, there are still reasons to be cautious. The market’s capacity to smoothly handle large flows has been of ongoing concern since March 2020, as discussed in this paper, as Treasury debt outstanding continues to grow. Moreover, lower-than-usual liquidity implies that a liquidity shock will have larger-than-usual effects on prices and perhaps be more likely to precipitate a negative feedback loop between security sales, volatility, and illiquidity. Close monitoring of Treasury market liquidity—and continued efforts to improve the market’s resilience—remain important.

Citation:

 “How Liquid Has the Treasury Market Been in 2022?,” Federal Reserve Bank of New York Liberty Street Economics, November 15, 2022, https://libertystreeteconomics.newyorkfed.org/2022/11/how-liquid-has-the-treasury-market-been-in-2022/.

Can We Expect a Stock Market Rally After the FOMC Meeting on November 2nd?

Image Credit: AlphaTradeZone (Pexels)

Will the November Fed rate announcement cause a stock market rally?

The next time the Federal Reserve is expected to adjust the target range of the Fed Funds overnight lending rate is Wednesday, November 2nd. Few have doubt at this point that this will again be a 0.75% increase. That level is already baked into equities. Stock market strength and direction shouldn’t veer much from the rate move but could dramatically turn as a result of the Fed’s forward guidance. If Chairman Powell & Co. suggests a slower benchmark lending rate increase, it would be a very welcome sign for investors.

Focus on the Post Meeting Announcement

There are already signs the Fed may slow the pace of Fed Funds increases. There are also indications it may alter its quantitative tightening (QT) in a way that could quicken a yield curve steepening. In other words, the speed of QT may increase. To date, the real rate of return on bonds, of most all maturities, is viewed as unnatural as they are below zero (Yield – Inflation = Real Rate). While an increase in QT may do more to raise rates and reduce the money supply, the effect is stealthier; it doesn’t provide a panicky headline for investors to react to abruptly. 

Some Fed governors have already shown signs that they believe the best course from here is to slow the ratcheting up of the funds level and perhaps even stop raising Fed Funds rates early next year. A hiatus would allow them time to see if the moves have had an impact and give members a chance to see if further moves are prudent. The Fed always runs the risk of overreacting and going too far when tightening; this “oversteering” by previous Feds has occurred a high percentage of the time as they contend with a lag between monetary policy shifts and economic reaction.  

Where We Are, Where We’re Going

In the most aggressive pace since early 1980, so far in 2022, the Fed raised its benchmark federal-funds rate by 0.75 points at each of its past three meetings. The most recent move was in late September. This left the overnight interest rate at a range between 3% and 3.25%.

The stock market wants the Fed to slow down. It rallied in July and August on expectations that the Fed might slow the pace of increase. Slowing, at least at the time, would have conflicted with the central bank’s inflation target because easy financial conditions stimulate spending, economic growth, and related inflation pressures. This rally in stocks may have prompted Powell to redraft a very public speech to economists in late August. He spoke about nothing else for eight minutes at Jackson Hole except for his resolve to win the fight against higher prices.

But sentiment related to how forceful the FOMC now needs to be may be shifting. Fed Vice Chairwoman Lael Brainard, joined by other officials, have recently hinted they are uneasy with raising rates by 0.75 points beyond next month’s meeting. In a speech on Oct. 10th, Brainard laid out a case for pausing rate rises, noting how they impact the economy over time.

Others that are concerned about the danger of raising rates too high include Chicago Fed President Charles Evans. Evans told reporters on Oct. 10th that he was worried about assumptions that the Fed could just cut rates if it decided they were too high. He felt a need to share his thought that promptly lowering rates is always easier in theory than in practice. The Chicago Fed President said he would prefer to find a rate level that restricted economic growth enough to lower inflation and hold it there even if the Fed faced “a few not-so-great reports” on inflation. “I worry that if the way you judge it is, ‘Oh, another bad inflation report—it must be that we need more [rate hikes],’… that puts us at somewhat greater risk of responding overly aggressive,” Evans said.

Kansas City Fed President Esther George also had something to say on this topic last week. She said she favored moving “steadier and slower” on rate increases. “A series of very super-sized rate increases might cause you to oversteer and not be able to see those turning points,” according to the Kansas City Fed President.

Others like Fed governor Waller don’t view steady 0.75% increases as a done deal but instead something to be reviewed, “We will have a very thoughtful discussion about the pace of tightening at our next meeting,” Waller said in a speech earlier this month.

The caution surrounding oversteering isn’t unanimous; at least one Fed official wants to see proof that inflation is falling before easing up on the economic brake pedal. “Given our frankly disappointing lack of progress on curtailing inflation, I expect we will be well above 4% by the end of the year,” said Philadelphia Fed President Patrick Harker.

The ultimate result is likely to come down to what Mr. Powell decides as he seeks to fashion a consensus. In the past, votes, while not always unanimous, tend to defer to the Chairperson at the time.

Take-Away

If, after the next FOMC meeting, the Fed is entertaining a lower 0.50% rate rise in December (not 0.75%), they will prepare the markets (bond, stock, and foreign exchange) for the decision in the moments and weeks following their Nov. 1-2 meeting. If this occurs, it could cause stocks to perform well just before election day and perhaps make up some lost ground in the year’s final two months.  

Paul Hoffman

Managing Editor, Channelchek

Sources

https://www.federalreserve.gov/newsevents/speech/waller20221006a.htm

https://www.wsj.com/articles/fed-set-to-raise-rates-by-0-75-point-and-debate-size-of-future-hikes-11666356757?mod=hp_lead_pos1

https://www.federalreserve.gov/aboutthefed/federal-reserve-system-philadelphia.htm