“We are excited to present CC-42344’s promising safety, tolerability and preclinical data, including robust antiviral activity in an influenza-infected human respiratory epithelium model,” said Dr. Lee. “Our Phase 1 data continue to show this molecule’s potential as an oral therapeutic for the treatment of pandemic and seasonal influenza. Given that CC-42344 has shown sub-nanomolar potency and a novel mechanism of action with high barrier to resistance, we believe it could be used as monotherapy or in combination with other influenza antivirals. We look forward to initiating a Phase 2a influenza A human challenge study in the second half of 2023.”
The slide deck accompanying Dr. Lee’s discussion “First-in-Human Study of CC-42344, a Novel Broad-Spectrum Influenza A Polymerase PB2 Inhibitor” has been posted to the Presentations section of the company website.
About CC-42344 CC-42344 is a novel PB2 inhibitor discovered using Cocrystal’s proprietary structure-based drug discovery platform technology. CC-42344 targets the influenza polymerase complex, an essential enzyme required for the viral replication. In vitro testing showed CC-42344’s potent antiviral activity against influenza A strains, including pandemic and seasonal strains, as well as against strains resistant to osteltamivir (Tamiflu®) and baloxavir marboxil (Xofluza®).
About ISIRV The International Society for Influenza and other Respiratory Virus Diseases (ISIRV) is an independent and international scientific professional society promoting the prevention, detection, treatment and control of influenza and other respiratory virus diseases. ISIRV was founded in 2005 as the first scientific society with a fully worldwide remit focused on influenza and respiratory virus disease. As a global scientific society, ISIRV fulfils this mission through promoting the exchange and dissemination of information, facilitating the interaction of scientists and of public health specialists and the promotion of international collaborative efforts against these diseases. More information is available here.
About Cocrystal Pharma, Inc. Cocrystal Pharma, Inc. is a clinical-stage biotechnology company discovering and developing novel antiviral therapeutics that target the replication process of influenza viruses, coronaviruses (including SARS-CoV-2), hepatitis C viruses and noroviruses. Cocrystal employs unique structure-based technologies and Nobel Prize-winning expertise to create first- and best-in-class antiviral drugs. For further information about Cocrystal, please visit www.cocrystalpharma.com.
This press release contains forward-looking statements within the meaning of the Private Securities Litigation Reform Act of 1995, including statements regarding the Company’s influenza A product candidate CC-42344’s potential as an oral therapeutic for the treatment of pandemic and seasonal influenza, including either as monotherapy or in combination with other influenza antivirals, and the anticipated initiation of a Phase 2a influenza A human challenge study in the second half of 2023. The words “believe,” “may,” “estimate,” “continue,” “anticipate,” “intend,” “should,” “plan,” “could,” “target,” “potential,” “is likely,” “will,” “expect” and similar expressions, as they relate to us, are intended to identify forward-looking statements. We have based these forward-looking statements largely on our current expectations and projections about future events. Some or all of the events anticipated by these forward-looking statements may not occur. Important factors that could cause actual results to differ from those in the forward-looking statements include, but are not limited to, the risks and uncertainties arising from inflation, interest rate increases, the current banking crisis and the Ukraine war on our Company, our collaboration partners, and on the U.S. and U.K. and global economies, including manufacturing and research delays arising from raw materials and labor shortages, supply chain disruptions and other business interruptions including any adverse impacts on our ability to obtain raw materials and test animals as well as similar problems with our vendors and our current Contract Research Organization (CRO) and any future CROs and Contract Manufacturing Organizations, the results of the studies for CC-42344, the ability of our CROs to recruit volunteers for, and to proceed with, clinical studies, our and our collaboration partners’ technology and software performing as expected, financial difficulties experienced by certain partners, the results of future preclinical and clinical trials, general risks arising from clinical trials, receipt of regulatory approvals, regulatory changes, development of effective treatments and/or vaccines by competitors, including as part of the programs financed by the U.S. government. Further information on our risk factors is contained in our filings with the SEC, including our Annual Report on Form 10-K for the year ended December 31, 2022. Any forward-looking statement made by us herein speaks only as of the date on which it is made. Factors or events that could cause our actual results to differ may emerge from time to time, and it is not possible for us to predict all of them. We undertake no obligation to publicly update any forward-looking statement, whether as a result of new information, future developments or otherwise, except as may be required by law.
Cumulus Media (NASDAQ: CMLS) is an audio-first media company delivering premium content to over a quarter billion people every month — wherever and whenever they want it. Cumulus Media engages listeners with high-quality local programming through 406 owned-and-operated radio stations across 86 markets; delivers nationally-syndicated sports, news, talk, and entertainment programming from iconic brands including the NFL, the NCAA, the Masters, CNN, the AP, the Academy of Country Music Awards, and many other world-class partners across more than 9,500 affiliated stations through Westwood One, the largest audio network in America; and inspires listeners through the Cumulus Podcast Network, its rapidly growing network of original podcasts that are smart, entertaining and thought-provoking. Cumulus Media provides advertisers with personal connections, local impact and national reach through broadcast and on-demand digital, mobile, social, and voice-activated platforms, as well as integrated digital marketing services, powerful influencers, full-service audio solutions, industry-leading research and insights, and live event experiences. Cumulus Media is the only audio media company to provide marketers with local and national advertising performance guarantees. For more information visit www.cumulusmedia.com.
Michael Kupinski, Director of Research, Equity Research Analyst, Digital, Media & Technology , Noble Capital Markets, Inc.
Patrick McCann, Research Associate, Noble Capital Markets, Inc.
Refer to the full report for the price target, fundamental analysis, and rating.
Meets Q1 expectations. The company reported Q1 revenue of $205.7 million, in line with our previously lowered estimate of $206.4 million. National advertising revenues remained weak in the quarter, largely attributed to persistent macro economic headwinds. Adj. EBITDA of $10.3 million beat our estimate, which we believe was the lowest on the Street, a result of the company’s cost cutting initiatives and healthy growth of digital revenues.
Weak Q2 pacings. Q2 revenues are expected to be impacted by weakening Local advertising, down 4% in Q1 and pacing down 7% in Q2, in addition to double digit declines in National. A bright spot is digital marketing services (DMS), pacing up double digits in Q2. Total company revenue pacings are down low double digits for Q2.
Equity Research is available at no cost to Registered users of Channelchek. Not a Member? Click ‘Join’ to join the Channelchek Community. There is no cost to register, and we never collect credit card information.
This Research is provided by Noble Capital Markets, Inc., a FINRA and S.E.C. registered broker-dealer (B/D).
*Analyst certification and important disclosures included in the full report. NOTE: investment decisions should not be based upon the content of this research summary. Proper due diligence is required before making any investment decision.
Developing a Deeper Understanding of Hedge Fund Investments
Hedge funds have become a buzzword in the world of investing, it’s one of those investment instruments that people think they can explain until they’re asked to – not everyone understands what they are or how they work. In simple terms, a hedge fund is a private investment vehicle that is managed by a professional investment manager or team. The primary goal of the fund is to generate above market returns for its investors by using various investment strategies that are often more complex and riskier than traditional investment vehicles like managed mutual funds or index funds. The following should help fill many of the gaps in investors understanding of these funds, including their legal structure, investment strategies, and how they differ from other types of investment vehicles.
Structure of a Hedge Fund
Hedge funds are formed as limited partnerships. This makes investors in the fund limited partners. The investment manager is the general partner of the fund and is responsible for making investment decisions on behalf of the limited partners. The general partner is also responsible for raising capital for the fund, safekeeping, and negotiating fees with investors.
Hedge funds are typically only available to accredited investors, which requires that they meet SEC wealth, income, or financial sophistication thresholds. This is because hedge funds are considered to be high-risk investments and are not subject to the same regulations as other types of investment vehicles. Accredited investors are assumed to have the financial sophistication and resources to handle the risks associated with hedge fund investments.
Investment Strategies
Hedge funds use a wide variety of investment strategies to generate returns for their investors. These strategies can range from relatively simple, such as long/short equity, to highly complex, such as quantitative trading or event-driven investing. Some of the most common investment strategies used by hedge funds include:
Long/Short Equity – This strategy involves buying stocks that are expected to increase in value (long) and shorting stocks that are expected to decrease in value (short).
Event-Driven – This strategy involves investing in stocks that are likely to be impacted by specific events, such as mergers, acquisitions, or bankruptcies.
Quantitative Trading – This strategy involves using mathematical models to identify trading opportunities based on patterns in historical data.
Distressed Investing – This strategy involves investing in companies that are in financial distress or undergoing restructuring.
Global Macro – This strategy involves investing in currencies, commodities, and other assets based on macroeconomic trends.
Valuing a Stock
One of the key skills required to be a successful hedge fund manager is the ability to value a stock or other opportunity. This involves analyzing a company’s financial statements, industry trends, and other relevant factors to determine the intrinsic value of the company’s worth. If the stock is undervalued, the hedge fund may decide to invest in it in the hopes that its value will increase over time. Conversely, if the stock is overvalued, the hedge fund may decide to create a short position in it in the hopes that its value will decrease.
Compared to Other Investment Vehicles
Hedge funds differ from other types of investment vehicles in several ways. First, hedge funds are not subject to the same regulations as other types of investment vehicles, which means that they have more flexibility to use complex investment strategies and take on higher levels of risk. Second, as mentioned above, hedge funds are typically only available to accredited investors, whereas more traditional types of investments like mutual funds or index funds are available to the general public. Finally, hedge funds typically charge higher fees than other types of investment vehicles, which can include both management fees and performance fees.
Take Away
Hedge funds are complex investment vehicles that can use a variety of riskier methods in an attempt to generate high returns for their investors by using a wide variety of investment strategies. These strategies can range from relatively simple to highly complex and are often more risky than other types of investments. Hedge funds are structured as limited partnerships and are typically only available to accredited investors. They differ from other types of investment vehicles in their lack of regulatory oversight, and known to charge higher fees.
A Focus on Profitability Drives A Strong Start to the Year
Last quarter we wrote that the S&P 500 increased for the first time since the fourth quarter of 2021 and that we were beginning to see signs of life in Noble’s Internet and Digital Media Indices as well. Those signs of life continued to bear fruit throughout the first quarter, as every one of Noble’s Internet and Digital Media Indices not only finished the quarter up, but significantly outperformed the S&P 500. The best performing index was Noble’s Social Media Index, which increased by 70% in the first quarter of 2023, followed by Noble’s eSports & iGaming Index (+32%), Ad Tech Index (+31%), MarTech Index (+30%), and Digital Media Index (+18%).
Noble’s Indices are market cap weighted, and we attribute the strength of the Social Media Index to its largest constituent, Meta Platforms (META; a.k.a. Facebook) whose shares increased by 76% in the first quarter. We attribute this increase to management’s 4Q 2022 earnings call when they spent most of their time talking about “efficiency”, which investors interpreted to mean that Meta was newly focused on profitability. After a relatively disastrous 3Q 2022 earnings call, after which shares fell by 25%, the company demonstrated on its 4Q 2022 earnings call that it clearly had
gotten the message: investors were not enamored about the company’s plans in October 2022 to spend billions of dollars to develop its Metaverse initiatives. Rather, on its fourth quarter call, management focused on driving its short form video initiative Reels (i.e., becoming more TikTok like), reducing its headcount by reducing layers of management, lowering its operating expenses and reducing its capital expenditures. Investors applauded this newfound focus on profitability and shares rebounded from a low of $88.90 per share in early November to $211.94 at the March quarter-end.
Noble’s eSports and iGaming Index increased by 32% as 9 of the 16 stocks in the index posted gains, the two largest market cap weighted stocks. Shares of the largest stock in the index, Flutter Entertainment (FLTR) increased by 31%) while shares of the second largest stock in the index, DraftKings (DKNG) increased by 70%. Flutter’s improvement is likely due to an improved inflection point in the company’s U.S. operations which include its FanDuel operations. DraftKings also beat revenue and EBITDA expectations in 4Q 2022 and appears to be proving out its path to profitability. In both cases, investors are rewarding companies who are accelerating their path to profitability.
The next best performing index was Noble’s Ad Tech Index which increased by 31% during 1Q 2023. Fourteen of the 23 stocks in the index were up in the first quarter. Standouts during the quarter were Integral Ad Science (IAS; +62%) and Perion Networks (PERI; +56%). Integral Ad Science exceeded expectations in its fourth quarter results and guided to better-than-expected results in 1Q 2023. The company continues to expand its product suite, scale its social media offerings (i.e., for TikTok) and is well positioned to continue to benefit from the shift from linear TV to connected TV (CTV). Perion shares continued their winning streak: Perion was the only ad tech stock whose shares were up in 2022. Perion’s 56% increase in 1Q 2023 reflected beat on both revenues (by 2%) and EBITDA (by 10%) as well as improved guidance for 1Q 2023. Perion’s profitability increased significantly in 2022, with EBITDA nearly doubling (+90%) from $70 million in 2021 to $132 million in 2022.
Noble’s MarTech Index increased by 30% with 14 of the 22 stocks in the index posting increases in 1Q 2023. The best performing stocks were Qualtrics (XM; +70%) Sprinklr (CXM; +59%), Salesforce (CRM; +51%), Hubspot (HUBS; +48%) and Yext (YEXT; +47%). Qualtrics agreed to be acquired for $12.5 billion by Silver Lake and the Canadian Pension Plan Investment Board, which came at a 73% premium to its 30-day volume weighted stock price. Sprinklr beat revenue expectations and significantly beat EBITDA expectations (doubling the Street expectations) and guided to a current year forecast that focuses more on efficiency and profitability. MarTech stocks have been victims of their own success. Two years ago at this time the sector was trading at 11.3x forward revenue estimates, and a year ago the group was trading at 6.5x forward revenues. Today the group trades at 4.1x forward revenues and investors appear to be wading back into the sector.
Finally, Noble’s Digital Media Index, while lagging that of its digital peers posted an 18% increase and significantly outperformed the S&P 500 (+7%) with a broad based recovery in which 9 of the sector’s 11 stocks increase during 1Q 2023. The best performing stock was Spotify (SPOT; +69%), whose revenues fell short of expectations by less than 1%, significantly beat consensus Street EBITDA expectations by $58M and more importantly pivoted towards demonstrating operating leverage. Spotify, which posted an EBITDA loss of nearly $500 million 2022 is expected to generate $650 million in EBITDA in 2024, according Street estimates. A deteriorating ad market 2022 combined with higher interest rates likely prompted the company to shift its priorities to running a profitable company and doing it more quickly. The second best performing stock was Travelzoo (TZOO; +36%), as the company’s 4Q 2022 revenues and EBITDA increased by 31% and 328%, respectively. Notably, Travelzoo’s EBITDA came in 58% higher than Street consensus. The company appears to be benefiting from pent up demand for travel and management highlighted the opportunity for margin expansion in the coming quarters.
Sluggish M&A Market Carries Over into 2023
Last quarter we remarked that M&A deals in the Internet and Digital Media sector had held up well through the first three quarters of 2022 despite economic headwinds. However, the number of deals slowed in 4Q 2022 (by 17%) and total deal value fell dramatically (by 70%). The slowdown carried over into 1Q 2023. According to Dealogic, Global M&A fell by 48% to $575 billion in 1Q 2023 compared to $1.1 trillion in 1Q 2022. Global M&A dollar values fell to their lowest level in a decade. In the U.S., deal values fell by 44% to $283 billion from $176 billion in 1Q 2022.
The M&A market had weathered stock price declines, Fed rate hikes, elevated inflation, and geopolitical conflict in 2022. In 1Q 2023, to this “recession that never comes” economic environment we added increased volatility and uncertainty caused by banking failures. One of the biggest impediments to deals is debt financing. Private equity firms have had to write larger check in lieu of a robust debt financing market. Banks have been less willing to provide financing because some have had to hold loans on their balance sheet or take losses when selling debt to investors while smaller regional banks have seen deposits flee to larger banks, especially those considered too big to fail.
Finally, increased antitrust scrutiny likely has played a role in the M&A deal slowdown. Lengthy merger reviews resulted in three public transactions being blocked by regulators: Standard General’s acquisition of Tegna; JetBlue’s acquisition of Spirit Airlines, and Intercontinental Exchange’s acquisition of Black Knight, Inc.
1Q 2023 Internet and Digital Media M&A: A Dearth of Large Deals
Based on Noble’s analysis, deal making in the first quarter of 2023 in the Internet and Digital Media sectors actually increased by 11% compared to 1Q 2022. The total number of deals we tracked in the Internet and Digital Media space increased to 202 deals in 1Q 2023 compared to 182 deals in 1Q 2022. On a sequential basis, the total number of deals increased by 39% compared to 145 deals in 4Q 2022. The only explanation we can provide for this is that with the expectation that an economic slowdown was pending, many companies likely made the decision to sell in mid-2022, with the deals being announced in 1Q 2023.
The biggest change was in the first quarter’s M&A deal value, where the total dollar value of deals fell by 95% to $5.4 billion of announced deals in 1Q 2023 compared to $108.5 billion in announced deals in 1Q 2022. On a sequential basis, deal value fell by 40% from $9.1 billion in deal value in 4Q 2022.
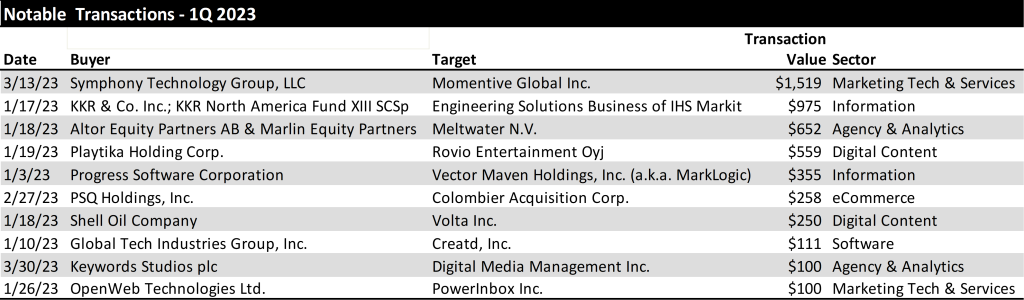
From a deal volume perspective, the most active sectors we tracked were Digital Content (59 deals), Agency & Analytics (51 deals), and MarTech (39), followed by Information Services (17 deals), Ad Tech (11 deals) and eCommerce sectors (10 deals). From a dollar value perspective, MarTech led the way with $1.6 billion in transactions, followed by Information Services ($1.4 billion), Digital Content ($922 million) and Agency and Analytics ($875 million). The largest deals in the quarter by dollar value are shown below.
Notably, there were no mega deals ($10B+) in the first quarter of 2023, compared to the first quarter of 2022 when Microsoft agreed to by Activision Blizzard for $68 billion and Take-Two Interactive agreed to acquire Zynga for $12 billion. Once the Fed stops hiking rates and visibility into operating trends returns, we may begin to see an environment in which mega deals will be contemplated again.
TRADITIONAL MEDIA COMMENTARY
The following is an excerpt from a recent note by Noble’s Media Equity Research Analyst Michael Kupinski
The NAB Show Stopper
Media investors are unpacking all of information from last week’s National Association of Broadcasters (NAB) convention. There is a lot to digest given that there were over 1,400 exhibits, and 140 new exhibitors this year. Because of the overwhelming number of exhibitors, many that go to Vegas for this annual convention do not go to the convention floor. It is a shame. There is a lot to see and learn. Noble’s Media & Entertainment Analyst Michael Kupinski walked the convention floor, which covers 4.6 million square feet of exhibit halls and meeting rooms. He stopped by booths and taped presentations to explain the new technologies, the plan for implementation of new services, and the prospect for revenue monetization. One important demonstration focused on the new broadcast standard, ATSC 3.0, the hope for a bright future for the television industry. This new standard should allow the industry to become more contemporary in terms of how its audience consumes video and information. In addition, it offers the ability for the industry to participate in new revenue streams, including datacasting, which may become bigger than Retransmission revenue in the future.
In addition to touring the floor, he participated in NAB panel discussions and hosted meetings with media management teams in a fireside chat format to discuss current business trends, the new technologies (including Artificial Intelligence (AI)) and the new broadcast standard. In addition, these C-suite management teams provided their key takeaways from the NAB convention and offered why they participated in the conference this year. These discussions will be available for free to Channelchek users on Channelchek.com on April 27th as a virtual conference. In this upcoming Channelchek Takeaway Series on the NAB Show, Michael offers his key takeaways, including the current advertising outlook, his take on the monetization of the new technologies and what media investors should do now given the current economic and advertising environment. Free registration to this informative event is available here.
This report highlights the performance of the media sectors over the past 12 months and past quarter. Overall, media stocks struggled in the past year, but there has been some improved quarterly performance, particularly in Digital Media and Broadcast Television, discussed later. All media stocks are struggling to offset losses over the course of the past year with trailing 12 months stocks down in the range of 5% on the low end to as high as down 68%.
In the first quarter, stock performance was mixed. The best performers in the traditional media sectors were Broadcast Television stocks, up nearly 10% versus the general market which increased 7% in the comparable period. However, the individual TV stock performance reflected a different story, explained later in this report. The worse performer for the quarter were the radio stocks, driven by a Wall Street downgrade of one of the leading radio broadcasters. We believe that stock performance will be a roller coaster for at least another quarter or two as the weight of the Fed rate increases begin to adversely affect the economy.
While national advertising has remained weak, we believe that local advertising is now beginning to moderate as well. The local advertising weakness appears to be in the smaller markets as well as the larger markets. This is somewhat different than the most recent economic cycles whereby the smaller markets were somewhat resilient. It seems that the smaller markets are feeling the adverse affects from inflation, rising employment costs and tightening bank credit. In our view, the disappointing advertising outlook likely will cause second quarter revenue estimates to come down, creating a difficult environment for media stocks.
Broadcast Television
Weak Current Revenue Trends
TV stocks outperformed the general market in the first quarter. This market cap weighted index masked the performance of many poor performing stocks in the quarter. Sinclair Broadcasting (up 10%), Entravision (up a strong 26%), and Fox (up 12%) were the best performing stocks and favorably influenced the TV index in the quarter. But, there were many poor performing stocks including E.W. Scripps (down 29%), Gray Television (down 22%) and Tegna (down 20%). We believe that there was heightened interest in Entravision given its favorable Q1 results which was fueled by its fast growing digital advertising business. Entravision’s Q4 revenue performance was among the best in the industry. While Entravision was among the best revenue performer, its margins are below that of its peer group EBITDA Margins. This is due to the accounting treatment of its digital revenues given that it is an agency business.. The poorer performing stocks are among the higher debt levered in the industry. The underperformance reflects concern of a slowing economy and investors flight to quality in the sector.
We do not believe that we are out of the woods with the TV stocks and the market is expected to be volatile. The advertising environment appears to be deteriorating given weakening economic conditions. There are bright spots which include some improvement in the Auto category. Dealerships appear to be stepping up advertising given higher inventory levels. In addition, broadcasters appear optimistic about political advertising, which could begin in the third quarter 2023. There is a planned Republican presidential candidate debate schedule in August. There is some promise that candidates will advertise in advance of that debate and into the fourth quarter given the early primary season. We do not believe that political and auto will be enough to offset the weakness in national and Local advertising. In our view, Q2 and full year 2023 estimates are likely to come down. Furthermore, we believe that broadcasters will be shy about predicting political advertising even into 2024 given the past disappointments in management forecasts in the last political cycle.
Broadcast Radio
All Out of Love
Radio stocks had another tough quarter, down 17% versus a 7% gain for the general market. Notably, there was a wide variance in the individual stock performance, with the largest stocks in the group having the worst performance in the quarter, including Audacy (AUD down 40%), Cumulus Media (CMLS down 41%) and iHeart Media (IHRT down 36%). The first quarter stock performance did not appear to reflect the fourth quarter results, during which revenues were relatively okay, with some exceptions. Some of the larger radio companies which have a large percentage of national advertising, underperformed relative to the more diversified radio companies, especially those with a strong digital segment presence. Margins for the industry remain relatively healthy.
The weakness in the Radio stocks was fueled in the quarter from a downgrade to Underperform on the shares of iHeart by a Wall Street firm. Many radio stocks were down in sympathy. The analyst attributed the downgrade to the current macro environment and its heavy floating rate debt burden. The company is not expected to generate enough free cash flow to de-lever its balance sheet. We believe the downgrade as well as the excessive debt profile of Audacy, another industry leader which likely will need to restructure, sent all radio stocks tumbling. Some stocks performed better than others. While Cumulus Media’s debt profile is not as levered as iHeart or Audacy, the shares were caught in the net of a weak advertising outlook. Cumulus is among the most sensitive to national advertising, which currently continues to be weak.
Some of our favorite stocks which are diversified and have developing digital businesses performed better. Those stocks included Townsquare Media (TSQ, up 10%), and Salem Media (SALM, up 4%). Notably, while the shares of Beasley Broadcasting (BBGI) were down 10%, the shares performed better than the 17% decline for the industry in the quarter. Importantly, Beasley recently provided favorable updated Q1 guidance for the first quarter. Q1 revenues are expected to increase 1% to 2.5% and EBITDA growth is expected to be in the range of 40% to 50%, significantly better than our estimates. Furthermore, management provided a sanguine outlook for 2023 and 2024. Digital revenue is expected to reach 20% to 30% of total revenue with a goal of reaching 40% in 2024. By comparison, digital revenue was 17% of total revenue in the fourth quarter 2022. Furthermore, the company is sitting on roughly $35 million in cash. It has opportunistically repurchased $10 million of its bonds at a significant discount. We believe that it is likely to maintain a strong cash position given the economic uncertainty.
Townsquare Media (TSQ), Salem Media (SALM) and Beasley Broadcast (BBGI) are all diversifying their revenue streams. While these companies are not immune to the economic headwinds, we believe theirdigital businesses should offer some ballast to its more sensitive Radio business. In the case of Salem, 30% of its revenues are relatively stable with block programming.
Publishing
After a period of moderating revenue trends, publishers reported a weakened advertising environment. Revenue trends deteriorated with print advertising taking a nose dive. This trend was illustrative in the results from Lee Enterprises. After a fiscal fourth quarter flat revenue performance, the company reported a 8.5% decline in its fiscal first quarter. The Q1 revenue performance reflected an 18.5% decrease in print advertising, an acceleration in the rate of the 11% decline in the previous quarter.
The surprisingly weak quarter hit the company’s adj. EBITDA margins. Traditionally, Lee maintained some of the best margins in the industry., but the company fell in ranking to among the lowest in the sector. Importantly, in spite of the revenue weakness, the company maintained its previous adj. EBITDA guidance of $94 million to $100 million for F2023. To achieve its cash flow target in light of the soft revenue outlook, Lee implemented a round of expense cuts to bolster cash flow. Cost reductions are expected to result in $40 million of savings in FY 23, and $60 million in annualized savings going forward. While the company’s print business declined more than expected , the company’s digital businesses remains favorably robust. In addition, its digital business is turning toward contributing margins; another step in the company’s digital evolution.
This newsletter was prepared and provided by Noble Capital Markets, Inc. For any questions and/or requests regarding this news letter, please contact Chris Ensley
DISCLAIMER
All statements or opinions contained herein that include the words “ we”,“ or “ are solely the responsibility of NOBLE Capital Markets, Inc and do not necessarily reflect statements or opinions expressed by any person or party affiliated with companies mentioned in this report Any opinions expressed herein are subject to change without notice All information provided herein is based on public and non public information believed to be accurate and reliable, but is not necessarily complete and cannot be guaranteed No judgment is hereby expressed or should be implied as to the suitability of any security described herein for any specific investor or any specific investment portfolio The decision to undertake any investment regarding the security mentioned herein should be made by each reader of this publication based on their own appraisal of the implications and risks of such decision This publication is intended for information purposes only and shall not constitute an offer to buy/ sell or the solicitation of an offer to buy/sell any security mentioned in this report, nor shall there be any sale of the security herein in any state or domicile in which said offer, solicitation or sale would be unlawful prior to registration or qualification under the securities laws of any such state or domicile This publication and all information, comments, statements or opinions contained or expressed herein are applicable only as of the date of this publication and subject to change without prior notice Past performance is not indicative of future results.
Please refer to the above PDF for a complete list of disclaimers pertaining to this newsletter
Classic Burger Chain Broadens International Presence with Newest BengaluruLocation
LOS ANGELES, April 18, 2023 (GLOBE NEWSWIRE) — FAT (Fresh. Authentic. Tasty.) Brands Inc., parent company of Johnny Rockets and 16 other restaurant concepts, announces a new location in India at the Kempegowda International Airport in partnership with HMSHost. Located in Bengaluru, the capital city of Karnataka, the new Johnny Rockets serves the classic fare that put the brand on the map over 35 years ago, including juicy, made-to-order burgers and hand-spun shakes.
“Expanding Johnny Rockets’ presence in non-traditional venues continues to be a key growth objective for the brand,” said Jake Berchtold, COO of FAT Brands’ Fast Casual Division. “Strategically, we are pleased to spearhead this type of expansion in a country like India, where we see significant opportunity to build our footprint.”
“We are seeing exciting times in the air travel industry as the demand remains strong in both the domestic and international travel spaces,” said Jagvir Singh Rana, Managing Director, India and Middle East, HMSHost. “With increased travel and the opening of T2 at Bengaluru International Airport, guest expectations are sure to increase. By partnering with Johnny Rockets, we aim to not only give our guests varied food choices but also an experience they will cherish forever.”
The first Johnny Rockets restaurant opened June 6, 1986, on Melrose Avenue in Los Angeles. Since that time, the chain’s timeless all-American brand has connected with customers across the U.S. and in 25 other countries around the globe.
The Johnny Rockets team’s passion for delivering fresh, classic American fare is only equaled by their commitment to providing a superb guest experience. The new location’s menu includes cooked-to-order burgers, indulgent, hand-spun real ice cream shakes, crispy fries, halal chicken options and more.
The new Bengaluru Johnny Rockets is located at Kempegowda International Airport, Terminal 2, Devanhalli, Bengaluru, and is open from 2 a.m. to 12 a.m. daily.
FAT Brands (NASDAQ: FAT) is a leading global franchising company that strategically acquires, markets and develops fast casual, quick-service, casual and polished casual dining restaurant concepts around the world. The Company currently owns 17 restaurant brands: Round Table Pizza, Fatburger, Marble Slab Creamery, Johnny Rockets, Fazoli’s, Twin Peaks, Great American Cookies, Hot Dog on a Stick, Buffalo’s Cafe & Express, Hurricane Grill & Wings, Pretzelmaker, Elevation Burger, Native Grill & Wings, Yalla Mediterranean and Ponderosa and Bonanza Steakhouses, and franchises and owns over 2,300 units worldwide. For more information on FAT Brands, please visit www.fatbrands.com.
About Johnny Rockets Founded in 1986 on Melrose Avenue in Los Angeles, Johnny Rockets is a world-renowned international franchise that offers high-quality, innovative menu items including Certified Angus Beef® cooked-to-order hamburgers, veggie burgers, chicken sandwiches, crispy fries, and rich, delicious hand-spun shakes and malts. With over 325 locations in over 25 countries around the globe, this dynamic lifestyle brand offers friendly service and upbeat music contributing to the chain’s signature atmosphere of relaxed, casual fun.
Research Directed by Faculty of the Center for Transplantation Sciences, Massachusetts General Hospital
CHATHAM, N.J., April 17, 2023 (GLOBE NEWSWIRE) — Tonix Pharmaceuticals Holding Corp. (Nasdaq: TNXP), a clinical-stage biopharmaceutical company, today announced the on-line publication of two papers1,2 in the American Journal of Transplantation by faculty at the Center for Transplantation Sciences, Massachusetts General Hospital (MGH) in collaboration with Tonix Pharmaceuticals. The data involve studies of Tonix’s TNX-1500 (Fc-modified anti-CD40L humanized monoclonal antibody [mAb]) product candidate in development for the prevention of organ transplant rejection. The molecular target of TNX-1500 is CD40-ligand (CD40L), which is also known as CD154, T-BAM or 5c8 antigen. The publications include data demonstrating that TNX-1500 showed activity in preventing organ rejection and was well tolerated in non-human primates. Blockade of CD40L with TNX-1500 monotherapy consistently and safely prevented pathologic alloimmunity in non-human primate models of cardiac and kidney allograft model without clinical thrombosis.
“There remains a significant need for new treatments with improved activity and tolerability to prevent organ transplant rejection,” said Seth Lederman, M.D., Chief Executive Officer of Tonix Pharmaceuticals. “To date, there has not been a humanized anti-CD40L antibody that can effectively prevent transplant rejections with an acceptable level of tolerability. TNX-1500 is a third generation anti-CD40L mAb that has been designed by protein engineering to decrease FcγRII binding and to reduce the potential for thrombosis. The animal studies found that TNX-1500 retains activity to prevent rejection and preserve graft function. Tonix expects to start a first-in-human Phase 1 study in the second quarter of 2023 of TNX-1500 for prophylaxis of organ rejection in adult patients receiving a kidney transplant.”
Tatsuo Kawai, M.D., Ph.D., A. Benedict Cosimi Chair in Transplant Surgery, MGH and Professor of Surgery, Harvard Medical School (HMS) and senior author of the kidney transplant publication, said, “The blockade of the CD40L-CD40 pathway with anti-CD40L mAbs has been the most promising immunomodulatory approach to prevent allograft rejection. However, long-term graft and patient survival following transplantation of kidneys and other solid organs are constrained by side effects of the existing medications. Our data demonstrate a favorable safety profile associated with TNX-1500, since neither non-human primate nor human platelet activation were observed in-vitro when exposed to TNX-1500-sCD40L immune complexes. The therapeutic effects of TNX-1500 to consistently inhibit rejection of mismatched kidney allografts were not associated with infectious or thromboembolic complications, suggesting that clinical studies are warranted to evaluate TNX-1500 for transplant indications.”
Richard N. Pierson III, M.D., scientific director of the Center for Transplantation Sciences in the Department of Surgery at MGH and Professor of Surgery at HMS and senior author of the heart transplant paper said, “Anti-CD40L therapy has a unique activity in controlling the immune response to organ transplants. There remains a significant need for new treatments with improved activity and tolerability to prevent or treat organ transplant rejection. Anti-CD40L has shown great promise to facilitate transplant tolerance in multiple preclinical transplant models. A safe, effective anti-CD40L also has potential to enable use of genetically modified or humanized pig organs to treat humans with advanced organ failure or diabetes, an emerging field known as xenotransplantation.”
Tonix Pharmaceuticals Holding Corp.*
Tonix is a clinical-stage biopharmaceutical company focused on discovering, licensing, acquiring and developing therapeutics to treat and prevent human disease and alleviate suffering. Tonix’s portfolio is composed of central nervous system (CNS), rare disease, immunology and infectious disease product candidates. Tonix’s CNS portfolio includes both small molecules and biologics to treat pain, neurologic, psychiatric and addiction conditions. Tonix’s lead CNS candidate, TNX-102 SL (cyclobenzaprine HCl sublingual tablet), is in mid-Phase 3 development for the management of fibromyalgia with topline data expected in the fourth quarter of 2023. TNX-102 SL is also being developed to treat Long COVID, a chronic post-acute COVID-19 condition. Enrollment in a Phase 2 study has been completed, and topline results are expected in the third quarter of 2023. TNX-1900 (intranasal potentiated oxytocin), a small molecule in development for chronic migraine, is currently enrolling with topline data expected in the fourth quarter of 2023. TNX-601 ER (tianeptine hemioxalate extended-release tablets), a once-daily formulation of tianeptine being developed as a treatment for major depressive disorder (MDD), is also currently enrolling with interim data expected in the fourth quarter of 2023. TNX-1300 (cocaine esterase) is a biologic designed to treat cocaine intoxication and has been granted Breakthrough Therapy designation by the FDA. A Phase 2 study of TNX-1300 is expected to be initiated in the second quarter of 2023. Tonix’s rare disease portfolio includes TNX-2900 (intranasal potentiated oxytocin) for the treatment of Prader-Willi syndrome. TNX-2900 has been granted Orphan Drug designation by the FDA. Tonix’s immunology portfolio includes biologics to address organ transplant rejection, autoimmunity and cancer, including TNX-1500, which is a humanized monoclonal antibody targeting CD40-ligand (CD40L or CD154) being developed for the prevention of allograft and xenograft rejection and for the treatment of autoimmune diseases. A Phase 1 study of TNX-1500 is expected to be initiated in the second quarter of 2023. Tonix’s infectious disease pipeline includes TNX-801, a vaccine in development to prevent smallpox and mpox, for which a Phase 1 study is expected to be initiated in the second half of 2023. TNX-801 also serves as the live virus vaccine platform or recombinant pox vaccine platform for other infectious diseases. The infectious disease portfolio also includes TNX-3900, a class of broad-spectrum small molecule oral antivirals.
*All of Tonix’s product candidates are investigational new drugs or biologics and none has been approved for any indication.
1Lassiter, G., et al. (2023). TNX-1500, a crystallizable fragment–modified anti-CD154 antibody, prolongs nonhuman primate renal allograft survival. American Journal of Transplantation. April 3, 2023. https://doi.org/10.1016/j.ajt.2023.03.022
2Miura, S., et al. (2023) TNX-1500, a crystallizable fragment–modified anti-CD154 antibody, prolongs nonhuman primate cardiac allograft survival. American Journal of Transplantation. April 6, 2023. https://doi.org/10.1016/j.ajt.2023.03.025
Forward Looking Statements
Certain statements in this press release are forward-looking within the meaning of the Private Securities Litigation Reform Act of 1995. These statements may be identified by the use of forward-looking words such as “anticipate,” “believe,” “forecast,” “estimate,” “expect,” and “intend,” among others. These forward-looking statements are based on Tonix’s current expectations and actual results could differ materially. There are a number of factors that could cause actual events to differ materially from those indicated by such forward-looking statements. These factors include, but are not limited to, risks related to the failure to obtain FDA clearances or approvals and noncompliance with FDA regulations; delays and uncertainties caused by the global COVID-19 pandemic; risks related to the timing and progress of clinical development of our product candidates; our need for additional financing; uncertainties of patent protection and litigation; uncertainties of government or third party payor reimbursement; limited research and development efforts and dependence upon third parties; and substantial competition. As with any pharmaceutical under development, there are significant risks in the development, regulatory approval and commercialization of new products. Tonix does not undertake an obligation to update or revise any forward-looking statement. Investors should read the risk factors set forth in the Annual Report on Form 10-K for the year ended December 31, 2022, as filed with the Securities and Exchange Commission (the “SEC”) on March 13, 2023, and periodic reports filed with the SEC on or after the date thereof. All of Tonix’s forward-looking statements are expressly qualified by all such risk factors and other cautionary statements. The information set forth herein speaks only as of the date thereof.
COMPANY TO SHARE PRELIMINARY SAFETY AND EFFICACY DATA FROM ONGOING PHASE 1/2 TRIAL OF OCU400 FOR THE TREATMENT OF RETINITIS PIGMENTOSA AND LEBER CONGENITAL AMAUROSIS
MALVERN, Pa., April 11, 2023 (GLOBE NEWSWIRE) — Ocugen, Inc. (Ocugen or the Company) (NASDAQ: OCGN), a biotechnology company focused on discovering, developing, and commercializing novel gene and cell therapies, biologics, and vaccines, today announced that it will host an Investor and Analyst Event on April 14, 2023, at 8 a.m. ET. During the webcast and conference call, members of the Ocugen leadership team and key opinion leaders will review preliminary safety and efficacy results from the Phase 1/2 trial of OCU400 for the treatment of retinitis pigmentosa (RP) and Leber congenital amaurosis (LCA).
The event will feature:
Shankar Musunuri, PhD, MBA, Chairman, CEO and Co-founder, Ocugen
Arun Upadhyay, PhD, Chief Scientific Officer, Head of Research, Development & Medical, Ocugen
Huma Qamar, MD, MPH, Head of Clinical Development and Medical Affairs, Ocugen
David Birch, PhD, Scientific Director, Retina Foundation of the Southwest, primary investigator of the study
Neena B. Haider, PhD, Fellow of ARVO and inventor of modifier gene therapy
Webcast and Conference Call Details
Dial-in Numbers: (800) 715-9871 for U.S. callers and (646) 307-1963 for international callers Conference ID: 4898155 Webcast: Available on the events section of the Ocugen investor site
A replay of the call and archived webcast will be available for approximately 45 days following the event on the Ocugen investor site.
About Ocugen, Inc. Ocugen, Inc. is a biotechnology company focused on discovering, developing, and commercializing novel gene and cell therapies and vaccines that improve health and offer hope for patients across the globe. We are making an impact on patient’s lives through courageous innovation—forging new scientific paths that harness our unique intellectual and human capital. Our breakthrough modifier gene therapy platform has the potential to treat multiple retinal diseases with a single product, and we are advancing research in infectious diseases to support public health and orthopedic diseases to address unmet medical needs. Discover more at www.ocugen.com and follow us on Twitter and LinkedIn.
Cautionary Note on Forward-Looking Statements This press release contains forward-looking statements within the meaning of The Private Securities Litigation Reform Act of 1995, which are subject to risks and uncertainties. We may, in some cases, use terms such as “predicts,” “believes,” “potential,” “proposed,” “continue,” “estimates,” “anticipates,” “expects,” “plans,” “intends,” “may,” “could,” “might,” “will,” “should,” or other words that convey uncertainty of future events or outcomes to identify these forward-looking statements. Such statements are subject to numerous important factors, risks, and uncertainties that may cause actual events or results to differ materially from our current expectations. These and other risks and uncertainties are more fully described in our periodic filings with the Securities and Exchange Commission (SEC), including the risk factors described in the section entitled “Risk Factors” in the quarterly and annual reports that we file with the SEC. Any forward-looking statements that we make in this press release speak only as of the date of this press release. Except as required by law, we assume no obligation to update forward-looking statements contained in this press release whether as a result of new information, future events, or otherwise, after the date of this press release.
Prioritizing Clinical-Stage CNS Programs in Fibromyalgia, Depression, Migraine, and Cocaine Intoxication
Deprioritizing COVID-19 Related Programs and Pending Posttraumatic Stress Disorder (PTSD) Trial
Cash and Cash Equivalents Totaled Approximately $120.2 Million at December 31, 2022
CHATHAM, N.J., April 04, 2023 (GLOBE NEWSWIRE) — Tonix Pharmaceuticals Holding Corp. (Nasdaq: TNXP), a clinical-stage biopharmaceutical company, today announced it is reallocating resources and cash to streamline its pipeline and focus on its mid- and late-stage clinical programs within its core central nervous system (CNS) portfolio. The pipeline realignment prioritizes key near-term value drivers, reduces investment in several longer-term programs, particularly COVID-19-related studies, and delays the start of a posttraumatic stress disorder (PTSD) study in Kenya.
“We are excited to focus our efforts on the confirmatory, registration-enabling Phase 3 trial in fibromyalgia and the potentially pivotal Phase 2 trials for chronic migraine and depression,” said Seth Lederman, M.D., Chief Executive Officer of Tonix Pharmaceuticals. “To increase our operational efficiency, we intend to focus resources on our CNS portfolio – which also includes an upcoming Phase 2 study in cocaine intoxication – and to deprioritize several other programs with longer timelines, particularly programs related to COVID-19. With our experienced development team, Tonix is confident in its abilities to advance its diverse portfolio with multiple opportunities for achieving value creating milestones in 2023 and beyond.”
Key Anticipated 2023 Milestones
Interim analysis results of Phase 3 RESILIENT study of TNX-102 SL (sublingual cyclobenzaprine tablets) for fibromyalgia in the second quarter of 2023.
Interim analysis results of Phase 2 PREVENTION study of TNX-1900 (intranasal potentiated oxytocin) for chronic migraine in the fourth quarter of 2023.
Interim analysis results of Phase 2 UPLIFT study of TNX-601 ER (tianeptine hemioxalate extended-release tablets) for major depressive disorder in the fourth quarter of 2023.
Topline results of Phase 3 RESILIENT study of TNX-102 SL for fibromyalgia in the fourth quarter of 2023.
Initiate enrollment in a potentially pivotal Phase 2 study of TNX-1300 (recombinant double-mutant cocaine esterase for injection) for the emergency room reversal of the effects of cocaine intoxication.
Tonix is aligning its operational and scientific efforts on its core CNS programs and deprioritizing other programs as follows:
Central Nervous System (CNS): The Company is prioritizing the advancement of its late- and mid-stage clinical fibromyalgia, depression, migraine, and cocaine intoxication studies and delaying the start of the Kenya PTSD study. The Company has received regulatory clearance in Kenya, which will allow it to rapidly restart the PTSD program at the appropriate time. The Company is discontinuing the enrollment of new patients in a Phase 2 clinical trial in fibromyalgia-type Long COVID. The approximately 60 patients enrolled to date in the Long COVID study will be followed to completion, with topline data expected in the third quarter of 2023. The Company believes that the data from the study may guide future development and support grant applications.
Infectious Disease: The Company is continuing to advance development of TNX-801 (live virus vaccine to protect against smallpox and mpox) and its portfolio of potential broad-spectrum antiviral agents, including direct antiviral engineered proteins, TNX-4000, and the host-directed antiviral series of molecules, TNX-3900. The Company will also continue work on the recombinant pox virus (RPV) platform vector technology as a platform for rapid response to new pathogens, rather than specifically on the TNX-1800/TNX-1850 vaccines for COVID-19. Near-term preclinical work on other COVID-19 related programs, including anti-COVID antibodies TNX-3600, TNX-3800 and TNX-4100, will be deprioritized.
Immunology and Rare Disease: The Company is continuing development on TNX-1500 (a third generation anti-CD40L monoclonal antibody for prophylaxis of organ transplant rejection and treatment of autoimmune disorders), and TNX-2900 (intranasal potentiated oxytocin), a small peptide for the treatment of hyperphagia in Prader-Willi syndrome (PWS). The FDA has granted Orphan Drug designation for TNX-2900 for PWS.
Tonix Pharmaceuticals Holding Corp.*
Tonix is a clinical-stage biopharmaceutical company focused on discovering, licensing, acquiring and developing therapeutics to treat and prevent human disease and alleviate suffering. Tonix’s portfolio is composed of central nervous system (CNS), rare disease, immunology and infectious disease product candidates. Tonix’s CNS portfolio includes both small molecules and biologics to treat pain, neurologic, psychiatric and addiction conditions. Tonix’s lead CNS candidate, TNX-102 SL (cyclobenzaprine HCl sublingual tablet), is in mid-Phase 3 development for the management of fibromyalgia with interim data expected in the second quarter of 2023. TNX-102 SL is also being developed to treat Long COVID, a chronic post-acute COVID-19 condition. Enrollment of approximately 60 patients in a Phase 2 study has been completed, and topline results are expected in the third quarter of 2023. TNX-1900 (intranasal potentiated oxytocin), in development for chronic migraine, is currently enrolling with interim data expected in the fourth quarter of 2023. TNX-601 ER (tianeptine hemioxalate extended-release tablets), a once-daily formulation being developed as a treatment for major depressive disorder (MDD), is also currently enrolling with interim data expected in the fourth quarter of 2023. TNX-1300 (cocaine esterase) is a biologic designed to treat cocaine intoxication and has been granted Breakthrough Therapy designation by the FDA. A Phase 2 study of TNX-1300 is expected to be initiated in the second quarter of 2023. Tonix’s rare disease portfolio includes TNX-2900 (intranasal potentiated oxytocin) for the treatment of Prader-Willi syndrome. TNX-2900 has been granted Orphan Drug designation by the FDA. Tonix’s immunology portfolio includes biologics to address organ transplant rejection, autoimmunity and cancer, including TNX-1500, which is a humanized monoclonal antibody targeting CD40-ligand (CD40L or CD154) being developed for the prevention of allograft and xenograft rejection and for the treatment of autoimmune diseases. A Phase 1 study of TNX-1500 is expected to be initiated in the second quarter of 2023. Tonix’s infectious disease pipeline includes TNX-801, a vaccine in development to prevent smallpox and mpox, for which a Phase 1 study is expected to be initiated in the second half of 2023. TNX-801 also serves as the live virus vaccine platform or recombinant pox vaccine platform for other infectious diseases. The infectious disease portfolio also includes TNX-3900 and TNX-4000, classes of broad-spectrum small molecule oral antivirals.
*All of Tonix’s product candidates are investigational new drugs (IND) or biologics and have not been approved for any indication. TNX-801, TNX-1500, TNX-2900, TNX-3900 and TNX-4000 are in pre-IND stageof development and have not been approved for any indication.
Forward Looking Statements
Certain statements in this press release are forward-looking within the meaning of the Private Securities Litigation Reform Act of 1995. These statements may be identified by the use of forward-looking words such as “anticipate,” “believe,” “forecast,” “estimate,” “expect,” and “intend,” among others. These forward-looking statements are based on Tonix’s current expectations and actual results could differ materially. There are a number of factors that could cause actual events to differ materially from those indicated by such forward-looking statements. These factors include, but are not limited to, risks related to the failure to obtain FDA clearances or approvals and noncompliance with FDA regulations; delays and uncertainties caused by the global COVID-19 pandemic; risks related to the timing and progress of clinical development of our product candidates; our need for additional financing; uncertainties of patent protection and litigation; uncertainties of government or third party payor reimbursement; limited research and development efforts and dependence upon third parties; and substantial competition. As with any pharmaceutical under development, there are significant risks in the development, regulatory approval and commercialization of new products. Tonix does not undertake an obligation to update or revise any forward-looking statement. Investors should read the risk factors set forth in the Annual Report on Form 10-K for the year ended December 31, 2022, as filed with the Securities and Exchange Commission (the “SEC”) on March 13, 2023, and periodic reports filed with the SEC on or after the date thereof. All of Tonix’s forward-looking statements are expressly qualified by all such risk factors and other cautionary statements. The information set forth herein speaks only as of the date thereof.
CFA Exam is Evolving to Better Reflect Employee, Employer, and Candidate Needs
The CFA Institute is making the most significant changes to its program since first introduced back in 1963. All of the changes are designed to better serve employers, candidates, and charterholders. The designation is considered the gold standard in the investment profession, so modifying the program must have involved much thought and debate. Six additions will be rolled out for those beginning the journey toward a CFA this year. The end result will be expanded eligibility, hands-on learning, a more focused curriculum, additional practice available, the ability to specialize, and recognition at every passed level.
What is a Chartered Financial Analyst?
A Chartered Financial Analyst (CFA) is a professional designation awarded to financial analysts who have passed a rigorous set of exams administered by the CFA Institute. The CFA program is a globally recognized, graduate-level curriculum that covers a range of investment topics, including financial analysis, portfolio management, and ethical and professional standards.
To become a CFA charterholder, candidates must pass three levels of exams, each of which are administered once a year. In addition to passing the exams, candidates must also meet work experience or school requirements.
Eligibility
The institute is selective in who can be a candidate. In the past, those with a degree and working in the business, needed to be sponsored by two people; first, a current CFA member, and the second the prospective candidate’s supervisor. For students, the requirement was that they be in their last year of study and be sponsored by a professor in lieu of a supervisor.
The policy that had been in place is that students with just one year remaining in their studies may seek CFA candidacy. The purpose of the new policy, according to Margeret Franklin CFA, President and CEO of the CFA Institute, is to “provide students with the opportunity to Level 1 of the CFA program as a clear signal to employers that they are serious about a career in the investment industry by getting an early start in the program.” This is the first of the revisions in the program and has been in place since November 2022.
Job Ready Skills
This new feature recognizes there is a difference between textbook understanding and work. The upcoming study and test material is designed for charterholders to be able to add value much earlier to their employer by imparting practical skills. A practical skills module will be added beginning with those scheduled for the February 2024 Level 1 exam. Level II candidates taking the test in May 2024 will also be tested on this new material. Level III candidates will see this material in 2025.
The impetus for this addition, according to the CFA Institute’s website, is it, “allows us to meet the expressed needs of student candidates, providing them with the opportunity to prepare for internships and investment careers, while also addressing industry demand for well-trained, ethical professionals.”
Expanded Study Material
Candidates are told they can greatly increase their chances of success taking the exam if they correctly answer 1,000 practice question during study, and score at least 70% on a mock exam. The Institute has added as an extra (not part of the basic study package) three new elements for preparation.
To increase the percentage of successful candidates, the CFA Institute now offers a Level I Practice Pack. It includes 1,000 more practice questions and six additional mock exams to go with the study materials that is standard with registration.
The add-on also provides six additional, exam-quality mock exams. The questions are prepared by the same team that create the exams each year.
More Focused
The CFA has branded itself with the promise that 300 hours of study per level is what is needed for success. They recognize that most candidates put in much more time, and the success rate for this tough series of exams is low. The Institute has streamlined study to make more efficient its Level I material beginning with those sitting for the Level I exam in 2024.
To be more efficient, the Institute presumes Level I candidates have already mastered many introductory financial concepts as part of their university studies or career role. To avoid duplication and to streamline Level I curriculum content, they have moved some of this content. It is available separately as reference material for registered candidates.
The content that has been moved to “Pre-Read” incudes topics like the time-value of money, basic statistics, microeconomics, and introduction to company accounts.
Choose Your Specialty
Starting in 2025, candidates will be able to choose one of three specialty paths to be tested at Level III. The reason for the addition is the CFA curriculum has always prepared candidates for investment and finance buy-side roles. This choice allows the CFA credential to grow and develop to meet the needs of a broader group of individuals and employers.
The CFA traditional path has been to prepare the candidate for a portfolio management role. This traditional path is still included. The Institute is also adding concentrations in private wealth management, and private markets. There will only be one credential, the Chartered Financial Analyst, but three areas of specialty.
Recognition at Every Level
While the goal of every candidate is to earn a full-fledged CFA designation, each level is a significant achievement. Now, CFA Institute awarded digital badges will recognize success at the first two levels.
The digital badges, to be used on social media when rolled out later in 2023 will be accompanied by marketing and awareness-building with employers, to improve the visibility and value placed on progress through the CFA program. The goal is for candidates to be distinguished in the market, have one-click social sharing, with instant verification to employers and colleagues to boost credibility and solidify a candidates’ accomplishment.
Overall the change, is to signal to the market that completing Levels I and II are substantial achievements, with tangible recognition of a candidate’s commitment to the industry through their learned skills and experience, professionalism and ethical practices.
Take Away
The world investment world is changing, and the CFA Institute is responding in order to better serve those that benefit from this prestigious designation. Candidates will now have more choices, more study material available, and the ability to take credit for their rigorous studies beginning after passing Level I.
Michael Burry’s New Comments Highlight the Importance of Pivoting
With most major indexes in positive territory for the year but still, well below their 2022 starting point, are markets moving to make up their losses? Michael Burry thinks so. In the most positive tweet I have seen from him in almost four years, Burry posted he was “wrong to say sell.” As recently as late January, Burry posted a one-word tweet, “Sell.” The pundits read into it that perhaps another economic crisis similar to the one that occurred in 2008 will crush markets. His almost cult-like following was built by being one of the few individuals who correctly positioned his investments for the housing and subprime mortgage problems that shook the U.S. in late 2008.
Michael Burry Suggests We Have a Bull Market
Market participants are surprised at both Burry’s bullishness and open acknowledgment that he believes he was overly negative and has gotten it wrong this time. The widely followed investor has been bearish and broadcasting this sentiment to his 1.4 million Twitter followers. The suggestions have been that they should consider lightening their holdings. Burry even caught investor attention with his own 13F reported short position in Apple (AAPL).
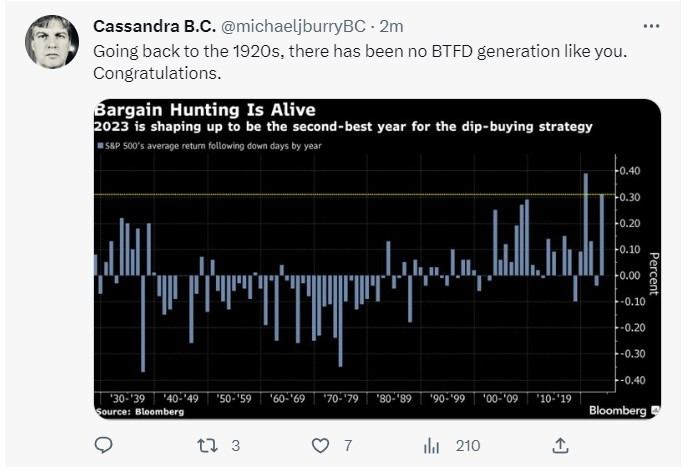
Burry points to high levels of dip buying, which may have changed today’s market landscape. This is backed up by other reports, including one from Bloomberg that gives a reason that 2023 is shaping up to be one of the best years for dip-buyers.
Importance of Pivoting
He may not have been “wrong.” The best investors understand their time frame and will recognize when market moves are not as expected. On February 2nd, a few days after Burry’s January 31st “sell” tweet, the S&P 500 index closed at 4,180 just after the Fed interest rate target increased by 25 basis points. To date, that is the large-cap index’s highest close of 2023, as weeks of declines followed. The NDX had fallen nearly 3% since that day.
But the trend, if it continues, appears to have changed. The equity market in March has been surprisingly resilient. It has been able to shrug off multi-country concerns surrounding the banks, elevated expectations of an economic downturn, and forecasts that S&P 500 companies will report their biggest quarterly earnings decline since the second quarter of 2020.
Moving from a sell to a more bullish position, for those that are looking to capture short-term moves, seems to be what is implied in his tweet. It may be that Michael Burry was not wrong in direction, as the markets did fall, just wrong in how long they would stay weak.
Take Away
There are long-term trends and short-term trends. Also, trends that are weak and strong through different sectors at the same time. While time will tell if Burry is correct in his most recent direction, the ability to see market sentiment changing and go with it is characteristic of a successful trader.
SVB’s Newfangled Failure Fits a Century-Old Pattern of Bank Runs, With a Social Media Twist
The history of bank failures all have a familiar pattern. Based on past history, problems may still bubble up over the coming months. The internet and the ability for online withdrawals could elevate risks to banks. Rodney Ramcharan a Professor of Finance and Business Economics, University of Southern California, points out the similarities, the new challenges and provides his thoughts in his article that has been reprinted with permission from The Conversation.
The failure of Silicon Valley Bank on March 10, 2023, came as a shock to most Americans. Even people like myself, a scholar of the U.S. banking system who has worked at the Federal Reserve, didn’t expect SVB’s collapse.
Usually banks, like all companies, fail after a prolonged period of lackluster performance. But SVB, the nation’s 16th-largest bank, had been stable and highly profitable just a few months before, having earned about US$1.5 billion in profits in the last quarter of 2022.
However, financial history is filled with examples of seemingly stable and profitable banks that unexpectedly failed.
The demise of Lehman Brothers and Bear Stearns, two prominent investment banks, and Countrywide Financial Corp., a subprime mortgage lender, during the 2008-2009 financial crisis; the Savings and Loan banking crisis in the 1980s; and the complete collapse of the U.S. banking system during the Great Depression didn’t unfold in exactly the same way. But they had something in common: An unexpected change in economic conditions created an initial bank failure or two, followed by general panic and then large-scale economic distress.
The main difference this time, in my view, is that modern innovations may have hastened SVB’s demise.
Great Depression
The Great Depression, which lasted from 1929 to 1941, epitomized the public harm that bank runs and financial panic can cause.
Following a rapid expansion of the “Roaring Twenties,” the U.S. economy began to slow in early 1929. The stock market crashed on Oct. 24, 1929 – a date known as “Black Tuesday.”
The massive losses investors suffered weakened the economy and led to distress at some banks. Fearing that they would lose all their money, customers began to withdraw their funds from the weaker banks. Those banks, in turn, began to rapidly sell their loans and other assets to pay their depositors. These rapid sales pushed prices down further.
As this financial crisis spread, depositors with accounts at nearby banks also began queuing up to withdraw all their money, in a quintessential bank run, culminating in the failure of thousands of banks by early 1933. Soon after President Franklin D. Roosevelt’s first inauguration, the federal government resorted to shutting all banks in the country for a whole week.
These failures meant that banks could no longer lend money, which led to more and more problems. The unemployment rate spiked to around 25%, and the economy shrank until the outbreak of World War II.
Determined to avoid a repeat of this debacle, the government tightened banking regulations with the Glass-Steagall Act of 1933. It prohibited commercial banks, which serve consumers and small and medium-size businesses, from engaging in investment banking and created the Federal Deposit Insurance Corporation, which insured deposits up to a certain threshold. That limit has risen sharply over the past 90 years, from $2,500 in 1933 to $250,000 in 2010 – the same limit in place today.
S&L Crisis
The nation’s new and improved banking regulations ushered in a period of relative stability in the banking system that lasted about 50 years.
But in the 1980s, hundreds of the small banks known as savings and loan associations failed. Savings and loans, also called “thrifts,” were generally small local banks that mainly made mortgage loans to households and collected deposits from their local communities.
Beginning in 1979, the Federal Reserve began to hike interest rates very aggressively to fight the high inflation rates that had become entrenched.
By the early 1980s, Congress began allowing banks to pay market interest rates on depositers’ accounts. As a result, the interest rate S&Ls had to pay their customers was much higher than the interest income they were earning on the loans they had made in prior years. That imbalance caused many of them to lose money.
Even though about 1 in 3 S&Ls failed from around 1986 through 1992 – somewhere around 750 banks – most depositors at small S&Ls were protected by the FDIC’s then-$100,000 insurance limit. Ultimately, resolving that crisis cost taxpayers the equivalent of about $250 billion in today’s dollars.
Because the savings and loans industry was not directly connected to the big banks of that era, their collapse did not cause runs at the bigger institutions. Nevertheless, the S&L collapse and the government’s regulatory response did reduce the supply of credit to the economy.
As a result, the U.S. economy underwent a mild recession in the latter half of 1990 and first quarter of 1991. But the banking system escaped further distress for nearly two decades.
Great Recession
Against this backdrop of relative stability, Congress repealed most of Glass-Steagall in 1999 – eliminating Depression-era regulations that restricted the scope of businesses that banks could engage in.
Those changes contributed to what happened when, at the start of a recession that began in December 2007, the entire financial sector suffered a panic.
At that time, large banks, freed from the Depression-era restrictions on securities trading, as well as investment banks, hedge funds and other institutions outside the traditional banking system, had heavily invested in mortgage-backed securities, a kind of bond backed by pooled mortgage payments from lots of homeowners. These bonds were highly profitable amid the housing boom of that era, and they helped many financial institutions reap record profits.
But the Federal Reserve had been increasing interest rates since 2004 to slow the economy. By 2007, many households with adjustable-rate mortgages could no longer afford to make their larger-than-expected home loan payments. That led investors to fear a rash of mortgage defaults, and the values of securities backed by mortgages plunged.
It wasn’t possible to know which investment banks owned a lot of these vulnerable securities. Rather than wait to find out and risk not getting paid, most of the depositors rushed to get their money out by late 2007. This stampede led to cascading failures in 2008 and 2009, and the federal government responded with a series of big bailouts.
The government even bailed out General Motors and Chrysler, two of the country’s three largest automakers, in December 2008 to keep the industry from going bankrupt. That happened because the major car companies relied on the financial system to provide potential car buyers with credit to purchase or lease new cars. But when the financial system collapsed, buyers could no longer obtain credit to finance or lease new vehicles.
The Great Recession lasted until June 2009. Stock prices plummeted by more than 50%, and unemployment peaked at around 10% – the highest rate since the early 1980s.
As with the Great Depression, the government responded to this financial crisis with significant new regulations, including a new law known as the Dodd-Frank Act of 2010. It imposed stringent new requirements on banks with assets above $50 billion.
Close-Knit Customers
Congress rolled back some of Dodd-Frank’s most significant changes only eight years after lawmakers approved the measure.
Notably, the most stringent requirements were now reserved for banks with more than $250 billion in assets, up from $50 billion. That change, which Congress passed in 2018, paved the way for regional banks like SVB to rapidly expand with much less regulatory oversight.
But still, how could SVB collapse so suddenly and without any warning?
Banks take deposits to make loans. But a loan is a long-term contract. Mortgages, for example, can last for 30 years. And deposits can be withdrawn at any time. To reduce their risks, banks can invest in bonds and other securities that they can quickly sell in case they need funds for their customers.
In the case of SVB, the bank invested heavily in U.S. Treasury bonds. Those bonds do not have any default risk, as they are debt issued by the federal government. But their value declines when interest rates rise, as newer bonds pay higher rates compared with the older bonds.
SVB bought a lot of Treasury bonds it had on hand when interest rates were close to zero, but the Fed has been steadily raising interest rates since March 2022, and the yields available for new Treasurys sharply increased over the next 12 months. Some depositors became concerned that SVB might not be able to sell these bonds at a high enough price to repay all its customers.
Unfortunately for SVB, these depositors were very close-knit, with most in the tech sector or startups. They turned to social media, group text messages and other modern forms of rapid communication to share their fears – which quickly went viral.
Many large depositors all rushed at the same time to get their funds out. Unlike what happened nearly a century earlier during the Great Depression, they generally tried to withdraw their money online – without forming chaotic lines at bank branches.
Will More Shoes Drop?
The government allowed SVB, which is being sold to First Citizens Bank, and Signature Bank, a smaller financial institution, to fail. But it agreed to repay all depositors – including those with deposits above the $250,000 limit.
While the authorities have not explicitly guaranteed all deposits in the banking system, I see the bailout of all SVB depositors as a clear signal that the government is prepared to take extraordinary steps to protect deposits in the banking system and prevent an overall panic.
I believe that it is too soon to say whether these measures will work, especially as the Fed is still fighting inflation and raising interest rates. But at this point, major U.S. banks appear safe, though there are growing risks among the smaller regional banks.
The building wave of M&A deals in at least two of the mining sectors, is difficult to ignore. This week, lithium miner Albemarle (ALB) disclosed it had submitted a proposal to acquire Liontown Resources (LTR.Australia). Last month Newmont Mining’s proposed acquisition of Newcrest Mining, highlighted the rising interest in M&A in the gold sector. To date, both proposals have been shunned, but as companies look to increase production, inflation increases producers capital outlays, plus long permitting processes, a case could be made that growth by acquisition, friendly or not, is becoming more appealing in the sector.
Typically growing demand to buy smaller companies in a sector puts upward pressure on valuations.
The gold and lithium sectors have mostly lead over the past six months in terms of deal-making. For gold, the largest driver is these miners remain undervalued by historical levels. The trend for lithium producers in the years ahead, as battery production ramps up to meet surging demand for electric storage and green technology, is expected to continue to accelerate.
The Price of lithium, key to batteries found in most EVs, over the years has risen. This created a situation where car manufacturers themselves have realized that the best way to ensure a key ingredient to their product is to own all or part of a large enough producer. Lithium producers are looking for ways to increase yield and own more production facilities. These factors could unfold into a situation where the stock prices of companies producing either of these two metals, and even other mined minerals with growing demand, could outperform other sectors.
Five Reasons to Explore Small Mining Companies
While the real heat is on producers of minerals used to make batteries and gold miners, the below supply/demand concepts may apply to an increased need for other miners to involve themselves in M&A as well.
New List of Acquirers – The big car companies, energy companies, and other additional industrial consumers are in need of reliable supply.
Cheaper to Buy than Find – M&A is a solution to the increased costs of growing organically. It also helps circumvent what could be permitting delays and supply chain problems that prevent headway.
Scale – Gold companies normally try to extract synergies when seeking to size up, while lithium producers seek pure scale.
Big Picture Economics – The economic environment favors miners if inflation remains elevated; the companies’ production is more likely to sell for more. The cost of money, on an opportunity cost basis, especially net of inflation (real interest) favors mining.
Finding Value – Informed stock selection is key to discover and invest in companies best positioned to benefit from swelling M&A in the sector.
The fifth on this list is less of a reason to explore mining companies and more a common sense reminder. Last week the Channelchek Take Away Series brought to viewers a live in-depth presentation of 12 mining companies that were just coming off the huge PDAC mining conference in Canada. These presentations are being replayed and may be just the place to begin to hear from company executives, and a highly respected senior natural resources analyst. Audience questions and answers follow.
The information on these on-demand replay videos is current, and as you’ll see by clicking here, the list of video presentations includes a diversified mix of producers and explorers.
As March Madness Looms, Growth in Legalized Sports Betting May Pose a Threat to College Athletes
March Madness began on March 14, 2023, it’s a sure bet that millions of Americans will be making wagers on the annual college basketball tournament.
The American Gaming Association estimates that in 2022, 45 million people – or more than 17% of American adults – planned to wager US$3.1 billion on the NCAA tournament. That makes it one of the nation’s most popular sports betting events, alongside contests such as the Kentucky Derby and the Super Bowl. By at least one estimate, March Madness is the most popular betting target of all.
While people have been betting on March Madness for years, one difference now is that betting on college sports is legal in many states. This is largely due to a 2018 Supreme Court ruling that cleared the way for each state to decide whether to permit people to gamble on sporting events. Prior to the ruling, legal sports betting was only allowed in Nevada.
Since the ruling, sports betting has grown dramatically. Currently, 36 states allow some form of legalized sports betting. And now, Georgia, Maine and Kentucky are proposing legislation to make sports betting legal.
About two weeks after sports betting became legal in Ohio on Jan. 1, 2023, someone, disappointed by an unexpected loss of the University of Dayton men’s basketball team to Virginia Commonwealth University, made threats and left disparaging messages against Dayton athletes and the coaching staff.
The Ohio case is by no means isolated. In 2019, a Babson College student who was a “prolific sports gambler” was sentenced to 18 months in prison for sending death threats to at least 45 professional and collegiate athletes in 2017.
Faculty members of Miami University’s Institute for Responsible Gaming, Lottery, and Sports are concerned that the increasing prevalence of sports betting could potentially lead to more such incidents, putting more athletes in danger of threats from disgruntled gamblers who blame them for their gambling losses.
The anticipated growth in sports gambling is quite sizable. Analysts estimate the market in the U.S. may reach over US$167 billion by 2029.
Gambling Makes Inroads into Colleges
Concerns over college athletes being targeted by upset gamblers are not new. Players and sports organizations have expressed worry that expanded gambling could lead to harassment and compromise their safety. Such concerns led the nation’s major sports organizations – MLB, NBA, NFL, NHL and NCAA – to sue New Jersey in 2012 over a plan to initiate legal sports betting in that state. They argued that sports betting would make the public think that games were being thrown. Ultimately, the Supreme Court ruled that it was up to states to decide if they wanted to permit legal gambling.
Sports betting has also made inroads into America’s college campuses. Some universities, such as Louisiana State University and Michigan State University, have signed multimillion-dollar deals with casinos or gaming companies to promote gambling on campus.
Athletic conferences are also cashing in on the data related to these games and events. For instance, the Mid-Atlantic Conference signed a lucrative five-year deal in 2022 to provide real-time statistical event data to gambling companies, which then leverage the data to create real-time wager opportunities during sporting events.
As sports betting comes to colleges and universities, it means the schools will inevitably have to deal with some of the negative aspects of gambling. This potentially includes more than just gambling addiction. It could also involve the potential for student-athletes and coaches to become targets of threats, intimidation or bribes to influence the outcome of events.
The risk for addiction on campus is real. According to the National Council on Problem Gambling, over 2 million adults in the U.S. have a “serious” gambling problem, and another 4 million to 6 million may have mild to moderate problems. One report estimates that 6% of college students have a serious gambling problem.
What Can be Done?
Two faculty fellows at Miami University’s Institute for Responsible Gaming, Lottery, and Sport – former Ohio State Senator William Coley and Sharon Custer – recommend that regulators and policymakers work with colleges and universities to reduce the potential harm from the growth in legal gaming. Specifically, they recommend that each state regulatory authority:
Develop plans to coordinate between different governmental agencies to ensure that individuals found guilty of violations are sanctioned in other jurisdictions.
Dedicate some of the revenue from gaming to develop educational materials and support services for athletes and those around them.
Create anonymous tip lines to report threats, intimidation or influence, and fund an independent entity to respond to these reports.
Assess and protect athlete privacy. For instance, schools might decline to publish contact information for student-athletes and coaches in public directories.
Train athletes and those around them on basic privacy management. For instance, schools might advise athletes to not post on public social media outlets, especially if the post gives away their physical location.
The NCAA or athletic conferences could lead the development of resources, policies and sanctions that serve to educate, protect and support student-athletes and others around them who work at the schools for which they play. This will require significant investment to be comprehensive and effective.
This article was republished with permission from The Conversation, a news site dedicated to sharing ideas from academic experts. It represents the research-based findings and thoughts of, Jason W. Osborne,Professor of Statistics, Institute for Responsible Gaming, Lottery, and Sport, Miami University.