The PDAC Mining Conference has a New Discussion Item for 2023
As analysts, investors, financiers, manufacturers, and others with a high interest in natural resources converge on the Prospectors and Developers Association of Canada (PDAC) conference this week, some of the conversations will revolve around the risks of having investments that may later be divested under a new Canadian policy enacted late last year. The Policy is intended to protect strategic minerals, especially those deemed critical to a greener energy future. The conference, which is expected to have close to 30,000 attendees, comes just four months after the enactment, which falls under the Investment Canada Act (ICA).
Background
Late last year, the Canadian Minister of Innovation, Science and Industry, in conjunction with the Minister of Natural Resources, issued a new policy relating to the treatment of foreign state-owned enterprise (SOE) investment in Canada’s critical minerals sector under the ICA.
The Policy which is now in effect identifies 31 minerals that the Canadian government says are essential to Canada’s prosperity in the emerging low-carbon and technology sectors, or that contribute to Canada’s national defense and security. At the same time, it works to not undermine the Canadian Critical Minerals Strategy, designed to position the natural resource-rich country as the preferred global supplier of critical minerals.
The Policy applies to any direct or indirect investment of any size by a foreign SOE in a Canadian business involved in the “critical minerals” supply chain. Under the ICA, any investment that is a foreign SOE will be reviewed by the Investment Canada Act (ICA). The Policy states that the Minister is required to determine whether an investment is of “net benefit to Canada.” This is expected to be a high hurdle. What’s more, all foreign SOE investment in the critical minerals sector, regardless of size or value, will be subject to enhanced scrutiny under the national security review provisions.
Days after the Policy was issued, the Minister announced that the Canadian government ordered the divestiture of three separate investments in Canadian critical mineral companies involved in (among other things) lithium mining activities, both within and outside of Canada.
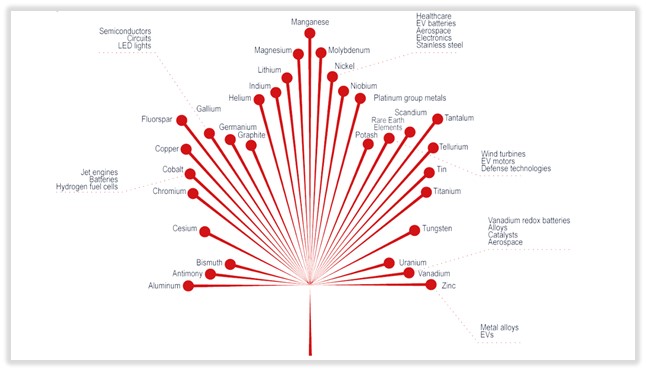
The Policy does not impact the ability for individuals or funds and companies not meeting the definition of SOE or directly influenced by an SOE. However, it may lower the number of potential financiers and investors for Canadian companies involved in procuring the 31 minerals shown in the graphic below. Dean McPherson, head of global mining at the Toronto Stock Exchange has been quoted saying, “No doubt the implications of a decision to restrict a major avenue of capital flow needs to be supplemented by capital that is similar in size and timely.”
Canada’s 31 Critical Minerals and Uses
As it relates to national security considerations, the Policy states that all investments by foreign SOEs (or foreign-influenced investors that involve a Canadian business or entity operating in a critical minerals sector in Canada will form the basis for a finding that the investment could be “injurious to national security”.
The changes are viewed as a defensive measure against China, which has invested $7 billion in Canada’s base metals sector in the past 20 years. Canadian officials last fall ordered Chinese companies to sell stakes in three Toronto-listed lithium companies, two of which are developing mines outside Canada.

PDAC and Impact
The conference which takes place in Canada this week will be the first forum of its size where questions surrounding the Ministers policy under the ICA can be discussed, and parties of varied interests on all sides can discuss there expectations of how this will impact financing, partnerships, and investments among important global producers and consumers of raw materials.
However, the hurdle that Canada has put in place for some investors and investing could cause some less-than-welcome investors from gaining too much control over a company and the resources it produces. Whether it also weighs heavily on the value of company’s based out of Canada will be discussed at the conference and remains to be seen. At present, after four months, the demand for some of the many protected resources has only increased. This is a positive sign for investors.
Managing Editor, Channelchek