Research News an Market Data on DFMTF
04 Mar, 2024, 07:00 ET
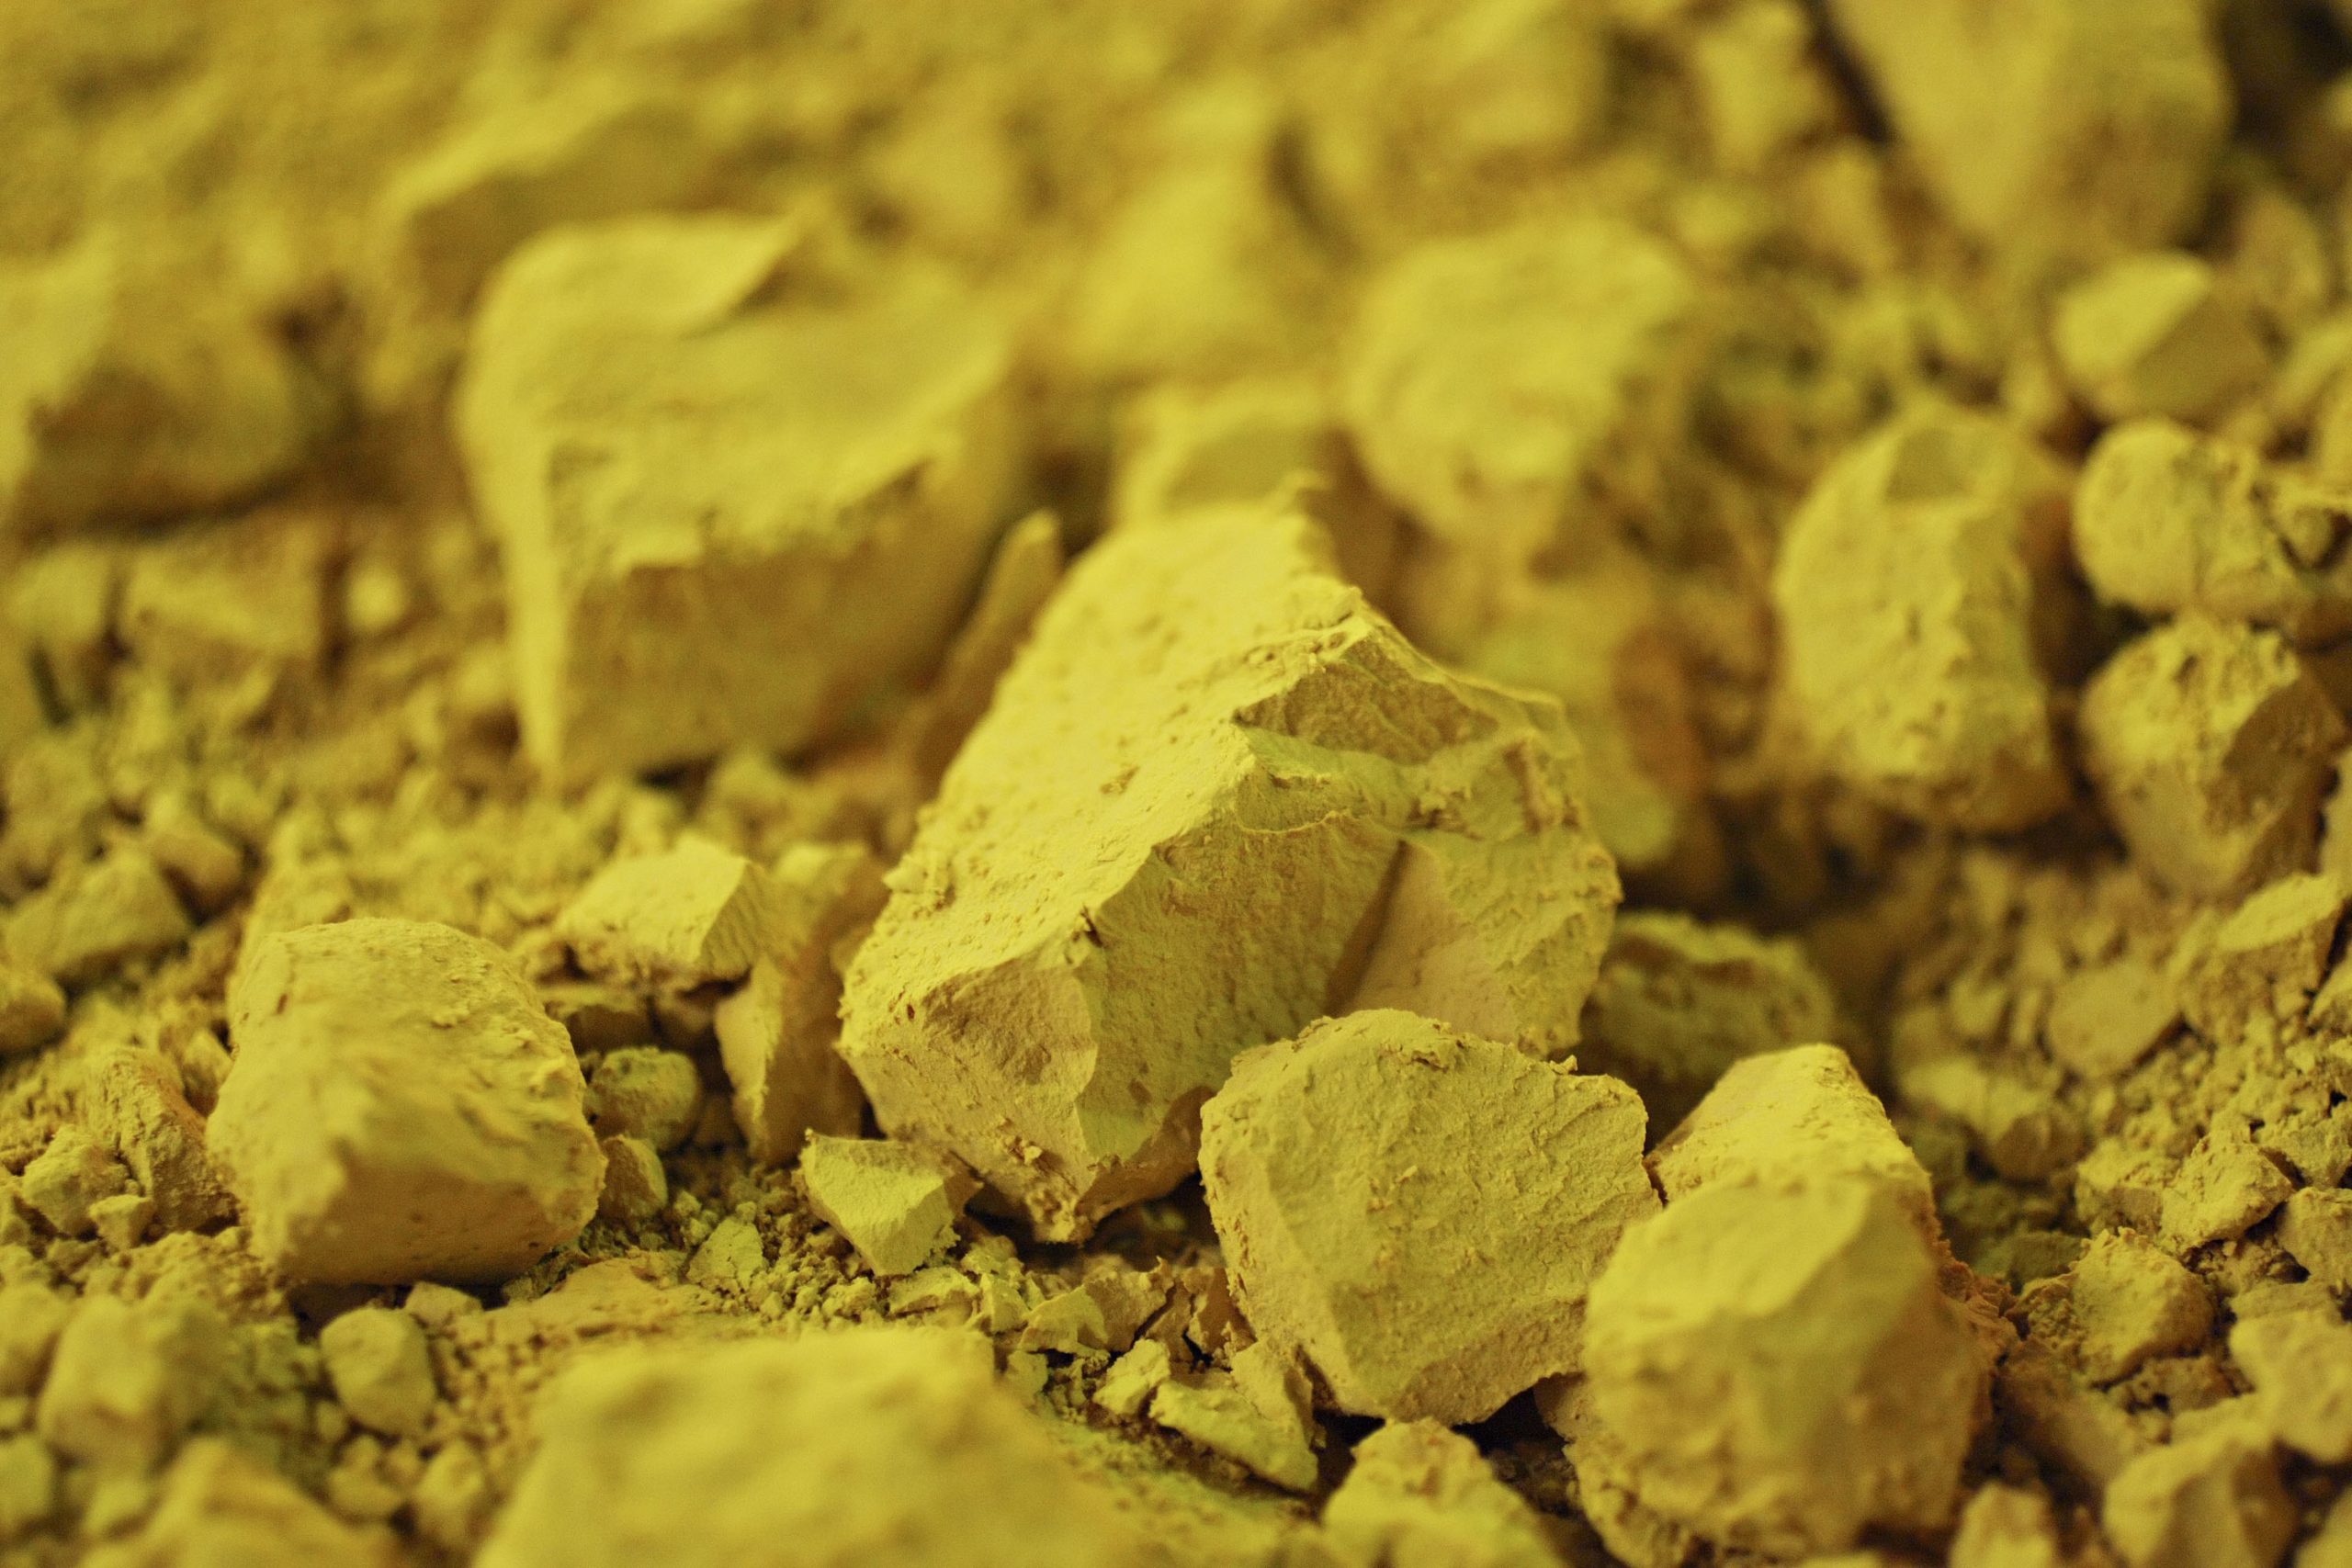
VANCOUVER, BC, March 4, 2024 /PRNewswire/ – Defense Metals Corp. (“Defense Metals” or the “Company“; (TSXV: DEFN) (OTCQB: DFMTF) (FSE: 35D) is pleased to announce that samples of mixed rare earth carbonate (“MREC“) have been shipped to two major Rare Earth Element (“REE“) companies. Samples generated by SGS Canada Inc. in Lakefield, Ontario during 2023 hydrometallurgical piloting test work performed on concentrate produced by earlier flotation pilot plant testing of a 26-tonne bulk sample taken from the Company’s wholly-owned Wicheeda deposit have now been sent to almost every REE separator in the world.
MREC samples shipped to the recipients are independently verifying the high-quality of the REE product from the Wicheeda deposit, and further establishing Defense Metals’ Wicheeda REE Project as a critically important, future North American source of rare earths.
Craig Taylor, CEO of Defense Metals, commented:
“Defense Metals continues to advance the Wicheeda Project, establishing it as one of the few western world REE projects that has the key characteristics required for a viable REE project including: (1) location and superior logistics, (2) minerology, metallurgy, and grade, (3) the ability to produce a REE product as established by pilot plant operations , (4) significant potential mine life, and (5) social licence and support of the McLeod Lake Indian Band. Defense Metals believes strongly that Wicheeda will play a key role in establishing North American REE supply chains; first and foremost, with respect to mining and hydrometallurgical processing, and ultimately with respect to the onshoring of downstream REE separation, refining and metallizing capabilities. Defense Metals is positioned as one of the very few North American REE companies having true ability to achieve this vision.”
Defense Metals to Attend the Prospectors & Developers Association of Canada Convention
Defense Metals will be attending the Prospectors & Developers Association of Canada (PDAC) Convention in Toronto, Canada from March 3 to March 6, 2024, and invites interested parties to visit the Company at Booth #2500 and at Discovery Group’s Booth #2630.
Qualified Person
This news release has been reviewed and approved by Kristopher J. Raffle, P.Geo. (B.C.), a Principal of APEX Geoscience Ltd., of Edmonton, Alberta, a technical consultant to the Company, and a “Qualified Person” as defined in NI 43-101.
About Defense Metals Corp. and its Wicheeda Rare Earth Element Project
Defense Metals Corp. is a mineral exploration and development company focused on the development of its 100% owned, 8,301-hectare (~20,534-acre) Wicheeda REE Project that is located on the traditional territory of the McLeod Lake Indian Band in British Columbia, Canada.
The Wicheeda REE Project, approximately 80 kilometres (~50 miles) northeast of the city of Prince George, is readily accessible by a paved highway and all-weather gravel roads and is close to infrastructure, including hydro power transmission lines and gas pipelines. The nearby Canadian National Railway and major highways allow easy access to the port facilities at Prince Rupert, the closest major North American port to Asia.
Defense Metals is a proud member of Discovery Group. For more information please visit: www.discoverygroup.ca.
For further information, please visit www.defensemetals.com or contact:
Todd Hanas, Bluesky Corporate Communications Ltd.
Vice President, Investor Relations
Tel: (778) 994 8072
Email: [email protected]
Neither the TSX Venture Exchange nor its Regulation Services Provider (as that term is defined in the policies of the TSX Venture Exchange) accepts responsibility for the adequacy or accuracy of this news release.
Cautionary Statement Regarding “Forward-Looking” Information
This news release contains “forward–looking information or statements” within the meaning of applicable securities laws, which may include, without limitation, statements relating to attending PDAC and related meetings, advancing the Wicheeda REE Project, the expectations and plans for the Wicheeda REE Project, the technical, financial and business prospects of the Company, its project and other matters. All statements in this news release, other than statements of historical facts, that address events or developments that the Company expects to occur, are forward-looking statements. Although the Company believes the expectations expressed in such forward-looking statements are based on reasonable assumptions, such statements are not guarantees of future performance and actual results may differ materially from those in the forward-looking statements. Such statements and information are based on numerous assumptions regarding present and future business strategies and the environment in which the Company will operate in the future, including the price of rare earth elements, the anticipated costs and expenditures, the ability to achieve its goals, that general business and economic conditions will not change in a material adverse manner, that financing will be available if and when needed and on reasonable terms. Such forward-looking information reflects the Company’s views with respect to future events and is subject to risks, uncertainties and assumptions, including the risks and uncertainties relating to the interpretation of exploration and metallurgical results, risks related to the inherent uncertainty of exploration and development and cost estimates, the potential for unexpected costs and expenses and those other risks filed under the Company’s profile on SEDAR+ (www.sedarplus.com). While such estimates and assumptions are considered reasonable by the management of the Company, they are inherently subject to significant business, economic, competitive and regulatory uncertainties and risks. Factors that could cause actual results to differ materially from those in forward looking statements include, but are not limited to, continued availability of capital and financing and general economic, market or business conditions, adverse weather and climate conditions, failure to maintain or obtain all necessary government permits, approvals and authorizations, failure to maintain or obtain community acceptance (including First Nations), risks relating to unanticipated operational difficulties (including failure of equipment or processes to operate in accordance with specifications or expectations, cost escalation, unavailability of personnel, materials and equipment, government action or delays in the receipt of government approvals, industrial disturbances or other job action, and unanticipated events related to health, safety and environmental matters), risks relating to inaccurate geological, metallurgical, engineering and pricing assumptions, decrease in the price of rare earth elements, the impact of Covid-19 or other viruses and diseases on the Company’s ability to operate, restriction on labour and international travel and supply chains, loss of key employees, consultants, officers or directors, increase in costs, delayed results, litigation, and failure of counterparties to perform their contractual obligations. The Company does not undertake to update forward–loo