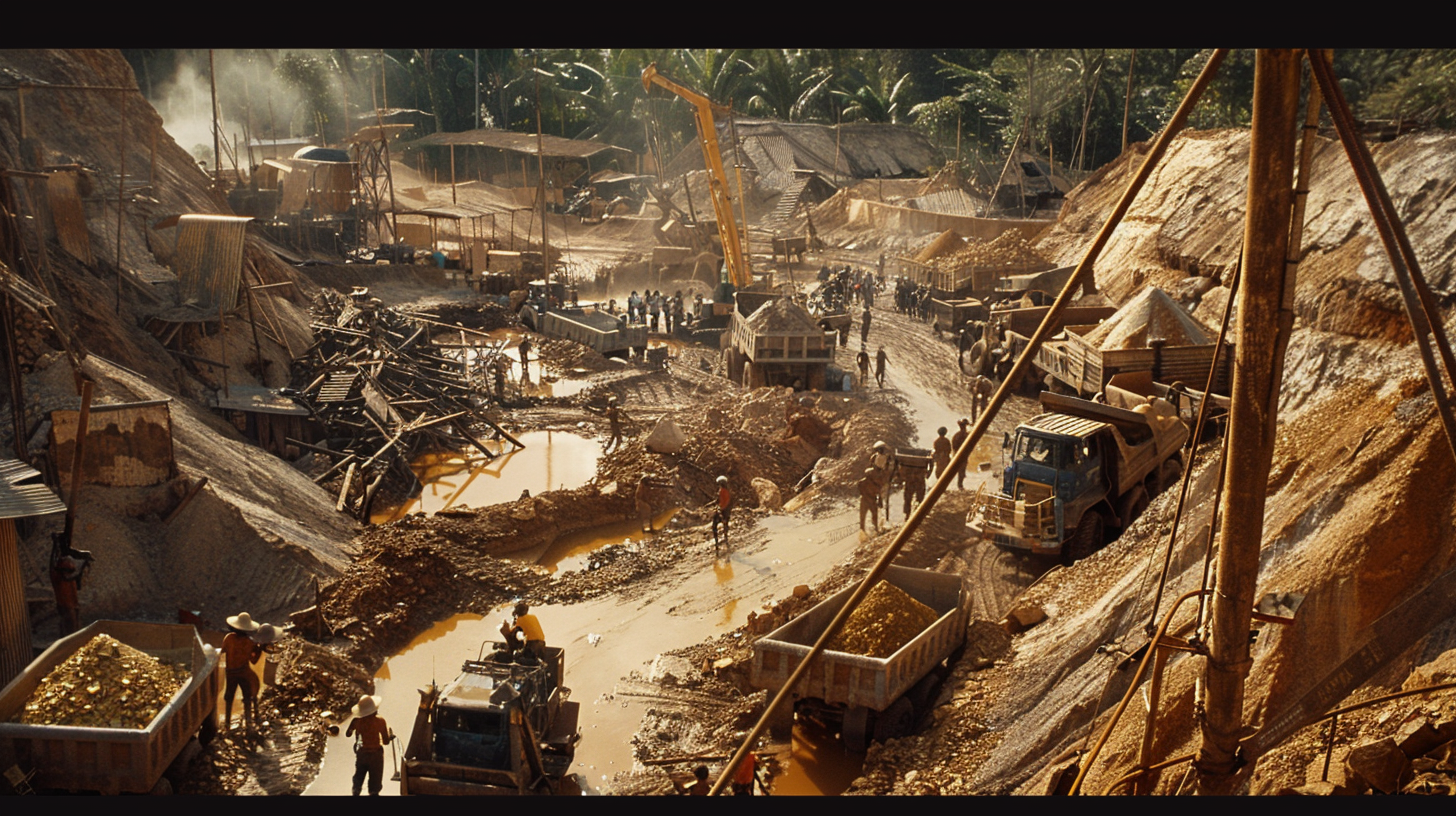
Gold prices have been on a dazzling run in recent months, with the precious metal notching consecutive monthly gains to reach new all-time highs. On Monday, spot gold prices topped $2,100 an ounce for the first time ever, hitting $2,110 before pulling back slightly. This adds to the previous record set back on Friday when prices exceeded $2,075, blowing past 2020’s earlier high point.
Analysts say gold still has room to run in 2023 and 2024 as key conditions line up to support further upside for bullion. Low interest rates, a weakening US dollar, rising inflation concerns globally, and an array of simmering geopolitical conflicts should all conspire to keep safe haven demand elevated.
“There is simply less leverage this time around versus 2011 in gold,” said Nicky Shiels of MKS PAMP, noting that the current dynamics put $2,200/oz within reach. Other experts concur, with UOB strategist Heng Koon How targeting $2,200 gold by end-2024, and TD Securities anticipating average prices around $2,100 in Q2 2024.
Fueling this gold fever has been robust central bank buying, especially across emerging markets. Recent data shows 24% of central banks worldwide intend to pad their gold reserves over the next year as economic uncertainty persists. With these institutions showing waning faith in traditional reserve assets like the US dollar, their bullion accumulation provides a sturdy pillar of support.
Geopolitical Flare-Ups Stoke Safe Haven Appeal
Mounting geopolitical tensions represent another propellant behind gold’s rise. The bloody conflict between Israel and Palestine has recently stoked investor fears, driving many towards gold’s relative stability. Looking ahead, strategists believe various other hotspots could flare up and lift bullion demand more.
Besides the Middle East, worsening frictions between China and Taiwan or a resurgence of the crisis in Ukraine could shock markets. And if the US gets dragged into any new foreign entanglements, it may have to ramp up defense spending and borrowing, potentially weakening both growth and the dollar.
With so many risks swirling, portfolio managers and retail buyers appear increasingly eager to hedge with gold. Notably, demand has climbed even as gold prices touched multi-year highs. This underscores bullion’s unique status as a tried-and-true safe haven asset.
Fed Policy Outlook Could Offer Further Boost
Though gold has powered higher despite a spate of Fed rate hikes, any change in this tightening cycle would provide another major catalyst. After lifting interest rates rapidly from near-zero, policymakers must now decide whether to keep tightening or ease off the brakes.
Several officials, including Governor Christopher Waller, have hinted rates may not rise much further if inflation keeps slowing as expected. Markets thus see potential Fed rate cuts arriving sometime in 2024.
If implemented, this dovish shift would likely hamstring the dollar and bond yields, stirring more demand for non-interest-bearing gold. Hence analysts view Fed pivots as a probable linchpin that keeps prices locked above $2,000 over the next couple of years.
With stars aligned for gold both fundamentally and geopolitically, all the ingredients seem in place for its dazzling run to continue. That leaves bulls dreaming ever more ambitiously of how high prices could yet soar. However, given gold’s inherent volatility, traders should steel themselves for pullbacks as well while enjoying the ride upwards.
Mark Reichman, Managing Director, Equity Research Analyst, Natural Resources, Noble Capital Markets, Inc.
Refer to the full report for the price target, fundamental analysis, and rating.
Feasibility study expected by year-end. During the third quarter, Century Lithium focused on pilot plant operations and completing the Clayton Valley Lithium Project feasibility study which is expected by year-end. Estimates for the feasibility study have been updated based on optimization and evaluation of economic scenarios, including the start-up schedule and potential by-products, including sodium hydroxide. Most of the work remaining is focused on completion of the economic model, sensitivity analysis, and finalizing capital and operating costs.
Collaboration with Koch. Century’s collaboration with Koch Technology Solutions on the direct lithium extraction (DLE) section of the pilot plant continues with results to date meeting expectations. The company has achieved an average lithium recovery rate of 85% and average DLE recovery greater than 99.5% with continued success in producing battery grade lithium carbonate from pilot plant solutions treated at Saltworks Technologies Inc.
Equity Research is available at no cost to Registered users of Channelchek. Not a Member? Click ‘Join’ to join the Channelchek Community. There is no cost to register, and we never collect credit card information.
This Company Sponsored Research is provided by Noble Capital Markets, Inc., a FINRA and S.E.C. registered broker-dealer (B/D).
*Analyst certification and important disclosures included in the full report. NOTE: investment decisions should not be based upon the content of this research summary. Proper due diligence is required before making any investment decision.
Defense Metals Corp. is a mineral exploration and development company focused on the acquisition, exploration and development of mineral deposits containing metals and elements commonly used in the electric power market, defense industry, national security sector and in the production of green energy technologies, such as, rare earths magnets used in wind turbines and in permanent magnet motors for electric vehicles. Defense Metals owns 100% of the Wicheeda Rare Earth Element Property located near Prince George, British Columbia, Canada. Defense Metals Corp. trades in Canada under the symbol “DEFN” on the TSX Venture Exchange, in the United States, under “DFMTF” on the OTCQB and in Germany on the Frankfurt Exchange under “35D”.
Mark Reichman, Managing Director, Equity Research Analyst, Natural Resources, Noble Capital Markets, Inc.
Refer to the full report for the price target, fundamental analysis, and rating.
Mineral resource update. Defense Metals recently filed a NI 43-101 compliant mineral resource estimate (MRE) technical report for the Wicheeda Rare Earth Element (REE) Project. The 2023 mineral resource estimate, discussed in our research note dated September 13, represents an 18.2% increase in total rare earth oxide (TREO) and a 31.3% in tonnage compared to the 2021 MRE. Total measured and indicated mineral resources of 34.2 million tonnes, averaging 2.02% TREO is a significant upgrade compared to the previous estimate and can be included in the mine plan for the preliminary feasibility study that is expected to be completed in the first half of 2024.
Laying the ground work for off-take agreements. On Defense Metals’ behalf, SGS Canada shipped samples of mixed rare earth oxide and mixed rare earth carbonate to select processors, refiners, and metals traders in North America (2), Europe (2), and Asia (2). The shipments represent an important step toward future off-take agreements or strategic partnership opportunities. The company estimates a universe of 10 to 12 potential customers and so another set of shipments is expected.
Equity Research is available at no cost to Registered users of Channelchek. Not a Member? Click ‘Join’ to join the Channelchek Community. There is no cost to register, and we never collect credit card information.
This Company Sponsored Research is provided by Noble Capital Markets, Inc., a FINRA and S.E.C. registered broker-dealer (B/D).
*Analyst certification and important disclosures included in the full report. NOTE: investment decisions should not be based upon the content of this research summary. Proper due diligence is required before making any investment decision.
Wednesday, November 29, 2023
Defense Metals Corp. is a mineral exploration and development company focused on the acquisition, exploration and development of mineral deposits containing metals and elements commonly used in the electric power market, defense industry, national security sector and in the production of green energy technologies, such as, rare earths magnets used in wind turbines and in permanent magnet motors for electric vehicles. Defense Metals owns 100% of the Wicheeda Rare Earth Element Property located near Prince George, British Columbia, Canada. Defense Metals Corp. trades in Canada under the symbol “DEFN” on the TSX Venture Exchange, in the United States, under “DFMTF” on the OTCQB and in Germany on the Frankfurt Exchange under “35D”.
Mark Reichman, Managing Director, Equity Research Analyst, Natural Resources, Noble Capital Markets, Inc.
Refer to the full report for the price target, fundamental analysis, and rating.
Mineral resource update. Defense Metals recently filed a NI 43-101 compliant mineral resource estimate (MRE) technical report for the Wicheeda Rare Earth Element (REE) Project. The 2023 mineral resource estimate, discussed in our research note dated September 13, represents an 18.2% increase in total rare earth oxide (TREO) and a 31.3% in tonnage compared to the 2021 MRE. Total measured and indicated mineral resources of 34.2 million tonnes, averaging 2.02% TREO is a significant upgrade compared to the previous estimate and can be included in the mine plan for the preliminary feasibility study that is expected to be completed in the first half of 2024.
Laying the ground work for off-take agreements. On Defense Metals’ behalf, SGS Canada shipped samples of mixed rare earth oxide and mixed rare earth carbonate to select processors, refiners, and metals traders in North America (2), Europe (2), and Asia (2). The shipments represent an important step toward future off-take agreements or strategic partnership opportunities. The company estimates a universe of 10 to 12 potential customers and so another set of shipments is expected.
Equity Research is available at no cost to Registered users of Channelchek. Not a Member? Click ‘Join’ to join the Channelchek Community. There is no cost to register, and we never collect credit card information.
This Company Sponsored Research is provided by Noble Capital Markets, Inc., a FINRA and S.E.C. registered broker-dealer (B/D).
*Analyst certification and important disclosures included in the full report. NOTE: investment decisions should not be based upon the content of this research summary. Proper due diligence is required before making any investment decision.
TULSA, Okla.–(BUSINESS WIRE)– Alliance Resource Partners, L.P. (NASDAQ: ARLP) today announced that the Company will attend the NobleCon19 – Noble Capital Markets 19th Annual Emerging Growth Equity Conference in Boca Raton, FL on Monday, December 4, 2023.
About Alliance Resource Partners, L.P.
ARLP is a diversified energy company that is currently the largest coal producer in the eastern United States, supplying reliable, affordable energy domestically and internationally to major utilities, metallurgical and industrial users. ARLP also generates operating and royalty income from mineral interests it owns in strategic coal and oil & gas producing regions in the United States. In addition, ARLP is evolving and positioning itself as a reliable energy partner for the future by pursuing opportunities that support the advancement of energy and related infrastructure.
News, unit prices and additional information about ARLP, including filings with the Securities and Exchange Commission (“SEC”), are available at www.arlp.com. For more information, contact the investor relations department of ARLP at (918) 295-7673 or via e-mail at investorrelations@arlp.com.
Investor Relations Contact Cary P. Marshall Senior Vice President and Chief Financial Officer 918-295-7673 investorrelations@arlp.com
Mark Reichman, Managing Director, Equity Research Analyst, Natural Resources, Noble Capital Markets, Inc.
Refer to the full report for the price target, fundamental analysis, and rating.
Board appointment. Mr. Kiran Patankar has been appointed President and Chief Executive Officer and has joined the company’s Board of Directors. He has served as Interim President and Chief Executive Officer since August. Mr. Patankar has led the execution of Maple Gold’s updated corporate strategy, which includes a detailed assessment of the company’s district-scale projects. We believe he will reshape the company into a leaner and more focused entity with an emphasis on value-added exploration.
Reining in costs. In 2020, 2021, and 2022, Maple Gold’s general and administrative expenses were C$3.0 million, C$4.9 million, and C$5.9 million, respectively, and C$2.8 million for the first six months of 2023. Third quarter G&A expenses were $0.4 million. Based on third quarter financials, Mr. Patankar is making excellent progress reducing corporate overhead costs. As the operating partner, we expect the company to be judicious with its capital and that of its joint venture partner, Agnico Eagle Mines. As of September 30, Maple Gold Mines reported cash and cash equivalents amounting to C$4.4 million and marketable securities amounting to C$336.4 thousand. Approximately $6.0 million of Douay-Joutel joint venture funding remains available through January 2025 from Agnico Eagle.
Equity Research is available at no cost to Registered users of Channelchek. Not a Member? Click ‘Join’ to join the Channelchek Community. There is no cost to register, and we never collect credit card information.
This Company Sponsored Research is provided by Noble Capital Markets, Inc., a FINRA and S.E.C. registered broker-dealer (B/D).
*Analyst certification and important disclosures included in the full report. NOTE: investment decisions should not be based upon the content of this research summary. Proper due diligence is required before making any investment decision.
Mark Reichman, Managing Director, Equity Research Analyst, Natural Resources, Noble Capital Markets, Inc.
Refer to the full report for the price target, fundamental analysis, and rating.
Impressive DLE test work results. Results from bench-scale G2L Greenview direct lithium extraction (DLE) test work on brine from LithiumBank’s Boardwalk lithium brine project produced a high-purity concentrated brine, or eluate, with lithium concentrations between 3,000 and 7,000 milligrams per liter with greater than 98% recovery of lithium from the brine and low levels of impurities.
Potential to reduce project operating costs. Lower cost reagents used in the G2L DLE processing are approximately a third of the cost of those used in the DLE process that was used in the company’s maiden Boardwalk PEA published in May 2023. The results are expected to be included in an updated Boardwalk PEA expected in late 2023.
Equity Research is available at no cost to Registered users of Channelchek. Not a Member? Click ‘Join’ to join the Channelchek Community. There is no cost to register, and we never collect credit card information.
This Company Sponsored Research is provided by Noble Capital Markets, Inc., a FINRA and S.E.C. registered broker-dealer (B/D).
*Analyst certification and important disclosures included in the full report. NOTE: investment decisions should not be based upon the content of this research summary. Proper due diligence is required before making any investment decision.
Mark Reichman, Managing Director, Equity Research Analyst, Natural Resources, Noble Capital Markets, Inc.
Refer to the full report for the price target, fundamental analysis, and rating.
Drilling program. Labrador Gold currently has two drill rigs operating at its Kingsway gold project. One drill is operating at the Knobby discovery, while the other is operating in the Gap Zone between the Big Vein and Pristine targets. A third rig will likely be deployed in early December at the Golden Glove target. Drilling will test the area south of the Big Vein target to the southern boundary of the property which encompasses the Knobby discovery and Golden Glove. Once drilling is completed in the Gap Zone, the number of rigs operating will be two. Knobby is a priority target since the east-west strike crosscuts the regional northeast trend like structures known to host high-grade gold in quartz veins within the district.
Acquisition of the Hopedale property. Labrador Gold fulfilled the requirements of the Hopedale option agreement and exercised its option to acquire 100% of the four licenses covering 695 claims comprising the Hopedale property. Work to date by Labrador Gold has resulted in the discovery of three gold occurrences, which together with the previously known Thurber Dog occurrence, stretch over a 3-kilometer section of the northern portion of the Florence Lake greenstone belt.
Equity Research is available at no cost to Registered users of Channelchek. Not a Member? Click ‘Join’ to join the Channelchek Community. There is no cost to register, and we never collect credit card information.
This Company Sponsored Research is provided by Noble Capital Markets, Inc., a FINRA and S.E.C. registered broker-dealer (B/D).
*Analyst certification and important disclosures included in the full report. NOTE: investment decisions should not be based upon the content of this research summary. Proper due diligence is required before making any investment decision.
Vancouver, British Columbia–(Newsfile Corp. – November 22, 2023) – Maple Gold Mines Ltd. (TSXV: MGM) (OTCQB: MGMLF) (FSE: M3G) (“Maple Gold” or the “Company“) today announced that its Board of Directors has appointed Mr. Kiran Patankar to the positions of President and Chief Executive Officer, effective immediately. Mr. Patankar had served as Interim President and Chief Executive Officer since August 28, 2023. Mr. Patankar has also joined the Board of Directors of Maple Gold.
“We are pleased to appoint Kiran Patankar as President and Chief Executive Officer of Maple Gold,” stated Michelle Roth, Maple Gold’s Chairperson, speaking on behalf of the Board. “From the time he was appointed Interim President and Chief Executive Officer in August 2023, Kiran has spearheaded the execution of the Company’s updated corporate strategy, which includes a thorough assessment of our district-scale Québec gold projects. He has fostered alignment between our technical team and our strategic and joint venture partner to improve exploration targeting and optimize results, while also driving significant overhead cost reductions. Kiran is an experienced corporate leader with a track record of successful team building and deep mining industry connections. We are fortunate to be able to harness his skills, temperament and steady hand to steer the Company in a new direction to enhance shareholder value.”
“I am delighted and honored to lead Maple Gold into its next phase of growth,” stated Kiran Patankar, President and CEO of Maple Gold. “While current market conditions remain challenging for junior gold explorers, our strong financial position, including nearly C$5 million of available liquidity as of September 30, 2023, combined with cost reduction efforts and a new value-oriented exploration approach in ongoing partnership with Canada’s largest gold producer ideally positions the Company to discover the next major gold camp in Québec’s prolific Abitibi Greenstone Belt. I look forward to working with the dedicated team and Board of Directors at Maple Gold to build upon the Company’s strong foundation and contribute to its future success.”
Mr. Patankar has more than 15 years of senior leadership experience in the mining industry. He has served as Maple Gold’s Interim President and Chief Executive Officer since August 2023, after serving as the Company’s Chief Financial Officer since 2022 and its Senior Vice President, Growth Strategy since 2021. From 2015 to 2018, Mr. Patankar served as President, CEO and a Director of two TSX-V listed gold exploration and development companies, where he led growth initiatives and orchestrated successful company turnarounds. As an investment banker with leading Canadian and global financial institutions from 2007 to 2014, he worked exclusively with mining companies on strategic corporate matters and executed M&A and corporate finance transactions totaling more than C$3 billion in value. Mr. Patankar holds a Bachelor of Science in Geological Engineering from the Colorado School of Mines and an MBA from the Yale School of Management.
Q3 2023 Financial Results
The Company filed its Q3 2023 Financial Statements and MD&A on SEDAR+ (www.sedarplus.ca) on November 20, 2023. The Company’s Q3 2023 Financial Statements and MD&A are also available on the Company’s website (www.maplegoldmines.com).
Equity Incentive Plan Grants
Pursuant to its Equity Incentive Plan (the “Plan”) dated December 17, 2020, as amended, and the policies of the TSX Venture Exchange, the Company’s Board of Directors granted stock options (“Options”) and Restricted Share Units (“RSUs”) to certain employees, officers, directors and consultants. The Company granted Options to purchase an aggregate of 3,825,000 common shares of the Company (each, a “Common Share”), with an exercise price of $0.06 per Common Share. Each Option grant vests in three equal tranches over a 24-month period. Once vested, each Option is exercisable into one Common Share for a period of five years from the date of the grant. The Company also granted a total of 400,000 RSUs. Each RSU grant vests in three equal tranches over a 24-month period. Once vested, each RSU entitles the holder thereof to receive either one Common Share, the cash equivalent of one Common Share or a combination of cash and Common Shares, as determined by the Company, net of applicable withholdings.
The Company also terminated an aggregate of 4,125,000 Options that were previously granted to certain former employees and consultants who are no longer providing services to the Company.
About Maple Gold
Maple Gold Mines Ltd. is a Canadian advanced exploration company in a 50/50 joint venture with Agnico Eagle Mines Limited to jointly advance the district-scale Douay and Joutel gold projects located in Québec’s prolific Abitibi Greenstone Gold Belt. The projects benefit from exceptional infrastructure access and boast ~400 km2 of highly prospective ground including an established gold resource at Douay (SLR 2022) that holds significant expansion potential as well as the past-producing Eagle, Telbel and Eagle West mines at Joutel. In addition, the Company holds an exclusive option to acquire 100% of the Eagle Mine Property.
The district-scale property package also hosts a significant number of regional exploration targets along a 55 km strike length of the Casa Berardi Deformation Zone that have yet to be tested through drilling, making the project ripe for new gold and polymetallic discoveries. The Company is well capitalized and is currently focused on carrying out exploration and drill programs to grow resources and make new discoveries to establish an exciting new gold district in the heart of the Abitibi. For more information, please visit www.maplegoldmines.com.
NEITHER THE TSX VENTURE EXCHANGE NOR ITS REGULATION SERVICES PROVIDER (AS THAT TERM IS DEFINED IN THE POLICIES OF THE TSX VENTURE EXCHANGE) ACCEPTS RESPONSIBILITY FOR THE ADEQUACY OR ACCURACY OF THIS PRESS RELEASE.
Forward-Looking Statements:
This press release contains “forward-looking information” and “forward-looking statements” (collectively referred to as “forward-looking statements”) within the meaning of applicable Canadian securities legislation in Canada, including statements about exploration work and results from current and future work programs. Forward-Looking statements are based on assumptions, uncertainties and management’s best estimate of future events. Actual events or results could differ materially from the Company’s expectations and projections. Investors are cautioned that forward-looking statements involve risks and uncertainties. Accordingly, readers should not place undue reliance on forward-looking statements. For a more detailed discussion of such risks and other factors that could cause actual results to differ materially from those expressed or implied by such forward-looking statements, refer to Maple Gold Mines Ltd.’s filings with Canadian securities regulators available on www.sedarplus.ca or the Company’s website at www.maplegoldmines.com. The Company does not intend, and expressly disclaims any intention or obligation to, update or revise any forward-looking statements whether as a result of new information, future events or otherwise, except as required by law.
Vancouver, British Columbia–(Newsfile Corp. – November 21, 2023) – Hemisphere Energy Corporation (TSXV: HME)(OTCQX: HMENF) (“Hemisphere” or the “Company”) is pleased to provide its financial and operating results for the three and nine months ended September 30, 2023, announce the declaration of a quarterly dividend payment to shareholders, and provide an operations update.
Q3 2023 Highlights
Second best quarter in corporate history for production, revenue, operating field netback, and adjusted funds flow from operations (“AFF”)1.
Produced an average of 3,056 boe/d for the third quarter of 2023, a 6% increase over the same quarter last year.
Attained third quarter revenue of $24.3 million, a 3% increase over the third quarter last year.
Delivered an operating field netback1 of $15.9 million or $56.40/boe for the quarter.
Realized quarterly adjusted funds flow from operations (AFF) of $11.7 million or $41.70/boe.
Announced Hemisphere’s first ever special dividend to shareholders of $0.03 per common share ($3.0 million), paid on November 1, 2023.
Distributed $0.025 per common share ($2.5 million) in quarterly dividends to shareholders in accordance with the Company’s dividend policy.
Exited the third quarter of 2023 with a positive working capital1 position of $2.2 million, compared to net debt1 of $0.7 million at September 30, 2022.
Renewed the Company’s Normal Course Issuer Bid (“NCIB”).
Purchased and cancelled 519,400 shares under the Company’s NCIB during the third quarter (at an average price of $1.23 per common share).
(1) Operating field netback, adjusted funds flow from operations (AFF), free funds flow, working capital, and net debt are non-IFRS measures that do not have any standardized meaning under IFRS and therefore may not be comparable to similar measures presented by other entities. Non-IFRS financial ratios are not standardized financial measures under IFRS and may not be comparable to similar financial measures disclosed by other issuers. Refer to the section “Non-IFRS and Other Specified Financial Measures”.
Selected financial and operational highlights should be read in conjunction with Hemisphere’s Financial Statements and related Management’s Discussion and Analysis for the quarter ended September 30, 2023, which are available on SEDAR+ at www.sedarplus.ca and on Hemisphere’s website at www.hemisphereenergy.ca. All amounts are expressed in Canadian dollars unless otherwise noted.
Quarterly Dividend and Shareholder Return
Hemisphere is pleased to announce that its Board of Directors has approved a quarterly cash dividend of $0.025 per common share in accordance with the Company’s dividend policy. The dividend will be paid on December 28, 2023 to shareholders of record as of the close of business on December 15, 2023. The dividend is designated as an eligible dividend for income tax purposes.
With $13.1 million distributed through quarterly and special dividends by year-end and $3.7 million spent on NCIB year-to-date, a minimum of $16.8 million is anticipated to have been returned to shareholders in 2023. Based on the Company’s current market capitalization of $128 million (99.7 million shares issued and outstanding at market close price of $1.28 per share on November 20, 2023), this represents an annualized yield of 13% to Hemisphere’s shareholders.
Operations Update
During the third quarter, Hemisphere completed the majority of its planned 2023 capital expenditure program. By the end of September, the Company had brought on 7 new wells and completed one new well as an injector in the Atlee Buffalo area. Subsequent to quarter-end, the Company also shut one producing well in to convert it to an injector.
Current corporate production sits at approximately 3,350 boe/d (99% heavy oil, based on field estimates between October 1 – November 15, 2023). The Company’s assets continue to perform well under Enhanced Oil Recovery (“EOR”) with current corporate production almost 20% higher than full-year 2022 production, which was just over 2,800 boe/d. Operating and transportation costs during the first nine months of 2023 total just $13.68/boe, and are fully reflective of the chemical costs required for the Company’s two EOR projects. This makes Hemisphere one of the lowest cost operators of heavy oil in the Canadian oil industry.
Looking ahead into 2024, Hemisphere is actively preparing for a new pilot polymer flood on its recently acquired land base. Management anticipates that a test pad could be drilled and on production with a polymer skid installed by as early as July 2024. The Company expects to release more details on its 2024 guidance in January.
About Hemisphere Energy Corporation
Hemisphere is a dividend-paying Canadian oil company focused on maximizing value per share growth with the sustainable development of its high netback, ultra-low decline conventional heavy oil assets using EOR techniques. Hemisphere trades on the TSX Venture Exchange as a Tier 1 issuer under the symbol “HME” and on the OTCQX Venture Marketplace under the symbol “HMENF”.
For further information, please visit the Company’s website at www.hemisphereenergy.ca to view its corporate presentation or contact:
Don Simmons, President & Chief Executive Officer Telephone: (604) 685-9255 Email: info@hemisphereenergy.ca
Certain statements included in this news release constitute forward-looking statements or forward-looking information (collectively, “forward-looking statements”) within the meaning of applicable securities legislation. Forward-looking statements are typically identified by words such as “anticipate”, “continue”, “estimate”, “expect”, “forecast”, “may”, “will”, “project”, “could”, “plan”, “intend”, “should”, “believe”, “outlook”, “potential”, “target” and similar words suggesting future events or future performance. In particular, but without limiting the generality of the foregoing, this news release includes forward-looking statements including that a dividend will be paid December 28, 2023 to shareholders of record as of the close of business on December 15, 2023; that a minimum of $16.8 million is anticipated to have been returned to shareholders in 2023; Hemisphere’s plans for a new pilot polymer flood on its recently acquired land base and the timing for test pad drilling, polymer skid installation, and production dates thereof; and timing for further details on its planned operations or guidance.
Forward‐looking statements are based on a number of material factors, expectations or assumptions of Hemisphere which have been used to develop such statements and information, but which may prove to be incorrect. Although Hemisphere believes that the expectations reflected in such forward‐looking statements or information are reasonable, undue reliance should not be placed on forward‐looking statements because Hemisphere can give no assurance that such expectations will prove to be correct. In addition to other factors and assumptions which may be identified herein, assumptions have been made regarding, among other things: the current and go-forward oil price environment; that Hemisphere will continue to conduct its operations in a manner consistent with past operations; that results from drilling and development activities are consistent with past operations; the quality of the reservoirs in which Hemisphere operates and continued performance from existing wells; the effects of inflation of Hemisphere’s budgeted costs; the perspectivity of recently acquired properties and the timing and manner to explore and develop the same; the continued and timely development of infrastructure in areas of new production; the accuracy of the estimates of Hemisphere’s reserve volumes; certain commodity price and other cost assumptions; continued availability of debt and equity financing and cash flow to fund Hemisphere’s current and future plans and expenditures; the impact of increasing competition; the general stability of the economic and political environment in which Hemisphere operates; the general continuance of current industry conditions; the timely receipt of any required regulatory approvals; the ability of Hemisphere to obtain qualified staff, equipment and services in a timely and cost efficient manner; drilling results; the ability of the operator of the projects in which Hemisphere has an interest in to operate the field in a safe, efficient and effective manner; the ability of Hemisphere to obtain financing on acceptable terms; field production rates and decline rates; the ability to replace and expand oil and natural gas reserves through acquisition, development and exploration; the timing and cost of pipeline, storage and facility construction and expansion and the ability of Hemisphere to secure adequate product transportation; future commodity prices; currency, exchange and interest rates; regulatory framework regarding royalties, taxes and environmental matters in the jurisdictions in which Hemisphere operates; and the ability of Hemisphere to successfully market its oil and natural gas products.
The forward‐looking statements included in this news release are not guarantees of future performance and should not be unduly relied upon. Such information and statements, including the assumptions made in respect thereof, involve known and unknown risks, uncertainties and other factors that may cause actual results or events to defer materially from those anticipated in such forward‐looking statements including, without limitation: changes in commodity prices; changes in the demand for or supply of Hemisphere’s products, the early stage of development of some of the evaluated areas and zones; unanticipated operating results or production declines; changes in tax or environmental laws, royalty rates or other regulatory matters; changes in development plans of Hemisphere or by third party operators of Hemisphere’s properties, increased debt levels or debt service requirements; inaccurate estimation of Hemisphere’s oil and gas reserve volumes; limited, unfavourable or a lack of access to capital markets; increased costs; a lack of adequate insurance coverage; the impact of competitors; and certain other risks detailed from time‐to‐time in Hemisphere’s public disclosure documents, (including, without limitation, those risks identified in this news release and in Hemisphere’s Annual Information Form).
The forward‐looking statements contained in this news release speak only as of the date of this news release, and Hemisphere does not assume any obligation to publicly update or revise any of the included forward‐looking statements, whether as a result of new information, future events or otherwise, except as may be required by applicable securities laws.
Market, Independent Third Party and Industry Data
This news release set forth Hemisphere’s belief with respect to being one of the lowest cost operators of heavy oil in the Canadian oil industry. Such statement is based, in part, on third party information, including from industry participant public filings or government or other independent industry publications and reports or based on estimates derived from such publications and reports. Government and industry publications and reports generally indicate that they have obtained their information from sources believed to be reliable, but Hemisphere has not conducted its own independent verification of such information. This news release also includes certain data derived from independent third parties. While Hemisphere believes this data to be reliable, market and industry data is subject to variations and cannot be verified with complete certainty due to limits on the availability and reliability of raw data, the voluntary nature of the data gathering process and other limitations and uncertainties inherent in any statistical survey. Hemisphere has not independently verified any of the data from independent third party sources referred to in this news release or ascertained the underlying assumptions relied upon by such sources.
Non-IFRS and Other Financial Measures
This news release contains the terms adjusted funds flow from operations, operating field netback and operating netback, capital expenditures and working capital/net debt, which are considered “non-IFRS financial measures” and any of these measures calculated on a per boe or share basis, which are considered “non-IFRS financial ratios”. These terms do not have a standardized meaning prescribed by IFRS. Accordingly, the Company’s use of these terms may not be comparable to similarly defined measures presented by other companies. Investors are cautioned that these measures should not be construed as an alternative to net income (loss) or cashflow from operations determined in accordance with IFRS and these measures should not be considered to be more meaningful than IFRS measures in evaluating the Company’s performance.
a) Adjusted funds flow from operations “AFF” (Non-IFRS Financial Measure and Ratio if calculated on a per boe basis): the Company considers AFF to be a key measure that indicates the Company’s ability to generate the funds necessary to support future growth through capital investment and to repay any debt. AFF is a measure that represents cash flow generated by operating activities, before changes in non-cash working capital and adjusted for decommissioning expenditures, and may not be comparable to measures used by other companies. The most directly comparable IFRS measure for AFF is cash provided by operating activities. AFF per share is calculated using the same weighted-average number of shares outstanding as in the case of the earnings per share calculation for the period. AFF per boe is calculated by dividing AFF by the total production in boe for the reporting period.
A reconciliation of AFF to cash provided by operating activities is presented as follows:
d) Operating field netback (Non-IFRS Financial Measure and Ratio if calculated on a per boe basis): is a benchmark used in the oil and natural gas industry and a key indicator of profitability relative to current commodity prices. Operating field netback is calculated as oil and gas sales, less royalties, operating expenses and transportation costs on an absolute and per barrel of oil equivalent basis. These terms should not be considered an alternative to, or more meaningful than, cash flow from operating activities or net income or loss as determined in accordance with IFRS as an indicator of the Company’s performance.
e) Operating netback (Non-IFRS Financial Measure and Ratio if calculated on a per boe basis): calculated as the operating field netback plus the Company’s realized commodity hedging gain (loss) on an absolute and per barrel of oil equivalent basis.
f) Working Capital/Net debt (Non-IFRS Financial Measure): is closely monitored by the Company to ensure that its capital structure is maintained by a strong balance sheet to fund the future growth of the Company. Working capital/Net debt is used in this document in the context of liquidity and is calculated as the total of the Company’s current assets, less current liabilities, excluding the fair value of financial instruments, decommissioning obligations, and lease liabilities, and including any bank debt. There is no IFRS measure that is reasonably comparable to working capital/net debt.
g)Supplementary Financial Measures and Non-GAAP Ratios
“Transportation costs per boe” is comprised of transportation expense, as determined in accordance with IFRS, divided by the Company’s total production.
The Company has provided additional information on how these measures are calculated in the Management’s Discussion and Analysis for the year ended December 31, 2022 and the interim period ended September 30, 2023, which are available under the Company’s SEDAR+ profile at www.sedarplus.ca.
Oil and Gas Advisories
Any references in this news release to production rates, which may include initial production rates for certain wells (including as a result of recent EOR activities), may be useful in confirming the presence of hydrocarbons; however, such rates are not determinative of the rates at which such wells will continue production and decline thereafter and are not necessarily indicative of long-term performance or ultimate recovery. While encouraging, readers are cautioned not to place reliance on such rates in calculating the aggregate production for the Company. Such rates are based on field estimates and may be based on limited data available at this time.
A barrel of oil equivalent (“boe”) may be misleading, particularly if used in isolation. A boe conversion ratio of 6 Mcf:1 Bbl is based on an energy equivalency conversion method primarily applicable at the burner tip and does not represent a value equivalency at the wellhead. In addition, given that the value ratio based on the current price of crude oil as compared to natural gas is significantly different from the energy equivalency of 6:1, utilizing a conversion on a 6:1 basis may be misleading as an indication of value.
Definitions and Abbreviations
bbl
Barrel
Mcf
thousand cubic feet
bbl/d
barrels per day
Mcf/d
thousand cubic feet per day
$/bbl
dollar per barrel
$/Mcf
dollar per thousand cubic feet
boe
barrel of oil equivalent
IFRS
International Financial Reporting Standards
boe/d
barrel of oil equivalent per day
$/boe
dollar per barrel of oil equivalent
US$
United States Dollar
Neither the TSX Venture Exchange nor its Regulation Services Provider (as that term is defined in the policies of the TSX Venture Exchange) accepts responsibility for the adequacy or accuracy of this news release.
Haynes International, Inc. is a leading developer, manufacturer and marketer of technologically advanced, nickel and cobalt-based high-performance alloys, primarily for use in the aerospace, industrial gas turbine and chemical processing industries.
Mark Reichman, Managing Director, Equity Research Analyst, Natural Resources, Noble Capital Markets, Inc.
Refer to the full report for the price target, fundamental analysis, and rating.
Fourth quarter and fiscal year 2023 financial results. Haynes reported fourth-quarter net income of $13.1 million or $1.02 per share compared to $16.3 million or $1.30 per share during the prior year period. Fiscal year 2023 net income was $42.0 million or $3.26 per share compared to $45.1 million or $3.57 per share during the prior period. We had forecast fourth quarter and fiscal year 2023 net income of $12.4 million and $41.1 million, respectively, or $0.97 per share and $3.22 per share. Compared to the prior year periods, fourth quarter and fiscal year net revenues increased by 11.7% and 20.3%, respectively, to $160.6 million and $590.0 million. On a year-over-year basis, the product average selling price during the fourth quarter and fiscal year increased 11.5% and 14.9%, respectively. Fiscal year 2023 adjusted EBITDA increased to $79.0 million compared to $77.4 million in fiscal year 2022.
Updating estimates. While our 2024 EPS estimate remains $4.50, we have made some quarterly adjustments. Revenue and earnings in the first quarter of fiscal 2024 are expected to be higher compared to the first quarter of fiscal 2023, but lower than the fourth quarter of fiscal 2023. First quarter results are generally lower due to holidays and planned equipment maintenance. Additionally, management expects commodity price fluctuations to have a greater negative impact in the first quarter of fiscal 2024 than in the fourth quarter of fiscal year 2023. We project fiscal 2024 EBITDA of $100.3 million compared to our $104.3 million estimate.
Equity Research is available at no cost to Registered users of Channelchek. Not a Member? Click ‘Join’ to join the Channelchek Community. There is no cost to register, and we never collect credit card information.
This Company Sponsored Research is provided by Noble Capital Markets, Inc., a FINRA and S.E.C. registered broker-dealer (B/D).
*Analyst certification and important disclosures included in the full report. NOTE: investment decisions should not be based upon the content of this research summary. Proper due diligence is required before making any investment decision.
Haynes International, Inc. is a leading developer, manufacturer and marketer of technologically advanced, nickel and cobalt-based high-performance alloys, primarily for use in the aerospace, industrial gas turbine and chemical processing industries.
Mark Reichman, Managing Director, Equity Research Analyst, Natural Resources, Noble Capital Markets, Inc.
Refer to the full report for the price target, fundamental analysis, and rating.
Fourth quarter and fiscal year 2023 financial results. Haynes International reported fourth quarter net income of $13.1 million or $1.02 per share compared to $16.3 million or $1.30 per share during the prior year period. Fiscal year 2023 net income was $42.0 million or $3.26 per share compared to $45.1 million or $3.57 per share during the prior period. We had forecast fourth quarter and fiscal year 2023 net income of $12.4 million and $41.1 million, respectively, or $0.97 per share and $3.22 per share. Compared to the prior year periods, fourth quarter and fiscal year net revenues increased by 11.7% and 20.3%, respectively, to $160.6 million and $590.0 million. On a year-over year basis, the product average selling price during the fourth quarter and fiscal year increased 11.5% and 14.9%, respectively. Fiscal year 2023 adjusted EBITDA increased to $79.0 million compared to $77.4 million in fiscal year 2022.
Strong order backlog. Compared to the September 2022 quarter, the company’s order backlog increased 23.2% to $460.4 million although it declined by $7.7 million compared to the prior quarter. Haynes added production headcount and invested in inventory to increase shipping levels and net revenue. The strong order backlog has been driven by strength in aerospace and industrial gas turbine demand.
Equity Research is available at no cost to Registered users of Channelchek. Not a Member? Click ‘Join’ to join the Channelchek Community. There is no cost to register, and we never collect credit card information.
This Company Sponsored Research is provided by Noble Capital Markets, Inc., a FINRA and S.E.C. registered broker-dealer (B/D).
*Analyst certification and important disclosures included in the full report. NOTE: investment decisions should not be based upon the content of this research summary. Proper due diligence is required before making any investment decision.
Comstock (NYSE: LODE) innovates technologies that contribute to global decarbonization and circularity by efficiently converting under-utilized natural resources into renewable fuels and electrification products that contribute to balancing global uses and emissions of carbon. The Company intends to achieve exponential growth and extraordinary financial, natural, and social gains by building, owning, and operating a fleet of advanced carbon neutral extraction and refining facilities, by selling an array of complimentary process solutions and related services, and by licensing selected technologies to qualified strategic partners. To learn more, please visit www.comstock.inc.
Mark Reichman, Managing Director, Equity Research Analyst, Natural Resources, Noble Capital Markets, Inc.
Refer to the full report for the price target, fundamental analysis, and rating.
Fostering advanced exploration technologies. Comstock is collaborating with its strategic investee Quantum Generative Materials (GenMat) to develop and expand the next generation geostatistical digital model of its most strategic mining development areas, including the November launch of a space-based hyperspectral imager that will extract relevant chemical and physical information for high precision mineral prospecting. The goal is to incorporate innovative technology within its exploration activities to increase mineral resources to two million gold equivalent ounces.
Successful launch of satellite and imager. GENMAT-1 was launched via Maverick Space Systems aboard a SpaceX Falcon 9 Transporter rocket from Vandenberg Space Force Base in Lompoc, California on November 11. At an altitude of 500 kilometers, the satellite will continuously capture and transmit hyperspectral image data of minerals and surface matter. The initial mission is to capture hyperspectral data of the Comstock Lode.
Equity Research is available at no cost to Registered users of Channelchek. Not a Member? Click ‘Join’ to join the Channelchek Community. There is no cost to register, and we never collect credit card information.
This Company Sponsored Research is provided by Noble Capital Markets, Inc., a FINRA and S.E.C. registered broker-dealer (B/D).
*Analyst certification and important disclosures included in the full report. NOTE: investment decisions should not be based upon the content of this research summary. Proper due diligence is required before making any investment decision.
ARLP is a diversified natural resource company that generates operating and royalty income from coal produced by its mining complexes and royalty income from mineral interests it owns in strategic oil & gas producing regions in the United States, primarily the Permian, Anadarko and Williston basins. ARLP currently produces coal from seven mining complexes its subsidiaries operate in Illinois, Indiana, Kentucky, Maryland and West Virginia. ARLP also operates a coal loading terminal on the Ohio River at Mount Vernon, Indiana. ARLP markets its coal production to major domestic and international utilities and industrial users and is currently the second largest coal producer in the eastern United States. In addition, ARLP is positioning itself as an energy provider for the future by leveraging its core technology and operating competencies to make strategic investments in the fast growing energy and infrastructure transition.
Mark Reichman, Managing Director, Equity Research Analyst, Natural Resources, Noble Capital Markets, Inc.
Refer to the full report for the price target, fundamental analysis, and rating.
Refining estimates. We have increased our 2023 EBITDA and EPU estimates to $4.96 and $975.2 million from $966.2 million and $4.89. We decided to increase our total coal sales estimates which are now at the midpoint of guidance instead of at the low end. We also modestly increased our coal sales price per ton estimate to $65.15 from $65.00 but still within the guidance range of $64.50 to $66.00. We have lowered our 2024 EBITDA and EPU estimates to $998.1 million and $5.05 from $1.0 billion and $5.15 based on modestly lower commodity prices.
Why the revisions? Alliance has committed and priced 35.0 million tons in 2023, including 29.7 million tons in the domestic market and 5.3 million tonnes in export markets. While a portion of higher priced export volumes could be deferred into 2024, we think our previous estimate was too conservative. As part of our review, we also adjusted quarterly and full year 2024 estimates and refined both years’ estimates associated with equity method investments.
Equity Research is available at no cost to Registered users of Channelchek. Not a Member? Click ‘Join’ to join the Channelchek Community. There is no cost to register, and we never collect credit card information.
This Company Sponsored Research is provided by Noble Capital Markets, Inc., a FINRA and S.E.C. registered broker-dealer (B/D).
*Analyst certification and important disclosures included in the full report. NOTE: investment decisions should not be based upon the content of this research summary. Proper due diligence is required before making any investment decision.