The E.W. Scripps Company (NASDAQ: SSP) is a diversified media company focused on creating a better-informed world. As one of the nation’s largest local TV broadcasters, Scripps serves communities with quality, objective local journalism and operates a portfolio of 61 stations in 41 markets. The Scripps Networks reach nearly every American through the national news outlets Court TV and Newsy and popular entertainment brands ION, Bounce, Defy TV, Grit, ION Mystery, Laff and TrueReal. Scripps is the nation’s largest holder of broadcast spectrum. Scripps runs an award-winning investigative reporting newsroom in Washington, D.C., and is the longtime steward of the Scripps National Spelling Bee. Founded in 1878, Scripps has held for decades to the motto, “Give light and the people will find their own way.”
Michael Kupinski, Director of Research, Equity Research Analyst, Digital, Media & Technology , Noble Capital Markets, Inc.
Patrick McCann, Research Associate, Noble Capital Markets, Inc.
Refer to the full report for the price target, fundamental analysis, and rating.
Solid Q1 results. The company reported quarterly revenue of $527.8 million, in-line with our estimate of $531.5 million. Adj. EBITDA of $75.9 million in the quarter was 6% lower than our estimate of $80.8 million, attributed to lower than expected stock based compensation.
Favorable retransmission renewal. The company renewed 26% of its pay TV households in Q1, with a total of 75% of pay TV households up for renewal this year. As such, we expect strong Retrans revenue growth of 14% which should offset some of the headwinds from weak National and Direct Response advertising. Retransmission revenue is expected to be 50% of TV revenue and 30% of ttotal company revenue in 2023.
Equity Research is available at no cost to Registered users of Channelchek. Not a Member? Click ‘Join’ to join the Channelchek Community. There is no cost to register, and we never collect credit card information.
This Research is provided by Noble Capital Markets, Inc., a FINRA and S.E.C. registered broker-dealer (B/D).
*Analyst certification and important disclosures included in the full report. NOTE: investment decisions should not be based upon the content of this research summary. Proper due diligence is required before making any investment decision.
SANTA MONICA, Calif.–(BUSINESS WIRE)– Entravision Communications Corporation (NYSE: EVC), a leading global advertising solutions, media and technology company, today announced financial results for the three-month period ended March 31, 2023.
First Quarter 2023 Highlights
Record first quarter revenue
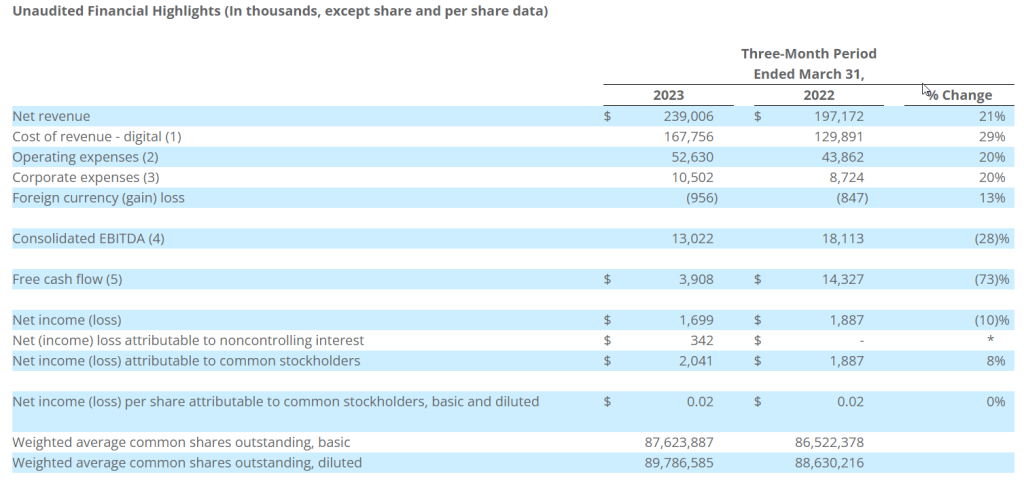
Net revenue up 21% over the prior-year quarter
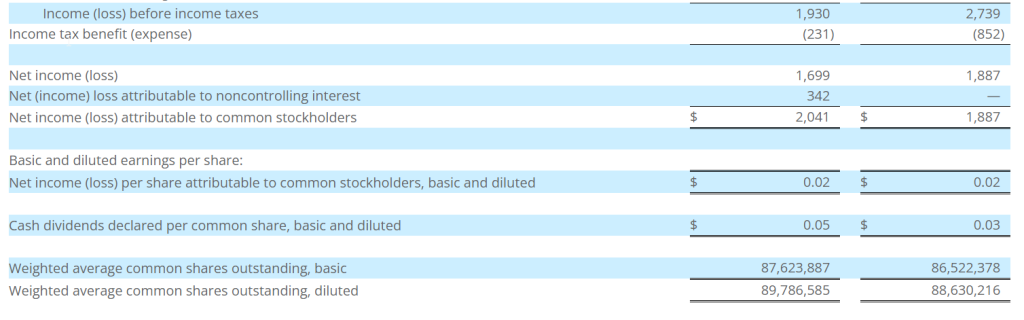
Net income attributable to common stockholders up 8% over the prior-year quarter
Consolidated EBITDA down 28% compared to the prior-year quarter
Operating cash flow down 31% compared to the prior-year quarter
Free cash flow down 73% compared to the prior-year quarter
Quarterly cash dividend of $0.05 per share
Entered into $275 Million Credit Facility
“Entravision saw continued growth in the first quarter of 2023, with revenue up 21% year-over-year,” said Chris Young, Interim Chief Executive Officer and Chief Financial Officer. “Growth for the quarter was led by our digital segment, which is impressive given difficult macro conditions and decreased political advertising revenue from last year.”
Mr. Young continued, “With a solid balance sheet in place, strong free cash flow generation, and an acute focus on expense management, Entravision is well-equipped to navigate the current economic environment. As we progress through additional quarters, we will continue to seek out opportunities, including acquisitions, that will enhance our digital offerings and strengthen our ability to compete internationally.”
Quarterly Cash Dividend
The Company announced today that its Board of Directors approved a quarterly cash dividend to shareholders of $0.05 per share on the Company’s Class A and Class U common stock, in an aggregate amount of $4.4 million. The quarterly dividend will be payable on June 30, 2023 to shareholders of record as of the close of business on June 16, 2023, and the common stock will trade ex-dividend on June 15, 2023. The Company currently anticipates that future cash dividends will be paid on a quarterly basis; however, any decision to pay future cash dividends will be subject to approval by the Board.
$275 Million Credit Facility
On March 17, 2023, the Company entered into the 2023 Amended and Restated Credit Facility (the “2023 Credit Facility”), which consists of a $200 million senior secured Term A Facility, which was drawn in full, and a $75 million Revolving Credit Facility, of which $11.5 million was drawn. In addition, the 2023 Amended and Restated Credit Agreement (the “2023 Credit Agreement”) provides that the Company may increase the aggregate principal amount of the 2023 Credit Facility by an additional amount equal to $100 million plus the amount that would result in the Company’s first lien net leverage ratio (as such term is used in the 2023 Credit Agreement) not exceeding 2.25 to 1.0, subject to the Company satisfying certain conditions.
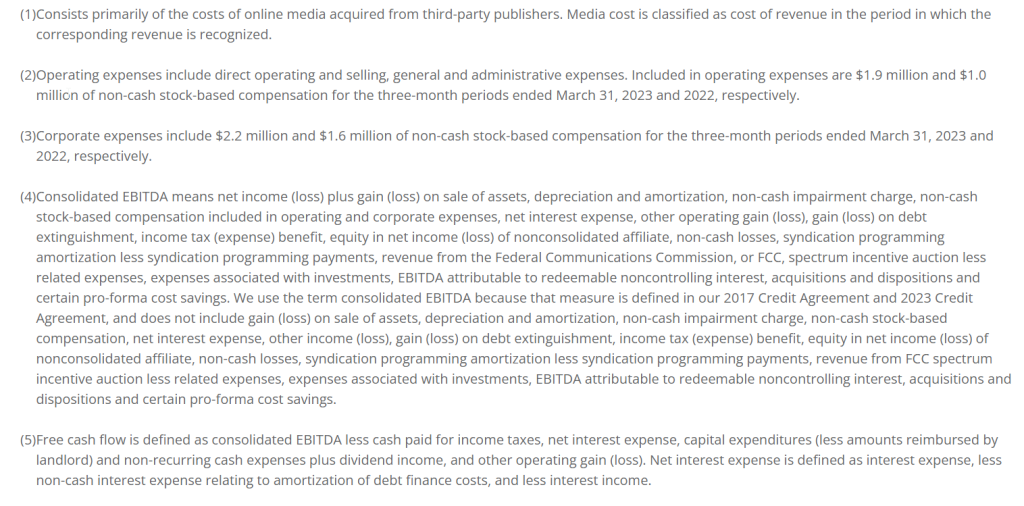
Non-GAAP Financial Measures
This press release contains certain non-GAAP financial measures as defined by SEC Regulation G. The GAAP financial measure most directly comparable to each of these non-GAAP financial measures, and a table reconciling each of these non-GAAP financial measures to its most directly comparable GAAP financial measure is included beginning on page 9.
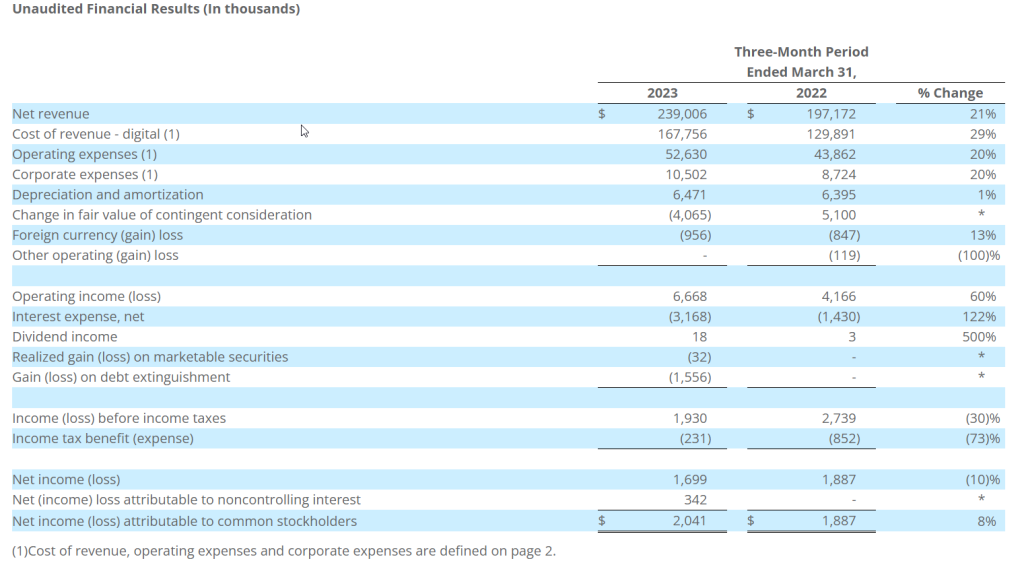
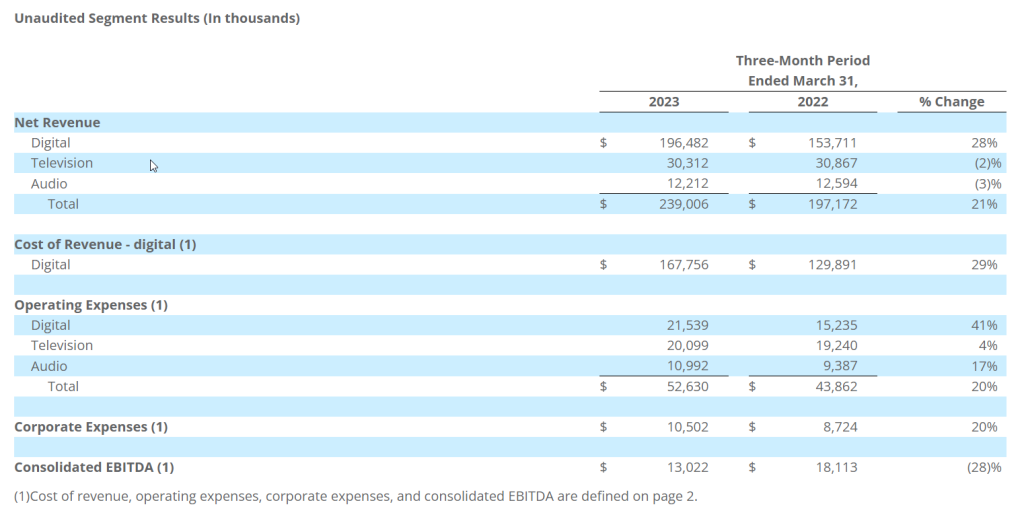
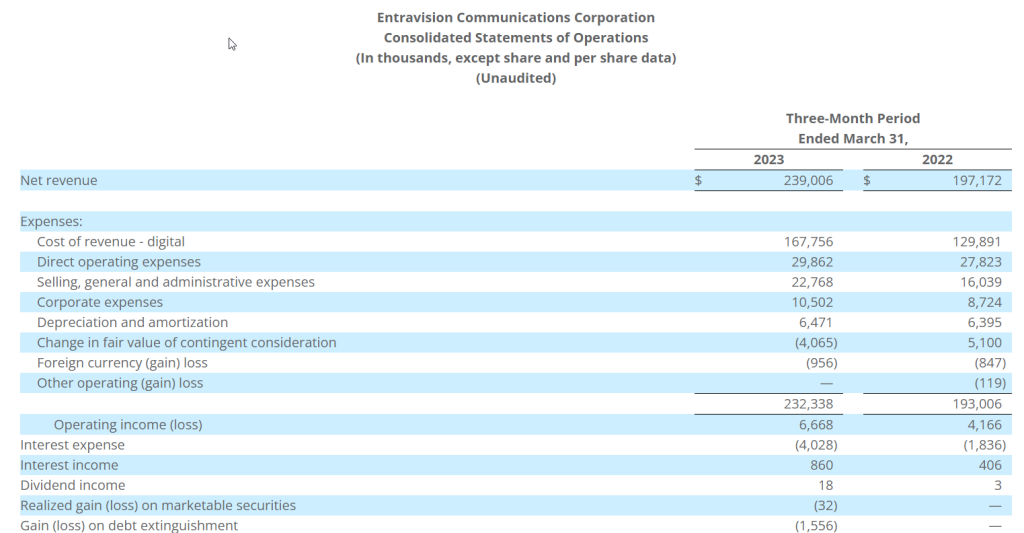
Net revenue in the first quarter of 2023 totaled $239.0 million, up 21% from $197.2 million in the prior-year period. Of the overall increase, $42.8 million was attributable to our digital segment and was primarily due to advertising revenue growth from our digital commercial partnerships business, and due to our VIEs, which did not contribute to our financial results in our digital segment in the comparable period. The overall increase was partially offset by a decrease of $0.6 million attributable to our television segment, primarily due to decreases in political advertising revenue and national advertising revenue, partially offset by increases in local advertising revenue, spectrum usage rights revenue and retransmission consent revenue. In addition, the overall increase was partially offset by a decrease of $0.4 million attributable to our audio segment, primarily due to a decrease in political advertising revenue, and decreases in local and national advertising revenue.
Cost of revenue in the first quarter of 2023 totaled $167.8 million, up 29% from $129.9 million in the prior-year period. The increase was primarily due to increased cost of revenue related to advertising revenue growth from our digital commercial partnerships business, and due to our VIEs, which did not contribute to our financial results in our digital segment in the comparable period.
Operating expenses in the first quarter of 2023 totaled $52.6 million, up 20% from $43.9 million in the prior-year period. Of the overall increase, $6.3 million was attributable to our digital segment and was primarily due to our VIEs, which did not contribute to our financial results in our digital segment in the comparable period, an increase in salary expense, an increase in non-cash stock-based compensation, and an increase in expenses associated with the increase in digital advertising revenue. Additionally, of the overall increase in operating expenses, $0.9 million was attributable to our television segment primarily due to an increase in non-cash stock-based compensation, increased rent expense in the temporary office space until the move to our new permanent offices is completed, and an increase in bad debt expense. In addition, of the overall increase in operating expenses, $1.6 million was attributable to our audio segment primarily due to increases in salaries and music license fees, and increased rent expense in the temporary office space until the move to our new permanent offices is completed. The increases in non-cash stock-based compensation are mainly a result of the 2023 annual restricted stock unit (“RSU”) grant, which was made in February 2023 compared to the 2022 annual grant, which was made in December 2022.
Corporate expenses in the first quarter of 2023 totaled $10.5 million, up 20% from $8.7 million in the prior-year period. The increase was primarily due to an increase in non-cash stock-based compensation, which is mainly a result of the 2023 annual RSU grant, which was made in February 2023 compared to the 2022 annual grant, which was made in December 2022, an increase in professional service fees, and an increase in audit fees.
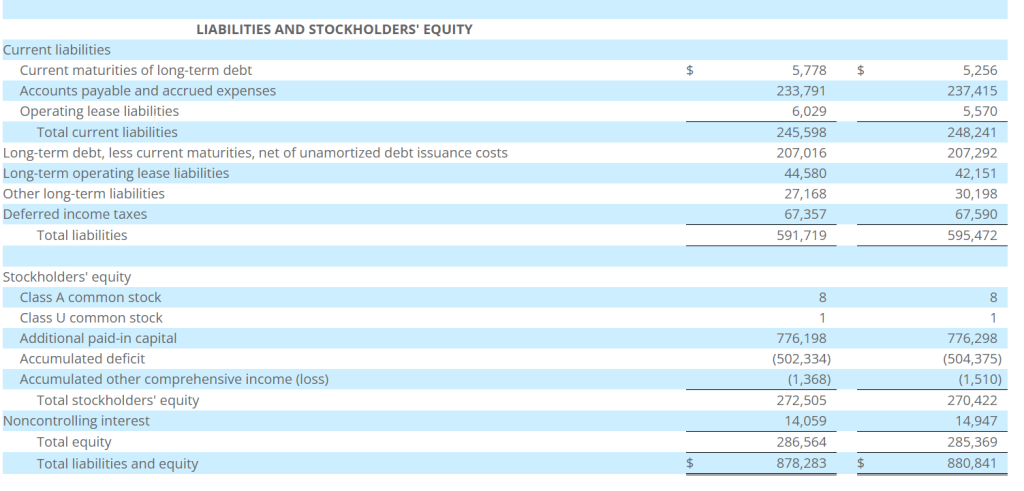
Balance Sheet and Related Metrics
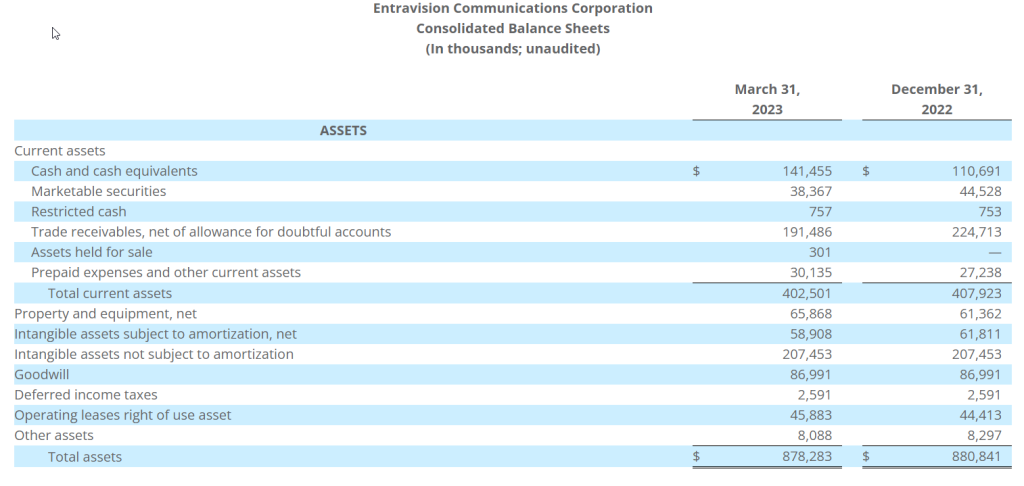
Cash and marketable securities as of March 31, 2023 totaled $179.8 million. Total debt under the Company’s credit agreement was $211.5 million. Net of $50 million of cash and marketable securities, total leverage as defined in the Company’s credit agreement was 1.7 times as of March 31, 2023. Net of total cash and marketable securities, total leverage was 0.3 times.
Notice of Conference Call
Entravision Communications Corporation will hold a conference call to discuss its first quarter 2023 results on Thursday, May 4, 2023 at 5:00 p.m. Eastern Time. To access the conference call, please dial (844) 836-8739 (U.S.) or (412) 317-5440 (Int’l) ten minutes prior to the start time and reference Conference ID number 10176751. The call will also be available via live webcast on the investor relations portion of the Company’s website located at www.entravision.com.
About Entravision Communications Corporation
Entravision is a global advertising solutions, media and technology company. Over the past three decades, we have strategically evolved into a digital powerhouse, expertly connecting brands to consumers in the U.S., Latin America, Europe, Asia and Africa. Our digital segment, the company’s largest by revenue, offers a full suite of end-to-end advertising services in 40 countries. We have commercial partnerships with Meta, Twitter, TikTok, and Spotify, and marketers can use our Smadex and other platforms to deliver targeted advertising to audiences around the globe. In the U.S., we maintain a diversified portfolio of television and radio stations that target Hispanic audiences and complement our global digital services. Entravision remains the largest affiliate group of the Univision and UniMás television networks. Shares of Entravision Class A Common Stock trade on the NYSE under ticker: EVC. Learn more about our offerings at entravision.com or connect with us on LinkedIn and Facebook.
Forward-Looking Statements
This press release contains certain forward-looking statements. These forward-looking statements, which are included in accordance with the safe harbor provisions of the Private Securities Litigation Reform Act of 1995, may involve known and unknown risks, uncertainties and other factors that may cause the Company’s actual results and performance in future periods to be materially different from any future results or performance suggested by the forward-looking statements in this press release. Although the Company believes the expectations reflected in such forward-looking statements are based upon reasonable assumptions, it can give no assurance that actual results will not differ materially from these expectations, and the Company disclaims any duty to update any forward-looking statements made by the Company. From time to time, these risks, uncertainties and other factors are discussed in the Company’s filings with the Securities and Exchange Commission.
Christopher T. Young Interim Chief Executive Officer, and Chief Financial Officer and Treasurer Entravision Communications Corporation 310-447-3870
IRVING, Texas–(BUSINESS WIRE)– Salem Media Group, Inc. (NASDAQ: SALM) announced today that it plans to report its first quarter 2023 financial results after the market closes on May 9, 2023.
The company also plans to host a teleconference to discuss its results on May 9, 2023, at 4:00 PM Central Time. To access the teleconference, please dial (888) 770-7291, and then ask to be joined to the Salem Media Group First Quarter 2023 call or listen to the webcast.
A replay of the teleconference will be available through May 23, 2023, and can be heard by dialing (800) 770-2030 – replay pin number 2413416, or on the investor relations portion of the company’s website, located at investor.salemmedia.com.
ABOUT SALEM MEDIA GROUP:
Salem Media Group is America’s leading multimedia company specializing in Christian and conservative content, with media properties comprising radio, digital media and book and newsletter publishing. Each day Salem serves a loyal and dedicated audience of listeners and readers numbering in the millions nationally. With its unique programming focus, Salem provides compelling content, fresh commentary and relevant information from some of the most respected figures across the Christian and conservative media landscape. Learn more about Salem Media Group, Inc. at www.salemmedia.com, Facebook and Twitter.
Lee Enterprises, Incorporated provides local news, information, and advertising primarily in midsize markets in the United States. It publishes 49 daily newspapers, as well as offers 300 weekly newspapers and specialty publications in 23 states. The company also provides online advertising and services; and online infrastructure and online publishing services for approximately 1,500 daily and weekly newspapers and shoppers. In addition, it offers commercial printing services. The company has a strategic alliance with Yahoo!, Inc. to provide its classified employment advertising customer base the opportunity to post job listings and other employment products on Yahoo!�s HotJobs national platform. Lee Enterprises, Incorporated was founded in 1890 and is based in Davenport, Iowa.
Michael Kupinski, Director of Research, Equity Research Analyst, Digital, Media & Technology , Noble Capital Markets, Inc.
Patrick McCann, Research Associate, Noble Capital Markets, Inc.
Refer to the full report for the price target, fundamental analysis, and rating.
Solid Q2 results. Q2 revenue of $170.7 million, missed our estimate of $173.7 million by 1.7%. While revenue came in slightly lower than expected adj. EBITDA of $14.3 million beat our estimate of $13.5 million by 6.4%. The results benefited from stronger than expected high margin digital subscription revenue. Notably, print cost reductions were enacted late in Q2, resulting in $9 million of savings in the quarter.
Industry leading digital subscriber growth. The company achieved 596,000 digital subscribers and digital revenue now comprises 38% of total revenue. For 13 consecutive quarters, it experienced the fastest digital subscriber growth in the industry, with an impressive compound annual growth rate (CAGR) of 49%. It appears to be well on its way to reach its goal of 900,000 digital subscribers and digital revenue comprising 50% of total revenue by 2026.
Equity Research is available at no cost to Registered users of Channelchek. Not a Member? Click ‘Join’ to join the Channelchek Community. There is no cost to register, and we never collect credit card information.
This Company Sponsored Research is provided by Noble Capital Markets, Inc., a FINRA and S.E.C. registered broker-dealer (B/D).
*Analyst certification and important disclosures included in the full report. NOTE: investment decisions should not be based upon the content of this research summary. Proper due diligence is required before making any investment decision.
Entravision Communications Corporation is a diversified Spanish-language media company utilizing a combination of television and radio operations to reach Hispanic consumers across the United States, as well as the border markets of Mexico. Entravision owns and/or operates 53 primary television stations and is the largest affiliate group of both the top-ranked Univision television network and Univision’s TeleFutura network, with television stations in 20 of the nation’s top 50 Hispanic markets. The Company also operates one of the nation’s largest groups of primarily Spanish-language radio stations, consisting of 48 owned and operated radio stations.
Michael Kupinski, Director of Research, Equity Research Analyst, Digital, Media & Technology , Noble Capital Markets, Inc.
Patrick McCann, Research Associate, Noble Capital Markets, Inc.
Refer to the full report for the price target, fundamental analysis, and rating.
Strong Q1 results. The company reported quarterly revenue of $239 million, 4.4% better than our estimate of $229 million. The quarter was driven by robust digital revenue growth of 28%, notably, Latin America and Asia grew revenues by 15% and 35%, respectively. Adj. EBITDA in the quarter was $13 million, slightly less than our estimate of $13.5 million, attributed to an increase in variable expenses from digital revenue.
Positive Q2 pacing outlook. Management indicated that its legacy broadcast businesses are pacing down (TV down 9.5% and Radio down roughly 5%), but its Digital revenues are pacing up 25%. In total, Q2 total company revenues are pacing up a strong 19%, indicating that the company is performing nicely in spite of economic headwinds. Second half revenue should benefit from an influx of high margin Political advertising.
Equity Research is available at no cost to Registered users of Channelchek. Not a Member? Click ‘Join’ to join the Channelchek Community. There is no cost to register, and we never collect credit card information.
This Company Sponsored Research is provided by Noble Capital Markets, Inc., a FINRA and S.E.C. registered broker-dealer (B/D).
*Analyst certification and important disclosures included in the full report. NOTE: investment decisions should not be based upon the content of this research summary. Proper due diligence is required before making any investment decision.
Harte Hanks (NASDAQ: HHS) is a leading global customer experience company whose mission is to partner with clients to provide them with CX strategy, data-driven analytics and actionable insights combined with seamless program execution to better understand, attract, and engage their customers. Using its unparalleled resources and award-winning talent in the areas of Customer Care, Fulfillment and Logistics, and Marketing Services, Harte Hanks has a proven track record of driving results for some of the world’s premier brands including Bank of America, GlaxoSmithKline, Unilever, Pfizer, HBOMax, Volvo, Ford, FedEx, Midea, Sony, and IBM among others. Headquartered in Chelmsford, Massachusetts , Harte Hanks has over 2,500 employees in offices across the Americas, Europe and Asia Pacific .
Michael Kupinski, Director of Research, Equity Research Analyst, Digital, Media & Technology , Noble Capital Markets, Inc.
Jacob Mutchler, Research Associate, Noble Capital Markets, Inc.
Refer to the full report for the price target, fundamental analysis, and rating.
Soft Q1 results. The company reported Q1 revenue of $47.1 million, missing our estimate of $50.4 million by 6.5%. Adj. EBITDA in the quarter was $2.7 million, 21.8% lower than our estimate of $3.4 million. While we had anticipated a tough quarter, the results reflected softer than expected operating results in its Customer Care and Marketing Services segments.
Not as resilient as once thought. The economic headwinds have created anxiety with businesses, which have delayed or cancelled some campaigns. While we continue to anticipate revenue strength in its Fulfillment and Logistics business, this is low margin and will not be enough to offset the higher margin revenue weakness.
Equity Research is available at no cost to Registered users of Channelchek. Not a Member? Click ‘Join’ to join the Channelchek Community. There is no cost to register, and we never collect credit card information.
This Company Sponsored Research is provided by Noble Capital Markets, Inc., a FINRA and S.E.C. registered broker-dealer (B/D).
*Analyst certification and important disclosures included in the full report. NOTE: investment decisions should not be based upon the content of this research summary. Proper due diligence is required before making any investment decision.
IRVING, Texas–(BUSINESS WIRE)– Salem Media Group, Inc. (NASDAQ: SALM) announced today the appointment of Carolyn Cassidy as General Manager of its five-station radio group and of Salem Surround in Tampa and Sarasota, Florida.
Cassidy is currently the General Manager of Salem’s Columbus, OH operation, she will retain those responsibilities in addition to her new role as GM in Tampa/Sarasota. In her extensive broadcasting background, Cassidy has served in sales leadership and General Management roles in Colorado Springs, Denver, Cape Cod, Vermont and Ohio. Carolyn has been an active member of the board of the Ohio Association of Broadcasters and has been twice recognized by Radio Ink magazine as a General Manager of the Year.
Salem Media Group Regional Vice President Val Carolin commented, “As we worked to fill the big shoes that Barb Yoder has worn so effectively these past 12 years as General Manager, we were thrilled to learn that Carolyn had a strong desire to return to her Florida roots and serve the communities in her home state. Carolyn has proven herself to be a tireless leader with a deep commitment to service. She’s a hard and smart worker who gets involved and gets things done. I’m confident that the dedication and the skills she possesses will prove to be a great fit for our strong Tampa/Sarasota operation.”
Cassidy commented, “I’m honored to be leading our talented Tampa/Sarasota team. The vision that Dave Santrella and Allen Power have laid out for the growth of our Company is clear and is one that we are striving to achieve here in Tampa Bay and beyond. We look forward to the future and to building upon the success that Barb Yoder and her great team have created. This is a customer focused operation that strives to deliver strong results for our partners by activating effective, individualized digital and broadcast solutions. I started my radio career in the sunshine state, so it is wonderful to be home!”
ABOUT SALEM MEDIA GROUP:
Salem Media Group is America’s leading multimedia company specializing in Christian and conservative content, with media properties comprising radio, digital media and book and newsletter publishing. Each day Salem serves a loyal and dedicated audience of listeners and readers numbering in the millions nationally. With its unique programming focus, Salem provides compelling content, fresh commentary and relevant information from some of the most respected figures across the Christian and conservative media landscape. Learn more about Salem Media Group, Inc. at www.salemmedia.com, Facebook and Twitter.
Travelzoo® provides its 30 million members with exclusive offers and one-of-a-kind experiences personally reviewed by our deal experts around the globe. We have our finger on the pulse of outstanding travel, entertainment, and lifestyle experiences. We work in partnership with more than 5,000 top travel suppliers—our long-standing relationships give Travelzoo members access to irresistible deals.
Michael Kupinski, Director of Research, Equity Research Analyst, Digital, Media & Technology , Noble Capital Markets, Inc.
Jacob Mutchler, Research Associate, Noble Capital Markets, Inc.
Refer to the full report for the price target, fundamental analysis, and rating.
Strong Q1 results. The company reported Q1 revenue of $21.6 million, an increase of 17% from the prior year period, beating our estimate of $20.5 million by 5.4%. Adj. EBITDA of $5.6 million beat our estimate of $3.9 million by 44%. The quarter was driven by strong operating results in North America, with 26% revenue growth and strong 31% operating margins.
Favorable margins. The quarter demonstrated favorable 87.5% gross margins and record breaking total company operating margins of 22%, substantially higher than pre-pandemic levels. Management highlighted the transition of Asia Pacific to a licensing model as a major contributor to the record margins.
Equity Research is available at no cost to Registered users of Channelchek. Not a Member? Click ‘Join’ to join the Channelchek Community. There is no cost to register, and we never collect credit card information.
This Company Sponsored Research is provided by Noble Capital Markets, Inc., a FINRA and S.E.C. registered broker-dealer (B/D).
*Analyst certification and important disclosures included in the full report. NOTE: investment decisions should not be based upon the content of this research summary. Proper due diligence is required before making any investment decision.
SANTA MONICA, Calif.–(BUSINESS WIRE)– Entravision (NYSE: EVC), a leading global advertising solutions, media and technology company, announced that it will release its first quarter 2023 financial results after market close on Thursday, May 4, 2023. The Company will host a conference call that day at 5:00 p.m. Eastern Time to discuss the first quarter 2023 results.
To access the conference call, please dial (844) 836-8739 (U.S.) or (412) 317-5440 (International) ten minutes prior to the start time. The call will also be available via live webcast on the investor relations portion of the Company’s website located at www.entravision.com.
If you cannot listen to the conference call at its scheduled time, there will be a replay available through Thursday, May 18, 2023 which can be accessed by dialing (844) 512-2921 (U.S.) or (412) 317-6671 (International) and entering the passcode 10176751. The webcast will also be archived on the Company’s website.
About Entravision
Entravision is a global advertising solutions, media and technology company. Over the past three decades, we have strategically evolved into a digital powerhouse, expertly connecting brands to consumers in the U.S., Latin America, Europe, Asia and Africa. Our digital segment, the company’s largest by revenue, offers a full suite of end-to-end advertising services in 40 countries. We have commercial partnerships with Meta, Twitter, TikTok, and Spotify, and marketers can use our Smadex and other platforms to deliver targeted advertising to audiences around the globe. In the U.S., we maintain a diversified portfolio of television and radio stations that target Hispanic audiences and complement our global digital services. Entravision remains the largest affiliate group of the Univision and UniMás television networks. Shares of Entravision Class A Common Stock trade on the NYSE under ticker: EVC. Learn more about our offerings at entravision.com or connect with us on LinkedIn and Facebook.
Christopher T. Young Interim Chief Executive Officer Entravision 310-447-3870
NEW YORK, April 27, 2023 /PRNewswire/ — Travelzoo® (NASDAQ: TZOO):
Revenue of $21.6 million, up 17% year-over-year
In constant currencies, revenue was $22.1 million, up 19% year-over-year
Non-GAAP consolidated operating profit of $5.5 million
Earnings per share (EPS) of $0.23
Travelzoo, a global Internet media company that provides exclusive offers and experiences for members, today announced financial results for the first quarter ended March 31, 2023. Consolidated revenue was $21.6 million, up 17% from $18.5 million year-over-year. In constant currencies, revenue was $22.1 million. Travelzoo’s reported revenue consists of advertising revenues and commissions, derived from and generated in connection with purchases made by Travelzoo members.
The reported net income attributable to Travelzoo from continuing operations was $3.7 million for Q1 2023. At the consolidated level, including minority interests, the reported net income from continuing operations was $3.7 million. EPS from continuing operations was $0.23, compared to $0.19 in the prior-year period.
Non-GAAP operating profit was $5.5 million. The calculation of non-GAAP operating profit excludes amortization of intangibles ($0.4 million), stock option expenses ($0.4 million) and severance-related expenses ($39,000). See section “Non-GAAP Financial Measures” below.
“We will continue our strategy of leveraging Travelzoo’s global reach, trusted brand, and strong relationships with top travel suppliers to negotiate more exclusive offers for Travelzoo members,” said Holger Bartel, Travelzoo’s Global CEO. “With more than 30 million members, 8 million mobile app users, and 4 million social media followers, Travelzoo is loved by travel enthusiasts who are affluent, active, and open to new experiences.”
Cash Position As of March 31, 2023, consolidated cash, cash equivalents and restricted cash were $19.8 million. Net cash provided by operations was $535,000.
Reserve Reported revenues include a reserve of $785,000 related to commissions to be earned from vouchers sold. The reserve is initially booked as contra revenue.
Travelzoo North America North America business segment revenue increased 26% year-over-year to $14.8 million. Operating profit for Q1 2023 was $4.5 million, or 31% of revenue, compared to an operating profit of $1.7 million in the prior-year period.
Travelzoo Europe Europe business segment revenue remained consistent year-over-year at $5.9 million. At constant currencies, Europe business segment revenue increased 6% year-over-year. Operating profit for Q1 2023 was $457,000, or 8% of revenue, compared to an operating profit of $178,000 in the prior-year period.
Jack’s Flight Club Jack’s Flight Club business segment revenue increased 15% year-over-year to $948,000. Jack’s Flight Club is a membership subscription service in which Travelzoo has a 60% ownership interest. The number of premium subscribers increased 27% year-over-year. Revenue from increases in subscribers is reported with a lag because we recognize revenue from subscriptions monthly pro rata over the subscription period (quarterly, semi-annually, annually). Non-GAAP operating profit for Q1 2023 was $123,000, compared to a non-GAAP operating profit of $249,000 in the prior-year period. After consolidation with Travelzoo, Jack’s Flight Club’s net income was $20,000, with $12,000 attributable to Travelzoo as a result of recording $168,000 of amortization of intangible assets related to the acquisition.
New Initiatives New Initiatives business segment revenue, which includes Licensing and Travelzoo META, was $8,000. Operating loss for Q1 2023 was $217,000.
In June 2020, Travelzoo entered into a royalty-bearing licensing agreement with a local licensee in Japan for the exclusive use of Travelzoo’s brand, business model, and members in Japan. In August of 2020, Travelzoo entered into a royalty-bearing licensing agreement with a local licensee in Australia for the exclusive use of Travelzoo’s brand, business models, and members in Australia, New Zealand, and Singapore. Under these arrangements, Travelzoo’s existing members in Australia, Japan, New Zealand, and Singapore will continue to be owned by Travelzoo as the licensor. Licensing revenue is booked with a lag of one quarter. Travelzoo recorded $8,000 in licensing revenue from the licensee in Australia, New Zealand, and Singapore in Q1 2023. Licensing revenue is expected to increase going forward.
Members and Subscribers As of March 31, 2023, we had 30.5 million members worldwide. In North America, the unduplicated number of Travelzoo members was 16.3 million as of March 31, 2023, down 2% from March 31, 2022. In Europe, the unduplicated number of Travelzoo members was 9.1 million as of March 31, 2023, consistent with March 31, 2022. Jack’s Flight Club had 2.0 million subscribers as of March 31, 2023, up 14% from March 31, 2022.
Discontinued Operations As announced in a press release on March 10, 2020, Travelzoo decided to exit its Asia Pacific business and operate it as a licensing business going forward. Consequently, the Asia Pacific business has been classified as discontinued operations since March 31, 2020. Prior periods have been reclassified to conform with the current presentation. Certain reclassifications have been made for current and prior periods between the continued operations and the discontinued operations in accordance with U.S. GAAP.
Income Taxes A provision of $1.4 million for income taxes was recorded for Q1 2023, compared to an income tax expense of $968,000 in the prior-year period. The provision for Q1 2023 does not reflect the expected utilization of NOLs by Travelzoo in the U.S.
Non-GAAP Financial Measures Management calculates non-GAAP operating income when evaluating the financial performance of the business. Travelzoo’s calculation of non-GAAP operating income, also called “non-GAAP operating profit” in this press release and today’s earnings conference call, excludes the following items: amortization of intangibles, stock option expenses, and severance-related expenses. This press release includes a table which reconciles GAAP operating income to the calculation of non-GAAP operating income. Non-GAAP operating income is not required by, or presented in accordance with, generally accepted accounting principles in the United States of America (“GAAP”). This information should be considered as supplemental in nature and should not be considered in isolation or as a substitute for the financial information prepared in accordance with GAAP. In addition, these non-GAAP financial measures may not be the same as similarly titled measures reported by other companies.
Looking Ahead For Q2 2023, we currently expect growth in revenue and growth in operating profit to continue year-over-year. During the pandemic, we have been able to lower our fixed costs. We believe we can keep our fixed costs relatively low in the foreseeable future.
Conference Call Travelzoo will host a conference call to discuss first quarter 2023 results today at 11:00 a.m. ET. Please visit http://ir.travelzoo.com/events-presentations to
download the management presentation (PDF format) to be discussed in the conference call
access the webcast.
About Travelzoo Travelzoo® provides its 30 million members with exclusive offers and one-of-a-kind experiences personally reviewed by our deal experts around the globe. We have our finger on the pulse of outstanding travel, entertainment, and lifestyle experiences. We work in partnership with more than 5,000 top travel suppliers—our long-standing relationships give Travelzoo members access to irresistible deals.
Certain statements contained in this press release that are not historical facts may be forward-looking statements within the meaning of Section 27A of the Securities Act of 1933 and Section 21E of the Securities and Exchange Act of 1934. These forward-looking statements may include, but are not limited to, statements about our plans, objectives, expectations, prospects and intentions, markets in which we participate and other statements contained in this press release that are not historical facts. When used in this press release, the words “expect”, “predict”, “project”, “anticipate”, “believe”, “estimate”, “intend”, “plan”, “seek” and similar expressions are generally intended to identify forward-looking statements. Because these forward-looking statements involve risks and uncertainties, there are important factors that could cause actual results to differ materially from those expressed or implied by these forward-looking statements, including changes in our plans, objectives, expectations, prospects and intentions and other factors discussed in our filings with the SEC. We cannot guarantee any future levels of activity, performance or achievements. Travelzoo undertakes no obligation to update forward-looking statements to reflect events or circumstances occurring after the date of this press release.
Travelzoo and Jack’s Flight Club are registered trademarks of Travelzoo.
TravelzooCondensed Consolidated Statements of Operations(Unaudited)(In thousands, except per share amounts)
Three months ended
March 31
2023
2022
Revenues
$ 21,601
$ 18,453
Cost of revenues
2,691
2,832
Gross profit
18,910
15,621
Operating expenses:
Sales and marketing
9,296
8,581
Product development
490
453
General and administrative
4,413
4,668
Total operating expenses
14,199
13,702
Operating income
4,711
1,919
Other income, net
350
1,423
Income from continuing operations before income taxes
5,061
3,342
Income tax expense
1,378
968
Income from continuing operations
3,683
2,374
Loss from discontinued operations, net of tax
(2)
(11)
Net income
3,681
2,363
Net income attributable to non-controlling interest
8
4
Net income attributable to Travelzoo
$ 3,673
$ 2,359
Net income attributable to Travelzoo—continuing operations
$ 3,675
$ 2,370
Net loss attributable to Travelzoo—discontinued operations
$ (2)
$ (11)
Income per share—basic
Continuing operations
$ 0.23
$ 0.20
Discontinued operations
$ —
$ —
Net income per share—basic
$ 0.23
$ 0.20
Income per share—diluted
Continuing operations
$ 0.23
$ 0.19
Discontinued operations
$ —
$ —
Net income per share—diluted
$ 0.23
$ 0.19
Shares used in per share calculation from continuing operations—basic
15,697
12,056
Shares used in per share calculation from discontinued operations—basic
15,697
12,056
Shares used in per share calculation from continuing operations—diluted
15,779
12,544
Shares used in per share calculation from discontinued operations—diluted
CULVER CITY, Calif., April 26, 2023 (GLOBE NEWSWIRE) — Snail, Inc. (Nasdaq: SNAL) (“Snail” or “the Company”), a leading, global independent developer and publisher of interactive digital entertainment, today announced that Jim Tsai, Chief Executive Officer, and Heidy Chow, Chief Financial Officer, will be participating in the Inaugural EF Hutton Global Conference on May 11, 2023, at the Plaza Hotel in New York City. Management will host one-on-one and group meetings.
The Inaugural EF Hutton Global Conference is a two-day, invitation-only event featuring key executives from approximately 150 public and private companies to convey their unique stories to a diverse audience that includes institutional investors, high-net worth individuals, corporate clients and members of the press.
To schedule a meeting with management, please contact your EF Hutton representative.
About EF Hutton EF Hutton, division of Benchmark Investments, LLC, is a global, full-service investment bank headquartered in New York, New York. EF Hutton is a division of Benchmark Investments, LLC, a subsidiary of Kingswood US, LLC, an indirect subsidiary of Kingswood Holdings Limited (AIM: KWG). The synergies and direct access to Kingswood Holdings Limited provide EF Hutton with a unique global presence and broad platform outreach to ensure success for its clients.
About Snail, Inc. Snail is a leading, global independent developer and publisher of interactive digital entertainment for consumers around the world, with a premier portfolio of premium games designed for use on a variety of platforms, including consoles, PCs and mobile devices.
Beasley Broadcast Group, Inc. owns and operates 61 stations (47 FM and 14 AM) in 15 large- and mid-size markets in the United States. Approximately 20 million consumers listen to the Company’s radio stations weekly over-the-air, online and on smartphones and tablets, and millions regularly engage with the Company’s brands and personalities through digital platforms such as Facebook, Twitter, text messaging, digital and web applications and email. The Overwatch League’s Houston Outlaws esports team is a wholly owned subsidiary. The Company also owns BeasleyXP, a national esports content hub, and AXLR-R8, a Rocket League Championship Series team, in its esports portfolio. For more information, please visit www.bbgi.com.
Michael Kupinski, Director of Research, Equity Research Analyst, Digital, Media & Technology , Noble Capital Markets, Inc.
Jacob Mutchler, Research Associate, Noble Capital Markets, Inc.
Refer to the full report for the price target, fundamental analysis, and rating.
Solid Q1 results. The company reported revenue of $57.8 million and adj. EBITDA of $2.8 million, beating our upwardly revised estimates by 1.8% and 6.3%, respectively. The better than expected results were driven by strong digital revenue of $10 million, an increase of 27% from the prior year period, and $4.3 million in sports betting advertising.
Robust digital growth. From Q1 2019 to Q1 2023, the company grew digital revenue at a CAGR of 30% and now Digital represents 17% of total company revenue. Given the anticipated strong digital revenue growth, management appears to be on target for Digital to be 20% to 30% of total revenue for full year 2023, and 40% in 2024.
Equity Research is available at no cost to Registered users of Channelchek. Not a Member? Click ‘Join’ to join the Channelchek Community. There is no cost to register, and we never collect credit card information.
This Company Sponsored Research is provided by Noble Capital Markets, Inc., a FINRA and S.E.C. registered broker-dealer (B/D).
*Analyst certification and important disclosures included in the full report. NOTE: investment decisions should not be based upon the content of this research summary. Proper due diligence is required before making any investment decision.
Takeaways from the National Association of Broadcasters’ NAB Show
All videos now live on demand!
The Takeaway Series is available exclusively to Channelchek members. It’s totally free to join the community, just click the join button at the top of the page, or the Register button below.For best results, log in to your Channelchek account above before viewing the videos.