Research News and Market Data on KTOS
November 2, 2023 at 4:00 PM EDT
Third Quarter 2023 Revenues of $274.6 Million Reflect 20.1 Percent Organic Growth Over Third Quarter 2022 Revenues of $228.6 Million
Third Quarter 2023 Revenues Reflect 22.0 Percent Organic Revenue Growth in Kratos Government Solutions Segment and 13.4 Percent Organic Revenue Growth in Kratos Unmanned Systems Segment
Third Quarter 2023 Consolidated Book to Bill Ratio of 1.0 to 1 and Last Twelve Months Ended October 1, 2023 Consolidated Book to Bill Ratio of 1.1 to 1
SAN DIEGO, Nov. 02, 2023 (GLOBE NEWSWIRE) — Kratos Defense & Security Solutions, Inc. (Nasdaq: KTOS), a Technology Company in the Defense, National Security and Global Markets, today reported its third quarter 2023 financial results, including Revenues of $274.6 million, Operating Income of $12.2 million, Net Loss of $1.6 million, Adjusted EBITDA of $27.7 million and a consolidated book to bill ratio of 1.0 to 1.0.
Included in third quarter 2023 Net Loss and Operating Income is non-cash stock compensation expense of $6.4 million and Company-funded Research and Development (R&D) expense of $10.3 million, including significant ongoing development efforts in our Space and Satellite Communications business to develop our virtual, software-based OpenSpace command & control (C2), telemetry tracking & control (TT&C) and other ground system solutions. The third quarter 2023 Net Loss includes $4.6 million attributable to a non-controlling interest, which includes a charge of $4.2 million adjustment recorded to reflect the estimated increase in the value of the redeemable non-controlling interest to the estimated redemption amount by Kratos.
Kratos reported third quarter 2023 GAAP Net Loss of $1.6 million and a GAAP Net Loss per share of $0.01, compared to a GAAP Net Loss of $8.0 million and a GAAP Net Loss per share of $0.06 for the third quarter of 2022. Adjusted earnings per share (EPS) was $0.12 for the third quarter of 2023, compared to $0.08 for the third quarter of 2022.
Third quarter 2023 Revenues of $274.6 million increased $46.0 million, reflecting 20.1 percent organic growth, from third quarter 2022 Revenues of $228.6 million. Third quarter 2023 Revenues include organic Revenue growth of 22.0 percent in our Government Solutions Segment (KGS) and 13.4 percent organic Revenue growth in our Unmanned Systems Segment (KUS), respectively.
Third quarter 2023 Cash Flow Used from Operations was $0.1 million, reflecting the working capital requirements associated with the 6.9 percent sequential revenue growth of $17.7 million from the second quarter of 2023. Consolidated Days Sales Outstanding continued to improve from 120 in the second quarter of 2023 to 117 days in the third quarter of 2023. Free Cash Flow Used from Operations was $14.3 million after funding of $14.2 million of capital expenditures. Capital expenditures continue to remain elevated due primarily to the manufacture of the two production lots of Valkyries prior to contract award, to meet anticipated customer orders and requirements.
For the third quarter of 2023, KUS generated Revenues of $56.7 million, as compared to $50.0 million in the third quarter of 2022, primarily reflecting increased target drone related activity. KUS’s Operating Income was $2.6 million in the third quarter of 2023 compared to Operating Loss of $0.1 million in the third quarter of 2022.
KUS’s Adjusted EBITDA for the third quarter of 2023 was $5.4 million, compared to third quarter 2022 KUS Adjusted EBITDA of $2.1 million, reflecting a more favorable mix as well as the increased volume.
KUS’s book-to-bill ratio for the third quarter of 2023 was 0.5 to 1.0 and 1.1 to 1.0 for the last twelve months ended October 1, 2023, with bookings of $27.7 million for the three months ended October 1, 2023, and bookings of $244.8 million for the last twelve months ended October 1, 2023. Total backlog for KUS at the end of the third quarter of 2023 was $227.8 million compared to $256.7 million at the end of the second quarter of 2023.
For the third quarter of 2023, KGS Revenues of $217.9 million increased organically 22.0 percent from Revenues of $178.6 million in the third quarter of 2022. The increased Revenues includes organic revenue growth in our Space, Satellite and Cyber, Turbine Technologies, C5ISR, Microwave Electronics Products and Training Solutions businesses.
KGS reported operating income of $15.9 million in the third quarter of 2023 compared to $3.3 million in the third quarter of 2022, primarily reflecting a more favorable mix and increased revenue volume. Third quarter 2023 KGS Adjusted EBITDA was $22.3 million, compared to third quarter 2022 KGS Adjusted EBITDA of $17.9 million, primarily reflecting the more favorable mix and increased revenue.
Kratos’ Space, Satellite and Cyber business generated Revenues of $105.5 million in the third quarter of 2023 compared to $85.8 million in the third quarter of 2022, reflecting a 23.0 percent organic growth rate.
KGS reported a book-to-bill ratio of 1.2 to 1.0 for the third quarter of 2023, a book to bill ratio of 1.1 to 1.0 for the last twelve months ended October 1, 2023 and bookings of $254.6 million and $863.9 million for the three and last twelve months ended October 1, 2023, respectively. KGS includes Kratos’ Space, Satellite, Cyber and Training Solutions business, which reported a book to bill ratio of 1.4 to 1.0 for the third quarter of 2023 and a book to bill ratio of 1.2 to 1.0 for the last twelve months ended October 1, 2023. Bookings for Kratos’ Space, Satellite, Cyber and Training business for the three months and last twelve months ended October 1, 2023 were $153.6 million and $472.8 million, respectively. KGS’s total backlog at the end of the third quarter of 2023 was $937.3 million, as compared to $900.6 million at the end of the second quarter of 2023.
Kratos reported consolidated bookings of $282.3 million and a book-to-bill ratio of 1.0 to 1.0 for the third quarter of 2023, and consolidated bookings of $1.11 billion and a book-to-bill ratio of 1.1 to 1.0 for the last twelve months ended October 1, 2023. Consolidated backlog was $1.17 billion on October 1, 2023 and $1.16 billion on June 25, 2023. Kratos’ bid and proposal pipeline was $10.3 billion at October 1, 2023, up from $10.0 billion at June 25, 2023. Backlog at October 1, 2023 included funded backlog of $850.9 million and unfunded backlog of $314.1 million.
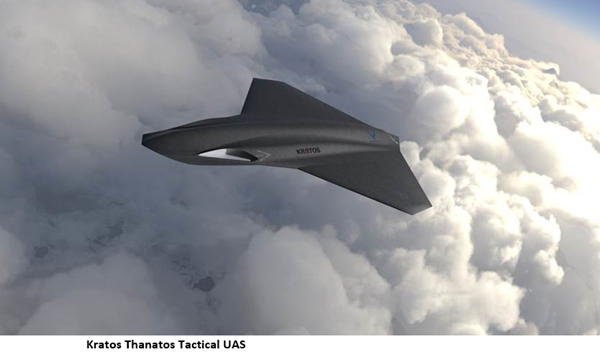
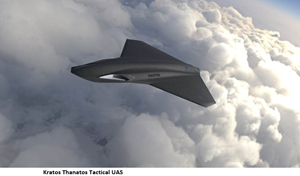
Kratos Thanatos Tactical UAV in Flight – Conceptual Rendition is available at
https://www.globenewswire.com/NewsRoom/AttachmentNg/e3429ec2-3495-4dba-95af-0cf2bb9f065e
Eric DeMarco, Kratos’ President and CEO, said, “Kratos continues to successfully execute our stated strategy of making targeted investments and being first to market, with relevant technology, products, systems and software, in mission critical, well-funded, high demand priority areas, which is reflected in our 20% third quarter organic growth rate. At Kratos, affordability is a technology, better is the enemy of good enough – ready to go today, and quantities have a quality all of its own, all of which are clearly being demonstrated geopolitically in multiple conflict areas.”
Mr. DeMarco continued, “Representative of the strength of Kratos’ strategy and our business, we have increased our full year 2023 revenue guidance and we are currently forecasting base case, which excludes potential tactical drone production orders, 2024 over 2023 revenue growth of 10%, with increased EBITDA. Additionally, based on recent large new program opportunities we are pursuing, we are now planning on certain additional investments in 2024, including in the tactical drone and satellite areas, in order to position the Company for potentially even greater growth in 2025 and beyond. Among the new opportunities we are pursuing, we are in discussions with a customer and hope to be under contract next year related to certain other Kratos tactical drone systems, including Thanatos and we are now in source selection on a significant new satellite opportunity with Kratos’ virtualized OpenSpace software system.”
Mr. DeMarco concluded, “Our primary operational challenge remains the obtaining, retaining, and related escalating cost of qualified individuals, including those willing and able to obtain a National Security clearance. As a result, though we expect continued future year over year profit margin expansion, including as noted with our Q3 results and affirmed Q4 EBITDA guidance, we will be cautious in our future EBITDA forecast. Also, as the industry and Kratos are currently operating under a Continuing Resolution Authorization, similar to previous years, we will wait to release our detailed fiscal 2024 business financial forecast in February 2024, when we report our fiscal 2023 results, as we should then have better budgetary and programmatic clarity.”
Financial Guidance
We are providing our initial 2023 fourth quarter financial guidance and increasing our full year 2023 Revenue and affirming our Adjusted EBITDA guidance today, which includes our current forecasted business mix, and our assumptions, including as related to: employee sourcing, hiring and retention; manufacturing, production and supply chain disruptions; parts shortages and related continued potential significant cost and price increases, including for employees, materials and components that are impacting the industry and Kratos. The range of our expected fourth quarter 2023 Revenues and Adjusted EBITDA includes assumptions of forecasted execution, including the number and estimated costs of qualified personnel expected to be obtained and retained to successfully execute on our programs and contracts, as well as expected contract awards. Our revised full year 2023 cash flow guidance reflects the ongoing impact of working capital requirements to fund revenue growth, including the increased estimated FY23 revenues, and the continued increase in inventory balances, as well as the shift of certain payment milestones primarily in our Training Solutions and C5ISR businesses.
Our fourth quarter and full year 2023 guidance ranges are as follows:
| Current Guidance Range | ||
| $M | Q423 | FY23 |
| Revenues | $237 – $257 | $1,000 – $1,020 |
| R&D | $9 – $10 | $40 – $42 |
| Operating Income | $4 – $7 | $25 – $28 |
| Depreciation | $7 – $8 | $27 – $28 |
| Amortization | $2 – $3 | $8 – $10 |
| Stock Based Compensation | $6 – $7 | $24 – $26 |
| Adjusted EBITDA | $19 – $23 | $85 – $89 |
| Operating Cash Flow | $20 – $30 | |
| Capital Expenditures | $45 – $50 | |
| Free Cash Flow Use | $(20) – $(25) | |
Management will discuss the Company’s financial results, on a conference call beginning at 2:00 p.m. Pacific (5:00 p.m. Eastern) today. The call will be available at www.kratosdefense.com. Participants may register for the call using this Online Form. Upon registration, all telephone participants will receive the dial-in number along with a unique PIN that can be used to access the call. For those who cannot access the live broadcast, a replay will be available on Kratos’ website.
About Kratos Defense & Security Solutions
Kratos Defense & Security Solutions, Inc. (NASDAQ: KTOS) is a Technology Company that develops and fields transformative, affordable systems, products and solutions for United States National Security, our allies and global commercial enterprises. At Kratos, Affordability is a Technology, and Kratos is changing the way breakthrough technology is rapidly brought to market – at a low cost – with actual products, systems, and technologies rather than slide decks or renderings. Through proven commercial and venture capital backed approaches, including proactive, internally funded research and streamlined development processes, Kratos is focused on being First to Market with our solutions, well in advance of competition. Kratos is the recognized Technology Disruptor in our core market areas, including Space and Satellite Communications, Cyber Security and Warfare, Unmanned Systems, Rocket and Hypersonic Systems, Next-Generation Jet Engines and Propulsion Systems, Microwave Electronics, C5ISR and Virtual and Augmented Reality Training Systems. For more information, visit www.KratosDefense.com.
Notice Regarding Forward-Looking Statements
This news release contains certain forward-looking statements that involve risks and uncertainties, including, without limitation, express or implied statements concerning the Company’s expectations regarding its future financial performance, including the Company’s expectations for its fourth quarter and full year 2023 revenues, R&D, operating income (loss), depreciation, amortization, stock based compensation expense, and Adjusted EBITDA, and full year 2023 operating cash flow, capital expenditures and other investments, and free cash flow, the Company’s future growth trajectory and ability to achieve improved revenue mix and profit in certain of its business segments and the expected timing of such improved revenue mix and profit, including the Company’s ability to achieve sustained year over year increasing revenues, profitability and cash flow, the Company’s expectation of ramp on projects and that investments in its business, including Company funded R&D expenses and ongoing development efforts, will result in an increase in the Company’s market share and total addressable market and position the Company for significant future organic growth, profitability, cash flow and an increase in shareholder value, the Company’s bid and proposal pipeline and backlog, including the Company’s ability to timely execute on its backlog, demand for its products and services, including the Company’s alignment with today’s National Security requirements and the positioning of its C5ISR and other businesses, planned 2024 investments, including in the tactical drone and satellite areas, and the related potential for additional growth in 2025, ability to successfully compete and expected new customer awards, including the magnitude and timing of funding and the future opportunity associated with such awards, including in the target and tactical drone and satellite communication areas, performance of key contracts and programs, including the timing of production and demonstration related to certain of the Company’s contracts and product offerings, the impact of the Company’s restructuring efforts and cost reduction measures, including its ability to improve profitability and cash flow in certain business units as a result of these actions and to achieve financial leverage on fixed administrative costs, the ability of the Company’s advanced purchases of inventory to mitigate supply chain disruptions and the timing of converting these investments to cash through the sales process, benefits to be realized from the Company’s net operating loss carry forwards, the availability and timing of government funding for the Company’s offerings, including the strength of the future funding environment, the short-term delays that may occur as a result of Continuing Resolutions or delays in U.S. Department of Defense (DoD) budget approvals, timing of LRIP and full rate production related to the Company’s unmanned aerial target system offerings, as well as the level of recurring revenues expected to be generated by these programs once they achieve full rate production, market and industry developments, and the current estimated impact of COVID-19 and employee absenteeism, supply chain disruptions, availability of an experienced skilled workforce, inflation and increased costs, and delays in our financial projections, industry, business and operations, including projected growth. Such statements are only predictions, and the Company’s actual results may differ materially from the results expressed or implied by these statements. Investors are cautioned not to place undue reliance on any such forward-looking statements. All such forward-looking statements speak only as of the date they are made, and the Company undertakes no obligation to update or revise these statements, whether as a result of new information, future events or otherwise. Factors that may cause the Company’s results to differ include, but are not limited to: risks to our business and financial results related to the reductions and other spending constraints imposed on the U.S. Government and our other customers, including as a result of sequestration and extended continuing resolutions, the Federal budget deficit and Federal government shut-downs; risks of adverse regulatory action or litigation; risks associated with debt leverage and cost savings and cash flow improvements expected as a result of the refinancing of our Senior Notes; risks that our cost-cutting initiatives will not provide the anticipated benefits; risks that changes, cutbacks or delays in spending by the DoD may occur, which could cause delays or cancellations of key government contracts; risks of delays to or the cancellation of our projects as a result of protest actions submitted by our competitors; risks that changes may occur in Federal government (or other applicable) procurement laws, regulations, policies and budgets; risks of the availability of government funding for the Company’s products and services due to performance, cost growth, or other factors, changes in government and customer priorities and requirements (including cost-cutting initiatives, the potential deferral of awards, terminations or reduction of expenditures to respond to the priorities of Congress and the Administration, or budgetary cuts resulting from Congressional committee recommendations or automatic sequestration under the Budget Control Act of 2011, as amended); risks that the unmanned aerial systems and unmanned ground sensor markets do not experience significant growth; risks that products we have developed or will develop will become programs of record; risks that we cannot expand our customer base or that our products do not achieve broad acceptance which could impact our ability to achieve our anticipated level of growth; risks of increases in the Federal government initiatives related to in-sourcing; risks related to security breaches, including cyber security attacks and threats or other significant disruptions of our information systems, facilities and infrastructures; risks related to our compliance with applicable contracting and procurement laws, regulations and standards; risks related to the new DoD Cybersecurity Maturity Model Certification; risks relating to the ongoing conflict in Ukraine and the Israeli-Palestinian military conflict; risks to our business in Israel; risks related to contract performance; risks related to failure of our products or services; risks associated with our subcontractors’ or suppliers’ failure to perform their contractual obligations, including the appearance of counterfeit or corrupt parts in our products; changes in the competitive environment (including as a result of bid protests); failure to successfully integrate acquired operations and compete in the marketplace, which could reduce revenues and profit margins; risks that potential future goodwill impairments will adversely affect our operating results; risks that anticipated tax benefits will not be realized in accordance with our expectations; risks that a change in ownership of our stock could cause further limitation to the future utilization of our net operating losses; risks that we may be required to record valuation allowances on our net operating losses which could adversely impact our profitability and financial condition; risks that the current economic environment will adversely impact our business, including with respect to our ability to recruit and retain sufficient numbers of qualified personnel to execute on our programs and contracts, as well as expected contract awards and risks related to increasing interest rates and risks related to the interest rate swap contract to hedge Term SOFR associated with the Company’s Term Loan A; currently unforeseen risks associated with COVID-19 and risks related to natural disasters or severe weather. These and other risk factors are more fully discussed in the Company’s Annual Report on Form 10-K for the period ended December 25, 2022, and in our other filings made with the Securities and Exchange Commission.
Note Regarding Use of Non-GAAP Financial Measures and Other Performance Metrics
This news release contains non-GAAP financial measures, including Adjusted EPS (computed using income from continuing operations before income taxes, excluding income (loss) from discontinued operations, excluding income (loss) attributable to non-controlling interest, excluding depreciation, amortization of intangible assets, amortization of capitalized contract and development costs, stock-based compensation expense, acquisition and restructuring related items and other, which includes, but is not limited to, legal related items, non-recoverable rates and costs, and foreign transaction gains and losses, less the estimated impact to income taxes) and Adjusted EBITDA (which includes net income (loss) attributable to noncontrolling interest and excludes, among other things, losses and gains from discontinued operations, acquisition and restructuring related items, stock compensation expense, foreign transaction gains and losses, and the associated margin rates). Additional non-GAAP financial measures include Free Cash Flow from Operations computed as Cash Flow from Operations less Capital Expenditures plus proceeds from sale of assets and Adjusted EBITDA related to our KUS and KGS businesses. Kratos believes this information is useful to investors because it provides a basis for measuring the Company’s available capital resources, the actual and forecasted operating performance of the Company’s business and the Company’s cash flow, excluding non-recurring items and non-cash items that would normally be included in the most directly comparable measures calculated and presented in accordance with GAAP. The Company’s management uses these non-GAAP financial measures, along with the most directly comparable GAAP financial measures, in evaluating the Company’s actual and forecasted operating performance, capital resources and cash flow. Non-GAAP financial measures should not be considered in isolation from, or as a substitute for, financial information presented in compliance with GAAP, and investors should carefully evaluate the Company’s financial results calculated in accordance with GAAP and reconciliations to those financial results. In addition, non-GAAP financial measures as reported by the Company may not be comparable to similarly titled amounts reported by other companies. As appropriate, the most directly comparable GAAP financial measures and information reconciling these non-GAAP financial measures to the Company’s financial results prepared in accordance with GAAP are included in this news release.
Another Performance Metric the Company believes is a key performance indicator in our industry is our Book to Bill Ratio as it provides investors with a measure of the amount of bookings or contract awards as compared to the amount of revenues that have been recorded during the period and provides an indicator of how much of the Company’s backlog is being burned or utilized in a certain period. The Book to Bill Ratio is computed as the number of bookings or contract awards in the period divided by the revenues recorded for the same period. The Company believes that the rolling or last twelve months’ Book to Bill Ratio is meaningful since the timing of quarter-to-quarter bookings can vary.
Press Contact:
Yolanda White
858-812-7302 Direct
Investor Information:
877-934-4687
investor@kratosdefense.com
| Kratos Defense & Security Solutions, Inc. | ||||||||||||||||
| Unaudited Condensed Consolidated Statements of Operations | ||||||||||||||||
| (in millions, except per share data) | ||||||||||||||||
| Three Months Ended | Nine Months Ended | |||||||||||||||
| October 1, | September 25, | October 1, | September 25, | |||||||||||||
| 2023 | 2022 | 2023 | 2022 | |||||||||||||
| Service revenues | $ | 106.5 | $ | 88.6 | $ | 301.8 | $ | 235.3 | ||||||||
| Product sales | 168.1 | 140.0 | 461.5 | 413.7 | ||||||||||||
| Total revenues | 274.6 | 228.6 | 763.3 | 649.0 | ||||||||||||
| Cost of service revenues | 79.0 | 65.1 | 227.2 | 171.2 | ||||||||||||
| Cost of product sales | 122.2 | 108.6 | 339.4 | 313.2 | ||||||||||||
| Total costs | 201.2 | 173.7 | 566.6 | 484.4 | ||||||||||||
| Gross profit – service revenues | 27.5 | 23.5 | 74.6 | 64.1 | ||||||||||||
| Gross profit – product sales | 45.9 | 31.4 | 122.1 | 100.5 | ||||||||||||
| Total gross profit | 73.4 | 54.9 | 196.7 | 164.6 | ||||||||||||
| Selling, general and administrative expenses | 47.5 | 44.2 | 136.7 | 126.1 | ||||||||||||
| Acquisition and restructuring related items and other | – | 0.4 | 0.9 | 7.0 | ||||||||||||
| Research and development expenses | 10.3 | 9.6 | 30.4 | 28.0 | ||||||||||||
| Depreciation | 1.9 | 1.3 | 4.8 | 3.9 | ||||||||||||
| Amortization of intangible assets | 1.5 | 3.0 | 4.5 | 6.3 | ||||||||||||
| Operating income (loss) | 12.2 | (3.6 | ) | 19.4 | (6.7 | ) | ||||||||||
| Interest expense, net | (5.1 | ) | (4.1 | ) | (15.5 | ) | (12.9 | ) | ||||||||
| Loss on extinguishment of debt | – | – | – | (13.0 | ) | |||||||||||
| Other expense, net | (0.3 | ) | (1.1 | ) | (0.4 | ) | (1.0 | ) | ||||||||
| Income (loss) from continuing operations before income taxes | 6.8 | (8.8 | ) | 3.5 | (33.6 | ) | ||||||||||
| Provision (benefit) for income taxes from continuing operations | 3.8 | (0.8 | ) | 6.9 | (4.6 | ) | ||||||||||
| Income (loss) from continuing operations | 3.0 | (8.0 | ) | (3.4 | ) | (29.0 | ) | |||||||||
| Income from discontinued operations, net of income taxes | – | – | 0.2 | 0.7 | ||||||||||||
| Net income (loss) | 3.0 | (8.0 | ) | (3.2 | ) | (28.3 | ) | |||||||||
| Less: Net income attributable to noncontrolling interest | 4.6 | – | – | 8.1 | 0.3 | |||||||||||
| Net loss attributable to Kratos | $ | (1.6 | ) | $ | (8.0 | ) | $ | (11.3 | ) | $ | (28.6 | ) | ||||
| Basic and diluted loss per common share attributable to Kratos: | ||||||||||||||||
| Loss from continuing operations | $ | (0.01 | ) | $ | (0.06 | ) | $ | (0.09 | ) | $ | (0.23 | ) | ||||
| Income from discontinued operations | – | – | – | – | ||||||||||||
| Net loss | (0.01 | ) | $ | (0.06 | ) | $ | (0.09 | ) | $ | (0.23 | ) | |||||
| Basic and diluted weighted average common shares outstanding | 129.6 | 127.2 | 129.3 | 126.5 | ||||||||||||
| Adjusted EBITDA (1) | $ | 27.7 | $ | 20.0 | $ | 66.3 | $ | 51.5 | ||||||||
| Unaudited Reconciliation of GAAP to Non-GAAP Measures | ||||||||||||||||
| Note: (1) Adjusted EBITDA is a non-GAAP measure defined as GAAP net loss attributable to Kratos adjusted for net income attributable to noncontrolling interest, income from discontinued operations, net interest expense, provision (benefit) for income taxes, depreciation and amortization expense of intangible assets, amortization of capitalized contract and development costs, stock-based compensation, acquisition and restructuring related items and other, and foreign transaction loss. | ||||||||||||||||
| Adjusted EBITDA as calculated by us may be calculated differently than Adjusted EBITDA for other companies. We have provided Adjusted EBITDA because we believe it is a commonly used measure of financial performance in comparable companies and is provided to help investors evaluate companies on a consistent basis, as well as to enhance understanding of our operating results. Adjusted EBITDA should not be construed as either an alternative to net income (loss) or as an indicator of our operating performance or an alternative to cash flows as a measure of liquidity. The adjustments to calculate this non-GAAP financial measure and the basis for such adjustments are outlined below. Please refer to the following table below that reconciles GAAP net loss to Adjusted EBITDA. | ||||||||||||||||
| The adjustments to calculate this non-GAAP financial measure, and the basis for such adjustments, are outlined below: | ||||||||||||||||
| Interest income and interest expense, net. The Company receives interest income on investments and incurs interest expense on loans, capital leases and other financing arrangements, including the amortization of issue discounts and deferred financing costs. These amounts may vary from period to period due to changes in cash and debt balances. | ||||||||||||||||
| Income taxes. The Company’s tax expense can fluctuate materially from period to period due to tax adjustments that may not be directly related to underlying operating performance or to the current period of operations and may not necessarily reflect the impact of utilization of our NOLs. | ||||||||||||||||
| Depreciation. The Company incurs depreciation expense (recorded in cost of revenues and in operating expenses) related to capital assets purchased, leased or constructed to support the ongoing operations of the business. The assets are recorded at cost or fair value and are depreciated over the estimated useful lives of individual assets. | ||||||||||||||||
| Amortization of intangible assets. The Company incurs amortization of intangible expense related to acquisitions it has made. These intangible assets are valued at the time of acquisition and are amortized over the estimated useful lives. | ||||||||||||||||
| Amortization of capitalized contract and development costs. The Company incurs amortization of previously capitalized software development and non-recurring engineering costs related to certain targets in its Unmanned Systems and ballistic missile target businesses as these units are sold. | ||||||||||||||||
| Stock-based compensation expense. The Company incurs expense related to stock-based compensation included in its GAAP presentation of selling, general and administrative expense. Although stock-based compensation is an expense of the Company and viewed as a form of compensation, these expenses vary in amount from period to period, and are affected by market forces that are difficult to predict and are not within the control of management, such as the market price and volatility of the Company’s shares, risk-free interest rates and the expected term and forfeiture rates of the awards. Management believes that exclusion of these expenses allows comparison of operating results to those of other companies that disclose non-GAAP financial measures that exclude stock-based compensation. | ||||||||||||||||
| Foreign transaction (gain) loss. The Company incurs transaction gains and losses related to transactions with foreign customers in currencies other than the U.S. dollar. In addition, certain intercompany transactions can give rise to realized and unrealized foreign currency gains and losses. | ||||||||||||||||
| Acquisition and transaction related items. The Company incurs transaction related costs, such as legal and accounting fees and other expenses, related to acquisitions and divestiture activities. Management believes these items are outside the normal operations of the Company’s business and are not indicative of ongoing operating results. | ||||||||||||||||
| Restructuring costs. The Company incurs restructuring costs for cost reduction actions which include employee termination costs, facility shut-down related costs and lease commitment costs for unused, excess or exited facilities. Management believes that these costs are not indicative of ongoing operating results as they are either non-recurring and/or not expected when full capacity and volumes are achieved. | ||||||||||||||||
| Non-recoverable rates and costs. In fiscal 2022, the Company incurred non-recoverable rates and costs as a result of its inability to hire the required direct labor base to execute on its backlog due to a challenging environment in hiring and retaining skilled personnel. In addition, in 2022 the Company incurred non-recoverable rate growth resulting from a smaller than planned direct labor base due to delays in customer program execution and awards. | ||||||||||||||||
| Legal related items. The Company incurs costs related to pending legal settlements and other legal related matters. Management believes these items are outside the normal operations of the Company’s business and are not indicative of ongoing operating results. | ||||||||||||||||
| Adjusted EBITDA is a non-GAAP financial measure and should not be considered in isolation or as a substitute for financial information provided in accordance with GAAP. This non-GAAP financial measure may not be computed in the same manner as similarly titled measures used by other companies. The Company expects to continue to incur expenses similar to the Adjusted EBITDA financial adjustments described above, and investors should not infer from the Company’s presentation of this non-GAAP financial measure that these costs are unusual, infrequent, or non-recurring. | ||||||||||||||||
| Reconciliation of Net Loss attributable to Kratos to Adjusted EBITDA is as follows: | ||||||||||||||||
| Three Months Ended | Nine Months Ended | |||||||||||||||
| October 1, | September 25, | October 1, | September 25, | |||||||||||||
| 2023 | 2022 | 2023 | 2022 | |||||||||||||
| Net loss attributable to Kratos | $ | (1.6 | ) | $ | (8.0 | ) | $ | (11.3 | ) | $ | (28.6 | ) | ||||
| Income from discontinued operations, net of income taxes | – | – | (0.2 | ) | (0.7 | ) | ||||||||||
| Interest expense, net | 5.1 | 4.1 | 15.5 | 12.9 | ||||||||||||
| Loss on extinguishment of debt | – | – | – | 13.0 | ||||||||||||
| Provision (benefit) for income taxes from continuing operations | 3.8 | (0.8 | ) | 6.9 | (4.6 | ) | ||||||||||
| Depreciation (including cost of service revenues and product sales) | 6.7 | 5.9 | 19.5 | 16.5 | ||||||||||||
| Stock-based compensation | 6.4 | 6.6 | 19.0 | 19.9 | ||||||||||||
| Foreign transaction loss | 0.4 | 1.4 | 1.4 | 1.5 | ||||||||||||
| Amortization of intangible assets | 1.5 | 3.0 | 4.5 | 6.3 | ||||||||||||
| Amortization of capitalized contract and development costs | 0.8 | 0.4 | 2.0 | 1.0 | ||||||||||||
| Acquisition and restructuring related items and other | – | 7.4 | 0.9 | 14.0 | ||||||||||||
| Plus: Net income attributable to noncontrolling interest | 4.6 | – | 8.1 | 0.3 | ||||||||||||
| Adjusted EBITDA | $ | 27.7 | $ | 20.0 | $ | 66.3 | $ | 51.5 | ||||||||
| Reconciliation of acquisition and restructuring related items and other included in Adjusted EBITDA: | ||||||||||||||||
| Three Months Ended | Nine Months Ended | |||||||||||||||
| October 1, | September 25, | October 1, | September 25, | |||||||||||||
| 2023 | 2022 | 2023 | 2022 | |||||||||||||
| Acquisition and transaction related items | $ | – | $ | 0.2 | $ | – | $ | 0.6 | ||||||||
| Restructuring costs | – | 0.8 | – | 1.1 | ||||||||||||
| Non-recoverable rates and costs | – | 6.4 | – | 6.4 | ||||||||||||
| Legal related items | – | – | 0.9 | 5.9 | ||||||||||||
| $ | – | $ | 7.4 | $ | 0.9 | $ | 14.0 | |||||||||
| Kratos Defense & Security Solutions, Inc. | ||||||||||||||||
| Unaudited Segment Data | ||||||||||||||||
| (in millions) | ||||||||||||||||
| Three Months Ended | Nine Months Ended | |||||||||||||||
| October 1, | September 25, | October 1, | September 25, | |||||||||||||
| 2023 | 2022 | 2023 | 2022 | |||||||||||||
| Revenues: | ||||||||||||||||
| Unmanned Systems | $ | 56.7 | $ | 50.0 | $ | 156.8 | $ | 159.0 | ||||||||
| Kratos Government Solutions | 217.9 | 178.6 | 606.5 | 490.0 | ||||||||||||
| Total revenues | $ | 274.6 | $ | 228.6 | $ | 763.3 | $ | 649.0 | ||||||||
| Operating income (loss) | ||||||||||||||||
| Unmanned Systems | $ | 2.6 | $ | (0.1 | ) | $ | 3.2 | $ | (4.6 | ) | ||||||
| Kratos Government Solutions | 15.9 | 3.3 | 35.2 | 18.4 | ||||||||||||
| Unallocated corporate expense, net | (6.3 | ) | (6.8 | ) | (19.0 | ) | (20.5 | ) | ||||||||
| Total operating income (loss) | $ | 12.2 | $ | (3.6 | ) | $ | 19.4 | $ | (6.7 | ) | ||||||
| Note: Unallocated corporate expense, net includes costs for certain stock-based compensation programs (including stock-based compensation costs for stock options, employee stock purchase plan and restricted stock units), the effects of items not considered part of management’s evaluation of segment operating performance, and acquisition and restructuring related items, corporate costs not allocated to the segments, legal related items, and other miscellaneous corporate activities. | ||||||||||||||||
| Reconciliation of Segment Operating Income (Loss) to Adjusted EBITDA is as follows: | ||||||||||||||||
| Three Months Ended | Nine Months Ended | |||||||||||||||
| October 1, | September 25, | October 1, | September 25, | |||||||||||||
| 2023 | 2022 | 2023 | 2022 | |||||||||||||
| Unmanned Systems | ||||||||||||||||
| Operating income (loss) | $ | 2.6 | $ | (0.1 | ) | $ | 3.2 | $ | (4.6 | ) | ||||||
| Other income (expense) | 0.1 | (0.1 | ) | 0.1 | – | |||||||||||
| Depreciation | 2.1 | 1.7 | 5.9 | 5.0 | ||||||||||||
| Amortization of intangible assets | 0.1 | 0.2 | 0.3 | 0.7 | ||||||||||||
| Amortization of capitalized contract and development costs | 0.5 | 0.4 | 1.3 | 1.0 | ||||||||||||
| Acquisition and restructuring related items and other | – | – | – | 5.9 | ||||||||||||
| Adjusted EBITDA | $ | 5.4 | $ | 2.1 | $ | 10.8 | $ | 8.0 | ||||||||
| % of revenue | 9.5 | % | 4.2 | % | 6.9 | % | 5.0 | % | ||||||||
| Kratos Government Solutions | ||||||||||||||||
| Operating income | $ | 15.9 | $ | 3.3 | $ | 35.2 | $ | 18.4 | ||||||||
| Other income | 0.1 | 0.4 | 0.9 | 0.5 | ||||||||||||
| Depreciation | 4.6 | 4.2 | 13.6 | 11.5 | ||||||||||||
| Amortization of intangible assets | 1.4 | 2.8 | 4.2 | 5.6 | ||||||||||||
| Amortization of capitalized contract and development costs | 0.3 | – | 0.7 | – | ||||||||||||
| Acquisition and restructuring related items and other | – | 7.2 | 0.9 | 7.5 | ||||||||||||
| Adjusted EBITDA | $ | 22.3 | $ | 17.9 | $ | 55.5 | $ | 43.5 | ||||||||
| % of revenue | 10.2 | % | 10.0 | % | 9.2 | % | 8.9 | % | ||||||||
| Total Adjusted EBITDA | $ | 27.7 | $ | 20.0 | $ | 66.3 | $ | 51.5 | ||||||||
| % of revenue | 10.1 | % | 8.7 | % | 8.7 | % | 7.9 | % | ||||||||
| Kratos Defense & Security Solutions, Inc. | ||||||||||||||||
| Unaudited Condensed Consolidated Balance Sheets | ||||||||||||||||
| (in millions) | ||||||||||||||||
| October 1, | December 25, | |||||||||||||||
| 2023 | 2022 | |||||||||||||||
| Assets | ||||||||||||||||
| Current assets: | ||||||||||||||||
| Cash and cash equivalents | $ | 42.2 | $ | 81.3 | ||||||||||||
| Accounts receivable, net | 351.9 | 328.5 | ||||||||||||||
| Inventoried costs | 150.1 | 125.5 | ||||||||||||||
| Prepaid expenses | 18.3 | 11.9 | ||||||||||||||
| Other current assets | 41.9 | 35.4 | ||||||||||||||
| Total current assets | 604.4 | 582.6 | ||||||||||||||
| Property, plant and equipment, net | 227.3 | 213.1 | ||||||||||||||
| Operating lease right-of-use assets | 50.6 | 47.4 | ||||||||||||||
| Goodwill | 558.2 | 558.2 | ||||||||||||||
| Intangible assets, net | 50.7 | 55.2 | ||||||||||||||
| Other assets | 99.6 | 95.0 | ||||||||||||||
| Total assets | $ | 1,590.8 | $ | 1,551.5 | ||||||||||||
| Liabilities and Stockholders’ Equity | ||||||||||||||||
| Current liabilities: | ||||||||||||||||
| Accounts payable | $ | 57.4 | $ | 57.3 | ||||||||||||
| Accrued expenses | 40.3 | 33.8 | ||||||||||||||
| Accrued compensation | 55.2 | 52.2 | ||||||||||||||
| Accrued interest | 1.8 | 1.5 | ||||||||||||||
| Billings in excess of costs and earnings on uncompleted contracts | 79.4 | 62.1 | ||||||||||||||
| Current portion of operating lease liabilities | 12.1 | 10.8 | ||||||||||||||
| Other current liabilities | 15.9 | 15.6 | ||||||||||||||
| Other current liabilities of discontinued operations | 0.9 | 0.9 | ||||||||||||||
| Total current liabilities | 263.0 | 234.2 | ||||||||||||||
| Long-term debt | 234.2 | 250.2 | ||||||||||||||
| Operating lease liabilities, net of current portion | 43.0 | 40.8 | ||||||||||||||
| Other long-term liabilities | 76.8 | 77.4 | ||||||||||||||
| Other long-term liabilities of discontinued operations | 1.1 | 1.4 | ||||||||||||||
| Total liabilities | 618.1 | 604.0 | ||||||||||||||
| Commitments and contingencies | ||||||||||||||||
| Redeemable noncontrolling interest | 19.3 | 11.2 | ||||||||||||||
| Stockholders’ equity: | ||||||||||||||||
| Additional paid-in capital | 1,633.5 | 1,608.4 | ||||||||||||||
| Accumulated other comprehensive loss | 2.5 | (0.8 | ) | |||||||||||||
| Accumulated deficit | (682.6 | ) | (671.3 | ) | ||||||||||||
| Total Kratos stockholders’ equity | 953.4 | 936.3 | ||||||||||||||
| Total liabilities and stockholders’ equity | $ | 1,590.8 | $ | 1,551.5 | ||||||||||||
| Kratos Defense & Security Solutions, Inc. | ||||||||||||||||
| Unaudited Condensed Consolidated Statements of Cash Flows | ||||||||||||||||
| (in millions) | ||||||||||||||||
| Nine Months Ended | ||||||||||||||||
| October 1, | September 25, | |||||||||||||||
| 2023 | 2022 | |||||||||||||||
| Operating activities: | ||||||||||||||||
| Net loss | $ | (3.2 | ) | $ | (28.3 | ) | ||||||||||
| Less: income from discontinued operations | 0.2 | 0.7 | ||||||||||||||
| Loss from continuing operations | (3.4 | ) | (29.0 | ) | ||||||||||||
| Adjustments to reconcile loss from continuing operations to net cash used in operating activities from continuing operations: | ||||||||||||||||
| Depreciation and amortization | 24.0 | 22.8 | ||||||||||||||
| Amortization of lease right-of-use assets | 8.5 | 7.8 | ||||||||||||||
| Deferred income taxes | 0.1 | 0.3 | ||||||||||||||
| Stock-based compensation | 19.0 | 19.9 | ||||||||||||||
| Litigation related charges | – | 5.5 | ||||||||||||||
| Amortization of deferred financing costs | 0.5 | 0.6 | ||||||||||||||
| Loss on extinguishment of debt | – | 13.0 | ||||||||||||||
| Provision for doubtful accounts | 1.0 | – | ||||||||||||||
| Changes in assets and liabilities, net of acquisitions: | ||||||||||||||||
| Accounts receivable | (23.5 | ) | 17.0 | |||||||||||||
| Unbilled receivables | (9.1 | ) | (18.2 | ) | ||||||||||||
| Inventoried costs | (23.7 | ) | (28.0 | ) | ||||||||||||
| Prepaid expenses and other assets | (15.7 | ) | (17.4 | ) | ||||||||||||
| Operating lease liabilities | (8.2 | ) | (7.7 | ) | ||||||||||||
| Accounts payable | (0.6 | ) | 1.0 | |||||||||||||
| Accrued compensation | 3.1 | 3.0 | ||||||||||||||
| Accrued expenses | 6.4 | 1.1 | ||||||||||||||
| Accrued interest | 0.3 | (1.2 | ) | |||||||||||||
| Billings in excess of costs and earnings on uncompleted contracts | 17.4 | (10.6 | ) | |||||||||||||
| Income tax receivable and payable | 1.9 | (8.3 | ) | |||||||||||||
| Other liabilities | (0.2 | ) | (3.9 | ) | ||||||||||||
| Net cash used in operating activities from continuing operations | (2.2 | ) | (32.3 | ) | ||||||||||||
| Investing activities: | ||||||||||||||||
| Cash paid for acquisitions, net of cash acquired | – | (132.2 | ) | |||||||||||||
| Capital expenditures | (33.1 | ) | (34.8 | ) | ||||||||||||
| Proceeds from sale of assets | 8.3 | 0.1 | ||||||||||||||
| Net cash used in investing activities from continuing operations | (24.8 | ) | (166.9 | ) | ||||||||||||
| Financing activities: | ||||||||||||||||
| Proceeds from the issuance of long-term debt | – | 200.0 | ||||||||||||||
| Borrowing under credit facility | 54.0 | 100.0 | ||||||||||||||
| Redemption of Senior Secured Notes | – | (309.8 | ) | |||||||||||||
| Repayment under credit facility, term loan and other debt | (67.8 | ) | (1.2 | ) | ||||||||||||
| Debt issuance costs | – | (3.2 | ) | |||||||||||||
| Payment under finance leases | (1.2 | ) | (1.0 | ) | ||||||||||||
| Payments of employee taxes withheld from share-based awards | (3.6 | ) | (12.3 | ) | ||||||||||||
| Proceeds from shares issued under equity plans | 6.5 | 6.1 | ||||||||||||||
| Net cash used in financing activities from continuing operations | (12.1 | ) | (21.4 | ) | ||||||||||||
| Net cash flows from continuing operations | (39.1 | ) | (220.6 | ) | ||||||||||||
| Net operating cash flows of discontinued operations | – | (0.3 | ) | |||||||||||||
| Effect of exchange rate changes on cash and cash equivalents | – | (3.3 | ) | |||||||||||||
| Net decrease in cash, cash equivalents and restricted cash | (39.1 | ) | (224.2 | ) | ||||||||||||
| Cash, cash equivalents and restricted cash at beginning of period | 81.3 | 349.4 | ||||||||||||||
| Cash, cash equivalents and restricted cash at end of period | $ | 42.2 | $ | 125.2 | ||||||||||||
| Kratos Defense & Security Solutions, Inc. | ||||||||||||||||
| Unaudited Non-GAAP Measures | ||||||||||||||||
| Computation of Adjusted Earnings Per Share | ||||||||||||||||
| (in millions, except per share data) | ||||||||||||||||
| Adjusted income from continuing operations and adjusted income from continuing operations per diluted common share (Adjusted EPS) are non-GAAP measures for reporting financial performance and exclude the impact of certain items and, therefore, have not been calculated in accordance with GAAP. Management believes that exclusion of these items assists in providing a more complete understanding of the Company’s underlying continuing operations results and trends and allows for comparability with our peer company index and industry. The Company uses these measures along with the corresponding GAAP financial measures to manage the Company’s business and to evaluate its performance compared to prior periods and the marketplace. The Company defines adjusted income from continuing operations before amortization of intangible assets, depreciation, stock-based compensation, foreign transaction gain/loss, and acquisition and restructuring related items and other. The estimated impact to income taxes includes the impact to the effective tax rate, current tax provision and deferred tax provision, and excludes the impact of discrete items, including transaction related expenses and release of valuation allowance, or benefit related to the add-backs.* Adjusted EPS reflects adjusted income on a per share basis using weighted average diluted shares outstanding. | ||||||||||||||||
| The following table reconciles the most directly comparable GAAP financial measures to the non-GAAP financial measures. | ||||||||||||||||
| Three Months Ended | Nine Months Ended | |||||||||||||||
| October 1, | September 25, | October 1, | September 25, | |||||||||||||
| 2023 | 2022 | 2023 | 2022 | |||||||||||||
| Net loss attributable to Kratos | $ | (1.6 | ) | $ | (8.0 | ) | $ | (11.3 | ) | $ | (28.6 | ) | ||||
| Less: GAAP provision (benefit) for income taxes | 3.8 | (0.8 | ) | 6.9 | (4.6 | ) | ||||||||||
| Less: Net income attributable to noncontrolling interest | 4.6 | – | 8.1 | 0.3 | ||||||||||||
| Less: income from discontinued operations, net of income taxes | – | – | (0.2 | ) | (0.7 | ) | ||||||||||
| Income (loss) from continuing operations before taxes | 6.8 | (8.8 | ) | 3.5 | (33.6 | ) | ||||||||||
| Add: Amortization of intangible assets | 1.5 | 3.0 | 4.5 | 6.3 | ||||||||||||
| Add: Amortization of capitalized contract and development costs | 0.8 | 0.4 | 2.0 | 1.0 | ||||||||||||
| Add: Depreciation | 6.7 | 5.9 | 19.5 | 16.5 | ||||||||||||
| Add: Stock-based compensation | 6.4 | 6.6 | 19.0 | 19.9 | ||||||||||||
| Add: Loss on extinguishment of debt | – | – | – | 13.0 | ||||||||||||
| Add: Foreign transaction loss | 0.4 | 1.4 | 1.4 | 1.5 | ||||||||||||
| Add: Acquisition and restructuring related items and other | – | 7.4 | 0.9 | 14.0 | ||||||||||||
| Non-GAAP Adjusted income from continuing operations before income taxes | 22.6 | 15.9 | 50.8 | 38.6 | ||||||||||||
| Income taxes on Non-GAAP measure Adjusted income from continuing operations* | 6.9 | 5.7 | 15.5 | 13.9 | ||||||||||||
| Non-GAAP Adjusted net income | $ | 15.7 | $ | 10.2 | $ | 35.3 | $ | 24.7 | ||||||||
| Diluted earnings per common share | $ | (0.01 | ) | $ | (0.06 | ) | $ | (0.09 | ) | $ | (0.23 | ) | ||||
| Less: GAAP provision (benefit) for income taxes | 0.03 | (0.01 | ) | 0.05 | (0.03 | ) | ||||||||||
| Less: Net income attributable to noncontrolling interest | 0.03 | – | 0.06 | – | ||||||||||||
| Less: income from discontinued operations, net of income taxes | – | – | – | – | ||||||||||||
| Add: Amortization of intangible assets | 0.01 | 0.02 | 0.03 | 0.05 | ||||||||||||
| Add: Amortization of capitalized contract and development costs | 0.01 | – | 0.02 | 0.01 | ||||||||||||
| Add: Depreciation | 0.05 | 0.05 | 0.15 | 0.13 | ||||||||||||
| Add: Stock-based compensation | 0.05 | 0.05 | 0.15 | 0.16 | ||||||||||||
| Add: Loss on extinguishment of debt | – | – | – | 0.10 | ||||||||||||
| Add: Foreign transaction loss | – | 0.01 | 0.01 | 0.01 | ||||||||||||
| Add: Acquisition and restructuring related items and other | – | 0.06 | 0.01 | 0.11 | ||||||||||||
| Income taxes on Non-GAAP measure Adjusted income from continuing operations* | (0.05 | ) | (0.04 | ) | (0.12 | ) | (0.11 | ) | ||||||||
| Adjusted income from continuing operations per diluted common share | $ | 0.12 | $ | 0.08 | $ | 0.27 | $ | 0.20 | ||||||||
| Weighted average diluted common shares outstanding | 129.6 | 127.2 | 129.3 | 126.5 | ||||||||||||
| *The impact to income taxes is calculated by recasting income before income taxes to include the add-backs involved in determining Adjusted income from continuing operations before income taxes and recalculating the income tax provision, including current and deferred income taxes, using the Adjusted income from continuing operations before income taxes. The recalculation also adjusts for any discrete tax expense, including transaction related expenses and the release of valuation allowance, or benefit related to the add-backs. | ||||||||||||||||
Kratos Thanatos Tactical UAV in Flight – Conceptual Rendition
Source: Kratos Defense & Security Solutions, Inc.
