In a strategic move aimed at addressing the soaring demand for its revolutionary weight-loss drug, Wegovy, Novo Holdings, the parent company of Novo Nordisk, has disclosed plans to acquire contract drug maker Catalent for $11.5 billion in cash. This acquisition is poised to fortify Novo Nordisk’s production capabilities in response to the extraordinary demand for innovative weight loss and diabetes medications.
Novo Holdings will acquire Catalent for $11.5 billion in cash. As part of the deal, Novo Nordisk will purchase three Catalent fill-finish sites, bolstering the production of Wegovy and other crucial medications. The acquisition is strategically driven by the exceptional demand for Wegovy and Ozempic over the past year.
Novo anticipates that the deal will have a low single-digit percentage negative impact on operating profit growth in 2024 and 2025. The terms include the acquisition of all outstanding shares of Catalent for $63.50 per share in cash, representing a premium of 16.5% to the company’s last trading price. Novo will also assume Catalent’s debt, bringing the total enterprise value of the deal to $16.5 billion.
The acquisition is expected to gradually increase Novo’s filling capacity, with notable effects expected from 2026 onwards. The three fill-finish sites, located in Italy, Belgium, and Bloomington, Indiana, will play a crucial role in supporting Novo Nordisk’s expanding drug portfolio.
In the growing obesity drug market, Novo Nordisk faces competition from Eli Lilly’s Zepbound. Analysts estimate that the obesity drug market could reach $100 billion by the end of the decade, highlighting the immense potential for companies in this sector.
The acquisition aligns seamlessly with Novo Holdings’ strategy of investing in established life science companies with significant long-term potential. Catalent’s expertise in enabling pharmaceutical, biotech, and consumer health partners is in harmony with Novo Holdings’ commitment to improving health and sustainability.
The merger is anticipated to close by the end of calendar year 2024, subject to customary closing conditions, Catalent stockholder approval, and regulatory approvals. Catalent’s Board unanimously recommends that stockholders vote in favor of the merger, following an evaluation of value-maximizing alternatives.
Kasim Kutay, CEO of Novo Holdings, expressed excitement about the partnership with Catalent and emphasized their commitment to supporting Catalent’s growth and mission to develop products that enhance lives.
Novo Holdings’ acquisition of Catalent represents a strategic move to strengthen production capabilities and meet the escalating demand for transformative medications like Wegovy. As the merger progresses, it not only positions Novo Nordisk for continued success in the competitive pharmaceutical landscape but also aligns with Novo Holdings’ broader mission of investing in high-quality life sciences companies for the betterment of society and the planet. The industry will be closely watching the outcome of this significant acquisition, anticipating positive impacts on Novo Nordisk’s product development and market position.
Mark your calendars! Don’t miss Noble Capital Markets’ Emerging Growth Virtual Healthcare Equity Conference on April 17-18. This exclusive virtual event connects investors with 50 leading public biotech, healthcare services, and medical device companies. Presenting company slots are available…Read More
In a significant development within the metallurgical industry, Acerinox’s wholly owned U.S. subsidiary, North American Stainless, is set to acquire Haynes International (HAYN), a leading developer, manufacturer, and marketer of technologically advanced high-performance alloys. The all-cash transaction, valued at $798 million, positions Acerinox to fortify its global leadership in the high-performance alloy segment.
Under the definitive agreement, Acerinox will acquire all outstanding shares of Haynes for $61.00 per share in cash, reflecting a premium of approximately 22% to Haynes’s six-month volume-weighted average share price ending February 2, 2024. The enterprise value of the deal stands at approximately $970 million. The transaction has received unanimous approval from the Boards of Directors of both Haynes and Acerinox.
Strategic Benefits for Acerinox:
Global Leadership: Strengthens Acerinox’s global leadership in the high-performance alloy segment.
U.S. Market Expansion: Expands Acerinox’s presence in the U.S. market, creating new opportunities in the aerospace sector.
Strategic Investment: Haynes to reinvest around $200 million over the next four years, particularly in Haynes’s Kokomo operations, to establish an integrated HPA and stainless steel platform.
Synergies and Growth: Anticipates annual synergies of $71 million, primarily unlocked through the $200 million investment, fostering growth and margin enhancements.
Complementary Businesses: Creates additional value through the combination of complementary businesses, expanding U.S. operating capabilities and establishing a worldwide sales and distribution network.
Accelerated Growth: Provides a strong platform to accelerate growth in high-performance alloys and specialty stainless in North America.
R&D Capabilities: Adds extensive R&D capabilities and a significant patent portfolio, reinforcing Acerinox’s innovation potential.
Haynes’s Perspective:
Significant Premium: Delivers substantial value to Haynes stockholders, offering a premium of approximately 22% to the six-month volume-weighted average share price.
Long-Term Success: Ensures the long-term success of Haynes by validating the strength of the business and providing access to Acerinox’s financial strength and expertise.
Strategic Investment: The $170 million investment in Haynes’ operations supports continued growth in both flat and round products for the global market.
Enhanced Capacity: Positions Haynes to meet dynamic customer demands by increasing manufacturing capacity and offering more differentiated products, applications, and services with faster lead times.
Rich Heritage: Merges Haynes’ 112-year-strong foundation and leadership in high-performance alloys with the largest fully integrated stainless-steel company in the U.S.
Regarding the transaction, Noble Capital Markets Senior Research Analyst Mark Reichman stated, “In our opinion, the transaction provides a fair return for Haynes’ shareholders. Additionally, Acerinox has committed to investing $170 million into Haynes’ operations which will support the modernization and growth of the company’s global business in both flat and round products.” Mark initiated research coverage on Haynes International on February 16, 2023.
The information contained in this article, other than Mark’s quote, was derived from the individual press releases issued by the companies involved in this transaction. This press releases can be found here:
Haynes International (HAYN) is currently covered by Noble Capital Markets Senior Analyst Mark Reichman. Noble Capital Markets, Inc. is a subsidiary of Noble Financial Group, Inc., the parent company of Channelchek. All equity research on Channelchek is provided by Noble Capital Markets. No part of this article was prepared by Noble’s analysts. Please view Mark’s most recent research report on Haynes International for any applicable disclosures.
In a recent interview on “60 Minutes,” Federal Reserve Chair Jerome Powell underscored the central bank’s commitment to a cautious approach regarding interest rate cuts in the upcoming year. Powell emphasized that any rate adjustments would likely unfold at a slower pace than market expectations, signaling a deliberate strategy in response to prevailing economic conditions.
Powell expressed confidence in the current state of the economy, highlighting the need for substantial evidence of sustained inflation movement toward the 2% target before considering rate cuts. He also assured the general public that the upcoming presidential election would not influence the Federal Reserve’s decision-making process.
Powell indicated that the Federal Open Market Committee (FOMC) is unlikely to make its first move, in the form of a rate cut, in March. This statement contrasted with market expectations, which have been making aggressive bets on multiple rate cuts throughout the year.
While market pricing suggests the possibility of five quarter-percentage points reductions, Powell aligned with the FOMC’s December “dot plot,” which indicated three potential moves. This clarification sought to manage expectations and temper speculation surrounding the timing and extent of rate adjustments.
Powell acknowledged that inflation remains above the Fed’s target but has stabilized. The robust job market, with 353,000 non-farm jobs added in January, adds to the Federal Reserve’s positive outlook. Powell identified geopolitical events as the primary risk to the economy.
Following the interview, U.S. stocks experienced a decline, reacting to Powell’s cautious stance on rate cuts. The market had previously seen a week of volatility, concluding with weekly gains driven by a strong January jobs report and positive corporate earnings updates.
Powell addressed public perception of inflation, noting that while the official data may show stability, people are experiencing higher prices for basic necessities. He highlighted the dissatisfaction among the public with the current economic situation despite its overall strength. Powell clarified the distinction between inflation and the absolute price level of goods and services. He explained that people’s dissatisfaction often stems from the rising prices of essential items like bread, milk, eggs, and meats, even though the overall economy is performing well.
Powell acknowledged the challenge in communicating economic concepts to the public, noting the discrepancy between public sentiment and economic indicators. He addressed the professional investing public’s understanding of the rate of change in inflation compared to the general public’s focus on the absolute price level.
Powell’s reaffirmation of a cautious approach to rate cuts serves as a crucial communication strategy to manage market expectations and maintain confidence in the economic outlook. The interview highlighted the Federal Reserve’s commitment to data-driven decisions and its consideration of various economic factors in determining the timing and extent of any potential rate adjustments.
CALGARY, AB, Feb. 1, 2024 /CNW/ – InPlay Oil Corp. (TSX: IPO) (OTCQX: IPOOF) (“InPlay” or the “Company”) is pleased to confirm that its Board of Directors has declared a monthly cash dividend of $0.015 per common share payable on February 29, 2024, to shareholders of record at the close of business on February 15, 2024. The monthly cash dividend is expected to be designated as an “eligible dividend” for Canadian federal and provincial income tax purposes.
About InPlay Oil Corp.
InPlay is a junior oil and gas exploration and production company with operations in Alberta focused on light oil production. The company operates long-lived, low-decline properties with drilling development and enhanced oil recovery potential as well as undeveloped lands with exploration possibilities. The common shares of InPlay trade on the Toronto Stock Exchange under the symbol IPO and the OTCQX Exchange under the symbol IPOOF.
SOURCE InPlay Oil Corp.
For further information: please contact: Doug Bartole, President and Chief Executive Officer, InPlay Oil Corp., Telephone: (587) 955-0632, www.inplayoil.com; Darren Dittmer, Chief Financial Officer, InPlay Oil Corp., Telephone: (587) 955-0634
Saga Communications, Inc. is a broadcast company whose business is primarily devoted to acquiring, developing and operating radio stations. Saga currently owns or operates broadcast properties in 27 markets, including 79 FM and 33 AM radio stations. Saga’s strategy is to operate top billing radio stations in mid sized markets, defined as markets ranked (by market revenues) from 20 to 200. Saga’s radio stations employ a myriad of programming formats, including Active Rock, Adult Album Alternative, Adult Contemporary, Country, Classic Country, Classic Hits, Classic Rock, Contemporary Hits Radio, News/Talk, Oldies and Urban Contemporary. In operating its stations, Saga concentrates on the development of strong decentralized local management, which is responsible for the day-to-day operations of the stations in their market area and is compensated based on their financial performance as well as other performance factors that are deemed to effect the long-term ability of the stations to achieve financial objectives. Saga began operations in 1986 and became a publicly traded company in December 1992. The stock trades on NASDAQ under the ticker symbol “SGA”.
Michael Kupinski, Director of Research, Equity Research Analyst, Digital, Media & Technology , Noble Capital Markets, Inc.
Jacob Mutchler, Research Associate, Noble Capital Markets, Inc.
Refer to the full report for the price target, fundamental analysis, and rating.
Highlights from recent NDR. This report provides highlights of a recent Non Deal Road Show to investors in South Florida on January 30th and 31st. Chris Forgy, CEO, and Sam Bush, CFO, reinforced our favorable investment premise for the company.
A lot of headroom for growth. Management appeared sanguine about its revenue growth opportunities given its developing Digital businesses and focus on National, Non Traditional Revenue (Events), and e-commerce revenues. Digital revenue accounts for only 11% of its total revenue giving it a lot of headroom for growth, with some peers as much as 50% of revenue.
Equity Research is available at no cost to Registered users of Channelchek. Not a Member? Click ‘Join’ to join the Channelchek Community. There is no cost to register, and we never collect credit card information.
This Company Sponsored Research is provided by Noble Capital Markets, Inc., a FINRA and S.E.C. registered broker-dealer (B/D).
*Analyst certification and important disclosures included in the full report. NOTE: investment decisions should not be based upon the content of this research summary. Proper due diligence is required before making any investment decision.
DLH delivers improved health and readiness solutions for federal programs through research, development, and innovative care processes. The Company’s experts in public health, performance evaluation, and health operations solve the complex problems faced by civilian and military customers alike, leveraging digital transformation, artificial intelligence, advanced analytics, cloud-based applications, telehealth systems, and more. With over 2,300 employees dedicated to the idea that “Your Mission is Our Passion,” DLH brings a unique combination of government sector experience, proven methodology, and unwavering commitment to public health to improve the lives of millions. For more information, visit www.DLHcorp.com.
Joe Gomes, Managing Director, Equity Research Analyst, Generalist , Noble Capital Markets, Inc.
Joshua Zoepfel, Research Associate, Noble Capital Markets, Inc.
Refer to the full report for the price target, fundamental analysis, and rating.
Waiting on a Budget. The Continuing Resolution continues to hamper DLH’s growth efforts. The Company has plenty of opportunity and stands ready to capitalize on new RFPs. We believe once a budget is passed, there should be a strong flow of new business opportunity for DLH, which will drive organic growth.
1Q24 Bottom Line. The first quarter bottom line was positively impacted by two items. First, due to the CR and bidding opportunities, G&A costs fell to $7.7 million from $10.2 million in 4Q23. G&A costs are likely to remain somewhat muted until a more normal bidding environment emerges. The second was an abnormally low tax rate, 0.5% versus a more typical 25%, due to some discrete items.
Equity Research is available at no cost to Registered users of Channelchek. Not a Member? Click ‘Join’ to join the Channelchek Community. There is no cost to register, and we never collect credit card information.
This Company Sponsored Research is provided by Noble Capital Markets, Inc., a FINRA and S.E.C. registered broker-dealer (B/D).
*Analyst certification and important disclosures included in the full report. NOTE: investment decisions should not be based upon the content of this research summary. Proper due diligence is required before making any investment decision.
Mark Reichman, Managing Director, Equity Research Analyst, Natural Resources, Noble Capital Markets, Inc.
Refer to the full report for the price target, fundamental analysis, and rating.
Feasibility study expected in the first quarter of 2024. Century’sClayton Valley lithium project is among the most advanced pre-permitted lithium projects in North America with the third largest deposit in the United States. In2023, the company focused on pilot plant operations with the project feasibility study (FS) expected to be complete in the first quarter of 2024. Production will be consistent with the earlier preliminary feasibility study (PFS) although the company is examining the benefits of a phased approach to full scale production.
Feasibility study expectations. While weexpect the feasibility study to reflect higher capital and operating costs, the economics may improve relative to the PFS due to several factors. These include: 1) a higher base case pricing assumption for lithium carbonate equivalent that could be in the range of US$22,000 to US$25,000 per tonne compared to US$9,500 per tonne used in the PFS, 2) a potential economic benefit from the by-product sales of sodium hydroxide, 3) the leaching process will be based on using hydrochloric acid instead of sulfuric acid, and 4) the project will likely incorporate lower cost renewable solar or geothermal power. Based on improvements to the process flowsheet since the publication of the PFS, we expect a compelling feasibility study.
Equity Research is available at no cost to Registered users of Channelchek. Not a Member? Click ‘Join’ to join the Channelchek Community. There is no cost to register, and we never collect credit card information.
This Company Sponsored Research is provided by Noble Capital Markets, Inc., a FINRA and S.E.C. registered broker-dealer (B/D).
*Analyst certification and important disclosures included in the full report. NOTE: investment decisions should not be based upon the content of this research summary. Proper due diligence is required before making any investment decision.
Joe Gomes, Managing Director, Equity Research Analyst, Generalist , Noble Capital Markets, Inc.
Joshua Zoepfel, Research Associate, Noble Capital Markets, Inc.
Refer to the full report for the price target, fundamental analysis, and rating.
New Agreement. On Wednesday, Bit Digital finalized an agreement with Coinmint for 6 megawatts (MW) of incremental hosting capacity to power its miners, with the facility located in Massena, New York. The agreements brings the Company’s total contracted hosting capacity with Coinmint to approximately 46 MW, and has an initial one-year term with automatic three-month renewals.
New Machines. To fill the new capacity, Bit Digital purchased 2,340 S19k Pro mining units for $3.4 million, or approximately $13/TH. These mining units represent approximately 260PH/s with an average efficiency of 23 J/TH. The Company expects the miners to be delivered to the facility and hashing by the end of February 2024. We believe that more hosting agreements and purchases are to follow, given the Company’s goal of doubling its active mining fleet to approximately 6.0EH/s during 2024.
Equity Research is available at no cost to Registered users of Channelchek. Not a Member? Click ‘Join’ to join the Channelchek Community. There is no cost to register, and we never collect credit card information.
This Company Sponsored Research is provided by Noble Capital Markets, Inc., a FINRA and S.E.C. registered broker-dealer (B/D).
*Analyst certification and important disclosures included in the full report. NOTE: investment decisions should not be based upon the content of this research summary. Proper due diligence is required before making any investment decision.
For more than 45 years, 1-800-Flowers.com has offered truly original floral arrangements, plants and unique gifts to celebrate birthdays, anniversaries, everyday occasions, and seasonal holidays, and to deliver comfort during times of grief. Backed by a caring team obsessed with service, 1-800-Flowers.com provides customers thoughtful ways to express themselves and connect with the most important people in their lives. 1-800-Flowers.com is part of the 1-800-FLOWERS.COM, Inc. family of brands. Shares in 1-800-FLOWERS.COM, Inc. are traded on the NASDAQ Global Select Market, ticker symbol: FLWS.
Michael Kupinski, Director of Research, Equity Research Analyst, Digital, Media & Technology , Noble Capital Markets, Inc.
Jacob Mutchler, Research Associate, Noble Capital Markets, Inc.
Refer to the full report for the price target, fundamental analysis, and rating.
Adj. EBITDA exceeds expectations. The company had a solid Q2, even though revenue of $822.1 million was below our estimate of $830.1 million. Adj. EBITDA of $130.1 beat our estimate of $127.9 million, by 1.7%. Notably, the company’s cost reduction efforts and easing commodity costs have driven year-over-year gross margin improvement for 5 consecutive quarters.
Favorable margin outlook. The company reported strong gross margins of 43% in Q2, an improvement of 230 basis points from the prior year period. The favorable gross margin improvement was driven by lower in-bound shipping, labor and commodity costs. Notably, the company has made significant progress in returning gross margins to pre-pandemic levels in the low 40% range. Management indicated that there is still opportunities for moderating commodity prices.
Equity Research is available at no cost to Registered users of Channelchek. Not a Member? Click ‘Join’ to join the Channelchek Community. There is no cost to register, and we never collect credit card information.
This Company Sponsored Research is provided by Noble Capital Markets, Inc., a FINRA and S.E.C. registered broker-dealer (B/D).
*Analyst certification and important disclosures included in the full report. NOTE: investment decisions should not be based upon the content of this research summary. Proper due diligence is required before making any investment decision.
The latest jobs report for January 2024 has exceeded expectations, showcasing the robustness of the U.S. economy despite recent high-profile layoffs. The key indicators demonstrate strong job creation, surpassing both estimates and revised figures from the previous month.
Key Figures
In January 2024, the U.S. economy generated an impressive 353,000 nonfarm payroll jobs, well above the Dow Jones estimates of 185,000. This figure also outpaced the revised December 2023 data, which reported 333,000 jobs created. The unemployment rate for January 2024 remained steady at 3.7%, surpassing the estimated 3.8%, indicating a stable job market. Average hourly earnings exhibited substantial growth, surging by 0.6%, doubling the estimates. Year-over-year, wages have increased by 4.5%, exceeding the forecasted 4.1%. Significant contributors to January’s job growth include Professional and Business Services (74,000 jobs), Health Care (70,000), Retail Trade (45,000), Government (36,000), Social Assistance (30,000), and Manufacturing (23,000). Despite the overall positive report, there were slight declines. The labor force participation rate dipped to 62.5%, down 0.1% from December 2023, and average weekly hours worked decreased slightly to 34.1.
Resilience Amidst Recent High-Profile Layoffs
This comes in the midst of many high-profile layoffs. UPS announced 12,000 job cuts amidst lower package volume. iRobot announced 350 layoffs following a failed acquisition by Amazon. Levi Strauss announced they will layoff between 10 and 15% of their workers. Microsoft, following their major Activision Blizzard acquisition, announced 1900 layoffs in their gaming division. Citi Group announced that they will lay off 20,000 employees over the next two years. But, as of this most recent report, it appears these layoffs have not significantly impacted the overall employment landscape.
The Federal Reserve’s Perspective
The strong job numbers prompt speculation about potential Federal Reserve actions. Fed Chair Jerome Powell emphasized the current strength of the labor market, stating that the Fed is looking for a balance and robust growth. Powell noted that the Fed doesn’t require a significant softening in the labor market to consider rate cuts but is keen on seeing continued strong growth and decreasing inflation.
The Federal Reserve, in its recent meeting, maintained benchmark short-term borrowing costs and hinted at potential rate cuts in the future. However, such cuts are contingent on further signs of cooling inflation. The central bank remains focused on addressing the impact of high inflation on consumers rather than adhering to a specific growth mandate.
January’s jobs report underscores the resilience of the U.S. economy, outperforming expectations in key indicators. While high-profile layoffs have made headlines, the overall labor market remains robust. The Federal Reserve’s cautious optimism and potential future rate adjustments indicate a nuanced approach to maintaining economic balance.
The biotech sector is witnessing a dynamic start to the year 2024, with companies such as Alto Neuroscience (ANRO) and Fractyl Health (GUTS) surpassing expectations in their initial public offerings (IPOs).
Alto Neuroscience’s Upsized IPO
Alto Neuroscience today announced the pricing of its upsized IPO, offering 8,040,000 shares of common stock at $16.00 per share. The aggregate gross proceeds are estimated to be approximately $128.6 million. This figure exceeds Alto’s earlier projection of $89 million to $103 million, showcasing strong investor confidence. The shares, traded under the ticker symbol ANRO, are set to commence trading on the NYSE, with the offering expected to close on February 6.
The substantial funds raised will propel Alto’s research and development efforts, primarily supporting the advancement of its lead asset, ALTO-100. This oral small molecule inhibitor of BDNF is currently undergoing a Phase II study for major depressive disorder. Additionally, the IPO proceeds will contribute to the progress of Alto’s other depression asset, ALTO-300, and the Phase I PDE4 asset, ALTO-101, targeted at neurodegenerative and neuropsychiatric conditions.
Fractyl Health’s Successful Debut
In a parallel success story, Fractyl Health has announced the pricing of its IPO, offering 7,333,333 shares of common stock at $15.00 per share. The total gross proceeds amount to approximately $110.0 million, surpassing the initial expectation of $99 million. Fractyl Health, trading under the ticker symbol GUTS on the Nasdaq Global Market, is scheduled to debut on Friday, with the IPO closing on February 6.
The lead product candidate for Fractyl, named Revita, is an outpatient endoscopic procedural therapy utilizing hydrothermal ablation to remodel the dysfunctional duodenal lining and restore metabolic health. Revita is currently in a pivotal study for insulin-treated type 2 diabetes, with anticipated data release in the fourth quarter of 2024.
Mark your calendars! Don’t miss Noble Capital Markets’ Emerging Growth Virtual Healthcare Equity Conference on April 17-18. This exclusive virtual event connects investors with 50 leading public biotech, healthcare services, and medical device companies. Presenting company slots are available…Read More
Positive Industry Trends
Alto Neuroscience and Fractyl Health’s successful IPOs follow in the footsteps of CG Oncology, which recently announced an upsized IPO of $380 million, and ArriVent Biopharma, following suit with its own $175 million offering. These developments underscore the current investor enthusiasm and optimism surrounding biotech companies, indicating a positive trajectory for the sector in 2024.
The robust performance of Alto Neuroscience and Fractyl Health in the IPO market exemplifies the strong start for the biotech sector in 2024. These successful offerings not only provide these companies with the necessary capital for their innovative projects but also reflect a broader trend of confidence and interest from investors in the biotech industry. As the year progresses, these companies and their groundbreaking initiatives will undoubtedly be closely watched by industry insiders and investors alike.
TROY, Mich., Feb. 01, 2024 (GLOBE NEWSWIRE) — Kelly, a leading global specialty talent solutions provider, will release its fourth-quarter earnings before the market opens on Thursday, February 15, 2024. In conjunction with its fourth-quarter earnings release, Kelly will publish a financial presentation on the Investor Relations page of its public website and will host a conference call at 9 a.m. ET.
The call may be accessed in one of the following ways:
Via the Telephone (877) 692-8955 (toll free) or (234) 720-6979 (caller paid) Enter access code 5728672 After the prompt, please enter “#”
A recording of the conference call will be available after 1:30 p.m. ET on February 15, 2024, at (866) 207-1041 (toll-free) and (402) 970-0847 (caller-paid). The access code is 5856971#. The recording will also be available at kellyservices.com during this period.
About Kelly
Kelly Services, Inc. (Nasdaq: KELYA, KELYB) helps companies recruit and manage skilled workers and helps job seekers find great work. Since inventing the staffing industry in 1946, we have become experts in the many industries and local and global markets we serve. With a network of suppliers and partners around the world, we connect more than 450,000 people with work every year. Our suite of outsourcing and consulting services ensures companies have the people they need, when and where they are needed most. Headquartered in Troy, Michigan, we empower businesses and individuals to access limitless opportunities in industries such as science, engineering, technology, education, manufacturing, retail, finance, and energy. Revenue in 2022 was $5.0 billion. Learn more at kellyservices.com.
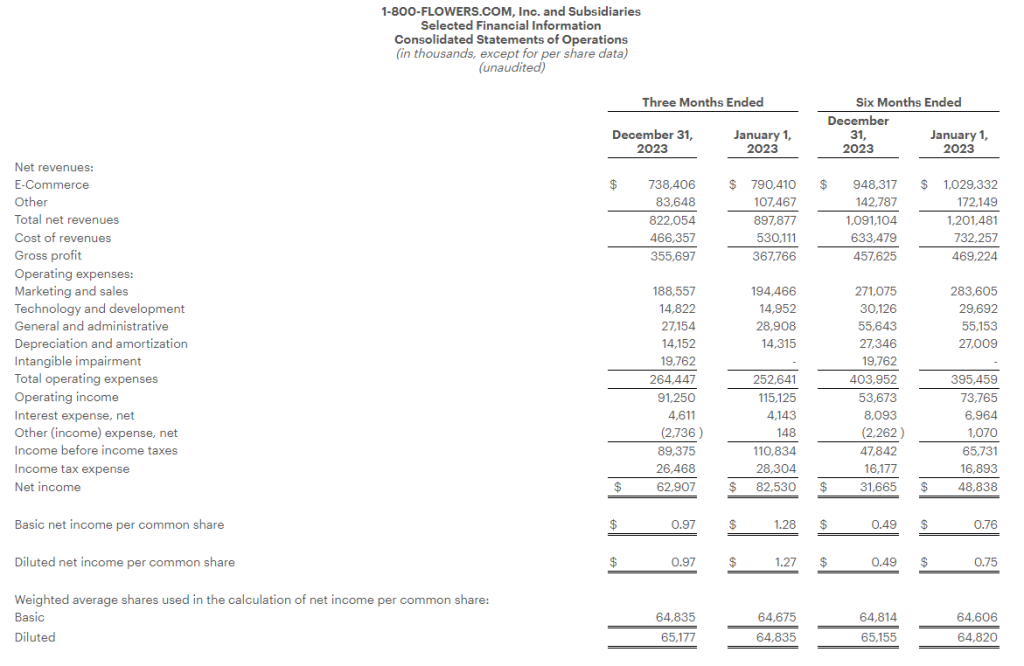
Reports Revenues of $822.1 million and Net Income of $62.9 million, or $0.97 per share, which Includes a Non-Cash Impairment Charge of $19.8 million
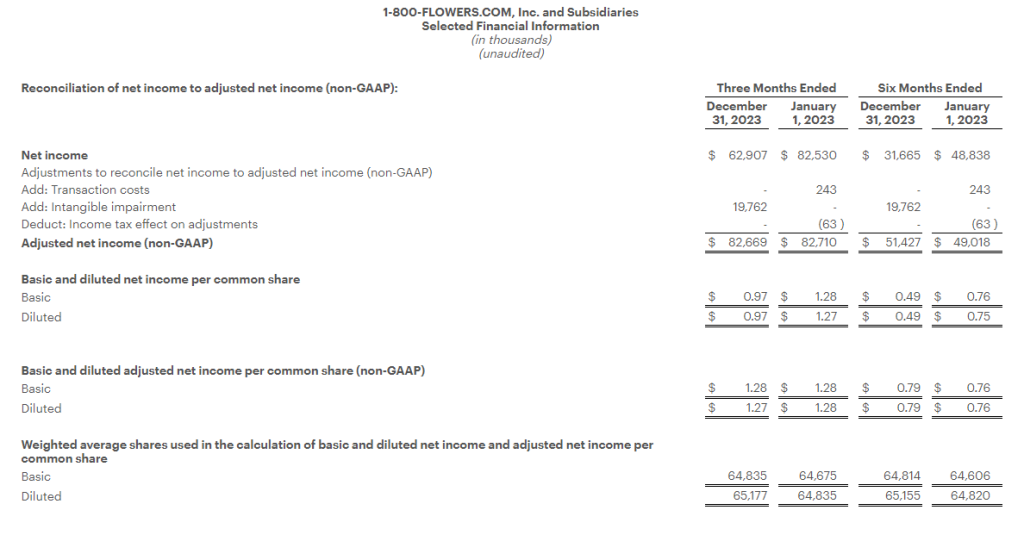
Adjusted Net Income (1) was $82.7 million, or $1.27 per share
Gross Profit Margin Improves 230 basis points to 43.3%, Marking the Fifth Consecutive Quarter of Year-Over-Year Gross Profit Margin Expansion
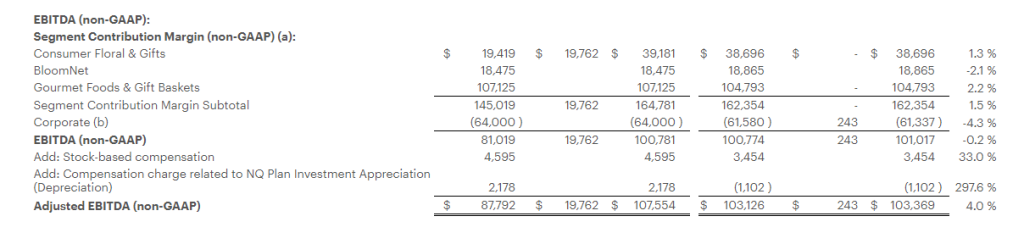
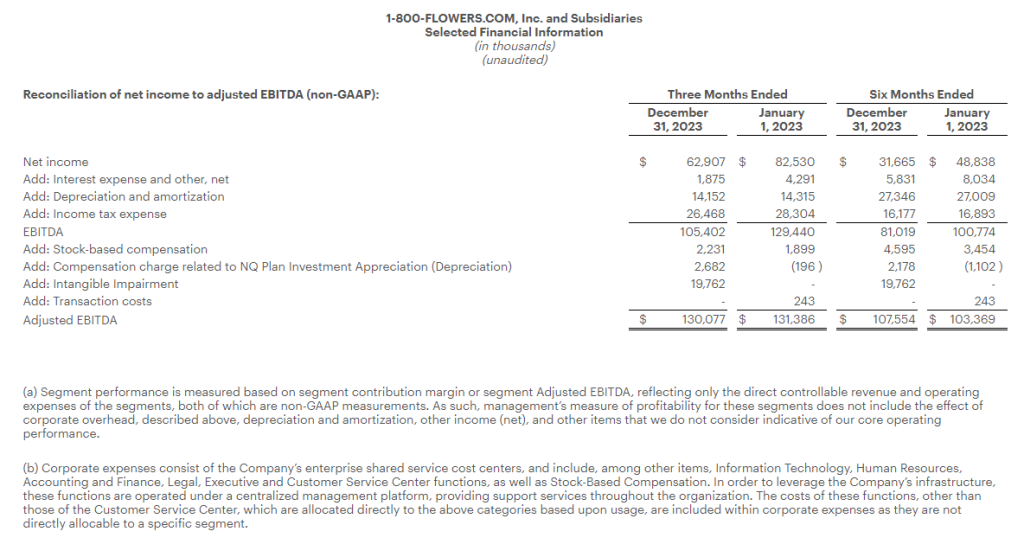
Generates Adjusted EBITDA (1) of $130.1 million
Updates Fiscal 2024 Revenue Guidance
(1) Refer to “Definitions of Non-GAAP Financial Measures” and the tables attached at the end of this press release for reconciliation of non-GAAP results to applicable GAAP results.)
JERICHO, N.Y.–(BUSINESS WIRE)– 1-800-FLOWERS.COM, Inc. (NASDAQ: FLWS), a leading provider of gifts designed to help inspire customers to give more, connect more, and build more and better relationships, today reported results for its fiscal 2024 second quarter ended December 31, 2023.
Fiscal 2024 Second Quarter Highlights
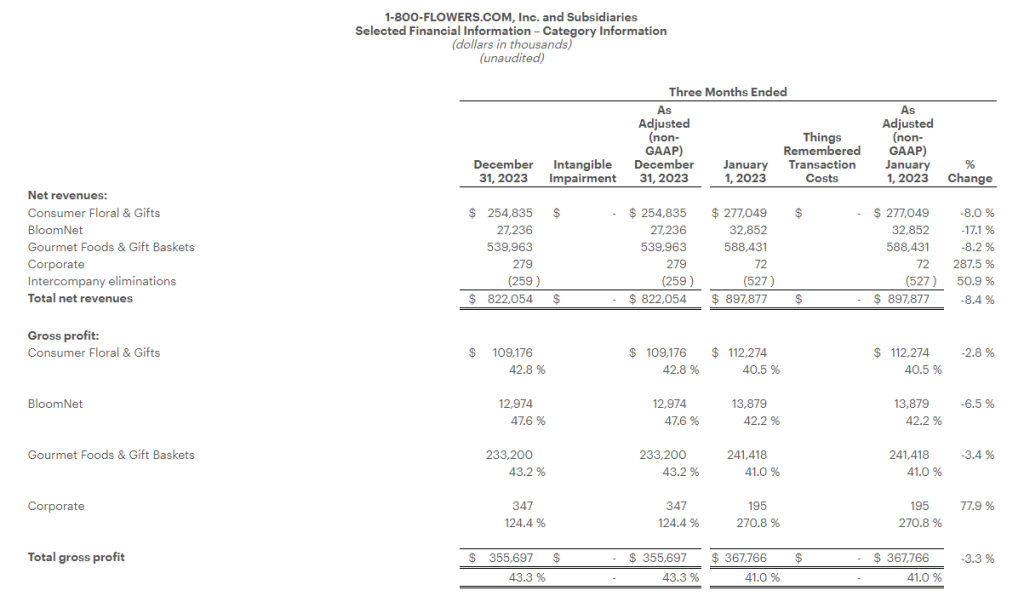
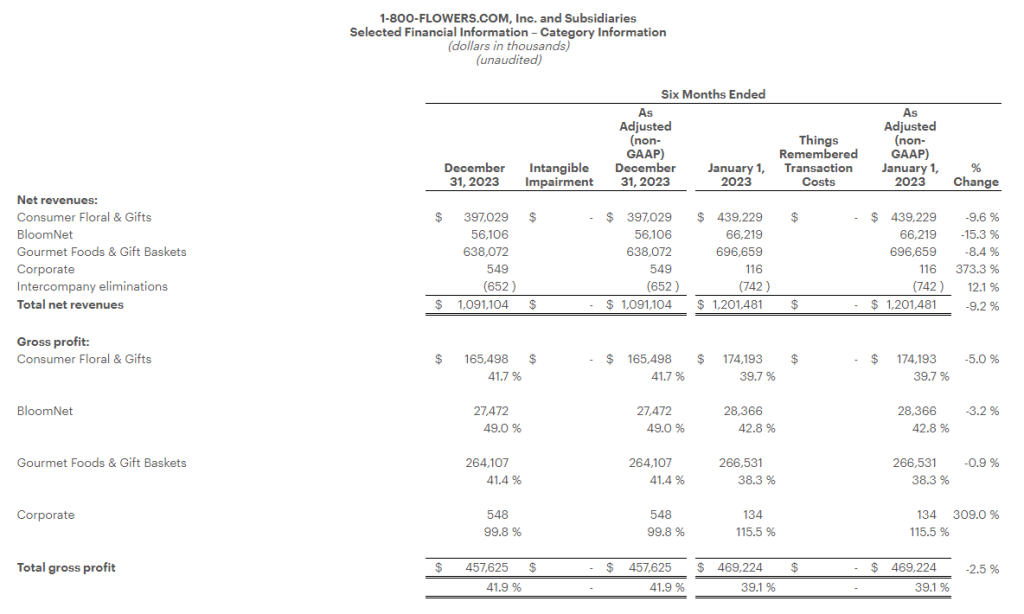
Total consolidated revenues decreased 8.4% to $822.1 million, compared with total consolidated revenues of $897.9 million in the prior year period. E-commerce revenue declined 6.6% to $738.4 million.
Gross profit margin increased 230 basis points to 43.3%, compared with 41.0% in the prior year period. The gross profit margin expansion was led by improvements across the Company’s three business segments, which benefited from lower freight costs, lower labor costs, a decline in certain commodity costs, as well as the Company’s inventory optimization efforts.
Operating expenses increased $11.8 million from the prior year period, including a $19.8 million non-cash impairment charge in the Consumer Floral and Gifts segment related to the Personalization Mall trademark. Excluding the impact of this charge and the appreciation or depreciation of investments in the Company’s non-qualified compensation plan, operating expenses declined $10.8 million as compared with the prior year period to $242.0 million.
Net income for the quarter was $62.9 million, or $0.97 per diluted share, which includes a non-cash impairment charge of $19.8 million or $0.30 per diluted share. Adjusted Net Income1 was $82.7 million, or $1.27 per diluted share. In the prior year period, Net income was $82.5 million, or $1.27 per diluted share.
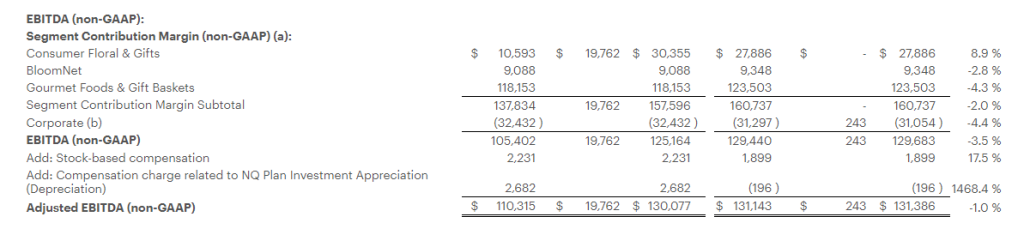
Adjusted EBITDA1 for the quarter was $130.1 million, as compared with Adjusted EBITDA1 of $131.4 million in the prior year period.
“Our second quarter earnings came in line with our expectations, as our gross profit margin recovery and expense optimization efforts helped offset a softer than anticipated consumer environment,” said Jim McCann, Chairman and Chief Executive Officer of 1-800-FLOWERS.COM, Inc. “This was our fifth consecutive quarter of gross margin expansion, and we are well on our path to returning to our historical mean annual gross margin rate in the low 40s percent range. Our gross profit margin is benefiting from a reversion to the mean of certain commodity costs combined with our Work Smarter initiatives that are centered on operating more efficiently and provide a benefit to both our gross profit margin and operating expenses.”
“We are maintaining our full year Adjusted EBITDA estimate, as our Work Smarter initiatives that are contributing to our gross profit margin and operating margin are expected to continue to mitigate a softer topline environment,” continued Mr. McCann. “Our quarter-over-quarter sales trends continue to move in the right direction and our Relationship Innovation and Work Smarter initiatives are having a clear and direct impact on our business, which we expect to only be further buoyed as the broader consumer discretionary environment improves.”
Segment Results
The Company provides Fiscal 2024 second quarter selected financial results for its Gourmet Foods and Gift Baskets, Consumer Floral and Gifts, and BloomNet segments in the tables attached to this release and as follows:
Gourmet Foods and Gift Baskets: Revenues for the quarter were $540.0 million, declining 8.2% compared with $588.4 million in the prior year period. Gross profit margin expanded 220 basis points to 43.2%, compared with 41.0% percent in the prior year period, benefiting from lower freight costs, lower labor costs, a decline in certain commodity costs, as well as the Company’s inventory optimization efforts. Segment contribution margin1 declined by $5.4 million to $118.2 million, compared with segment contribution margin1 of $123.5 million in the prior year period, primarily due to the revenue decline.
Consumer Floral & Gifts: Revenues for the quarter were $254.8 million, declining 8.0% compared with $277.0 million in the prior year period. Gross profit margin expanded 230 basis points to 42.8%, compared with 40.5% percent in the prior year period, improving on lower freight and labor costs. Segment contribution margin1 excluding the impairment charge was $30.4 million, compared with segment contribution margin1 of $27.9 million in the prior year period.
BloomNet: Revenues for the quarter were $27.2 million, declining 17.1% compared with $32.9 million in the prior year period. Revenue was impacted by the lower order volume processed by BloomNet. Gross profit margin was 47.6%, compared with 42.2% in the prior year period, primarily reflecting product mix and lower freight costs. Segment contribution margin1 was $9.1 million, compared with $9.3 million in the prior year period.
Company Guidance
The Company is updating its Fiscal 2024 guidance to reduce its revenue outlook for the full year, while maintaining its Adjusted EBITDA and Free Cash Flow expectations, as the improvement in gross profit margin and the company’s expense optimization efforts are expected to mitigate the softer than anticipated revenue improvement.
As a result, the Company now expects Fiscal 2024:
total revenues on a percentage basis to decline in a range of 7% to 9%, as compared with the prior year;
Adjusted EBITDA1 to be in a range of $95 million to $100 million; and
Free Cash Flow1 to be in a range of $60 million to $65 million.
Conference Call
The Company will conduct a conference call to discuss the above details and attached financial results today, February 1, 2024, at 8:00 a.m. (ET). The conference call will be webcast from the Investors section of the Company’s website at www.1800flowersinc.com. A recording of the call will be posted on the Investors section of the Company’s website within two hours of the call’s completion. A telephonic replay of the call can be accessed beginning at 2:00 p.m. (ET) today through February 8, 2024, at: (US) 1-877-344-7529; (Canada) 855-669-9658; (International) 1-412-317-0088; enter conference ID #: 4402294.
Definitions of non-GAAP Financial Measures:
We sometimes use financial measures derived from consolidated financial information, but not presented in our financial statements prepared in accordance with U.S. generally accepted accounting principles (“GAAP”). Certain of these are considered “non-GAAP financial measures” under the U.S. Securities and Exchange Commission rules. Non-GAAP financial measures referred to in this document are either labeled as “non-GAAP” or designated as such with a “1”. See below for definitions and the reasons why we use these non-GAAP financial measures. Where applicable, see the Selected Financial Information below for reconciliations of these non-GAAP measures to their most directly comparable GAAP financial measures. Reconciliations for forward-looking figures would require unreasonable efforts at this time because of the uncertainty and variability of the nature and amount of certain components of various necessary GAAP components, including, for example, those related to compensation, tax items, amortization or others that may arise during the year, and the Company’s management believes such reconciliations would imply a degree of precision that would be confusing or misleading to investors. For the same reasons, the Company is unable to address the probable significance of the unavailable information. The lack of such reconciling information should be considered when assessing the impact of such disclosures.
EBITDA and Adjusted EBITDA:
We define EBITDA as net income (loss) before interest, taxes, depreciation, and amortization. Adjusted EBITDA is defined as EBITDA adjusted for the impact of stock-based compensation, Non-Qualified Plan Investment appreciation/depreciation, and for certain items affecting period-to-period comparability. See Selected Financial Information for details on how EBITDA and Adjusted EBITDA were calculated for each period presented. The Company presents EBITDA and Adjusted EBITDA because it considers such information meaningful supplemental measures of its performance and believes such information is frequently used by the investment community in the evaluation of similarly situated companies. The Company uses EBITDA and Adjusted EBITDA as factors to determine the total amount of incentive compensation available to be awarded to executive officers and other employees. The Company’s credit agreement uses EBITDA and Adjusted EBITDA to determine its interest rate and to measure compliance with certain covenants. EBITDA and Adjusted EBITDA are also used by the Company to evaluate and price potential acquisition candidates. EBITDA and Adjusted EBITDA have limitations as analytical tools and should not be considered in isolation or as a substitute for analysis of the Company’s results as reported under GAAP. Some of the limitations are: (a) EBITDA and Adjusted EBITDA do not reflect changes in, or cash requirements for, the Company’s working capital needs; (b) EBITDA and Adjusted EBITDA do not reflect the significant interest expense, or the cash requirements necessary to service interest or principal payments, on the Company’s debts; and (c) although depreciation and amortization are non-cash charges, the assets being depreciated and amortized may have to be replaced in the future and EBITDA does not reflect any cash requirements for such capital expenditures. EBITDA and Adjusted EBITDA should only be used on a supplemental basis combined with GAAP results when evaluating the Company’s performance.
Segment Contribution Margin and Adjusted Segment Contribution Margin
We define Segment Contribution Margin as earnings before interest, taxes, depreciation, and amortization, before the allocation of corporate overhead expenses. Adjusted Segment Contribution Margin is defined as Segment Contribution Margin adjusted for certain items affecting period-to-period comparability. See Selected Financial Information for details on how Segment Contribution Margin and Adjusted Segment Contribution Margin were calculated for each period presented. When viewed together with our GAAP results, we believe Segment Contribution Margin and Adjusted Segment Contribution Margin provide management and users of the financial statements meaningful information about the performance of our business segments. Segment Contribution Margin and Adjusted Segment Contribution Margin are used in addition to and in conjunction with results presented in accordance with GAAP and should not be relied upon to the exclusion of GAAP financial measures. The material limitation associated with the use of Segment Contribution Margin and Adjusted Segment Contribution Margin is that they are an incomplete measure of profitability as they do not include all operating expenses or non-operating income and expenses. Management compensates for this limitation when using these measures by looking at other GAAP measures, such as Operating Income and Net Income.
Adjusted Net Income (Loss) and Adjusted or Comparable Net Income (Loss) Per Common Share:
We define Adjusted Net Income (Loss) and Adjusted or Comparable Net Income (Loss) Per Common Share as Net Income (Loss) and Net Income (Loss) Per Common Share adjusted for certain items affecting period-to-period comparability. See Selected Financial Information below for details on how Adjusted Net Income (Loss) Per Common Share and Adjusted or Comparable Net Income (Loss) Per Common Share were calculated for each period presented. We believe that Adjusted Net Income (Loss) and Adjusted or Comparable Net Income (Loss) Per Common Share are meaningful measures because they increase the comparability of period-to-period results. Since these are not measures of performance calculated in accordance with GAAP, they should not be considered in isolation of, or as a substitute for, GAAP Net Income (Loss) and Net Income (Loss) Per Common share, as indicators of operating performance and they may not be comparable to similarly titled measures employed by other companies.
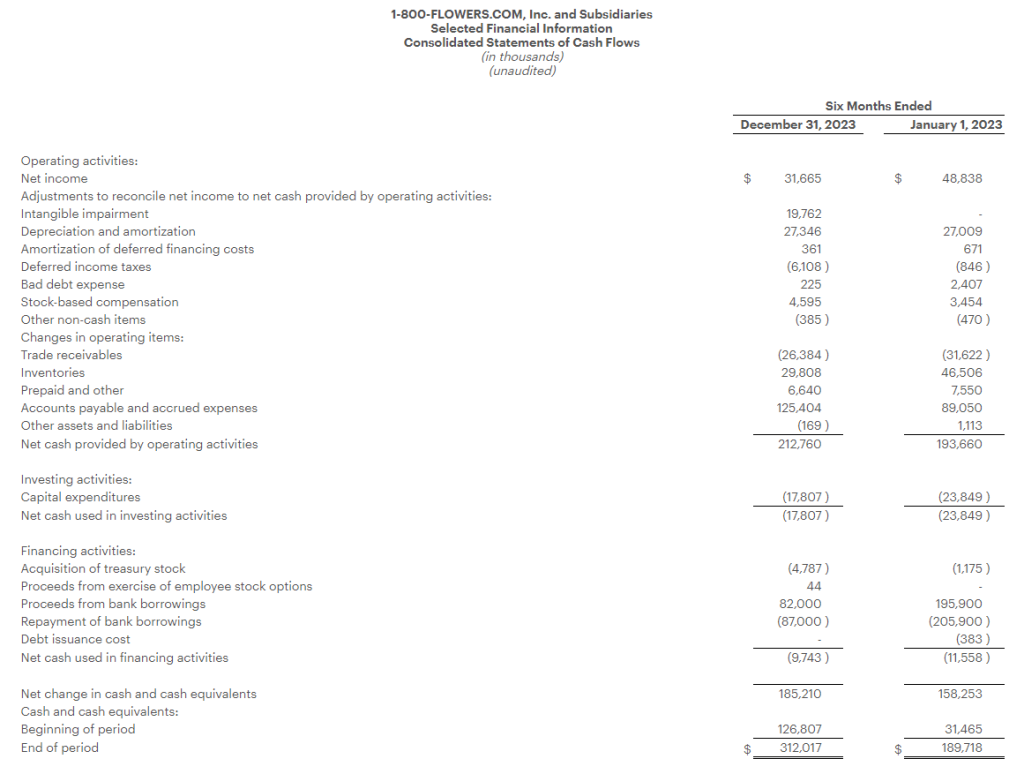
Free Cash Flow:
We define Free Cash Flow as net cash provided by operating activities less capital expenditures. The Company considers Free Cash Flow to be a liquidity measure that provides useful information to management and investors about the amount of cash generated by the business after the purchases of fixed assets, which can then be used to, among other things, invest in the Company’s business, make strategic acquisitions, strengthen the balance sheet, and repurchase stock or retire debt. Free Cash Flow is a liquidity measure that is frequently used by the investment community in the evaluation of similarly situated companies. Since Free Cash Flow is not a measure of performance calculated in accordance with GAAP, it should not be considered in isolation or as a substitute for analysis of the Company’s results as reported under GAAP. A limitation of the utility of Free Cash Flow as a measure of financial performance is that it does not represent the total increase or decrease in the Company’s cash balance for the period.
About 1-800-FLOWERS.COM, Inc.
1-800-FLOWERS.COM, Inc. is a leading provider of gifts designed to help inspire customers to give more, connect more, and build more and better relationships. The Company’s e-commerce business platform features an all-star family of brands, including: 1-800-Flowers.com®, 1-800-Baskets.com®, Cheryl’s Cookies®, Harry & David®, PersonalizationMall.com®, Shari’s Berries®, FruitBouquets.com®, Things Remembered®, Moose Munch®, The Popcorn Factory®, Wolferman’s Bakery®, Vital Choice®, and Simply Chocolate®. Through the Celebrations Passport® loyalty program, which provides members with free standard shipping and no service charge across our portfolio of brands, 1-800-FLOWERS.COM, Inc. strives to deepen relationships with customers. The Company also operates BloomNet®, an international floral and gift industry service provider offering a broad-range of products and services designed to help members grow their businesses profitably; Napco℠, a resource for floral gifts and seasonal décor; DesignPac Gifts, LLC, a manufacturer of gift baskets and towers; and Alice’s Table®, a lifestyle business offering fully digital floral, culinary and other experiences to guests across the country. 1-800-FLOWERS.COM, Inc. was recognized among the top 5 on the National Retail Federation’s 2021 Hot 25 Retailers list, which ranks the nation’s fastest-growing retail companies, and was named to the Fortune 1000 list in 2022. Shares in 1-800-FLOWERS.COM, Inc. are traded on the NASDAQ Global Select Market, ticker symbol: FLWS. For more information, visit 1800flowersinc.com or follow @1800FLOWERSInc on Twitter.
FLWS–COMP FLWS-FN
Special Note Regarding Forward Looking Statements:
This press release contains forward-looking statements within the meaning of the Private Securities Litigation Reform Act of 1995. These forward-looking statements represent the Company’s current expectations or beliefs concerning future events and can generally be identified using statements that include words such as “estimate,” “expects,” “project,” “believe,” “anticipate,” “intend,” “plan,” “foresee,” “forecast,” “likely,” “should,” “will,” “target” or similar words or phrases. These forward-looking statements are subject to risks, uncertainties, and other factors, many of which are outside of the Company’s control, which could cause actual results to differ materially from the results expressed or implied in the forward-looking statements, including, but not limited to, statements regarding the Company’s ability to achieve its guidance for the full Fiscal year; the Company’s ability to leverage its operating platform and reduce its operating expense ratio; its ability to successfully integrate acquired businesses and assets; its ability to successfully execute its strategic initiatives; its ability to cost effectively acquire and retain customers; the outcome of contingencies, including legal proceedings in the normal course of business; its ability to compete against existing and new competitors; its ability to manage expenses associated with sales and marketing and necessary general and administrative and technology investments; its ability to reduce promotional activities and achieve more efficient marketing programs; and general consumer sentiment and industry and economic conditions that may affect levels of discretionary customer purchases of the Company’s products. The Company undertakes no obligation to publicly update any of the forward-looking statements, whether because of new information, future events or otherwise, made in this release or in any of its SEC filings. Consequently, you should not consider any such list to be a complete set of all potential risks and uncertainties. For a more detailed description of these and other risk factors, refer to the Company’s SEC filings, including the Company’s Annual Reports on Form 10-K and its Quarterly Reports on Form 10-Q.
Note: The following tables are an integral part of this press release without which the information presented in this press release should be considered incomplete.
(a) Segment performance is measured based on segment contribution margin or segment Adjusted EBITDA, reflecting only the direct controllable revenue and operating expenses of the segments, both of which are non-GAAP measurements. As such, management’s measure of profitability for these segments does not include the effect of corporate overhead, described above, depreciation and amortization, other income (net), and other items that we do not consider indicative of our core operating performance.
(b) Corporate expenses consist of the Company’s enterprise shared service cost centers, and include, among other items, Information Technology, Human Resources, Accounting and Finance, Legal, Executive and Customer Service Center functions, as well as Stock-Based Compensation. In order to leverage the Company’s infrastructure, these functions are operated under a centralized management platform, providing support services throughout the organization. The costs of these functions, other than those of the Customer Service Center, which are allocated directly to the above categories based upon usage, are included within corporate expenses as they are not directly allocable to a specific segment.