For more than 70 years, Vectrus has provided critical mission support for our customers’ toughest operational challenges. As a high-performing organization with exceptional talent, deep domain knowledge, a history of long-term customer relationships, and groundbreaking technical expertise, we deliver innovative, mission-matched solutions for our military and government customers worldwide. Whether it’s base operations support, supply chain and logistics, IT mission support, engineering and digital integration, security, or maintenance, repair and overhaul, our customers count on us for on-target solutions that increase efficiency, reduce costs, improve readiness, and strengthen national security. Vectrus is headquartered in Colorado Springs, Colo., and includes about 8,100 employees spanning 205 locations in 28 countries. In 2021, Vectrus generated sales of $1.8 billion. For more information, visit the company’s website at www.vectrus.com or connect with Vectrus on Facebook, Twitter, and LinkedIn.
Joe Gomes, Managing Director, Equity Research Analyst, Generalist , Noble Capital Markets, Inc.
Joshua Zoepfel, Research Associate, Noble Capital Markets, Inc.
Refer to the full report for the price target, fundamental analysis, and rating.
A Solid 2023. The transformation of V2X continued in 2023. The Company has emerged as a leader in the operational segment of the broader federal services marketplace. V2X is advancing how missions are operated by leveraging converged and engineered solutions, at the intersection of technology and operations. This includes modernization and sustainment support that elongates platform life cycles while enhancing capabilities.
4Q23 Results. Record revenue of $1.04 billion was up 6.4% y-o-y, and above our $1.01 billion forecast. Adjusted EBITDA came in at $82.1 million versus $82.3 million in 4Q22 and our $75 million estimate. Adjusted diluted EPS was $1.22 compared to $0.97 last year and our $0.97 estimate.
Equity Research is available at no cost to Registered users of Channelchek. Not a Member? Click ‘Join’ to join the Channelchek Community. There is no cost to register, and we never collect credit card information.
This Company Sponsored Research is provided by Noble Capital Markets, Inc., a FINRA and S.E.C. registered broker-dealer (B/D).
*Analyst certification and important disclosures included in the full report. NOTE: investment decisions should not be based upon the content of this research summary. Proper due diligence is required before making any investment decision.
Entravision Communications Corporation is a diversified Spanish-language media company utilizing a combination of television and radio operations to reach Hispanic consumers across the United States, as well as the border markets of Mexico. Entravision owns and/or operates 53 primary television stations and is the largest affiliate group of both the top-ranked Univision television network and Univision’s TeleFutura network, with television stations in 20 of the nation’s top 50 Hispanic markets. The Company also operates one of the nation’s largest groups of primarily Spanish-language radio stations, consisting of 48 owned and operated radio stations.
Michael Kupinski, Director of Research, Equity Research Analyst, Digital, Media & Technology , Noble Capital Markets, Inc.
Jacob Mutchler, Research Associate, Noble Capital Markets, Inc.
Refer to the full report for the price target, fundamental analysis, and rating.
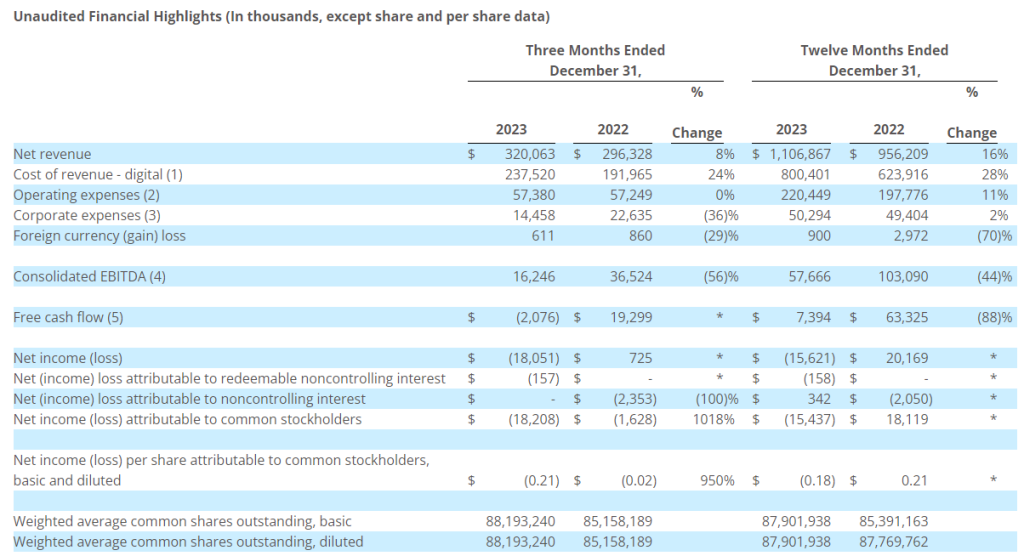
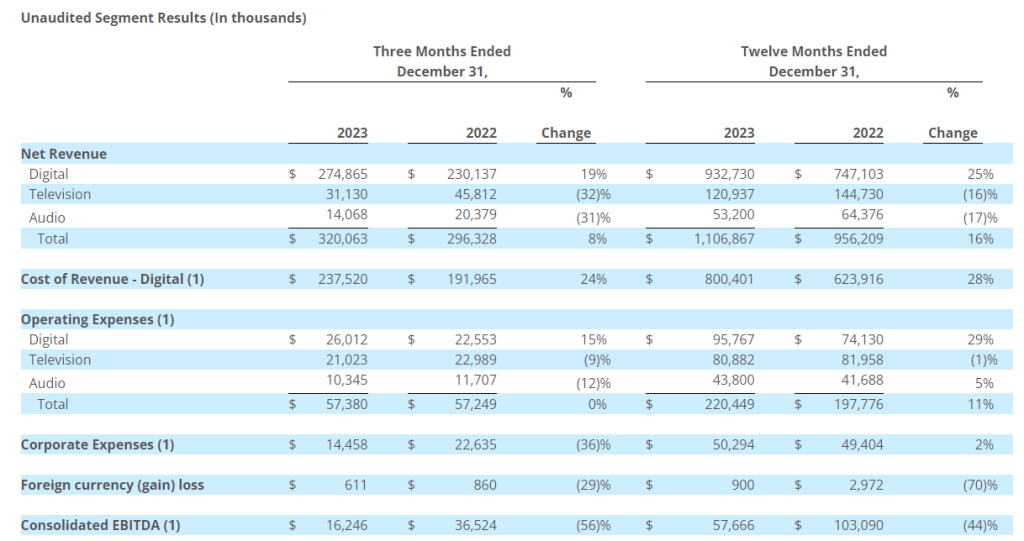
Mixed Q4 results. Total company Q4 revenue of $320.1 million, an increase of 8.0%, was better than our $309.7 million estimate, driven by 19% growth in its Digital businesses. Both TV and Radio declined in the quarter due to the absence of year earlier Political advertising. Q4 adj. EBITDA of $16.2 million was slightly below our $19.0 million estimate.
Meta takes its business in-house. The recent financial results were overshadowed by a late announcement that Meta plans to take its advertising sales in-house, ending its relationship with Entravision and all its sales partners. Meta accounted for roughly 52% of total company revenues and 40% of adj. EBITDA in 2023.
Equity Research is available at no cost to Registered users of Channelchek. Not a Member? Click ‘Join’ to join the Channelchek Community. There is no cost to register, and we never collect credit card information.
This Company Sponsored Research is provided by Noble Capital Markets, Inc., a FINRA and S.E.C. registered broker-dealer (B/D).
*Analyst certification and important disclosures included in the full report. NOTE: investment decisions should not be based upon the content of this research summary. Proper due diligence is required before making any investment decision.
CoreCivic is a diversified, government-solutions company with the scale and experience needed to solve tough government challenges in flexible, cost-effective ways. We provide a broad range of solutions to government partners that serve the public good through high-quality corrections and detention management, a network of residential and non-residential alternatives to incarceration to help address America’s recidivism crisis, and government real estate solutions. We are the nation’s largest owner of partnership correctional, detention and residential reentry facilities, and believe we are the largest private owner of real estate used by government agencies in the United States. We have been a flexible and dependable partner for government for nearly 40 years. Our employees are driven by a deep sense of service, high standards of professionalism and a responsibility to help government better the public good. Learn more at www.corecivic.com.
Joe Gomes, Managing Director, Equity Research Analyst, Generalist , Noble Capital Markets, Inc.
Joshua Zoepfel, Research Associate, Noble Capital Markets, Inc.
Refer to the full report for the price target, fundamental analysis, and rating.
Debt Offering. Last night after market close, CoreCivic announced an offering of $500 million aggregate principal amount of 8.25% senior notes due 2029. The aggregate principal amount of the Notes to be issued in the offering was increased to $500 million from the previously announced $450 million. The aggregate net proceeds from the sale of the Notes are expected to be approximately $490.3 million.
Uses. CoreCivic intends to use the net proceeds, together with borrowings under the Company’s revolving credit facility and cash on hand, to fund the concurrent cash tender offer for any and all of the $593.1 million outstanding aggregate principal amount of 2026 Notes. Any remaining funds will be used to redeem 2026 Notes that remain outstanding thereafter. With excess cash on hand, the Company could pay most of the remaining principal with cash, modestly tapping into the revolver.
Equity Research is available at no cost to Registered users of Channelchek. Not a Member? Click ‘Join’ to join the Channelchek Community. There is no cost to register, and we never collect credit card information.
This Company Sponsored Research is provided by Noble Capital Markets, Inc., a FINRA and S.E.C. registered broker-dealer (B/D).
*Analyst certification and important disclosures included in the full report. NOTE: investment decisions should not be based upon the content of this research summary. Proper due diligence is required before making any investment decision.
Joe Gomes, Managing Director, Equity Research Analyst, Generalist , Noble Capital Markets, Inc.
Joshua Zoepfel, Research Associate, Noble Capital Markets, Inc.
Refer to the full report for the price target, fundamental analysis, and rating.
BTC Mining. Bit Digital produced 128.7 BTC during the month of January, a 11.7% decrease from 145.7 BTC in the prior month. An increase in network difficulty, modest decrease in transaction fees, and fewer days in the month were causes of the decrease. The Company’s active hash rate was approximately 2.73 EH/s compared to 2.50 EH/s. The Company is on its way towards the active mining fleet goal of around 6.0 EH/s during 2024, in our view.
ETH Staking and AI. The Company had approximately 12,784 ETH actively staked, flat last month, with approximately 12,384 ETH natively staked and 400 ETH deployed in liquid staking. Bit Digital earned a blended APY of approximately 4.4% compared to 3.69% last month, and earned aggregate staking rewards of approximately 43.4 ETH. Bit Digital’s AI contract earned an estimated $4.0 million of unaudited revenue during the month.
Equity Research is available at no cost to Registered users of Channelchek. Not a Member? Click ‘Join’ to join the Channelchek Community. There is no cost to register, and we never collect credit card information.
This Company Sponsored Research is provided by Noble Capital Markets, Inc., a FINRA and S.E.C. registered broker-dealer (B/D).
*Analyst certification and important disclosures included in the full report. NOTE: investment decisions should not be based upon the content of this research summary. Proper due diligence is required before making any investment decision.
The U.S. job market continues to display remarkable resiliency, even as the blistering pace of hiring has started to moderate from the torrid levels seen over the past couple of years. The latest employment data suggests that while businesses may be tapping the brakes on their aggressive hiring sprees, the overall labor landscape remains favorable for job seekers.
According to the ADP National Employment Report released on March 6th, private sector employment increased by 140,000 jobs in February. While this figure fell short of economists’ projections of 150,000 new jobs, it represents a solid uptick from the upwardly revised 111,000 jobs added in January. The leisure and hospitality sector led the way, tacking on 41,000 positions, followed by construction (28,000) and trade, transportation and utilities (24,000).
The ADP report, which is derived from payroll data, serves as a precursor to the highly anticipated monthly Employment Situation report issued by the Bureau of Labor Statistics (BLS). Economists anticipate that the BLS data, set for release on March 10th, will reveal an even more robust job gain of around 198,000 for February.
This sustained momentum in hiring underscores the enduring strength of the U.S. labor market, even as the Federal Reserve’s aggressive interest rate hikes aimed at taming inflation have stoked concerns about a potential economic downturn. The resilience of the job market has been a crucial bulwark against recessionary forces, buttressing consumer spending and overall economic growth.
However, there are signs that the once-blazing hot job market is starting to cool, albeit in a relatively controlled and gradual manner. The number of job openings, a key indicator of labor demand, has steadily declined from its peak of 12 million in March 2022 but remains elevated at nearly 8.9 million as of January, according to the latest Job Openings and Labor Turnover Survey (JOLTS) report.
This gradual tapering of job openings suggests that employers are becoming more judicious in their hiring practices, potentially a reflection of the broader economic uncertainty and the lagging effects of the Fed’s rate hikes. Nevertheless, the fact that openings remain well above pre-pandemic levels highlights the continued tightness of the labor market.
Moreover, the JOLTS data revealed a modest decline in the number of voluntary quits, often viewed as a barometer of workers’ confidence in their ability to secure better employment opportunities. While still historically high, the dip in quits could signal that some of the exceptional job-hopping dynamics that characterized the pandemic era are beginning to normalize.
From an investor’s perspective, the persistent strength of the job market, coupled with gradually decelerating inflation, presents a Goldilocks scenario – an economy that is neither running too hot nor too cold. This environment could potentially extend the current economic expansion, providing a favorable backdrop for corporate profitability and stock market performance.
However, investors should remain vigilant for any signs of a more pronounced slowdown in hiring or a significant uptick in layoffs, which could presage a broader economic downturn. Moreover, the Fed’s policy path remains a crucial variable, as overly aggressive rate hikes aimed at vanquishing inflation could potentially undermine the job market’s resilience.
Overall, the latest employment data depicts a job market that, while losing some of its blistering momentum, remains remarkably sturdy and continues to defy expectations of an imminent downturn. For investors, this Goldilocks scenario could prolong the economic cycle, but close monitoring of labor market dynamics and the Fed’s policy trajectory will be essential in navigating the road ahead.
In a world of economic uncertainty and geopolitical tensions, gold has once again proven its mettle, reaching unprecedented heights and capturing the attention of investors worldwide. On Tuesday, March 5, 2024, the precious metal achieved a historic milestone, with its price soaring to an all-time high of $2,141.79 per ounce, surpassing the previous record set just three months ago.
This remarkable rally, fueled by a confluence of factors, serves as a reminder of gold’s enduring appeal as a safe-haven asset and a hedge against market volatility. As investors navigate the ever-changing landscape of financial markets, the demand for gold has surged, driven by expectations of a potential pivot by the Federal Reserve toward monetary easing, geopolitical tensions, and the looming risk of a stock market correction.
At the heart of gold’s ascent lies the anticipation of a shift in monetary policy by the Fed. With signs indicating a potential easing of interest rates on the horizon, investors have flocked to the precious metal, which typically benefits from lower borrowing costs. Swaps markets currently reflect a 64% chance of a rate cut in June, a higher probability than early last month, further fueling speculation and driving gold’s allure.
Moreover, the world stage has been characterized by escalating geopolitical tensions, with conflicts and uncertainties on various fronts. The attacks on shipping in the Red Sea, highlighting the volatile situation in the Middle East, have underscored the need for safe-haven assets like gold. As investors seek refuge from these turbulent times, the precious metal’s role as a hedge against turmoil has been reinforced.
The specter of a potential stock market correction has also played a significant role in gold’s ascent. With weak U.S. manufacturing data on Friday serving as a warning sign, investors have sought to mitigate risk by diversifying their portfolios and turning to the time-honored stability of gold.
While the surge in gold prices has been remarkable, it is important to note that this rally has highlighted a growing disconnect between spot prices and outflows from bullion-backed exchange-traded funds (ETFs). Persistent central bank demand for the precious metal and robust physical demand from gold bars and coins have helped offset these outflows, underscoring the broad-based appeal of gold across various investor segments.
As we look ahead, the factors driving gold’s recent success show no signs of abating. The upcoming U.S. presidential election, coupled with China’s economic woes, create a potentially volatile environment ripe for safe-haven investments. Additionally, gold’s role as an inflation hedge cannot be overlooked, as the precious metal has historically served as a bulwark against eroding purchasing power.
For investors seeking to capitalize on this golden opportunity, a well-diversified portfolio that includes exposure to gold can offer a measure of protection against market turbulence and geopolitical uncertainties. Whether through physical holdings, gold-backed ETFs, or mining stocks, there are numerous avenues to gain exposure to this precious commodity.
However, it is crucial to approach gold investments with a long-term perspective and a thorough understanding of the market dynamics. While gold has surpassed its previous nominal highs, its inflation-adjusted peak from 1980 would equate to more than $3,000 in today’s dollars, highlighting the potential for further upside.
In conclusion, gold’s record-breaking performance serves as a testament to its enduring value and resilience in the face of economic and geopolitical uncertainties. As investors navigate the complexities of today’s financial landscape, the precious metal’s allure as a safe-haven asset and a hedge against volatility remains undimmed. By carefully considering gold’s role within a diversified portfolio, investors can position themselves to weather potential storms and capitalize on the opportunities that arise in times of uncertainty.
BRENTWOOD, Tenn., March 05, 2024 (GLOBE NEWSWIRE) — CoreCivic, Inc. (NYSE: CXW) (“CoreCivic”) announced today that it successfully upsized and priced its offering of $500 million aggregate principal amount of 8.25%senior notes due 2029 (the “Notes”). The aggregate principal amount of the Notes to be issued in the offering was increased to $500 million from the previously announced $450 million. The Notes will be senior unsecured obligations of CoreCivic and will be guaranteed on a senior unsecured basis by all of CoreCivic’s subsidiaries that guarantee its existing senior secured credit facilities, 4.75% senior unsecured notes due October 2027 and 8.25% senior unsecured notes due 2026 (the “2026 Notes”).
The aggregate net proceeds from the sale of the Notes are expected to be approximately $490.3 million, after deducting the underwriting discounts and estimated offering expenses. CoreCivic intends to use the net proceeds, together with borrowings under CoreCivic’s revolving credit facility and cash on hand, to fund the concurrent cash tender offer for any and all of the $593.1 million outstanding aggregate principal amount of 2026 Notes (the “Tender Offer”), and, if and to the extent necessary, to redeem any of the 2026 Notes that remain outstanding thereafter, in accordance with the indenture governing the 2026 Notes, including the payment of all premiums, accrued interest and costs and expenses in connection with the Tender Offer and redemption of the 2026 Notes, after the expiration of the Tender Offer. There can be no assurance that the offering of the Notes or the Tender Offer will be consummated.
Citizens JMP Securities, LLC is acting as left lead underwriter, StoneX Financial Inc. and FHN Financial Securities Corp. are acting as joint bookrunners, and Wedbush Securities Inc. and TCBI Securities, Inc. are acting as co-managers for the offering.
The Notes are being offered pursuant to CoreCivic’s shelf registration statement on Form S-3, which became effective upon filing with the Securities and Exchange Commission (the “SEC”) on March 4, 2024. The offering of the Notes is being made solely by means of a prospectus supplement and an accompanying prospectus. The preliminary prospectus supplement and accompanying prospectus relating to, and describing the terms of, the offering of the Notes was filed with the SEC on March 4, 2024, and are available on the SEC’s website at www.sec.gov. The final prospectus supplement and accompanying prospectus will be filed with the SEC and will be available on the SEC’s website at www.sec.gov. When available, copies of the final prospectus supplement and accompanying prospectus relating to, and describing the terms of, the offering of the Notes may be obtained from Citizens JMP Securities, LLC, Attn: Prospectus Department, or by telephone at (617) 725-5783.
This press release is neither an offer to sell nor a solicitation of an offer to buy any securities, including the Notes or the 2026 Notes, nor shall it constitute a notice of redemption under the indenture governing the 2026 Notes, nor shall there be any offer, solicitation or sale of the Notes, the 2026 Notes or any other securities in any state or jurisdiction in which such an offer, solicitation or sale would be unlawful.
About CoreCivic CoreCivic is a diversified, government-solutions company with the scale and experience needed to solve tough government challenges in flexible, cost-effective ways. CoreCivic provides a broad range of solutions to government partners that serve the public good through high-quality corrections and detention management, a network of residential and non-residential alternatives to incarceration to help address America’s recidivism crisis, and government real estate solutions. CoreCivic is the nation’s largest owner of partnership correctional, detention and residential reentry facilities, and one of the largest prison operators in the United States. CoreCivic has been a flexible and dependable partner for government for 40 years. CoreCivic’s employees are driven by a deep sense of service, high standards of professionalism and a responsibility to help government better the public good. Learn more at www.corecivic.com.
Cautionary Note Regarding Forward-Looking Statements This press release includes forward-looking statements concerning CoreCivic’s intention to issue the Notes and CoreCivic’s intended use of the net proceeds from the issuance of the Notes. These forward-looking statements may include words such as “anticipate,” “estimate,” “expect,” “project,” “plan,” “intend,” “believe,” “may,” “will,” “should,” “can have,” “likely,” and other words and terms of similar meaning in connection with any discussion of the timing or nature of future operating or financial performance or other events. Such forward-looking statements may be affected by risks and uncertainties in the Company’s business and market conditions. These forward-looking statements are subject to risks and uncertainties that could cause actual results to differ materially from the statements made. Important factors that could cause actual results to differ are described in the filings made from time to time by CoreCivic with the SEC and include the risk factors described in CoreCivic’s Annual Report on Form 10-K for the fiscal year ended December 31, 2023, filed with the SEC on February 20, 2024, as well as the risks identified in the preliminary prospectus supplement relating to the offering of the Notes under the heading “Risk Factors.” Except as required by applicable law, CoreCivic undertakes no obligation to update forward-looking statements made by it to reflect events or circumstances occurring after the date hereof or the occurrence of unanticipated events.
Contact:
Investors: Mike Grant – Managing Director, Investor Relations – (615) 263-6957 Financial Media: David Gutierrez, Dresner Corporate Services – (312) 780-7204
NEW YORK, March 5, 2024 /PRNewswire/ — Bit Digital, Inc. (Nasdaq: BTBT) (“Bit Digital” or the “Company”), a sustainable platform for digital assets and artificial intelligence (“AI”) infrastructure headquartered in New York, announced its unaudited digital asset production and corporate updates for the month of February 2024.
Corporate Highlights for February 2024
In February 2024, the Company produced 128.7 BTC, an 11.7% decrease compared to the prior month.
The Company’s active hash rate was approximately 2.73 EH/s as of February 29, 2024.
Treasury holdings1 of BTC and ETH were 847.7 and 15,593.1 with a fair market value of approximately $51.9 million and $52.1 million, respectively, on February 29, 2024.
The BTC equivalent2 of our digital asset holdings as of February 29, 2024, was approximately 1,722.3 or approximately 105.4 million.
The Company had cash and cash equivalents of $34.1 million as of February 29, 2024.
Proof-of-Stake Highlights
The Company had approximately 12,784 ETH actively staked in native and liquid staking protocols as of February 29, 2024. Approximately 12,384 were natively staked and 400 ETH were deployed in liquid staking protocols as of that date.
Bit Digital earned a blended APY of approximately 4.4% on its staked ETH position for the month of February 2024.
The Company earned aggregate staking rewards of approximately 43.4 ETH during February 2024.
Bit Digital AI Update
As of February 29, 2024, the Company had 251 servers actively generating revenue from its initial Bit Digital AI contract. The Company earned an estimated $4.0 million of unaudited revenue from this contract during the month of February 2024.
About Bit Digital
Bit Digital, Inc. is a sustainable platform for digital assets and artificial intelligence (“AI”) infrastructure headquartered in New York City. Our bitcoin mining operations are located in the US, Canada, and Iceland. The Company has also established a business line, Bit Digital AI, that offers specialized cloud-infrastructure services for artificial intelligence applications. For additional information, please contact ir@bit-digital.com or visit our website at www.bit-digital.com.
Investor Notice
Investing in our securities involves a high degree of risk. Before making an investment decision, you should carefully consider the risks, uncertainties and forward-looking statements described under “Risk Factors” in Item 3.D of our most recent Annual Report on Form 20-F for the fiscal year ended December 31, 2022. If any material risk was to occur, our business, financial condition or results of operations would likely suffer. In that event, the value of our securities could decline and you could lose part or all of your investment. The risks and uncertainties we describe are not the only ones facing us. Additional risks not presently known to us or that we currently deem immaterial may also impair our business operations. In addition, our past financial performance may not be a reliable indicator of future performance, and historical trends should not be used to anticipate results in the future. Future changes in the network-wide mining difficulty rate or bitcoin hash rate may also materially affect the future performance of Bit Digital’s production of bitcoin. Actual operating results will vary depending on many factors including network difficulty rate, total hash rate of the network, the operations of our facilities, the status of our miners, and other factors.
Safe Harbor Statement
This press release may contain certain “forward-looking statements” relating to the business of Bit Digital, Inc., and its subsidiary companies. All statements, other than statements of historical fact included herein are “forward-looking statements.” These forward-looking statements are often identified by the use of forward-looking terminology such as “believes,” “expects,” or similar expressions, involving known and unknown risks and uncertainties. Although the Company believes that the expectations reflected in these forward-looking statements are reasonable, they do involve assumptions, risks and uncertainties, and these expectations may prove to be incorrect. Investors should not place undue reliance on these forward-looking statements, which speak only as of the date of this press release. The Company’s actual results could differ materially from those anticipated in these forward-looking statements as a result of a variety of factors, including those discussed in the Company’s periodic reports that are filed with the Securities and Exchange Commission and available on its website at http://www.sec.gov. All forward-looking statements attributable to the Company or persons acting on its behalf are expressly qualified in their entirety by these factors. Other than as required under the securities laws, the Company does not assume a duty to update these forward-looking statements.
Footnotes:
1 “Treasury holdings” excludes approximately 2,701 ETH that were transferred to an internally managed fund.
2 “BTC equivalent” is a hypothetical illustration of the value of our digital asset portfolio in bitcoin terms. BTC equivalent is defined as if all non-BTC digital assets, comprised of ETH, LsETH, and USDC, were converted into BTC as of January 31, 2024, and added to our existing BTC balance. Conversion values are found using the closing price on coinmarketcap.com.
CALGARY, AB, March 5, 2024 /CNW/ – Alvopetro Energy Ltd. (TSXV: ALV) (OTCQX: ALVOF) announces February 2024 sales volumes of 1,477 boepd including natural gas sales of 8.3 MMcfpd, associated natural gas liquids sales from condensate of 72 bopd and oil sales of 19 bopd, based on field estimates. February sales volumes were impacted by reduced nominations from our offtaker, Bahiagás mainly in the latter half of February. Effective March 1, 2024 deliveries to Bahiagás have increased back to over 10.6 MMcfpd.
Natural gas, NGLs and crude oil sales:
February2024
January 2024
Natural gas (Mcfpd), by field:
Caburé
7,875
9,305
Murucututu
449
382
Total Company natural gas (Mcfpd)
8,324
9,687
NGLs (bopd)
72
75
Oil (bopd)
19
9
Total Company (boepd)
1,477
1,699
Corporate Presentation
Alvopetro’s updated corporate presentation is available on our website at:
Alvopetro Energy Ltd.’svision is to become a leading independent upstream and midstream operator in Brazil. Our strategy is to unlock the on-shore natural gas potential in the state of Bahia in Brazil, building off the development of our Caburé natural gas field and our strategic midstream infrastructure.
Neither the TSX Venture Exchange nor its Regulation Services Provider (as that term is defined in the policies of the TSX Venture Exchange) accepts responsibility for the adequacy or accuracy of this news release.
All amounts contained in this new release are in United States dollars, unless otherwise stated and all tabular amounts are in thousands of United States dollars, except as otherwise noted.
Abbreviations:
boepd
=
barrels of oil equivalent (“boe”) per day
bopd
=
barrels of oil and/or natural gas liquids (condensate) per day
Mcf
=
thousand cubic feet
Mcfpd
=
thousand cubic feet per day
MMcfpd
=
million cubic feet per day
NGLs
=
natural gas liquids
BOE Disclosure. The term barrels of oil equivalent (“boe”) may be misleading, particularly if used in isolation. A boe conversion ratio of six thousand cubic feet per barrel (6Mcf/bbl) of natural gas to barrels of oil equivalence is based on an energy equivalency conversion method primarily applicable at the burner tip and does not represent a value equivalency at the wellhead. All boe conversions in this news release are derived from converting gas to oil in the ratio mix of six thousand cubic feet of gas to one barrel of oil.
Forward-Looking Statements and Cautionary Language. This news release contains “forward-looking information” within the meaning of applicable securities laws. The use of any of the words “will”, “expect”, “intend” and other similar words or expressions are intended to identify forward-looking information. Forward‐looking statements involve significant risks and uncertainties, should not be read as guarantees of future performance or results, and will not necessarily be accurate indications of whether or not such results will be achieved. A number of factors could cause actual results to vary significantly from the expectations discussed in the forward-looking statements. These forward-looking statements reflect current assumptions and expectations regarding future events. Accordingly, when relying on forward-looking statements to make decisions, Alvopetro cautions readers not to place undue reliance on these statements, as forward-looking statements involve significant risks and uncertainties. More particularly and without limitation, this news release contains forward-looking information concerning the expected natural gas price, natural gas sales and natural gas deliveries under the Company’s long-term gas sales agreement. The forward‐looking statements are based on certain key expectations and assumptions made by Alvopetro, including but not limited to expectations and assumptions concerning expectations regarding Alvopetro’s working interest and the outcome of any redeterminations, the success of future drilling, completion, and testing, equipment availability, the timing of regulatory licenses and approvals, recompletion and development activities, the outlook for commodity markets and ability to access capital markets, the impact of global pandemics and other significant worldwide events, the performance of producing wells and reservoirs, well development and operating performance, foreign exchange rates, general economic and business conditions, weather and access to drilling locations, the availability and cost of labour and services, environmental regulation, including regulation relating to hydraulic fracturing and stimulation, the ability to monetize hydrocarbons discovered, the regulatory and legal environment and other risks associated with oil and gas operations. The reader is cautioned that assumptions used in the preparation of such information, although considered reasonable at the time of preparation, may prove to be incorrect. Actual results achieved during the forecast period will vary from the information provided herein as a result of numerous known and unknown risks and uncertainties and other factors. Although Alvopetro believes that the expectations and assumptions on which such forward-looking information is based are reasonable, undue reliance should not be placed on the forward-looking information because Alvopetro can give no assurance that it will prove to be correct. Readers are cautioned that the foregoing list of factors is not exhaustive. Additional information on factors that could affect the operations or financial results of Alvopetro are included in our annual information form which may be accessed on Alvopetro’s SEDAR+ profile at www.sedarplus.ca. The forward-looking information contained in this news release is made as of the date hereof and Alvopetro undertakes no obligation to update publicly or revise any forward-looking information, whether as a result of new information, future events or otherwise, unless so required by applicable securities laws.
Provides Update on Digital Commercial Partnership with Meta Platforms
Declares Quarterly Cash Dividend of $0.05 Per Share Payable on March 29, 2024
Company to Cancel Today’s Conference Call
SANTA MONICA, Calif.–(BUSINESS WIRE)– Entravision Communications Corporation (NYSE: EVC), a leading global advertising solutions, media and technology company, today announced financial results for the three- and twelve-month periods ended December 31, 2023, and provided an update on its digital commercial partnership with Meta Platforms. Entravision is canceling the conference call scheduled for 5 p.m. Eastern Time today.
Digital Commercial Partnerships Business Update
Through Entravision Global Partners, our digital commercial partnerships business, the Company acts as an intermediary between primarily global media companies and advertisers. These global media companies include Meta, for whom the Company acts as an Authorized Sales Partner (ASP), ByteDance, X Corp., Spotify, Snap and Pinterest, as well as other media companies, in 31 countries throughout the world.
On March 4, 2024, the Company received a communication from Meta that it intends to wind down its ASP program globally and end its relationship with all of its ASPs, including Entravision, by July 1, 2024. For full year 2023, the Company estimates Meta’s ASP program represented approximately $23.8 million of the Company’s $57.7 million total consolidated EBITDA and $586.4 million of the Company’s $1,106.9 million of total consolidated revenue. Entravision has initiated a review of its operating strategy and cost structure and will provide an update on associated plans as soon as practicable.
As of December 31, 2023, Entravision reported $118.9 million of cash and marketable securities. The Company is in compliance with all debt covenants under its current credit facility and, except for quarterly principal scheduled payments, has no maturities under that facility until March 17, 2028.
“While we are disappointed in Meta’s decision, we are confident in Entravision’s long-term opportunities given the strength of our advertising and marketing platforms and the need for our solutions globally. We are conducting an extensive review of our strategy and cost structure to reinforce our operating foundation and ensure we are best positioned to capitalize on Entravision’s global, market leading advertising, media and technology solutions. Our balance sheet is solid with a strong cash position to support the business as we navigate these changes,” said Michael Christenson, Chief Executive Officer.
(1)
Consists primarily of the costs of online media acquired from third-party publishers. Media cost is classified as cost of revenue in the period in which the corresponding revenue is recognized.
(2)
Operating expenses include direct operating and selling, general and administrative expenses. Included in operating expenses are $2.3 million and $2.8 million of non-cash stock-based compensation for the three-month periods ended December 31, 2023 and 2022, respectively, and $9.5 million and $5.7 million of non-cash stock-based compensation for the twelve-month periods ended December 31, 2023 and 2022, respectively.
(3)
Corporate expenses include $4.4 million and $9.2 million of non-cash stock-based compensation for the three-month periods ended December 31, 2023 and 2022, respectively, and $14.2 million and $14.3 million of non-cash stock-based compensation for the twelve-month periods ended December 31, 2023 and 2022, respectively.
(4)
Consolidated EBITDA means net income (loss) plus gain (loss) on sale of assets, depreciation and amortization, non-cash impairment charge, non-cash stock-based compensation included in operating and corporate expenses, net interest expense, other operating gain (loss), gain (loss) on debt extinguishment, income tax (expense) benefit, equity in net income (loss) of nonconsolidated affiliate, non-cash losses, syndication programming amortization less syndication programming payments, revenue from the Federal Communications Commission, or FCC, spectrum incentive auction less related expenses, expenses associated with investments, EBITDA attributable to redeemable noncontrolling interest, acquisitions and dispositions and certain pro-forma cost savings. We use the term consolidated EBITDA because that measure is defined in our 2017 Credit Agreement and 2023 Credit Agreement, and does not include gain (loss) on sale of assets, depreciation and amortization, non-cash impairment charge, non-cash stock-based compensation, net interest expense, other income (loss), gain (loss) on debt extinguishment, income tax (expense) benefit, equity in net income (loss) of nonconsolidated affiliate, non-cash losses, syndication programming amortization less syndication programming payments, revenue from FCC spectrum incentive auction less related expenses, expenses associated with investments, EBITDA attributable to redeemable noncontrolling interest, acquisitions and dispositions and certain pro-forma cost savings.
(5)
Free cash flow is defined as consolidated EBITDA less cash paid for income taxes, net interest expense, capital expenditures (less amounts reimbursed by landlord) and non-recurring cash expenses plus dividend income, and other operating gain (loss). Net interest expense is defined as interest expense, less non-cash interest expense relating to amortization of debt finance costs, and less interest income.
Net revenue for the fourth quarter and full year of 2023 increased primarily due to an increase in advertising revenue from our digital commercial partners business, and from various acquisitions, which did not fully contribute to our financial results in the comparable prior period. The increase was partially offset by a decrease in political advertising revenue in our television and audio segments.
Cost of revenue for the fourth quarter and full year of 2023 increased primarily due to the increase in digital advertising revenue.
Operating expenses for the fourth quarter of 2023 remained constant.
Operating expenses for the year ended December 31, 2023 increased primarily due to expenses associated with the increase in advertising revenue, increases in salary expense and non-cash stock-based compensation, rent expense, and expenses from various acquisitions, which did not fully contribute to our financial results in the comparable prior period.
Corporate expenses for the fourth quarter of 2023 decreased primarily due to non-recurring severance expense incurred in the fourth quarter of 2022 upon the passing of our former Chief Executive Officer, and due to a decrease in bonus expense.
Corporate expenses for the year ended December 31, 2023 increased primarily due to professional service fees, audit fees and rent expense, partially offset by a decrease in severance expense incurred in 2022 upon the passing of our former Chief Executive Officer, and due to a decrease in bonus expense.
Quarterly Cash Dividend
The Company announced today that its Board of Directors approved a quarterly cash dividend to shareholders of $0.05 per share on the Company’s Class A and Class U common stock, in an aggregate amount of $4.4 million. The quarterly dividend will be payable on March 29, 2024 to shareholders of record as of the close of business on March 15, 2024, and the common stock will trade ex-dividend on March 14, 2024. The Company currently anticipates that future cash dividends will be paid on a quarterly basis; however, any decision to pay future cash dividends will be subject to approval by the Board.
Non-GAAP Financial Measures
This press release contains certain non-GAAP financial measures as defined by SEC Regulation G. The GAAP financial measure most directly comparable to each of these non-GAAP financial measures, and a table reconciling each of these non-GAAP financial measures to its most directly comparable GAAP financial measure is included beginning on page 8.
Balance Sheet and Related Metrics
Cash and marketable securities as of December 31, 2023 totaled $118.9 million. Total debt as defined in the Company’s credit agreement was $210.6 million. Net of $50 million of cash and marketable securities, total leverage as defined in the Company’s credit agreement was 2.8 times as of December 31, 2023. Net of total cash and marketable securities, total leverage was 1.6 times.
(1)
Cost of revenue, operating expenses, corporate expenses, and consolidated EBITDA are defined on page 2.
About Entravision Communications Corporation
Entravision is a global advertising solutions, media and technology company. Over the past three decades, we have strategically evolved into a digital powerhouse, expertly connecting brands to consumers in the U.S., Latin America, Europe, Asia and Africa. Our digital segment, the company’s largest by revenue, offers a full suite of end-to-end advertising services. We have commercial partnerships with Meta, X Corp. (formerly known as Twitter), TikTok, and Spotify, and marketers can use our Smadex and other platforms to deliver targeted advertising to audiences around the globe. In the U.S., we maintain a diversified portfolio of television and radio stations that target Hispanic audiences and complement our global digital services. Entravision remains the largest affiliate group of the Univision and UniMás television networks. Shares of Entravision Class A Common Stock trade on the NYSE under ticker: EVC. Learn more about our offerings at entravision.com or connect with us on LinkedIn and Facebook.
Forward-Looking Statements
This press release contains certain forward-looking statements. These forward-looking statements, which are included in accordance with the safe harbor provisions of the Private Securities Litigation Reform Act of 1995, may involve known and unknown risks, uncertainties and other factors that may cause the Company’s actual results and performance in future periods to be materially different from any future results or performance suggested by the forward-looking statements in this press release. Although the Company believes the expectations reflected in such forward-looking statements are based upon reasonable assumptions, it can give no assurance that actual results will not differ materially from these expectations, and the Company disclaims any duty to update any forward-looking statements made by the Company. From time to time, these risks, uncertainties and other factors are discussed in the Company’s filings with the Securities and Exchange Commission.
Bitcoin, the world’s largest cryptocurrency, has once again captured the attention of investors worldwide by setting a new all-time high price of nearly $69,000. This remarkable achievement serves as a reminder that even in the ever-evolving landscape of finance, there are always opportunities to be found – often in unexpected places.
The recent surge in Bitcoin’s value can be attributed to the launch of several spot Bitcoin exchange-traded funds (ETFs) earlier this year. These ETFs have provided everyday investors with unprecedented access to the cryptocurrency market, fueling a surge in demand that has outpaced the available supply. With institutional investors and ETFs scooping up more Bitcoin than is being mined daily, a supply crunch has emerged, further driving up prices.
While the crypto market has been the center of attention, this event also highlights the potential for overlooked investment opportunities in other sectors. Just as Bitcoin was once dismissed by many as a passing fad, there are countless emerging growth companies and innovative technologies that are currently being underestimated by the broader market.
Small-cap stocks, in particular, often fly under the radar of mainstream investors, yet they can offer significant upside potential for those willing to conduct thorough research and identify promising ventures. From groundbreaking medical innovations to disruptive technologies reshaping entire industries, the small-cap universe is brimming with hidden gems waiting to be discovered.
The key to successful investing in these often-overlooked areas lies in taking a long-term perspective and maintaining a diversified portfolio. Just as the crypto market has experienced its fair share of volatility over the years, emerging growth companies can be subject to significant price fluctuations as they navigate the challenges of scaling their operations and gaining market share.
However, for those with the patience and risk tolerance to withstand these ups and downs, the potential rewards can be substantial. Many of today’s industry titans, from Amazon to Tesla, were once small-cap companies with ambitious visions and innovative products that captured the imagination of forward-thinking investors.
As the Bitcoin story continues to unfold, it serves as a powerful reminder that investment opportunities can arise in unexpected places. By keeping an open mind, conducting thorough research, and maintaining a disciplined approach, investors can position themselves to capitalize on the next big thing – whether it’s in the realm of cryptocurrencies, cutting-edge technologies, or any other sector ripe for disruption.
Take a moment to take a look at Bitcoin Depot and Bit Digital who are exploring and pioneering the cryptocurrency sector.
Earnings Release: Friday, March 15, 2024, Before Market Open in New York Conference Call and Webcast: Friday, March 15, 2024, at10:00a.m.EasternTime
GLYFADA, Greece, March 05, 2024 (GLOBE NEWSWIRE) — Seanergy Maritime Holdings Corp. (the “Company” or “Seanergy”) (NASDAQ: SHIP) announced today that it will release its financial results for the fourth quarter and year ended December 31, 2023, prior to the open of the market in New York on Friday, March 15, 2024.
Seanergy’s senior management will conduct a conference call and simultaneous Internet webcast to review these results on Friday, March 15, 2024, at 10:00 a.m. Eastern Time.
Audio Webcast and Earnings Presentation:
There will be a live, and then archived, webcast of the conference call and accompanying slides available through the Company’s website. To access the slides and listen to the archived audio file, visit our website, following the Webcast & Presentations section under our Investor Relations page. Participants to the live webcast should register on the Seanergy website approximately 10 minutes prior to the start of the webcast, following this link.
Conference Call Details: Participants have the option to register for the call using the following link. You can use any number from the list or add your phone number and let the system call you right away.
AboutSeanergyMaritimeHoldingsCorp. Seanergy Maritime Holdings Corp. is a prominent pure-play Capesize ship-owner publicly listed in the U.S. Seanergy provides marine dry bulk transportation services through a modern fleet of Capesize vessels. The Company’s operating fleet consists of 17 vessels (1 Newcastlemax and 16 Capesize), with an average age of approximately 13.0 years and an aggregate cargo carrying capacity of 3,054,820 dwt.
The Company is incorporated in the Marshall Islands and has executive offices in Glyfada, Greece. The Company’s common shares trade on the Nasdaq Capital Market under the symbol “SHIP”.
Forward-LookingStatements This press release contains forward-looking statements (as defined in Section 27A of the Securities Act of 1933, as amended, and Section 21E of the Securities Exchange Act of 1934, as amended) concerning future events. Words such as “may”, “should”, “expects”, “intends”, “plans”, “believes”, “anticipates”, “hopes”, “estimates” and variations of such words and similar expressions are intended to identify forward-looking statements. These statements involve known and unknown risks and are based upon a number of assumptions and estimates, which are inherently subject to significant uncertainties and contingencies, many of which are beyond the control of the Company. Actual results may differ materially from those expressed or implied by such forward-looking statements. Factors that could cause actual results to differ materially include, but are not limited to, the Company’s operating or financial results; the Company’s liquidity, including its ability to service its indebtedness; competitive factors in the market in which the Company operates; shipping industry trends, including charter rates, vessel values and factors affecting vessel supply and demand; future, pending or recent acquisitions and dispositions, business strategy, areas of possible expansion or contraction, and expected capital spending or operating expenses; risks associated with operations outside the United States; broader market impacts arising from war (or threatened war) or international hostilities, such as between Israel and Hamas and between Russia and Ukraine; risks associated with the length and severity of pandemics (including COVID-19), including their effects on demand for dry bulk products and the transportation thereof; and other factors listed from time to time in the Company’s filings with the SEC, including its most recent annual report on Form 20-F. The Company’s filings can be obtained free of charge on the SEC’s website at www.sec.gov. Except to the extent required by law, the Company expressly disclaims any obligations or undertaking to release publicly any updates or revisions to any forward-looking statements contained herein to reflect any change in the Company’s expectations with respect thereto or any change in events, conditions or circumstances on which any statement is based.
For further information please contact: Seanergy Investor Relations Tel: +30 213 0181 522 E-mail: ir@seanergy.gr
Capital Link, Inc. Paul Lampoutis 230 Park Avenue Suite 1536 New York, NY 10169 Tel: (212) 661-7566 Email: seanergy@capitallink.com
Reported record revenue of $1.04 billion, up +6.4% y/y
Achieved y/y revenue growth of 31% in the Pacific and 18% in the Middle East
Operating income of $38.5 million; adjusted operating income1 of $76.2 million
Net income (loss) of ($0.5) million, up $10.1 million y/y
Adjusted EBITDA1 of $82.1 million with a margin1 of 7.9%
Diluted EPS of ($0.02); Adjusted diluted EPS1 of $1.22
Strong year-to-date cash flow from operations of $188.0 million; Achieved net debt reduction of $137.1 million
Awarded first substantial foreign military sales program valued at $400 million over 5 years
2024 Guidance:
Establishing full-year 2024 guidance with revenue and adjusted EBITDA1 growth of 5% at mid-point
MCLEAN, Va., March 5, 2024 /PRNewswire/ — V2X, Inc. (NYSE:VVX) announced fourth quarter and full-year 2023 financial results.
“I’m pleased to report a strong finish to 2023, with record revenue and strong operational performance which drove significant cash generation and net debt reduction,” said Chuck Prow, President and Chief Executive Officer of V2X. “I’d like to thank our teams that demonstrated agility and excellent performance, delivering 8% pro forma revenue1 growth for the full-year and 6% for the quarter. We made significant progress advancing V2X as a leader in the operational segment of the federal services market while continuing to position the company for long-term growth. The leading indicators for our business remain strong with a backlog of approximately $13 billion, $9 billion of bids submitted currently under evaluation, and a robust pipeline of opportunities valued at $15 billion expected to be submitted over the next twelve months. Our capabilities and position in an expanding market, present opportunities to drive continued growth and value for our shareholders and clients.”
“V2X achieved several milestones during the fourth quarter, which includes our first substantial foreign military sales (FMS) win valued at approximately $400 million over the next five years,” said Mr. Prow. “This program is a long-term aviation support and training contract in the Middle East and was a direct result of our multi-year FMS campaign. Importantly, our evolution as a company has been an enabler to participate in this market. With this opportunity, the total value of V2X FMS’ portfolio is approximately $700 million with accretive margins. We plan to build on this success and continue pursuing FMS opportunities that leverage our geographic footprint, strong partnerships, and core capabilities.”
Mr. Prow continued, “Our ability to provide full life cycle solutions from concept to fielding and sustainment is a significant differentiator that’s yielding results. During the quarter, we demonstrated our capabilities through the fielding of a defense platform that modernized existing systems. This program launched as an engineering development and prototyping effort with a new client and today has yielded a brand-new product that’s designed, produced, and sustained by V2X. Additionally, our engineering, integration, modernization and sustainment solutions resulted in approximately $70 million of awards to V2X in the fourth quarter.”
Mr. Prow concluded, “I’d like to thank our teams for their contributions in 2023 and progress executing our strategic framework: Expand the Base, Capture New Markets, Deliver with Excellence, and Enhance Culture. Looking ahead, V2X continues to transform to deliver enhanced capabilities in an expanding market. We have strong momentum, robust backlog, a highly aligned pipeline, limited recompetes, and high free cash generation that provides an excellent fundamental profile to support value creation.”
Fourth Quarter 2023 Results
“V2X reported revenue of $1.0 billion in the quarter, which represents 6.4% year-over-year growth,” said Shawn Mural, Senior Vice President and Chief Financial Officer. “Revenue growth in the quarter was achieved through exceptional team performance delivering milestones ahead of schedule, expansion on existing programs, and new business. This solid execution resulted in year-over-year revenue growth of 31% in the Pacific and 18% in the Middle East.”
“For the quarter, the Company reported operating income of $38.5 million and adjusted operating income1 of $76.2 million. Adjusted EBITDA1 was $82.1 million with a margin of 7.9%. Fourth quarter GAAP diluted EPS was ($0.02), due primarily to merger and integration related costs, amortization of acquired intangible assets, and interest expense. Adjusted diluted EPS1 for the quarter was $1.22.”
“V2X’s ability to generate strong cash flow with low capital expenditures is an important attribute of our business and one that we are extremely focused on as a primary avenue to enhance value for shareholders. I’m pleased to announce that during the quarter, our teams demonstrated outstanding performance in all aspects of cash conversion, driving significant collections, a record low DSO, and operating cash flow that exceeded our guidance. Net cash provided by operating activities was $188.0 million year to date. Adjusted net cash provided by operating activities1 year to date was $159.5 million, adding back $26.9 million of M&A and integration costs with $13.4 million of CARES act payments, and removing the contribution of the master accounts receivable purchase or MARPA facility of $68.8 million.”
“Solid cash generation enabled net debt reduction of $137.1 million for the year. At the end of the quarter, net debt for V2X was $1,083.6 million. Net consolidated indebtedness to EBITDA1 (net leverage ratio) was 3.3x, improved from 3.7x at the end of 2022. Additionally, we believe our strong fundamentals will allow V2X to achieve a net leverage ratio at or under 3.0x by the end of 2024.”
“Total backlog as of December 31, 2023, was $12.8 billion. Funded backlog was $2.8 billion. Bookings in the quarter were $0.6 billion, resulting in a trailing twelve-month book-to-bill of 1.1x. It’s important to note that backlog and bookings do not include the full performance period of the $400 million FMS program as the contract is being definitized and the $458 million F-5 Adversary aircraft award, discussed last quarter, as it remains in protest,” said Mr. Mural.
Full-Year 2023 Results
Full-year revenue was $3.963 billion, up 8% pro forma year-on-year. The Company reported full-year operating income of $124.4 million and adjusted operating income1 of $271.4 million. Full-year EBITDA1 was $293.9 million with a margin of 7.4%. Full-year GAAP diluted EPS was ($0.73), due primarily to merger and integration related costs, amortization of acquired intangible assets, and interest expense. Adjusted diluted EPS1 for 2023 was $3.74.
2024 Guidance
Mr. Mural concluded, “Based on the positive trends in our business we are setting the mid-point of our guidance for revenue and Adjusted EBITDA1 at $4.150 billion and $308 million, respectively, representing approximately 5% year-over-year growth. We expect revenue and adjusted EBITDA to be weighted more heavily in the second half of the year. Importantly, guidance at the mid-point assumes approximately 90% of revenue from existing contracts and less than 5% from recompetes.”
Guidance for 2024 is as follows:
$ millions, except for per share amounts
2024 Guidance
2024 Mid-Point
Revenue
$4,100
$4,200
$4,150
Adjusted EBITDA1
$300
$315
$308
Adjusted Diluted Earnings Per Share1
$3.85
$4.20
$4.03
Adjusted Net Cash Provided by Operating Activities1
$145
$165
$155
The Company is not providing a quantitative reconciliation with respect to this forward-looking non-GAAP measure in reliance on the “unreasonable efforts” exception set forth in SEC rules because certain financial information, the probable significance of which cannot be determined, is not available and cannot be reasonably estimated. For example, unusual, one-time, non-ordinary, or non-recurring costs, which relate to M&A, integration and related activities cannot be reasonably estimated. Forward-looking statements are based upon current expectations and are subject to factors that could cause actual results to differ materially from those suggested here, including those factors set forth in the Safe Harbor Statement below.
Fourth Quarter and Full-Year 2023 Conference Call
Management will conduct a conference call with analysts and investors at 8:00 a.m. ET on Tuesday, March 5, 2024. U.S.-based participants may dial in to the conference call at 877-407-3982, while international participants may dial 201-493-6780. A live webcast of the conference call as well as an accompanying slide presentation will be available here: https://app.webinar.net/WrwGVYwl6dA
A replay of the conference call will be posted on the V2X website shortly after completion of the call and will be available for one year. A telephonic replay will also be available through March 19, 2024, at 844-512-2921 (domestic) or 412-317-6671 (international) with passcode 13743860 .
Presentation slides that will be used in conjunction with the conference call will also be made available online in advance on the “investors” section of the company’s website at https://gov2x.com/. V2X recognizes its website as a key channel of distribution to reach public investors and as a means of disclosing material non-public information to comply with its obligations under the U.S. Securities and Exchange Commission (“SEC”) Regulation FD.
Footnotes:
1 See “Key Performance Indicators and Non-GAAP Financial Measures” for descriptions and reconciliations.
About V2X
V2X builds smart solutions designed to integrate physical and digital infrastructure – by aligning people, actions, and outputs. Formed by the merger of Vectrus and Vertex, we bring a combined 120 years of successful mission support. Our lifecycle solutions improve security, streamline logistics, and enhance readiness.
The Company delivers a comprehensive suite of integrated solutions across the operations and logistics, aerospace, training, and technology markets to national security, defense, civilian and international clients. Our global team of approximately 16,000 employees brings innovation to every point in the mission lifecycle, from preparation to operations, to sustainment, as it tackles the most complex challenges with agility, grit, and dedication.
Safe Harbor Statement under the Private Securities Litigation Reform Act of 1995 (the “Act”): Certain material presented herein includes forward-looking statements intended to qualify for the safe harbor from liability established by the Act. These forward-looking statements include, but are not limited to, all the statements and items listed under “2024 Guidance” above and other assumptions contained therein for purposes of such guidance, other statements about our 2024 performance outlook, revenue, contract opportunities, and any discussion of future operating or financial performance.
Forward-looking statements generally can be identified by the use of forward-looking terminology such as “may,” “will,” “expect,” “intend,” “estimate,” “anticipate,” “believe,” “could,” “potential,” “continue” or similar terminology. These statements are based on the beliefs and assumptions of the management of the Company based on information currently available to management.
These forward-looking statements are not guarantees of future performance, conditions, or results, and involve a number of known and unknown risks, uncertainties, assumptions, and other important factors, many of which are outside our management’s control, which could cause actual results to differ materially from the results discussed in the forward-looking statements. In addition, forward-looking statements are subject to certain risks and uncertainties that could cause actual results to differ materially from the Company’s historical experience and our present expectations or projections. For a discussion of some of the risks and uncertainties that could cause actual results to differ from such forward-looking statements, see the risks and other factors detailed from time to time our Annual Report on Form 10-K, Quarterly Reports on Form 10-Q, and other filings with the SEC.
We undertake no obligation to update any forward-looking statements, whether as a result of new information, future events or otherwise, except as required by law.