Company to Provide Corporate Updates Including New Developments, First Quarter 2025 Overview and Financial Results; Conference Call to be Held Wednesday, May 14, 2025, at 4:30 P.M. Eastern Time
May 12, 2025 16:05 ET
MIAMI, May 12, 2025 (GLOBE NEWSWIRE) — SKYX (NASDAQ: SKYX) (d/b/a “SKYX Technologies”), a highly disruptive advanced and smart home platform technology company for homes and buildings, with more than 97 issued and pending patents globally and a portfolio of over 60 lighting and home décor websites, announces today that it will host a Corporate Update call and present its first quarter 2025 overview and financial results. The conference call will be held on Wednesday, May 14, 2025, at 4:30 p.m. Eastern Time.
SKYX Participating Members will Include:
Rani Kohen, Founder and Executive Chairman
Steve Schmidt, SKYX President, (Former CEO of Nielsen Data Corporation and former President of Office Depot International)
Lenny Sokolow, Co-CEO
Marc Boisseau, CFO
SKYX Platforms – Q1 2025
Date: Wednesday, May 14, 2025 Time: 4:30 p.m. Eastern Time U.S./Canada Dial-in: 1-412-317-5180 International Dial-in: 1-844-825-9789
Please dial in at least 10 minutes before the start of the call to ensure timely participation.
A playback of the call will be available until June 14, 2025. To listen, call within the United States and Canada or when calling internationally. Please use the replay pin number 10199972. A webcast is also available at the following link: https://viavid.webcasts.com/starthere.jsp?ei=1720256&tp_key=6be89e23ca
About SKYX Platforms Corp. As electricity is a standard in every home and building, our mission is to make homes and buildings become safe-advanced and smart as the new standard. SKYX has a series of highly disruptive advanced-safe-smart platform technologies, with over 97 U.S. and global patents and patent pending applications. Additionally, the Company owns over 60 lighting and home decor websites for both retail and commercial segments. Our technologies place an emphasis on high quality and ease of use, while significantly enhancing both safety and lifestyle in homes and buildings. We believe that our products are a necessity in every room in both homes and other buildings in the U.S. and globally. For more information, please visit our website at https://skyplug.com/ or follow us on LinkedIn.
Forward-Looking Statements Certain statements made in this press release are not based on historical facts, but are forward-looking statements. These statements can be identified by the use of forward-looking terminology such as “aim,” “anticipate,” “believe,” “can,” “could,” “continue,” “estimate,” “expect,” “evaluate,” “forecast,” “guidance,” “intend,” “likely,” “may,” “might,” “objective,” “ongoing,” “outlook,” “plan,” “potential,” “predict,” “probable,” “project,” “seek,” “should,” “target” “view,” “will,” or “would,” or the negative thereof or other variations thereon or comparable terminology, although not all forward-looking statements contain these words. These statements reflect the Company’s reasonable judgment with respect to future events and are subject to risks, uncertainties and other factors, many of which have outcomes difficult to predict and may be outside our control, that could cause actual results or outcomes to differ materially from those in the forward-looking statements. Such risks and uncertainties include statements relating to the Company’s ability to successfully launch, commercialize, develop additional features and achieve market acceptance of its products and technologies and integrate its products and technologies with third-party platforms or technologies; the Company’s efforts and ability to drive the adoption of its products and technologies as a standard feature, including their use in homes, hotels, offices and cruise ships; the Company’s ability to capture market share; the Company’s estimates of its potential addressable market and demand for its products and technologies; the Company’s ability to raise additional capital to support its operations as needed, which may not be available on acceptable terms or at all; the Company’s ability to continue as a going concern; the Company’s ability to execute on any sales and licensing or other strategic opportunities; the possibility that any of the Company’s products will become National Electrical Code (NEC)-code or otherwise code mandatory in any jurisdiction, or that any of the Company’s current or future products or technologies will be adopted by any state, country, or municipality, within any specific timeframe or at all; risks arising from mergers, acquisitions, joint ventures and other collaborations; the Company’s ability to attract and retain key executives and qualified personnel; guidance provided by management, which may differ from the Company’s actual operating results; the potential impact of unstable market and economic conditions on the Company’s business, financial condition, and stock price; and other risks and uncertainties described in the Company’s filings with the Securities and Exchange Commission, including its periodic reports on Form 10-K and Form 10-Q. There can be no assurance as to any of the foregoing matters. Any forward-looking statement speaks only as of the date of this press release, and the Company undertakes no obligation to update or revise any forward-looking statements, whether as a result of new information, future events or otherwise, except as required by U.S. federal securities laws.
Third Quarter of Fiscal Year 2025 – Consolidated Earnings Highlights
Revenue of $408.2 million
Net income of $26.0 million
Adjusted EBITDA* of $37.7 million
Fiscal Year 2025 Guidance Ranges:
Revenue expected in a range of $1.500 billion to $1.575 billion
Net income (loss) expected in a range of $(1) million to $28 million
Adjusted EBITDA* expected in a range of $115 million to $140 million
Third Quarter Fiscal Year 2025 – Segment Highlights
Senior
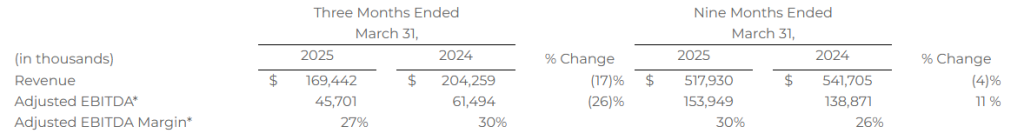
Revenue of $169.4 million
Adjusted EBITDA* of $45.7 million
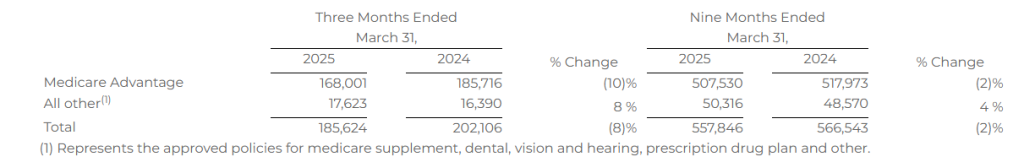
Approved Medicare Advantage policies of 168,001
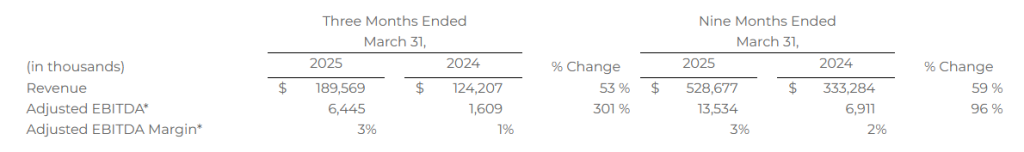
Healthcare Services
Revenue of $189.6 million
Adjusted EBITDA* of $6.4 million
105,523 SelectRx members
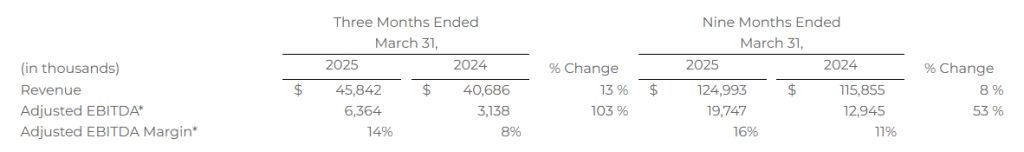
Life
Revenue of $45.8 million
Adjusted EBITDA* of $6.4 million
OVERLAND PARK, Kan.–(BUSINESS WIRE)– SelectQuote, Inc. (NYSE: SLQT) reported consolidated revenue for the third quarter of fiscal year 2025 of $408.2 million compared to consolidated revenue for the third quarter of fiscal year 2024 of $376.4 million. Consolidated net income for the third quarter of fiscal year 2025 was $26.0 million compared to consolidated net income for the third quarter of fiscal year 2024 of $8.6 million. Finally, consolidated Adjusted EBITDA* for the third quarter of fiscal year 2025 was $37.7 million compared to consolidated Adjusted EBITDA* for the third quarter of fiscal year 2024 of $46.6 million.
SelectQuote Chief Executive Officer, Tim Danker, remarked, “We are very proud of the service and value we delivered to America’s seniors over this past year’s highly unique Medicare Advantage season. SelectQuote’s agent-led model paired with our technology-enabled information advantage made our platform more valuable than ever to participants in the healthcare ecosystem. Policy features changed materially and plan termination activity from carriers was significantly higher than historical averages. Through that volatility and confusion, SelectQuote’s agents again delivered remarkable and efficient service, highlighted by a 15% increase in year-over-year policy close rates. SelectQuote is organized to help each and every customer as an individual and despite significant change, our agents were able to help a higher percentage of them this year than last. Strong execution in our Senior business paired with continued performance in Healthcare Services and our Life division all contributed to successful consolidated results for our fiscal 3rd quarter.”
* See “Non-GAAP Financial Measures” below.
Segment Results
We currently have three reportable segments: 1) Senior, 2) Healthcare Services and 3) Life. The performance measures of the segments include total revenue and Adjusted EBITDA.* Costs of commissions and other services revenue, cost of goods sold-pharmacy revenue, marketing and advertising, selling, general, and administrative, and technical development operating expenses that are directly attributable to a segment are reported within the applicable segment. Indirect costs of revenue, marketing and advertising, selling, general, and administrative, and technical development operating expenses are allocated to each segment based on varying metrics such as headcount. Adjusted EBITDA is our segment profit measure to evaluate the operating performance of our business. We define Adjusted EBITDA as income (loss) before income tax expense (benefit) plus: (i) interest expense, net; (ii) depreciation and amortization; (iii) share-based compensation; (iv) goodwill, long-lived asset, and intangible assets impairments; (v) transaction costs; (vi) loss on disposal of property, equipment and software, net; (vii) other non-recurring expenses and income; (viii) changes in fair value of warrant liabilities. Adjusted EBITDA Margin is calculated as Adjusted EBITDA divided by revenue.
Senior
Financial Results
The following table provides the financial results for the Senior segment for the periods presented:
Operating Metrics
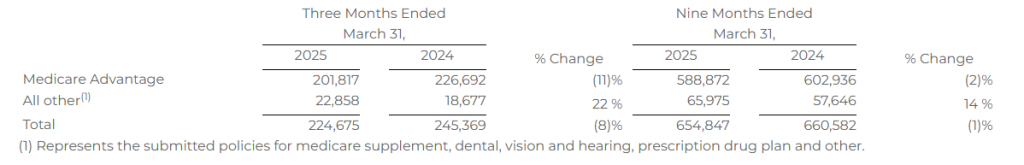
Submitted Policies
Submitted policies are counted when an individual completes an application with our licensed agent and provides authorization to the agent to submit the application to the insurance carrier partner. The applicant may have additional actions to take before the application will be reviewed by the insurance carrier.
The following table shows the number of submitted policies for the periods presented:
Approved Policies
Approved policies represents the number of submitted policies that were approved by our insurance carrier partners for the identified product during the indicated period. Not all approved policies will go in force.
* See “Non-GAAP Financial Measures” below.
The following table shows the number of approved policies for the periods presented:
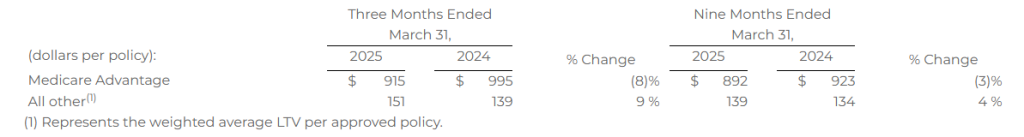
Lifetime Value of Commissions per Approved Policy
Lifetime value of commissions per approved policy represents commissions estimated to be collected over the estimated life of an approved policy based on multiple factors, including but not limited to, contracted commission rates, carrier mix and expected policy persistency with applied constraints. The lifetime value of commissions per approved policy is equal to the sum of the commission revenue due upon the initial sale of a policy, and when applicable, an estimate of future renewal commissions.
The following table shows the lifetime value of commissions per approved policy for the periods presented:
Healthcare Services
Financial Results
The following table provides the financial results for the Healthcare Services segment for the periods presented:
Operating Metrics
Members
The total number of SelectRx members represents the amount of active customers to which an order has been shipped and the prescriptions per day represents the total average prescriptions shipped per business day. These two metrics are the primary drivers of revenue for Healthcare Services.
* See “Non-GAAP Financial Measures” below.
The following table shows the total number of SelectRx members as of the periods presented:
The total number of SelectRx members increased by 41% as of March 31, 2025, compared to March 31, 2024, due to our strategy to grow SelectRx membership.
The following table shows the average prescriptions shipped per day for the periods presented:
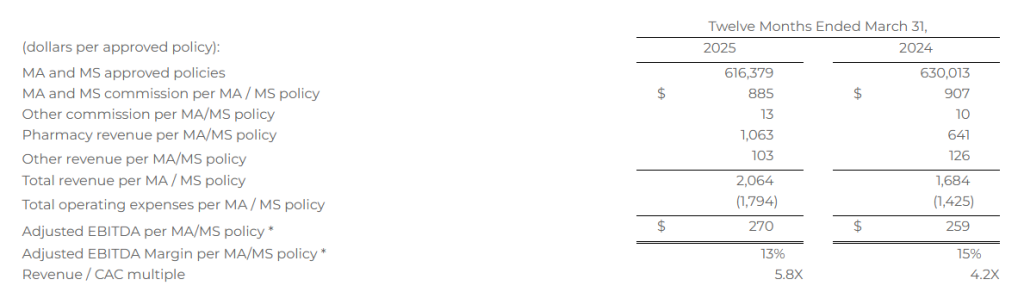
Combined Senior and Healthcare Services – Consumer Per Unit Economics
The opportunity to leverage our existing database and distribution model to improve access to healthcare services for our consumers has created a need for us to review our key metrics related to our per unit economics. As we think about the revenue and expenses for Healthcare Services, we note that they are primarily driven by the marketing acquisition costs associated with the sale of an MA or MS policy, some of which costs are allocated directly to Healthcare Services, and therefore determined that our per unit economics measure should include components from both Senior and Healthcare Services. See details of revenue and expense items included in the calculation below.
Combined Senior and Healthcare Services consumer per unit economics represents total MA and MS commissions; other product commissions; other revenues, including revenues from Healthcare Services; and operating expenses associated with Senior and Healthcare Services, each shown per number of approved MA and MS policies over a given time period. Management assesses the business on a per-unit basis to help ensure that the revenue opportunity associated with a successful policy sale is attractive relative to the marketing acquisition cost. Because not all acquired leads result in a successful policy sale, all per-policy metrics are based on approved policies, which is the measure that triggers revenue recognition.
The MA and MS commission per MA/MS policy represents the LTV for policies sold in the period. Other commission per MA/MS policy represents the LTV for other products sold in the period, including DVH prescription drug plan, and other products, which management views as additional commission revenue on our agents’ core function of MA/MS policy sales. Pharmacy revenue per MA/MS policy represents revenue from SelectRx, and other revenue per MA/MS policy represents revenue from Population Health, production bonuses, marketing development funds, lead generation revenue, and adjustments from the Company’s reassessment of its cohorts’ transaction prices. Total operating expenses per MA/MS policy represents all of the operating expenses within Senior and Healthcare Services. The revenue to customer acquisition cost (“CAC”) multiple represents total revenue as a multiple of total marketing acquisition cost, which represents the direct costs of acquiring leads. These costs are included in marketing and advertising expense within the total operating expenses per MA/MS policy.
The following table shows combined Senior and Healthcare Services consumer per unit economics for the periods presented. Based on the seasonality of Senior and the fluctuations between quarters, we believe that the most relevant view of per unit economics is on a rolling 12-month basis. All per MA/MS policy metrics below are based on the sum of approved MA/MS policies, as both products have similar commission profiles.
Total revenue per MA/MS policy increased 23% for the twelve months ended March 31, 2025, compared to the twelve months ended March 31, 2024, primarily due to the increase in pharmacy revenue. Total operating expenses per MA/MS policy increased 26% for the twelve months ended March 31, 2025, compared to the twelve months ended March 31, 2024, driven by an increase in cost of goods sold-pharmacy revenue for Healthcare Services due to the growth of the business.
Life
Financial Results
The following table provides the financial results for the Life segment for the periods presented:
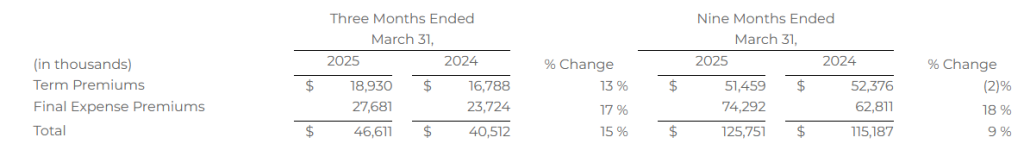
Operating Metrics
Life premium represents the total premium value for all policies that were approved by the relevant insurance carrier partner and for which the policy document was sent to the policyholder and payment information was received by the relevant insurance carrier partner during the indicated period. Because our commissions are earned based on a percentage of total premium, total premium volume for a given period is the key driver of revenue for our Life segment.
The following table shows term and final expense premiums for the periods presented:
* See “Non-GAAP Financial Measures” below.
Earnings Conference Call
SelectQuote, Inc. will host a conference call with the investment community on May 12, 2025, beginning at 8:30 a.m. ET. To register for this conference call, please use this link: https://registrations.events/direct/Q4I54780976. After registering, a confirmation will be sent via email, including dial-in details and unique conference call codes for entry. Registration is open through the live call, but to ensure you are connected for the full call we suggest registering at least 10 minutes before the start of the call. The event will also be webcasted live via our investor relations website https://ir.selectquote.com/investor-home/default.aspx.
Non-GAAP Financial Measures
This release includes certain non-GAAP financial measures intended to supplement, not substitute for, comparable GAAP measures. To supplement our financial statements presented in accordance with GAAP and to provide investors with additional information regarding our GAAP financial results, we have presented in this release Adjusted EBITDA and Adjusted EBITDA Margin, which are non-GAAP financial measures. These non-GAAP financial measures are not based on any standardized methodology prescribed by GAAP and are not necessarily comparable to similarly titled measures presented by other companies. We define Adjusted EBITDA as net income (loss) before income tax expense (benefit), plus interest expense, depreciation and amortization, changes in fair value of warrant liabilities, and certain add-backs for non-cash or non-recurring expenses, including restructuring and share-based compensation expenses. The most directly comparable GAAP measure is income (loss) before tax expense (benefit). We define Adjusted EBITDA Margin as Adjusted EBITDA divided by revenue. The most directly comparable GAAP measure is net income margin. We monitor and have presented in this release Adjusted EBITDA and Adjusted EBITDA Margin because they are key measures used by our management and Board of Directors to understand and evaluate our operating performance, to establish budgets, and to develop operational goals for managing our business. In particular, we believe that excluding the impact of these expenses in calculating Adjusted EBITDA can provide a useful measure for period-to-period comparisons of our core operating performance. We believe that these non-GAAP financial measures help identify underlying trends in our business that could otherwise be masked by the effect of the expenses that we exclude in the calculations of these non-GAAP financial measures. Accordingly, we believe that these financial measures provide useful information to investors and others in understanding and evaluating our operating results, enhancing the overall understanding of our past performance and future prospects. Reconciliations of net income (loss) before income tax expense (benefit) to Adjusted EBITDA are presented below beginning on page 12.
Forward Looking Statements
This release contains forward-looking statements. These forward-looking statements reflect our current views with respect to, among other things, future events and our financial performance. These statements are often, but not always, made through the use of words or phrases such as “may,” “should,” “could,” “predict,” “potential,” “believe,” “will likely result,” “expect,” “continue,” “will,” “anticipate,” “seek,” “estimate,” “intend,” “plan,” “projection,” “would” and “outlook,” or the negative version of those words or other comparable words or phrases of a future or forward-looking nature. These forward-looking statements are not historical facts, and are based on current expectations, estimates and projections about our industry, management’s beliefs and certain assumptions made by management, many of which, by their nature, are inherently uncertain and beyond our control. Accordingly, we caution you that any such forward-looking statements are not guarantees of future performance and are subject to risks, assumptions and uncertainties that are difficult to predict. Although we believe that the expectations reflected in these forward-looking statements are reasonable as of the date made, actual results may prove to be materially different from the results expressed or implied by the forward-looking statements.
There are or will be important factors that could cause our actual results to differ materially from those indicated in these forward-looking statements, including, but not limited to, the following: our reliance on a limited number of insurance carrier partners and any potential termination of those relationships or failure to develop new relationships; existing and future laws and regulations affecting the health insurance market; changes in health insurance products offered by our insurance carrier partners and the health insurance market generally; insurance carriers offering products and services directly to consumers; changes to commissions paid by insurance carriers and underwriting practices; competition with brokers, exclusively online brokers and carriers who opt to sell policies directly to consumers; competition from government-run health insurance exchanges; developments in the U.S. health insurance system; our dependence on revenue from carriers in our senior segment and downturns in the senior health as well as life, automotive and home insurance industries; our ability to develop new offerings and penetrate new vertical markets; risks from third-party products; failure to enroll individuals during the Medicare annual enrollment period; our ability to attract, integrate and retain qualified personnel; our dependence on lead providers and ability to compete for leads; failure to obtain and/or convert sales leads to actual sales of insurance policies; access to data from consumers and insurance carriers; accuracy of information provided from and to consumers during the insurance shopping process; cost-effective advertisement through internet search engines; ability to contact consumers and market products by telephone; global economic conditions, including inflation; disruption to operations as a result of future acquisitions; significant estimates and assumptions in the preparation of our financial statements; impairment of goodwill; potential litigation and other legal proceedings or inquiries; our existing and future indebtedness; our ability to maintain compliance with our debt covenants; access to additional capital; failure to protect our intellectual property and our brand; fluctuations in our financial results caused by seasonality; accuracy and timeliness of commissions reports from insurance carriers; timing of insurance carriers’ approval and payment practices; factors that impact our estimate of the constrained lifetime value of commissions per policyholder; changes in accounting rules, tax legislation and other legislation; disruptions or failures of our technological infrastructure and platform; failure to maintain relationships with third-party service providers; cybersecurity breaches or other attacks involving our systems or those of our insurance carrier partners or third-party service providers; our ability to protect consumer information and other data; failure to market and sell Medicare plans effectively or in compliance with laws; and and other factors related to our pharmacy business, including manufacturing or supply chain disruptions, access to and demand for prescription drugs, and regulatory changes or other industry developments that may affect our pharmacy operations. For a further discussion of these and other risk factors that could impact our future results and performance, see the section entitled “Risk Factors” in the most recent Annual Report on Form 10-K (the “Annual Report”) and subsequent periodic reports filed by us with the Securities and Exchange Commission. Accordingly, you should not place undue reliance on any such forward-looking statements. Any forward-looking statement speaks only as of the date on which it is made, and, except as otherwise required by law, we do not undertake any obligation to publicly update or review any forward-looking statement, whether as a result of new information, future developments or otherwise.
About SelectQuote:
Founded in 1985, SelectQuote (NYSE: SLQT) pioneered the model of providing unbiased comparisons from multiple, highly-rated insurance companies, allowing consumers to choose the policy and terms that best meet their unique needs. Two foundational pillars underpin SelectQuote’s success: a strong force of highly-trained and skilled agents who provide a consultative needs analysis for every consumer, and proprietary technology that sources and routes high-quality leads. Today, the Company operates an ecosystem offering high touchpoints for consumers across insurance, pharmacy, and virtual care.
With an ecosystem offering engagement points for consumers across insurance, Medicare, pharmacy, and value-based care, the company now has three core business lines: SelectQuote Senior, SelectQuote Healthcare Services, and SelectQuote Life. SelectQuote Senior serves the needs of a demographic that sees around 10,000 people turn 65 each day with a range of Medicare Advantage and Medicare Supplement plans. SelectQuote Healthcare Services is comprised of the SelectRx Pharmacy, a Patient-Centered Pharmacy Home™ (PCPH) accredited pharmacy, SelectPatient Management, a provider of chronic care management services, and Healthcare Select which proactively connects consumers with a wide breadth of healthcare services supporting their needs.
RESTON, Va., May 12, 2025 /PRNewswire/ — V2X, Inc. (NYSE:VVX) today announced that its Board of Directors has approved a share repurchase program under which the Company may purchase, from time to time, up to $100 million of the Company’s common stock for a three-year term ending on May 12, 2028.
Jeremy C. Wensinger, President and Chief Executive Officer of V2X stated, “We are excited to announce a $100 million share repurchase program, which reflects the strength in our business and our commitment to enhancing shareholder returns through a disciplined capital allocation strategy. We are focused on maximizing shareholder returns while investing for growth, which is supported by our strong end markets, revenue visibility, backlog, balance sheet, and high free cash flow.”
The purchases under the share repurchase program may be made from time to time (i) through open market purchases, block trades, privately negotiated transactions, one or more trading plans adopted in accordance with Rule 10b5-1 of the Securities Exchange Act of 1934, as amended, or any combination of the foregoing, in each case in accordance with applicable laws, rules and regulations or (ii) in such other manner as will comply with the provisions of the Securities Exchange Act of 1934, as amended. The timing, manner, price and amount of any share repurchases will be determined by V2X in its discretion and will be subject to market and economic conditions, prevailing share prices, loan covenants, applicable legal and regulatory requirements, alternative investment opportunities, and other factors. The share repurchase program does not require V2X to repurchase shares of its common stock and it may be amended, suspended or discontinued at any time.
About V2X V2X builds innovative solutions that integrate physical and digital environments by aligning people, actions, and technology. V2X is embedded in all elements of a critical mission’s lifecycle to enhance readiness, optimize resource management, and boost security. The company provides innovation spanning national security, defense, civilian, and international markets. With a global team of approximately 16,000 professionals, V2X enables mission success by injecting AI and machine learning capabilities to meet today’s toughest challenges across all operational domains.
Safe Harbor Statement Safe Harbor Statement under the Private Securities Litigation Reform Act of 1995 (the “Act”): Certain material presented herein includes forward-looking statements intended to qualify for the safe harbor from liability established by the Act. These forward-looking statements include, but are not limited to, the strength of our business, our commitment to enhancing shareholder returns, capital allocation strategy and investing for growth.
Forward-looking statements generally can be identified by the use of forward-looking terminology such as “may,” “will,” “expect,” “intend,” “estimate,” “anticipate,” “believe,” “could,” “potential,” “continue” or similar terminology. These statements are based on the beliefs and assumptions of the management of the Company based on information currently available to management.
These forward-looking statements are not guarantees of future performance, conditions, or results, and involve a number of known and unknown risks, uncertainties, assumptions, and other important factors, many of which are outside our management’s control, which could cause actual results to differ materially from the results discussed in the forward-looking statements. In addition, forward-looking statements are subject to certain risks and uncertainties that could cause actual results to differ materially from the Company’s historical experience and our present expectations or projections. For a discussion of some of the risks and uncertainties that could cause actual results to differ from such forward-looking statements, see the risks and other factors detailed from time to time in our Annual Report on Form 10-K, Quarterly Reports on Form 10-Q, and other filings with the SEC.
We undertake no obligation to update any forward-looking statements, whether as a result of new information, future events or otherwise, except as required by law.
Key Points: – Pan American buys MAG Silver in a $2.1B deal, adding a major stake in the Juanicipio mine. – Boosts silver exposure and solidifies Pan American as a leading producer in the Americas. – Positive signal for small caps as sector consolidation could drive M&A interest in junior miners.
Pan American Silver Corp. (NYSE: PAAS) has announced a definitive agreement to acquire all outstanding shares of MAG Silver Corp. (NYSEAM: MAG) in a deal valued at approximately $2.1 billion. This acquisition will grant Pan American a 44% stake in the Juanicipio mine in Mexico, a high-grade, low-cost silver operation managed by Fresnillo plc. The transaction includes $500 million in cash and 0.755 Pan American shares per MAG share, subject to proration.
For MAG shareholders, the deal offers an immediate premium of about 21% over the closing price and 27% over the 20-day volume-weighted average price as of May 9, 2025. Post-acquisition, MAG shareholders will own approximately 14% of Pan American, providing exposure to a diversified portfolio of ten silver and gold mines across seven countries.
Pan American’s acquisition of MAG Silver enhances its position as a leading silver producer. Juanicipio is expected to produce between 14.7 million and 16.7 million ounces of silver in 2025, with Pan American’s share being 6.5 to 7.3 million ounces. The mine’s cash costs and all-in sustaining costs are forecasted to range between ($1.00) to $1.00 and $6.00 to $8.00 per silver ounce sold, respectively, for 2025. Additionally, the acquisition adds 58 million ounces of silver to Pan American’s proven and probable mineral reserves, 19 million ounces to measured and indicated resources, and 35 million ounces to inferred resources.
The deal also includes MAG’s exploration projects, Deer Trail in Utah and Larder in Ontario, offering further growth opportunities. Pan American plans to leverage its experience operating in the Americas for over 30 years to integrate these assets effectively.
For junior miners and small-cap investors, this acquisition underscores the trend of consolidation in the mining industry. As larger companies seek to acquire high-quality assets, junior miners with promising projects may become attractive targets. This dynamic can lead to increased valuations for small-cap mining stocks, offering potential opportunities for investors.
However, consolidation can also lead to reduced competition and fewer standalone investment options in the junior mining space. Investors should carefully assess the implications of such deals on their portfolios, considering both the potential for gains through acquisitions and the changing landscape of available investment opportunities.
The transaction is expected to close in the second half of 2025, pending customary closing conditions, including regulatory approvals. All directors and executive officers of MAG have agreed to vote in favor of the transaction.
Patrick McCann, CFA, Research Analyst, Noble Capital Markets, Inc.
Michael Kupinski, Director of Research, Equity Research Analyst, Digital, Media & Technology , Noble Capital Markets, Inc.
Refer to the full report for the price target, fundamental analysis, and rating.
Initiating coverage with an Outperform rating and $23 price target. Sky Harbour Group (NYSE: SKYH) is a specialized aviation infrastructure developer focused on private and business aviation hangar facilities. It develops premium-grade hangar campuses under long-term ground lease agreements. With low land costs, tax-exempt financing, and strong tenant demand, we believe SKYH is positioned to deliver robust rental revenue growth and long-term free cash flow generation.
High-margin leasing model. Sky Harbour leases airport land at favorable long-term rates that are often under $1 per square foot annually. While only a fraction (1/4-1/3) of the land footprint is usable as rentable hangar space, this space can command upwards of $40 per square foot in rent. This creates a significant spread for SKYH. Furthermore, the company owns a prefabricated steel manufacturer, allowing for cost controls and delivery reliability.
Equity Research is available at no cost to Registered users of Channelchek. Not a Member? Click ‘Join’ to join the Channelchek Community. There is no cost to register, and we never collect credit card information.
This Company Sponsored Research is provided by Noble Capital Markets, Inc., a FINRA and S.E.C. registered broker-dealer (B/D).
*Analyst certification and important disclosures included in the full report. NOTE: investment decisions should not be based upon the content of this research summary. Proper due diligence is required before making any investment decision.
Ocugen, Inc. is a biotechnology company focused on developing and commercializing novel gene therapies, biologicals, and vaccines. The lead product in its gene therapy program, OCU400, is in Phase 1/2 clinical trials for retinitis pigmentosa.
Robert LeBoyer, Senior Vice President, Equity Research Analyst, Biotechnology, Noble Capital Markets, Inc.
Refer to the full report for the price target, fundamental analysis, and rating.
Clinical Programs Meet Or Beat Expected Timeframes. Ocugen reported a 1Q25 loss of $15.4 million or $(0.05) per share, consistent with our estimates. The company’s three clinical trial continue to progress on schedule, with the first BLA application expected in mid-2026. Its fourth product, OCU200, initiated Phase 1 patient treatment during the quarter. Cash balance on March 31 was $38.1 million, projected to fund operations through early FY2026.
OCU400 Trial Continues To Lead The Way. The OCU400 liMeliGhT (pronounced “Limelight”) Phase 3 trial in RP continues to enroll patients, with completion expected around YE2025. The study enrolls patients over 5 years of age with any combination of over 100 mutations that cause RP. These patients are at stages ranging from early to advanced RP.
Equity Research is available at no cost to Registered users of Channelchek. Not a Member? Click ‘Join’ to join the Channelchek Community. There is no cost to register, and we never collect credit card information.
This Company Sponsored Research is provided by Noble Capital Markets, Inc., a FINRA and S.E.C. registered broker-dealer (B/D).
*Analyst certification and important disclosures included in the full report. NOTE: investment decisions should not be based upon the content of this research summary. Proper due diligence is required before making any investment decision.
Joe Gomes, CFA, Managing Director, Equity Research Analyst, Generalist , Noble Capital Markets, Inc.
Refer to the full report for the price target, fundamental analysis, and rating.
Moving Forward. MariMed brands continue to capture more share across the markets served. The Company expanded into 70 new storefronts in the quarter. Although MariMed’s brands are already top sellers in their markets, we believe there is a significant opportunity to seize additional market share.
1Q25. Revenue in the first quarter of 2025 of $38 million was virtually unchanged from the first quarter of 2024. We had projected $38.8 million. Adjusted EBITDA was $2.56 million, down from $4.66 million last year. Reported net loss was $5.4 million, or $0.01/sh, compared to a net loss of $1.3 million, or breakeven, last year.
Equity Research is available at no cost to Registered users of Channelchek. Not a Member? Click ‘Join’ to join the Channelchek Community. There is no cost to register, and we never collect credit card information.
This Company Sponsored Research is provided by Noble Capital Markets, Inc., a FINRA and S.E.C. registered broker-dealer (B/D).
*Analyst certification and important disclosures included in the full report. NOTE: investment decisions should not be based upon the content of this research summary. Proper due diligence is required before making any investment decision.
Kratos Defense & Security Solutions, Inc. (NASDAQ:KTOS) develops and fields transformative, affordable technology, platforms, and systems for United States National Security related customers, allies, and commercial enterprises. Kratos is changing the way breakthrough technologies for these industries are rapidly brought to market through proven commercial and venture capital backed approaches, including proactive research, and streamlined development processes. At Kratos, affordability is a technology, and we specialize in unmanned systems, satellite communications, cyber security/warfare, microwave electronics, missile defense, hypersonic systems, training and combat systems and next generation turbo jet and turbo fan engine development. For more information go to www.kratosdefense.com.
Joe Gomes, CFA, Managing Director, Equity Research Analyst, Generalist , Noble Capital Markets, Inc.
Refer to the full report for the price target, fundamental analysis, and rating.
1Q25. In the first quarter of 2025, revenue increased $25.4 million to $302.6 million from $277.2 million in 1Q24. We had forecast revenue of $290 million. Kratos reported adjusted EBITDA of $26.7 million, compared to $26 million in 1Q24 and our $22.5 million estimate. Diluted GAAP EPS was $0.03 versus breakeven last year. Adjusted EPS was $0.12 up from $0.11 last year.
Positioning. With expectations the Defense budget will soon exceed $1 trillion and a major emphasis from the government on increasing innovation, reducing cost, increasing efficiencies, receiving more for less, and rapidly fielding relevant hardware and systems now, we believe Kratos is extremely well positioned.
Equity Research is available at no cost to Registered users of Channelchek. Not a Member? Click ‘Join’ to join the Channelchek Community. There is no cost to register, and we never collect credit card information.
This Research is provided by Noble Capital Markets, Inc., a FINRA and S.E.C. registered broker-dealer (B/D).
*Analyst certification and important disclosures included in the full report. NOTE: investment decisions should not be based upon the content of this research summary. Proper due diligence is required before making any investment decision.
Kelly (Nasdaq: KELYA, KELYB) connects talented people to companies in need of their skills in areas including Science, Engineering, Education, Office, Contact Center, Light Industrial, and more. We’re always thinking about what’s next in the evolving world of work, and we help people ditch the script on old ways of thinking and embrace the value of all workstyles in the workplace. We directly employ nearly 350,000 people around the world and connect thousands more with work through our global network of talent suppliers and partners in our outsourcing and consulting practice. Revenue in 2021 was $4.9 billion. Visit kellyservices.com and let us help with what’s next for you.
Joe Gomes, CFA, Managing Director, Equity Research Analyst, Generalist , Noble Capital Markets, Inc.
Jacob Mutchler, Research Associate, Noble Capital Markets, Inc.
Refer to the full report for the price target, fundamental analysis, and rating.
Q1 Results. The Company recorded revenue of $1.16 billion, up 11.5% year-over-year, in line with our estimate of $1.16 billion. Adj. EBITDA came in at $34.9 million, up 4.8% over the prior year period and modestly lower than our estimate of $36.5 million. Adj. EBITDA margin decreased 20 basis points to 3.0%. Furthermore, Kelly reported net income of $0.16/sh. On an adjusted basis, EPS was $0.39/sh compared to $0.56/sh last year and our estimate of $0.60/sh.
MRP Integration. The majority of MRP operations were absorbed into the SET segment. However, MRP’s Sevenstep business, along with the OCG and P&I segments, have been combined into Enterprise Talent Management (ETM). In connection with the integration and realignment, Kelly took a $10.7 million charge in the quarter.
Equity Research is available at no cost to Registered users of Channelchek. Not a Member? Click ‘Join’ to join the Channelchek Community. There is no cost to register, and we never collect credit card information.
This Company Sponsored Research is provided by Noble Capital Markets, Inc., a FINRA and S.E.C. registered broker-dealer (B/D).
*Analyst certification and important disclosures included in the full report. NOTE: investment decisions should not be based upon the content of this research summary. Proper due diligence is required before making any investment decision.
ISG (Information Services Group) (Nasdaq: III) is a leading global technology research and advisory firm. A trusted business partner to more than 700 clients, including more than 75 of the world’s top 100 enterprises, ISG is committed to helping corporations, public sector organizations, and service and technology providers achieve operational excellence and faster growth. The firm specializes in digital transformation services, including automation, cloud and data analytics; sourcing advisory; managed governance and risk services; network carrier services; strategy and operations design; change management; market intelligence and technology research and analysis. Founded in 2006, and based in Stamford, Conn., ISG employs more than 1,300 digital-ready professionals operating in more than 20 countries—a global team known for its innovative thinking, market influence, deep industry and technology expertise, and world-class research and analytical capabilities based on the industry’s most comprehensive marketplace data. For additional information, visit www.ISG-One.com
Joe Gomes, CFA, Managing Director, Equity Research Analyst, Generalist , Noble Capital Markets, Inc.
Jacob Mutchler, Research Associate, Noble Capital Markets, Inc.
Refer to the full report for the price target, fundamental analysis, and rating.
Q1 Results. Reported Q1 revenue of $59.6 million, slightly over the top end of management’s issued guidance and our estimate of $59.0 million. Net income totaled $1.5 million, or $0.03 per diluted share, an improvement from a loss of $3.4 million, or $0.07 per share, last year. We estimated net income of $0.78 million or $0.02 per share. Adjusted EBITDA was $7.4 million, near the high end of management’s issued guidance and above our estimate of $6.5 million. Adjusted EPS for Q1 came in at $0.07 per share, up from $0.01 per share last year, and above our estimate of $0.05 per share.
Economic Outlook. ISG is well positioned to capitalize on market disruption as clients accelerate digital transformation, adopting cloud solutions, modernizing infrastructure, and deploying AI operations to improve IT performance and reduce costs. These industry shifts align directly with ISG’s core strengths in digital strategy, sourcing advisory, and cost optimization.
Equity Research is available at no cost to Registered users of Channelchek. Not a Member? Click ‘Join’ to join the Channelchek Community. There is no cost to register, and we never collect credit card information.
This Company Sponsored Research is provided by Noble Capital Markets, Inc., a FINRA and S.E.C. registered broker-dealer (B/D).
*Analyst certification and important disclosures included in the full report. NOTE: investment decisions should not be based upon the content of this research summary. Proper due diligence is required before making any investment decision.
FAT Brands (NASDAQ: FAT) is a leading global franchising company that strategically acquires, markets, and develops fast casual, quick-service, casual dining, and polished casual dining concepts around the world. The Company currently owns 17 restaurant brands: Round Table Pizza, Fatburger, Marble Slab Creamery, Johnny Rockets, Fazoli’s, Twin Peaks, Great American Cookies, Hot Dog on a Stick, Buffalo’s Cafe & Express, Hurricane Grill & Wings, Pretzelmaker, Elevation Burger, Native Grill & Wings, Yalla Mediterranean and Ponderosa and Bonanza Steakhouses, and franchises and owns over 2,300 units worldwide. For more information on FAT Brands, please visit www.fatbrands.com.
Joe Gomes, CFA, Managing Director, Equity Research Analyst, Generalist , Noble Capital Markets, Inc.
Refer to the full report for the price target, fundamental analysis, and rating.
Progressing. In spite of the uncertain economy, FAT Brands continued to make progress during 1Q25. A total of 23 locations were opened in 1Q25, up 37% from 1Q24. YTD, the Company has signed agreements for an additional 100-plus locations, adding to the over 1,000 location pipeline. The initial Twin Hospitality distribution was accomplished and one of the whole business securitizations was amended.
1Q25 Results. Revenue was $142 million, down from $152 million in the year ago period, impacted by a 3.4% system-wide same store sale decline and lower revenues due to the closure of one Smokey Bones location during its conversion to a Twin Peaks lodge, partially offset by revenues generated by new Twin Peaks lodges. Reported loss was $46 million, or $2.73/sh, compared to a net loss of $38.3 million, or $2.37/sh, in 1Q24.
Equity Research is available at no cost to Registered users of Channelchek. Not a Member? Click ‘Join’ to join the Channelchek Community. There is no cost to register, and we never collect credit card information.
This Company Sponsored Research is provided by Noble Capital Markets, Inc., a FINRA and S.E.C. registered broker-dealer (B/D).
*Analyst certification and important disclosures included in the full report. NOTE: investment decisions should not be based upon the content of this research summary. Proper due diligence is required before making any investment decision.
The E.W. Scripps Company (NASDAQ: SSP) is a diversified media company focused on creating a better-informed world. As one of the nation’s largest local TV broadcasters, Scripps serves communities with quality, objective local journalism and operates a portfolio of 61 stations in 41 markets. The Scripps Networks reach nearly every American through the national news outlets Court TV and Newsy and popular entertainment brands ION, Bounce, Defy TV, Grit, ION Mystery, Laff and TrueReal. Scripps is the nation’s largest holder of broadcast spectrum. Scripps runs an award-winning investigative reporting newsroom in Washington, D.C., and is the longtime steward of the Scripps National Spelling Bee. Founded in 1878, Scripps has held for decades to the motto, “Give light and the people will find their own way.”
Michael Kupinski, Director of Research, Equity Research Analyst, Digital, Media & Technology , Noble Capital Markets, Inc.
Jacob Mutchler, Research Associate, Noble Capital Markets, Inc.
Refer to the full report for the price target, fundamental analysis, and rating.
Q1 better than expected. The first quarter results were solid, beating expectations. Total revenues were $524.4 million, better than our $519.5 million estimate. Importantly, the largest revenue variance was due to better than expected core advertising, which carries incrementally higher margins. Combined with earlier cost reductions, particularly in its Network segment, the company roundly beat adj. EBITDA expectations, $75.6 million versus our $56.5 million estimate.
Powering through the headwinds. The company gave encouraging Q2 revenue guidance, reflecting improving core advertising trends and strong Connected TV revenue. Core advertising is expected to be down more modestly in Q2 than in Q1, driven by ad demand for its sports programming. Connected TV is expected to continue its favorable revenue trajectory (which was up 42% in Q1).
Equity Research is available at no cost to Registered users of Channelchek. Not a Member? Click ‘Join’ to join the Channelchek Community. There is no cost to register, and we never collect credit card information.
This Research is provided by Noble Capital Markets, Inc., a FINRA and S.E.C. registered broker-dealer (B/D).
*Analyst certification and important disclosures included in the full report. NOTE: investment decisions should not be based upon the content of this research summary. Proper due diligence is required before making any investment decision.
CoreCivic is a diversified, government-solutions company with the scale and experience needed to solve tough government challenges in flexible, cost-effective ways. We provide a broad range of solutions to government partners that serve the public good through high-quality corrections and detention management, a network of residential and non-residential alternatives to incarceration to help address America’s recidivism crisis, and government real estate solutions. We are the nation’s largest owner of partnership correctional, detention and residential reentry facilities, and believe we are the largest private owner of real estate used by government agencies in the United States. We have been a flexible and dependable partner for government for nearly 40 years. Our employees are driven by a deep sense of service, high standards of professionalism and a responsibility to help government better the public good. Learn more at www.corecivic.com.
Joe Gomes, CFA, Managing Director, Equity Research Analyst, Generalist , Noble Capital Markets, Inc.
Refer to the full report for the price target, fundamental analysis, and rating.
A Rising Tide. This is a significant moment of time in CoreCivic’s history, in our opinion. Never in the 42-year company history has there been so much activity and demand for CoreCivic’s services. As we have stated in prior reports, demand for the Company’s services could have a significant upside impact on operating results.
1Q25. First quarter revenue came in at $488.6 million, compared to $500.7 million last year and our $480 estimate, with the decline related to the absence of revenue from the Dilley and CalCity facilities in 1Q25. Adjusted EBITDA was $78.3 million versus $89.5 million. CoreCivic reported EPS of $0.23 compared to an adjusted $0.25 last year and our $0.12 estimate.
Equity Research is available at no cost to Registered users of Channelchek. Not a Member? Click ‘Join’ to join the Channelchek Community. There is no cost to register, and we never collect credit card information.
This Company Sponsored Research is provided by Noble Capital Markets, Inc., a FINRA and S.E.C. registered broker-dealer (B/D).
*Analyst certification and important disclosures included in the full report. NOTE: investment decisions should not be based upon the content of this research summary. Proper due diligence is required before making any investment decision.