Bill Ackman Says ESG Investing Contributes to Inflation


Bill Ackman is Hedging Against Higher Rates and Inflation, Here’s Why


Bill Ackman is the most recent fund manager to weigh in on inflation. Not-unlike when Cathie Wood shared her views last month, Ackman’s read on the question of future price moves approaches the question from in an unconventional way. Ackman, the founder, and owner of Pershing Square Capital is worth listening to as he has made some very profitable calls in the past, including his betting against municipal bond insurer MBIA some years ago. Whether his current expectations play out remains to be seen.

Background

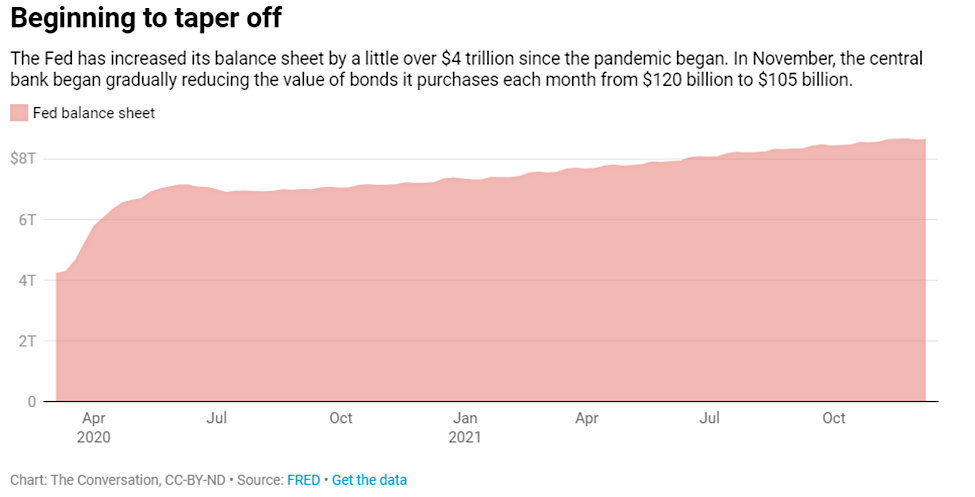
In an October 20, 2021 presentation to the Federal Reserve, Ackman laid out a case for them to immediately taper bond purchases and raise interest rates. Part of his case is the belief that the Fed is blind to how ESG investing is contributing to the recent surge in inflation. Ackman says the portfolio managed by his firm is hedged to protect against and therefore benefit from higher interest rates, as his evaluation sees this risk as imminent.


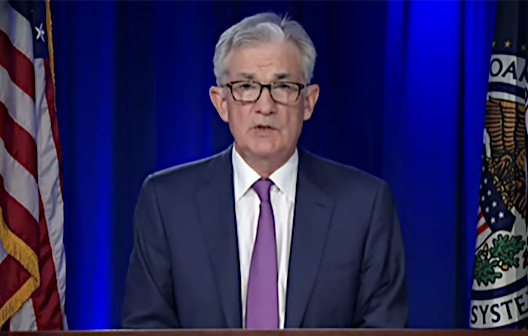
In a Tweet this week (November 3) he said the costs of ESG (Environmental, Social, and Governance) initiatives “is not transitory, but persistent and growing.” Later that day, the November FOMC meeting adjourned and Fed Chairman Powell, indicating that inflation isn’t expected to be persistent, said that the central bank doesn’t expect to raise interest rates until 2023.

Argument
for Higher Rates

Ackman’s reasoning is corporate America’s focus on traditional ESG inputs has shifted investment away from lower-cost fuels and towards higher cost renewables. This argument has been echoed by others on Wall Street that warn energy prices are climbing now because of lagging supplies as the result of underinvestment in natural gas, oil, and coal.

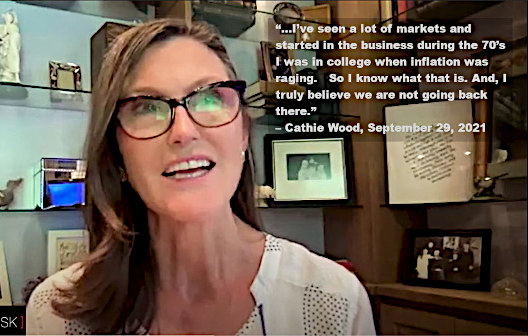
On the flip side of this argument is the founder of Ark Invest, Cathie Wood. Wood has carried the banner for ESG based investing through her investments in “green” companies like Tesla. She has been very outspoken that she expects technological innovation to not only reduce inflationary pressures in the future but perhaps so much so that deflation becomes the real concern.

A third of all assets under management, or $35 trillion are now invested in what has been categorized as sustainable or ESG investments.


Powell did indicate after the Fed meeting that the Fed stands ready to alter its policy as conditions indicate. While he did say he considers inflation to be transitory, he did leave the door open to change his mind before 2023.


Take-Away

Markets are made by people looking at the same facts and drawing two different conclusions. Ackman’s discussion of ESG and inflationary pressures did draw some attacks and some support under his Twitter posts. His past success suggests his expectations and actions are worth watching. Paying attention to the experience-based stance of the founder of Ark Invest is also worth weighing against our own analysis.

Suggested Reading:


Deflation, Not Inflation is Risk Says Cathie Wood


Inflation Seems Persistent, Now What?


Where Investors Should Turn if Spiking Oil Prices Feed Stagflation


Positive Outlook for Metals and Miners in 2022


Sources:

https://fortune.com/2021/11/04/bill-ackman-stakeholder-capitalism-hight-inflation-elon-musk-cathie-wood

https://www.newyorkfed.org/medialibrary/media/aboutthefed/pdf/IACFM-presentation-Oct-2021

https://markets.businessinsider.com/news/stocks/bill-ackman-pershing-square-federal-reserve-stimulus-taper-interest-rates-2021-11?utm_source=markets&utm_medium=ingest

https://twitter.com/BillAckman/status/1456107116654120967

https://twitter.com/BillAckman/status/145412

https://markets.businessinsider.com/news/stocks/bill-ackman-federal-reserve-ignores-esg-investing-contributing-surging-inflation-2021-11?utm_campaign=browser_notification&utm_source=desktop

https://markets.businessinsider.com/news/stocks/global-sustainable-investment-alliance-report-esg-assets-responsible-investing-2021-7?utm_source=markets&utm_medium=ingest


Stay up to date. Follow us:

 

Small Cap vs Large Cap After Fed Tightens


Image Credit: Medill DC (Flickr)

What Rising Interest-Rates Has Meant for Small and Large-Cap Stocks


Interest rates, as measured by the US Treasury 10-year note have been below 4% since 2008. The 10-year is an important rate in many homeowners’ lives as it is the benchmark rate for many conventional 30-year mortgages. Rates are currently being held well below most measures of inflation as a part of the Fed’s efforts to maintain a healthy economy. Rates on bonds would naturally have a positive spread over inflation, inflation rates either have to come down, or bond rates should rise.


Source: Macrotrends


Stock market participants are concerned that the current easy money environment is unsustainable and are concerned about what may happen to the markets as the Fed begins to taper and siphon money back out of the banking system. Channelchek’s focus remains on smallcap and microcap stocks. Below we look at what has occurred in the broader small-cap and large-cap sectors during the 12-months following the Fed indicated they’d be more hawkish.


Background

Keeping in mind that the past is not a perfect indicator of the future, let’s look back and see what has occurred to smallcap stocks during each of the 12 month periods after the Fed started reducing economic stimulus.

 Absent another surprise shock, the Fed is expected to begin to taper their support of the banking system via reduced bond purchases. They announced today (November 3) that they’d reduce bond purchases by $10 billion per month. The markets have been anticipating this reduction in stimulus since at least the first Covid-19 vaccines were given earlier this year. The stock markets continued to rise despite the threat of tighter money.


The chart above shows each time the Fed has overtly begun to remove stimulus from the banking system. Specifically, over the past four periods, there has been only one (February 1994) that has been negative for the Russell 2000, and that is the only period that has underperformed the S&P 500 (-2.9% vs +2.41%). The following date the Fed began to be less accommodative was June 1999. Small caps as measured by the Russell index grew 14.32%, large caps as measured by the S&P 500 also rose, but only 5.97%. In June 2004, when the Fed began to tighten, small caps saw a 9.45% return over the following 12 months. During the same period, large caps returned a little less than half at 4.43%. More recently, in December 2015, small caps shot up 22.63% afterwards the Fed began a more hawkish stance; again the large-cap index was also positive but returned less than half at 10.70%

With only one exception, since 1994, each time the Fed began removing stimulus, these two major indexes were positive, small caps returned on average 10.93% over the following year while the large-cap index returned on average 5.88%.


Take-Away

Each time the Fed talks of tightening, the stock market is concerned. Historically stocks are not impacted the way bonds are, and small-cap stocks tend to outshine. We don’t know what will occur over the next year, but looking back, we may not need to be concerned at all.


Sources:

https://www.ajmc.com/view/a-timeline-of-covid-19-vaccine-developments-in-2021

www.koyfin.com

https://www.treasury.gov/resource-center/data-chart-center/interest-rates/Pages/TextView.aspx?data=longtermrate

https://www.macrotrends.net/2016/10-year-treasury-bond-rate-yield-chart

Is the FOMC Walking a Tightrope


Image Credit: Francois de Halleux (Flickr)

The Fed is in a Box, Any of Its Options Could Create Problems


What does transitory mean? It means fleeting and temporary.  The “inflation is transitory” expectation has, over the past two months, become less probable. The last time we had economic weakness and inflation, was in the ’80s when the Fed (FOMC) found themselves needing to stimulate the economy by lowering rates while at the same time needing to stave off inflation with higher rates, back then we said, “the Fed is in a box.” Well, for those of us that have forty-plus years of economic memories, it feels like we’ve been here before.

Background

Officials at the U.S. Federal Reserve Bank are poised to begin withdrawing the liquidity in the system (economy) that was added in response to the reaction to the pandemic. Wall Street economists expect the Fed to announce a $15 billion reduction in monthly Treasury and mortgage-backed securities purchases beginning this month (November).  If $15 billion per month is withdrawn, all tapering will be out of the system by July of 2022.

The Fed has been using the “transitory” description when discussing inflation. If they continue to suggest it is temporary, the markets, stock and bond, may lose all confidence and could crumble. So the voting members may feel they have no choice but to become more hawkish at a time when U.S. economic growth is less than satisfactory.  Uncertainty as to fiscal spending plans adds another degree of difficulty for the Fed as they have incomplete information related to tax rates and government spending plans. Monetary and fiscal policy should work in conjunction with each other. Fiscal policy is up in the air. The Fed is, in a box, or boxed in. No matter what action or inaction they announce tomorrow, it will likely draw a negative (and positive) response on different fronts.

What to Listen For

On the top of Fed-watcher’s minds is whether the FOMC will continue its “transitory” description with respect to inflation.  Price increases are prevalent in everyone’s daily lives and have proved more persistent than central bankers had suggested they’d be. Fed Chairman Powell has remained consistent in his public expressions that rising prices are the result of the economy reopening and won’t be long-lived.  Investors will be listening for this same language, particularly those in more interest-sensitive sectors.  Eliminating all “transitory” language may perpetuate a bond market sell-off that could carry over into stocks.

Recent Economic Numbers

Fed watchers are beginning to have a more difficult time making the inflation-is-transitory case. They are looking at, for example,  the quarterly Employment Cost Index (ECI) released on Friday (October 29), which is the preferred wage cost measurement release of many economists. It includes full compensation costs rather than just payroll data.  The larger-than-expected rise in the third quarter ECI was the fastest pace of increase since they started measuring this almost 40 years ago. Labor costs, as a percentage of business expenses,  are often a companies’ highest expense. The ECI shows these costs are increasing rapidly as employers raise pay to attract workers. 

The labor shortage is helping to promulgate the “everything-shortage,” this scarcity of things is also providing inflationary fuel. Labor numbers will be reported this Friday when the Labor Department releases its October employment situation report.  Economists expect sporadic hiring and wages that are rising at an increased pace as millions of workers remain on the sidelines for reasons that are less understood. From a supply/demand standpoint,  if true labor-force participation is lower than Fed policymakers are accounting for, the U.S. economy is much closer to full employment than they thought and wage inflation as competition for employees continues will spiral upward. 

Against that potentiality, what if the Fed decides they can risk spooking the markets by eliminating the word “transitory” in their statement? After all, Powell recently said the Fed could accelerate the tapering process.  So it may. What is important for all investors to understand is that much of the Fed’s control over the economy is done outside of actual monetary policy and instead falls in setting expectations and providing confidence. For example, their words and promises.

Based on bond market movements, investors are already expecting that the Fed will raise rates sooner than the central bank has indicated. Economists at Goldman Sachs last week said, “We now expect core PCE inflation to remain above 3%—and core CPI inflation above 4%—when the taper concludes.” The PCE index is considered the Fed’s most worthwhile inflation gauge.

Can monetary policy impact supply shortages that have been caused by supply-chain issues? The trillions that consumers have in savings amounts to approximately 10% of GDP. The shortage problem is also being exacerbated by high demand. Monetary policy is meant to affect demand. Reducing demand by pulling cash out of the system and making money more expensive could help the supply chain catch up while slowing demand price pressures. But, this is where the Fed is in a box. Demand is already falling. Last week’s third-quarter GDP report reflected the slowest rate of growth since the pandemic inspired lockdowns.  As consumers retrenched, government spending fell, exports fell and business spending on plant and equipment declined. The increased prices are one cause of slowing consumption. It is conceivable that if rising rates and less liquidity through tapering further slows demand and price pressures decline, demand returns. This is possible, but a weak argument as consumers tend to buy when they believe products will cost more in the future.

Take-Away

For the FOMC voting members, they may feel “damned if they do, damned if they don’t,” as it relates to increased tapering and including the “transitory” language. While the future is always uncertain, market participants have eyes and can conduct their own analysis. If they lose confidence in the Fed having a steady and capable hand, they may panic. If they have confidence in the Fed’s words and actions, and those words are not pro-growth, they may also sell. This places the Fed in a box. Although the Fed’s mission isn’t market-related, severe reactions by the stock and bond markets reverberate through all sectors of the economy.

Paul Hoffman

Managing Editor, Channelchek


Suggested Reading:


Trimmed PCE Inflation vs the PCE Deflator


Inflation is No Baloney


Will Inflation be Transitory or Persistent?


Inflation’s Impact on Stocks, Four Scenarios


Sources:

https://www.ig.com/en-ch/financial-events/fomc-meeting-announcement
https://fred.stlouisfed.org/series/GDP

https://www.barrons.com/articles/federal-reserve-meeting-economic-growth-investors-51635839198?mod=hp_LEAD_1

https://www.barrons.com/articles/growth-slowdown-beyond-delta-variant-51631307629?mod=article_inline

https://www.reuters.com/business/goldman-sachs-brings-forward-us-rate-hike-projection-by-year-2021-11-01/


Stay up to date. Follow us:

 

Is the FOMC Walking a Tightrope?


Image Credit: Francois de Halleux (Flickr)

The Fed is in a Box, Any of Its Options Could Create Problems


What does transitory mean? It means fleeting and temporary.  The “inflation is transitory” expectation has, over the past two months, become less probable. The last time we had economic weakness and inflation, was in the ’80s when the Fed (FOMC) found themselves needing to stimulate the economy by lowering rates while at the same time needing to stave off inflation with higher rates, back then we said, “the Fed is in a box.” Well, for those of us that have forty-plus years of economic memories, it feels like we’ve been here before.

Background

Officials at the U.S. Federal Reserve Bank are poised to begin withdrawing the liquidity in the system (economy) that was added in response to the reaction to the pandemic. Wall Street economists expect the Fed to announce a $15 billion reduction in monthly Treasury and mortgage-backed securities purchases beginning this month (November).  If $15 billion per month is withdrawn, all tapering will be out of the system by July of 2022.

The Fed has been using the “transitory” description when discussing inflation. If they continue to suggest it is temporary, the markets, stock and bond, may lose all confidence and could crumble. So the voting members may feel they have no choice but to become more hawkish at a time when U.S. economic growth is less than satisfactory.  Uncertainty as to fiscal spending plans adds another degree of difficulty for the Fed as they have incomplete information related to tax rates and government spending plans. Monetary and fiscal policy should work in conjunction with each other. Fiscal policy is up in the air. The Fed is, in a box, or boxed in. No matter what action or inaction they announce tomorrow, it will likely draw a negative (and positive) response on different fronts.

What to Listen For

On the top of Fed-watcher’s minds is whether the FOMC will continue its “transitory” description with respect to inflation.  Price increases are prevalent in everyone’s daily lives and have proved more persistent than central bankers had suggested they’d be. Fed Chairman Powell has remained consistent in his public expressions that rising prices are the result of the economy reopening and won’t be long-lived.  Investors will be listening for this same language, particularly those in more interest-sensitive sectors.  Eliminating all “transitory” language may perpetuate a bond market sell-off that could carry over into stocks.

Recent Economic Numbers

Fed watchers are beginning to have a more difficult time making the inflation-is-transitory case. They are looking at, for example,  the quarterly Employment Cost Index (ECI) released on Friday (October 29), which is the preferred wage cost measurement release of many economists. It includes full compensation costs rather than just payroll data.  The larger-than-expected rise in the third quarter ECI was the fastest pace of increase since they started measuring this almost 40 years ago. Labor costs, as a percentage of business expenses,  are often a companies’ highest expense. The ECI shows these costs are increasing rapidly as employers raise pay to attract workers. 

The labor shortage is helping to promulgate the “everything-shortage,” this scarcity of things is also providing inflationary fuel. Labor numbers will be reported this Friday when the Labor Department releases its October employment situation report.  Economists expect sporadic hiring and wages that are rising at an increased pace as millions of workers remain on the sidelines for reasons that are less understood. From a supply/demand standpoint,  if true labor-force participation is lower than Fed policymakers are accounting for, the U.S. economy is much closer to full employment than they thought and wage inflation as competition for employees continues will spiral upward. 

Against that potentiality, what if the Fed decides they can risk spooking the markets by eliminating the word “transitory” in their statement? After all, Powell recently said the Fed could accelerate the tapering process.  So it may. What is important for all investors to understand is that much of the Fed’s control over the economy is done outside of actual monetary policy and instead falls in setting expectations and providing confidence. For example, their words and promises.

Based on bond market movements, investors are already expecting that the Fed will raise rates sooner than the central bank has indicated. Economists at Goldman Sachs last week said, “We now expect core PCE inflation to remain above 3%—and core CPI inflation above 4%—when the taper concludes.” The PCE index is considered the Fed’s most worthwhile inflation gauge.

Can monetary policy impact supply shortages that have been caused by supply-chain issues? The trillions that consumers have in savings amounts to approximately 10% of GDP. The shortage problem is also being exacerbated by high demand. Monetary policy is meant to affect demand. Reducing demand by pulling cash out of the system and making money more expensive could help the supply chain catch up while slowing demand price pressures. But, this is where the Fed is in a box. Demand is already falling. Last week’s third-quarter GDP report reflected the slowest rate of growth since the pandemic inspired lockdowns.  As consumers retrenched, government spending fell, exports fell and business spending on plant and equipment declined. The increased prices are one cause of slowing consumption. It is conceivable that if rising rates and less liquidity through tapering further slows demand and price pressures decline, demand returns. This is possible, but a weak argument as consumers tend to buy when they believe products will cost more in the future.

Take-Away

For the FOMC voting members, they may feel “damned if they do, damned if they don’t,” as it relates to increased tapering and including the “transitory” language. While the future is always uncertain, market participants have eyes and can conduct their own analysis. If they lose confidence in the Fed having a steady and capable hand, they may panic. If they have confidence in the Fed’s words and actions, and those words are not pro-growth, they may also sell. This places the Fed in a box. Although the Fed’s mission isn’t market-related, severe reactions by the stock and bond markets reverberate through all sectors of the economy.

Paul Hoffman

Managing Editor, Channelchek


Suggested Reading:


Trimmed PCE Inflation vs the PCE Deflator


Inflation is No Baloney


Will Inflation be Transitory or Persistent?


Inflation’s Impact on Stocks, Four Scenarios


Sources:

https://www.ig.com/en-ch/financial-events/fomc-meeting-announcement
https://fred.stlouisfed.org/series/GDP

https://www.barrons.com/articles/federal-reserve-meeting-economic-growth-investors-51635839198?mod=hp_LEAD_1

https://www.barrons.com/articles/growth-slowdown-beyond-delta-variant-51631307629?mod=article_inline

https://www.reuters.com/business/goldman-sachs-brings-forward-us-rate-hike-projection-by-year-2021-11-01/


Stay up to date. Follow us:

 

Investors in their Education to Get a New Tool from Congress


College Cost Calculators Aren’t Precise, but They Could Easily be Made Better


The best way to figure out how much you have to pay for college is not to go by the sticker price. Instead, it’s to go by a college’s net price, which is often much lower. That’s because the net price tells you how much you have to pay to attend a particular school after you get your financial aid.

So why would anyone go by the sticker price when they could go by the more accurate net price? The main reason is that the net price is often unknown until after you get a college offer letter. These offer letters spell out how much financial aid you can expect.

One way to speed up how fast you can calculate the net price for a school is to use an online tool called a net price calculator. As its name suggests, a net price calculator is meant to give you a better sense of the actual price you have to pay to go to a particular college. The net price calculator does this by providing a more individualized price estimate based on you or your family’s financial circumstances.

You might think all net price calculators are created equal. As researchers who study the economics of higher education, we can tell you they are not.


This article was republished with permission from  The
Conversation
, a news site dedicated to sharing ideas from academic experts. It represents the research-based findings and thoughts of  Aaron Anthony, Director of Operations, Institute for Learning, University of Pittsburgh and Lindsay Page, Adjunct associate, Brown University.


In a 2021 peer-reviewed study, we found that the prices determined by net price calculators vary by an average of US$5,700 per student for students from families with the same or similar economic situations. That means the price determined by a net price calculator can be off by plus or minus $5,700. That’s pretty significant because – over the course of four years – that adds up to $22,800 and can determine whether and how much you need to borrow in student loans.


Differences in Calculators

Some net price calculators are more user-friendly than others.

Some of them ask students to provide financial information that is hard to access. For others, the calculators might provide cost of attendance information – as well as grant aid information – that could be outdated.

Since all net price calculators don’t work the same way, it can also be hard to compare prices from different schools.

The U.S. Department of Education provides a free net price calculator template. It doesn’t require that much information, and most student users can provide the information on their own.


Proposed Improvements

There’s a bill in Congress that aims to improve net price calculators. It’s called the Net Price Calculator Improvement Act.

Introduced in April 2021 by Sen. Charles “Chuck” Grassley, a Republican from Iowa, the bill would create a minimum set of requirements for net price calculators. It would also allow for the U.S. Department of Education to create a universal net price calculator that would have students answer one set of questions and get net price estimates for several schools.

The bill has only a 3% chance of becoming law, according to a website that scores bills based on their chances of being passed.

The federal net price calculator template requests information about a student’s household income. This is reportable in increments of $10,000 that range from $30,000 to $99,999. It also asks what your family size is, whether you plan to live in a college dorm or off-campus and how many family members are in college. This in turn allows the federal template net price calculator to generate identical financial aid estimates for similar students attending the same postsecondary institution. However, actual aid awards may be very different.


In Search of a Fix

Since figuring out financial aid is not easy to do, we identified three simple changes that would make the federal net price calculator template more accurate.


1. High school GPA

Even though a lot of colleges and universities award merit-based aid – basically scholarships – the current template does not request any academic information. A simple change like asking students for their high school GPA could help better predict merit-based grants. On the user-facing side of the calculator, students would just enter their GPA. On the back end, where colleges enter their aid information, colleges could set up GPA requirements for students to get various scholarships offered through the school.


2. Anticipated financial aid application timing

Different colleges have different deadlines for financial aid from within. If net price calculators could capture the date when a student plans to apply for financial aid, the calculator could include only aid the student would be eligible to receive. For example, if a student submits an application after a college’s institutional aid deadline but before a state or federal deadline, then the school’s calculator would include only state and federal aid in the net price estimate.


3. Expanded income bracket

The current income categories top out at $99,999, meaning that a family earning $100,000 is treated identically to a family earning 10 times that amount. An additional option of $100,000-$150,000 would help to distinguish upper-middle-income families from upper-income families. According to table A-2 on this Census website, 15.3% of the 129.9 million households in the U.S. – or 19.9 million households – have incomes between $100,000 and $150,000.


The average undergraduate student from a family with a household income between $100,000 and $150,000 receives more than $4,400 in grant aid. This is according to a National Postsecondary Student Aid Study from 2016 – the most recent data available.


Better Estimates

Our study included 7,600 students at 900 different colleges and universities. We had an even mix of public and private colleges.

We found that information collected on the current version of the federal template net price calculator accounts for 70% of the variation in actual aid awards for students attending the same university. In other words, the inputs these calculators require can account for 70 cents of every dollar in aid awarded.

Our proposed changes can help net price calculators do a better job of estimating aid for similar students. With these additions, we found that the information that net price calculators use would predict 86 cents of each dollar in aid awarded.

Even if these changes were adopted, there would still be a lot of variation in the prices determined by net price calculators. The variation changes based on the type of college in question. For instance, at private, four-year institutions, amounts varied by nearly $11,000. By contrast, within community colleges, it was about $2,400.

Taking these figures into account, a federal net price calculator template could also help prospective students estimate high and low ends of their expected grant awards.

Our proposed modifications are straightforward to implement and require only basic information from student users. They also allow for a universal federal template that colleges and universities can adapt to their own financial aid award processes.

As Congress considers legislation to improve how net price calculators look and function, keeping the tool simple to use is one of the most important aspects to consider. Choosing a college is among the most consequential financial decisions that students and their families will ever make. More accurate and easy-to-use tools should make the decision easier than it would otherwise be.

One More Thing

Do you know a student with an interest in the investment markets? Tell them about the Channelchek College
Challenge.
 

Are you that student? Think about how being awarded $5,000 to $7,500 will help your studies.


Stay up to date. Follow us:
 

Elon Musk Weighs in on Unrealized Capital Gains Tax Idea


Image Source: Mobilus in Mobil (Flickr)

Will the Definition of Income be Changed to Collect More Income Taxes?


Can one be expected to pay income tax on capital gains when there has not been a realized gain?  Senator Ron Wyden of Oregon is the top-ranking member of the Senate’s tax committee; today (October 27), he proposed to tax unrealized capital gains. This places a legislative heavyweight behind getting this dramatic change implemented. Back in February, and again this week, the Secretary of the Treasury, Janet Yellen, proposed this idea. Open opposition to this idea comes from some notable businesspeople, including Elon Musk, who wonders if it is a slippery slope that will eventually impact everyone. Others question how can one properly appraise non-market-oriented investments each year?


Background

In the U.S., capital-gains tax works this way; one purchases a capital asset such as a stock or real estate, the purchase price then becomes the “cost basis.” After it’s sold, the change in value between this cost basis and the sale price is the realized capital gain.  In cases where the asset was held for a year or more, its gain is taxed at a 15 to 20 percent rate (depending on the taxpayer’s income). An additional 3.8 percent surtax is added for taxpayers making over $250,000.  In effect, the U.S. has a capital-gains tax imposition of between 15 percent and 23.8 percent when an asset is sold at a profit after one year. The rate is higher if it’s sold within a year. Under a year, it is taxed at the owner’s ordinary income tax rate.

If the value of a capital asset increases, but that gain was not realized by a sale, there is no tax event. For assets that are inherited and never sold by the original purchaser, they are valued at the current market at the time of inheritance. Although there is an inheritance tax on large estates, many assets are reset at the current market or replacement value, thus reducing the beneficiary’s cost basis and reducing the magnitude of any potential tax from the pre-inheritance valuation.


Current Proposals

The Secretary of the Treasury who is also a former Chair of the US Federal Reserve Bank, Janet Yellen,  proposed a tax on capital gains. She wants investors to pay a tax on the increase in the value of stock every year, even if it is not sold. In an appearance on CNN this week she said, “It would help get at capital gains, which are an extraordinarily large part of the incomes of the wealthiest individuals, and right now escape taxation.” Details of where the lines would be drawn and who the tax would impact were not clear. She was, however, discussing what she refers to as the wealthiest of individuals.

In a Senate Finance Committee news release, Senator Ron Wyden (Oregon) presented what he calls The Billionaires
Income Tax.
The release has the tag line:

“Billionaires Income Tax would
ensure billionaires pay tax every year, like working Americans”

Key points of the proposal are, tradable assets like stocks would be marked-to-market every year. Billionaires would pay tax on any gain and take deductions for losses on these assets each year for tax purposes. Those affected would be able to carry losses forward and, in certain circumstances, carry back losses for three years. 

Non-tradable assets like real estate or business interests would not be taxed annually. When someone of high net worth sells non-tradable assets, they would pay capital gains tax, plus an interest charge. The interest charge, or “deferral recapture amount,” is the amount of interest that would be due on the tax owed if the asset had been marked to market each year and the tax had been deferred until sale. The interest rate is the applicable federal short-term rate plus one point. The AFR is currently 0.22 percent, so the interest rate applied would be 1.22 percent.

The proposal contains rules to transition to the changed income tax. For example, the first time those impacted have their tradable assets marked-to-market, they may elect to pay the newly incurred tax over five years. They may also elect to treat up to $1 billion of tradable stock in a single corporation as a non-tradable asset. This will ensure that the proposal does not affect the ability of an individual who founds a successful company to maintain their controlling interest because they’d be forced to sell a portion to pay taxes.


Source: U.S. Senate Committee on Finance Bulletin, October 27, 2021


Opposition

Those opposed argue that a declining market could potentially reduce taxes collected. Others wonder how non-tradeable assets can appropriately be marked-to-market, and question if an entire industry of appraisers will be born in order to serve accountants and the IRS needs.

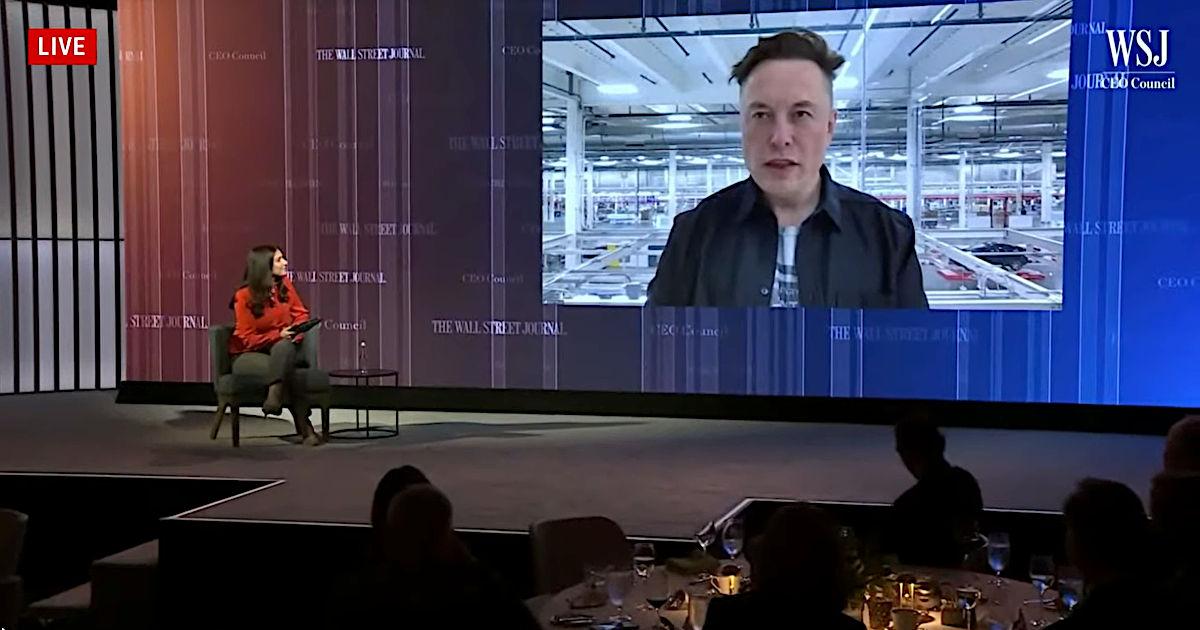
The richest man in the world, U.S. Citizen and immigrant businessman Elon Musk would surely be included and taxed differently. He showed his opposition when he tweeted his thoughts in response to a tweet directed at him along with the second richest man, Jeff Bezos.


Musk seems to believe that although it’s called the “Billionaires Income Tax” those without as many zeros after their net worth may also be impacted if the idea of taxing unrealized gains becomes accepted.

There is also concern over how this could impact stock prices. Taxing a non-cash asset leaves the challenge of where the cash will come from. It also reduces the incentive to hold stocks for very long periods of time. The combination of these two, if the proposal becomes a reality, could weigh on the stocks with the greatest gains.

Why Now?

There are a number of expensive proposals coming out of the nation’s capital. These include the Social Spending Bill, converting our energy grid to something less dependent on fossil fuels, infrastructure spending, and funding for stimulus and other projects. 

The question is paying for these enormously expensive projects. The richest 400 families in the country have become thought of as a source for various reasons; chief among them is the average voter is indifferent to taxes that don’t directly impact them.

Take-Away

In an attempt to find a means to pay for expensive projects, there are proposals coming from Washington to increase taxes. One proposal that is being brought to the forefront, separate from a “wealth tax,” is the idea of collecting taxes based on the change in the market value of assets rather than realized capital gains. If implemented, this would have implications far beyond the few hundred families directly impacted. The financial markets and real estate may feel some weight.  The reasons are that money would have to come from the liquidation of something to pay the required taxes, also the attractiveness of long holding times is lowered, and alternative investments, perhaps offshore, may become more tax efficient.

Suggested Reading:


Is Biden Tightening the Reins on Large Companies?


Federal Marijuana Laws are Half-In/Half-Out Says Justice Clarence Thomas


Paying for Infrastructure Spending


The Era of Flying Cars May Have Just Dawned

Sources:

https://www.finance.senate.gov/chairmans-news/wyden-unveils-billionaires-income-tax

https://www.finance.senate.gov/imo/media/doc/Billionaires%20Income%20Tax%20-%20One%20Pager.pdf

https://www.whitehouse.gov/omb/briefing-room/2021/09/23/new-omb-cea-report-billionaires-pay-an-average-federal-individual-income-tax-rate-of-just-8-2/

https://www.politico.com/newsletters/weekly-tax/2021/10/25/will-wydens-new-wealth-tax-survive-the-courts-798431

https://www.nytimes.com/2021/10/26/us/politics/democrats-billionaires-tax.html

https://www.businessinsider.in/international/news/heres-how-janet-yellens-proposed-tax-on-unrealised-capital-gains-may-work/articleshow/87249423.cms


Stay up to date. Follow us:
 

Corruption at the World Bank?


Image Credit: World Bank Photo Collection (flickr)

Scandal Involving World Bank’s ‘Doing Business’ Index Exposes Problems in Using Sports-like Rankings to Guide Development Goals

The World Bank, a behemoth of an organization that provides tens of billions of dollars in aid to mostly developing countries, is in the middle of one of its biggest scandals since being founded in 1944.

The crux of the crisis relates to its Doing Business Index, which ranks the ease of opening and operating companies in 190 countries. In September 2021, an investigation alleged that senior leadership at the bank manipulated the index’s data in response to pressure from China and Saudi Arabia.

The scandal has already caused the bank to suspend publication of the index and prompted calls for further investigations. Some have also demanded the resignations of officials identified in the report, such as Kristalina Georgieva, who was formerly CEO at the World Bank and now heads the International Monetary Fund.


This article was republished with permission from  The Conversation, a news site dedicated to sharing ideas from academic experts. It represents the research-based findings and thoughts of  
Fernanda G Nicola, Professor of Law, American University


I’m a comparative legal scholar who studies the rule of law in multilateral institutions like the World Bank. As I show in my forthcoming book on the topic, I believe the real problem here is less about whether or not officials meddled, and more about the problematic role the Doing Business Index and similar indicators play in aid to developing countries.


Everyone
Wants to Win

The World Bank’s Doing Business Index ranks countries around the world across 11 different economic indicators, such as registering property and paying taxes, and has become an authoritative source for international business and funding decisions since its inception in 2002. It’s akin to U.S. News and World Report’s rankings of colleges, countries and other categories.

A change in a country’s rankings can have a huge impact on how much money it receives from foreign investors. The World Bank has found that a 1 percentage point improvement in a country’s overall Doing Business score correlates with US$250 million to $500 million in additional foreign direct investment.

The main idea behind the ranking system was that it would be very simple for politicians, journalists and others to use, and therefore publicity surrounding it would prompt reforms.

“The main advantage of showing a single rank,” according to a 2005 World Bank staff report, is “as in sports, once you start keeping score everyone wants to win.”

And in effect, even though the World Bank technically has no mandate to guide countries’ regulatory regimes, in practice its index has had significant influence on how governments behave. For example, countries in Latin America and Africa have restructured their entire corporate governance regimes to fit Doing Business’ one-size-fits-all reforms.

But this wide influence has a negative side, as it serves as an incentive for governments to try to “game the system – or corrupt it,” as The Washington Post editorial board put it recently.


Problems
with Doing Business

The most recent Doing Business scandal began around June 2020, when employees began spotting data irregularities in two recent reports.

In January 2021, the law firm WilmerHale was asked to investigate. On Sept. 15, Wilmerhale said it found that senior World Bank leadership pressured employees to improve China’s Doing Business ranking in the 2018 report as it sought Beijing’s support for a major capital injection. The law firm also found problems with changes to rankings of Saudi Arabia, the United Arab Emirates and Azerbaijan in the 2020 report but didn’t blame senior leaders directly.

But a big part of the problem here is that the rankings incentivize this kind of behavior, often because not all countries can enact the market-friendly legal reforms required to rise up.

One way they can do this is by paying the World Bank fees for “reimbursable advisory services,” such as advice on how to better implement the kinds of reforms it favors. Of course, it is not hard to see the potential for institutional conflict of interest and corruption here. The report noted that both China and Saudi Arabia made extensive use of these contracts while pressuring bank officials to change their rankings.

The bigger concerns about the Doing Business Index is more fundamental. Comparative legal scholars, including me, have found that the legal reforms favored by the index always appear biased in favor of systems based on common law followed by countries such as the U.S. and U.K.

For instance, France, one of the world’s largest economies operating under a civil legal code, has performed rather poorly in the initial rankings because of low scores on the “registering property” and “getting credit” metrics. And, in turn, that means countries such as Algeria, Lebanon and Indonesia that built legal systems based on France or other non-Anglo legal traditions are also unfairly hurt by the rankings.

The rankings have been controversial since their very launch. Joseph Stiglitz, who was chief economist at the World Bank in the late 1990s, said in a recent op-ed that he thought it was a “terrible product” from the beginning.

“Countries received good ratings for low corporate taxes and weak labor regulations,” he wrote. “The numbers were always squishy, with small changes in the data having potentially large effects on the rankings. Countries were inevitably upset when seemingly arbitrary decisions caused them to slide in the rankings.”

In other words, the Doing Business Index ends up pushing countries toward a shareholder-focused corporate and business model molded on U.S.-style capitalism. This is at odds with many other models, such as those in Japan and Germany, that put more emphasis on workers and social goals like gender equality. Corporate governance scholars have found these may be better models for some countries than U.S.-style capitalism.


Does it
Deserve to Die?

The recent scandal underscores the degree to which the index doesn’t square with the bank’s wider purpose.


The World Bank’s stated mission is to “end extreme poverty and promote shared prosperity.” It was set up in the wake of the Second World War to achieve this mission through financing agreements with developing countries.

The Doing Business Index fails in this purpose because it compels governments to commit to “transplanted” legal reforms that may not be right for those countries, and in fact may end up backfiring and delivering bad outcomes for residents.

I’m not sure whether the index “deserves to die” or should be reformed and shifted to another institution, such as a university, but I do believe its time at the World Bank is likely coming to an end.

Suggested Reading:


Publicly Traded Chinese Companies Duty to Shareholders


ESG Programs Under the SEC Spotlight


Stay up to date. Follow us:
 

What a $75.6 Billion COLA Could Mean to Investors


Image Credit: RODNAE Productions (Pexels)

What Investors Get from the COLA Increase in 2022


Roughly $75.6 billion of new money will be distributed to a specific demographic beginning next year ($6.3 billion per month). How seniors spend their newfound 5.9% Social Security COLA increase could impact a number of industries. Seniors are known to spend disposable income on eating out, travel, gifts for family, etc. They may also find they can withdraw less from savings and investment accounts, keeping more in the markets. Although tens of billions won’t alter investment sectors in the same way a multi-trillion-dollar infrastructure bill would, as we saw with stimulus checks, it can be quite impactful.


  Source: ssa.gov

Background:

Inflation data released yesterday (October 13) included the Consumer Price Index for All Urban Wage Earners and Clerical Workers (CPI-W). This is the index on which Cost of Living Adjustment (COLA) for Social Security benefits is calculated. The “raise” COLA provides 69.1 million Social Security recipients will start begin January 2022.  The percentage increase, calculated by the average of July, August, and September CPI-W is 5.9%. Every penny of this near 6% increase is money that was not previously in circulation.

Although we often imagine a retired person as someone barely scraping by on a limited fixed income, conserving because they can barely make ends meet, the reality is those now in retirement own more property, have greater pensions, and are worth ten times more than millennials. 


The info-graphic above by the Visual Capitalist demonstrates how successful, on average, the generation now of retirement age has been in providing for their future. And while many rising costs like healthcare and food impact those receiving social security, housing expenses often don’t vary much from one year to the next. Much of the new payments, although individually may not seem impactful, combined with almost 70 million people, all in a specific demographic, will have an impact. As an example, when $1400 in stimulus checks were sent to 137 million people last March, it contributed to driving the stock market gains (S&P up 7.16%), housing, and technology purchases.


Expectations

The question is, where will this newfound cash flow be spent or invested. According to the U.S. Bureau of Labor Statistics, those 65-74 spend 2.4% more than the overall population on food. Presumably, much of this difference is prepared food at restaurants. More compelling, entertainment has an even wider gap over the total population as seniors (65-74) spend 19.6% more on entertainment. Although it isn’t included in the BLS data, travel and gifts for grandchildren are included on most lists of where seniors are spending after all other costs are covered.

Take-Away

Does the COLA increase impact you? If you aren’t in a position to receive one, you may ask, is this bullish for stocks? And, what stocks may benefit the most? While headlines of other spending work their way into investment analysis, this use inflow, so far, has been largely overlooked.

Paul Hoffman

Managing Editor, Channelchek

Suggested Reading:


In Nine Years, Nearly All Boomers Will Have Retired, Is This Good for Stock Pickers?


COLA Increases for Seniors in 2022 Will Likely Top $68 Billion


IRA Investments and Small Cap Stocks


Is it Smart to Avoid Brokers that Sell Order Flow


Sources:

https://www.ssa.gov/oact/cola/colaseries.html

https://crr.bc.edu/wp-content/uploads/2005/02/ib_28_508.pdf

https://www.aarp.org/content/dam/aarp/research/surveys_statistics/life-leisure/2019/aarp-grandparenting-study-money-fact-sheet.doi.10.26419-2Fres.00289.017.pdf

https://www.visualcapitalist.com/visualizing-net-worth-by-age-in-america/

https://www.bls.gov/opub/btn/volume-5/spending-patterns-of-older-americans.htm


Stay up to date. Follow us:
 

Digital Currency Report from the Fed is Past Due


About the Central Bank Digital Currency Position Report, That’s Late


The U.S. Federal Reserve Board is expected to release a nail-biter of a report stating their position on potentially adopting a digital dollar. The cryptocurrency would have the same backing and perqs of $US Dollars. The Fed expressed last summer that it had partnered with the Massachusetts Institute of Technology to “understand the opportunities and limitations” of a Central Bank Digital Currency (CBDC). It was announced the project was to release its findings in late summer 2021. It is now early Fall 2021, the markets have not yet gotten the expected big announcement. However, Fed Chair Powell may have shown his hand on Tuesday.

Speaking before the Senate Banking Committee Tuesday (Sept. 28), Powell said that while existing laws governing the Fed’s activities could serve as a basis for issuing a digitized version of the U.S. dollar, he expressed a preference for working on a legislation-backed push instead. This was in response to a question from Senator Pat Toomey of Pennsylvania. He further set expectations for the past-due board’s report, saying the Fed had made no decision on a CBDC. The paper will instead tackle some of the related public policy issues and set the stage for the central bank to gather feedback from lawmakers and the public.

Although the paper, when released, will not be definitive, it seems it will set the Fed’s stance regarding pros, cons, and how-tos. As with most Fed position papers, it may “define” in unclear language that will be studied carefully by those active in markets that could be impacted. The current direction, based on Chairman Powell’s answer is that the Fed expects a seat at the table but would like Congress to hand down any definitive action.


Foreign Central Banks

We live in a world that has become very small, so what happens in one major market impacts another. Although Europe’s potential adoption of a digital euro, or China, which is looking to creates a digital yuan would impact the U.S., an actual dollar valued like cash may be years away. Some believe the potential for dramatically disrupting the global financial balance is too great, while others worry the United States will cede dominance of the global financial system if it does not digitize the dollar, which is used as the global reserve currency. Of special concern, is China’s digital
yuan pilot
project, which is believed to be far ahead of the United States and its biggest economic rival.

Other Decision Maker Positions

Fed Governor Lael Brainard is on record saying she finds it inconceivable that the United States would not pursue a digital dollar when competing economies were forging ahead with CBDCs. “That just doesn’t sound like a sustainable future,” she said in July.

Fed Governors Christopher Waller and Randal Quarles have argued many dollar transactions are now digital and that the costs of a CBDC could far outweigh any benefit. Staff within the Fed are also said to be divided on the issue.

On Capitol Hill, some see a CBDC as the door opener that makes financial services accessible and affordable for millions of Americans that are currently ignored by the mainstream banking system. At the same time, others express concerns over privacy and security.

For those focused on what it would mean for wholesale and merchant banking, CBDCs could come into existence strictly for wholesale use. This could speed up processes and lower the cost of cross-border payments between parties.  Individually, a retail digital dollar could be used by the general public, expanding Americans’ access to a range of financial services.

Take-Away

If the Fed’s original intent of sending out a position paper on a CBDC in late Summer was to set the course toward or away from its adoption, they seem to have backed off. Some things take longer than expected, and with big decisions, discoveries are often found that would impact any final release. The paper when released, will be combed through for nuances decision untold. If we are to believe Chairman Powell’s answer last Tuesday, the Fed Chair who is up for reappointment, would prefer to have input in the decision but not be the decider.


Suggested Reading:


What’s the Timeline for a US Digital Dollar?


The Federal Reserve and MIT are Experimenting with Digital Currency


Is Coinbase Planning to “School” the SEC on Cryptocurrencies?


Severe Punishment for All Things Crypto in China -Who’s Impacted?


Sources:

https://www.youtube.com/watch?v=KX1aPj1MJNQ

https://www.cnbc.com/2021/09/22/the-fed-is-evaluating-whether-to-launch-a-digital-currency-and-in-what-form-powell-says.html

Analysis: U.S. Fed navigates policy minefield with impending
digital dollar report | Reuters


Stay up to date. Follow us:
 

Why 200 Companies Joined Amazons Climate Pledge


More Companies Pledge ‘Net-Zero’ Emissions to Fight Climate Change, But What Does That Really Mean?


You’ll probably hear the term “net-zero emissions” a lot over the coming weeks as government leaders and CEOs, under pressure, talk about how they’ll reduce their countries’ or businesses’ impact on climate change. Amazon, for example, just announced that more than 200 companies have now joined its Climate Pledge, committing to reach net-zero emissions by 2040.


This article was republished with permission from  The
Conversation
, a news site dedicated to sharing ideas from academic experts. It represents the research-based findings and thoughts of 
Amrou Awaysheh Assistant Professor of Operations Management and Executive Director, Business Sustainability Lab, Indiana University


But what does net-zero emissions actually mean?

“Zero emissions” – without the “net” caveat – means emitting no greenhouse gases.

“Net-zero emissions” has more wiggle room. It’s like balancing a checkbook. The country or company cuts most of its emissions through efficiency and clean energy, then offsets the rest by removing carbon dioxide from the atmosphere or eliminating emissions elsewhere.

For example, trees absorb carbon dioxide from the air, so they’re often considered “negative emissions.” The tiny Himalayan kingdom of Bhutan can claim net-zero emissions because almost all of its electricity comes from hydropower, and its forests sequester about three times more carbon than its vehicles, factories and other human activities emit.

Companies have another way to claim net-zero emissions – they can take advantage of carbon reductions elsewhere by buying carbon credits. For example, a U.S. company might pay to protect forests in South America and then subtract those trees’ negative emissions from its own emissions to say that its operations are “net-zero.” Other carbon credits support sustainable development projects, such as installing wind or solar power in poorer countries.

But counting on carbon credits also draws criticism, because it allows those companies to keep generating greenhouse gases. Other concerns are that some projects would happen anyway, the emissions reductions might not be permanent or even verifiable, or they might get double-counted by more than one entity. Some projects, like tree planting, can take years to pay off in emissions reductions while the companies buying forest offsets continue emitting greenhouse gases.


Why Does Net-Zero Emissions
Matter?

Greenhouse gases trap heat near Earth’s surface. When their concentrations get too high, they fuel global warming.

In 2015, countries around the world agreed to limit global warming to well under 2 degrees Celsius (3.6 F) compared with preindustrial times, with a goal of 1.5 C (2.7 F). To keep warming under 1.5 C with the least disruption, the United Nations says the world needs to be on a path to reach net-zero emissions by about 2050. To put those temperatures into perspective, global warming today is just over 1 C (1.8 F) above preindustrial levels, and rising seas and extreme weather are already a problem.

Several countries, including the United States, have pledged to meet the goal of net-zero emissions by 2050. But when the U.N. analyzed each country’s commitments under the Paris Agreement in mid-September, it found they still fall short by so much that even if every pledge is met, temperatures will rise about 2.7 C (4.86 F) this century.


 Keeping global warming to 1.5 C will require negative greenhouse gas emissions. Climate Analytics and New Climate Institute


How a Company Gets to Net-Zero
Emissions

To see how a company might get to net-zero emissions, let’s imagine a hypothetical company, ChipCo, that makes, packages and distributes potato chips. ChipCo purchases electricity from a local utility to run machinery at its factory. It also has boilers to generate steam to heat the building and for some production processes. And it uses delivery trucks to transport its products to customers. Each step generates greenhouse gas emissions.

To achieve net-zero emissions, ChipCo’s first step is to ramp up energy efficiency. Improvements in insulation and equipment can reduce the amount of energy needed or wasted. A simple example is switching out incandescent light bulbs that use 60 watts of energy with LED bulbs that give off the same brightness, yet consume only 8 watts.

The second step is to switch from fossil fuels – the leading source of human-caused greenhouse gas emissions – to renewable energy, such as solar or wind power, that doesn’t produce greenhouse gas emissions. Once the company’s electricity is renewable, using electric delivery vehicles further cuts emissions.

Homes and office buildings can also be built to net-zero, or carbon-neutral, standards. In that case, the focus is on making them extremely energy-efficient and relying on heating and electricity from clean energy sources.


ChipCo’s third step is finding negative emissions. It might be too expensive or not yet technologically possible for it to replace its steam boiler with a carbon-neutral product. Instead, ChipCo might purchase carbon credits that would remove the same amount of carbon from the atmosphere that would be generated by the boiler.

Companies are increasingly under pressure from governments, activists and their customers, as well as some powerful investors, to cut their emissions.

To tell if a company is taking its responsibilities seriously, look for its action plan and performance so far. A company that announces a net-zero target of 2030 can’t wait until 2029 to take action. There needs to be a consistent trajectory of improvements in energy efficiency and clean energy, not just promises and carbon offsets.


Suggested Reading:


ESG Indicators and How to Use Them


The Advantages of Microcap Equities for Investors


ESG, B Corps, and Investors


Can Mining Be Green and Sustainable?


Stay up to date. Follow us:

 

Why 200 Companies Joined Amazon’s Climate Pledge


More Companies Pledge ‘Net-Zero’ Emissions to Fight Climate Change, But What Does That Really Mean?


You’ll probably hear the term “net-zero emissions” a lot over the coming weeks as government leaders and CEOs, under pressure, talk about how they’ll reduce their countries’ or businesses’ impact on climate change. Amazon, for example, just announced that more than 200 companies have now joined its Climate Pledge, committing to reach net-zero emissions by 2040.


This article was republished with permission from  The
Conversation
, a news site dedicated to sharing ideas from academic experts. It represents the research-based findings and thoughts of 
Amrou Awaysheh Assistant Professor of Operations Management and Executive Director, Business Sustainability Lab, Indiana University


But what does net-zero emissions actually mean?

“Zero emissions” – without the “net” caveat – means emitting no greenhouse gases.

“Net-zero emissions” has more wiggle room. It’s like balancing a checkbook. The country or company cuts most of its emissions through efficiency and clean energy, then offsets the rest by removing carbon dioxide from the atmosphere or eliminating emissions elsewhere.

For example, trees absorb carbon dioxide from the air, so they’re often considered “negative emissions.” The tiny Himalayan kingdom of Bhutan can claim net-zero emissions because almost all of its electricity comes from hydropower, and its forests sequester about three times more carbon than its vehicles, factories and other human activities emit.

Companies have another way to claim net-zero emissions – they can take advantage of carbon reductions elsewhere by buying carbon credits. For example, a U.S. company might pay to protect forests in South America and then subtract those trees’ negative emissions from its own emissions to say that its operations are “net-zero.” Other carbon credits support sustainable development projects, such as installing wind or solar power in poorer countries.

But counting on carbon credits also draws criticism, because it allows those companies to keep generating greenhouse gases. Other concerns are that some projects would happen anyway, the emissions reductions might not be permanent or even verifiable, or they might get double-counted by more than one entity. Some projects, like tree planting, can take years to pay off in emissions reductions while the companies buying forest offsets continue emitting greenhouse gases.


Why Does Net-Zero Emissions
Matter?

Greenhouse gases trap heat near Earth’s surface. When their concentrations get too high, they fuel global warming.

In 2015, countries around the world agreed to limit global warming to well under 2 degrees Celsius (3.6 F) compared with preindustrial times, with a goal of 1.5 C (2.7 F). To keep warming under 1.5 C with the least disruption, the United Nations says the world needs to be on a path to reach net-zero emissions by about 2050. To put those temperatures into perspective, global warming today is just over 1 C (1.8 F) above preindustrial levels, and rising seas and extreme weather are already a problem.

Several countries, including the United States, have pledged to meet the goal of net-zero emissions by 2050. But when the U.N. analyzed each country’s commitments under the Paris Agreement in mid-September, it found they still fall short by so much that even if every pledge is met, temperatures will rise about 2.7 C (4.86 F) this century.


 Keeping global warming to 1.5 C will require negative greenhouse gas emissions. Climate Analytics and New Climate Institute


How a Company Gets to Net-Zero
Emissions

To see how a company might get to net-zero emissions, let’s imagine a hypothetical company, ChipCo, that makes, packages and distributes potato chips. ChipCo purchases electricity from a local utility to run machinery at its factory. It also has boilers to generate steam to heat the building and for some production processes. And it uses delivery trucks to transport its products to customers. Each step generates greenhouse gas emissions.

To achieve net-zero emissions, ChipCo’s first step is to ramp up energy efficiency. Improvements in insulation and equipment can reduce the amount of energy needed or wasted. A simple example is switching out incandescent light bulbs that use 60 watts of energy with LED bulbs that give off the same brightness, yet consume only 8 watts.

The second step is to switch from fossil fuels – the leading source of human-caused greenhouse gas emissions – to renewable energy, such as solar or wind power, that doesn’t produce greenhouse gas emissions. Once the company’s electricity is renewable, using electric delivery vehicles further cuts emissions.

Homes and office buildings can also be built to net-zero, or carbon-neutral, standards. In that case, the focus is on making them extremely energy-efficient and relying on heating and electricity from clean energy sources.


ChipCo’s third step is finding negative emissions. It might be too expensive or not yet technologically possible for it to replace its steam boiler with a carbon-neutral product. Instead, ChipCo might purchase carbon credits that would remove the same amount of carbon from the atmosphere that would be generated by the boiler.

Companies are increasingly under pressure from governments, activists and their customers, as well as some powerful investors, to cut their emissions.

To tell if a company is taking its responsibilities seriously, look for its action plan and performance so far. A company that announces a net-zero target of 2030 can’t wait until 2029 to take action. There needs to be a consistent trajectory of improvements in energy efficiency and clean energy, not just promises and carbon offsets.


Suggested Reading:


ESG Indicators and How to Use Them


The Advantages of Microcap Equities for Investors


ESG, B Corps, and Investors


Can Mining Be Green and Sustainable?


Stay up to date. Follow us:

 

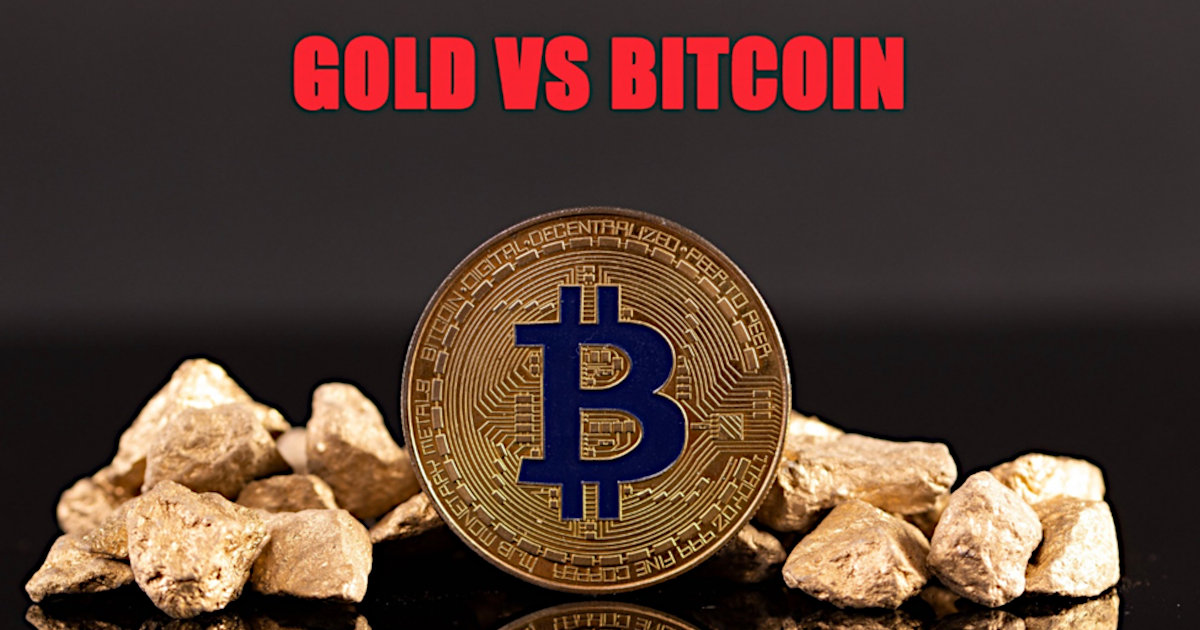
What Evergrande Confirmed About Gold and Bitcoin


Gold Maintained Its Haven Status During the Evergrande Selloff


It’s the biggest company you’ve never heard of—until last week, that is. Evergrande Group, the “too big to fail” Chinese property developer, rattled markets last Monday when it missed interest payments to at least two of its lenders. This gave more than a few investors flashbacks to Lehman Brothers’ demise in 2008, which helped trigger the global financial crisis.


This article was republished with permission
from Frank Talk, a CEO Blog by Frank Holmes of U.S. Global Investors (
GROW). Find more of Frank’s articles here – Originally published September 27, 2021


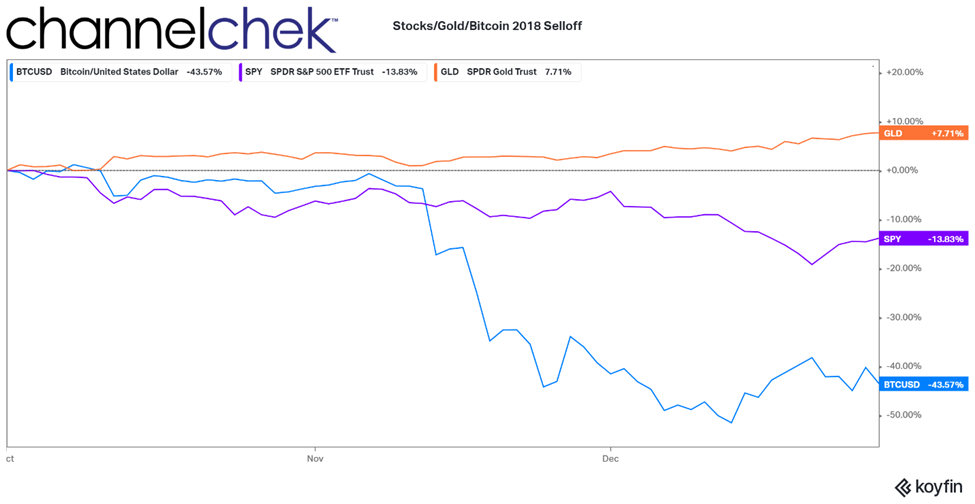
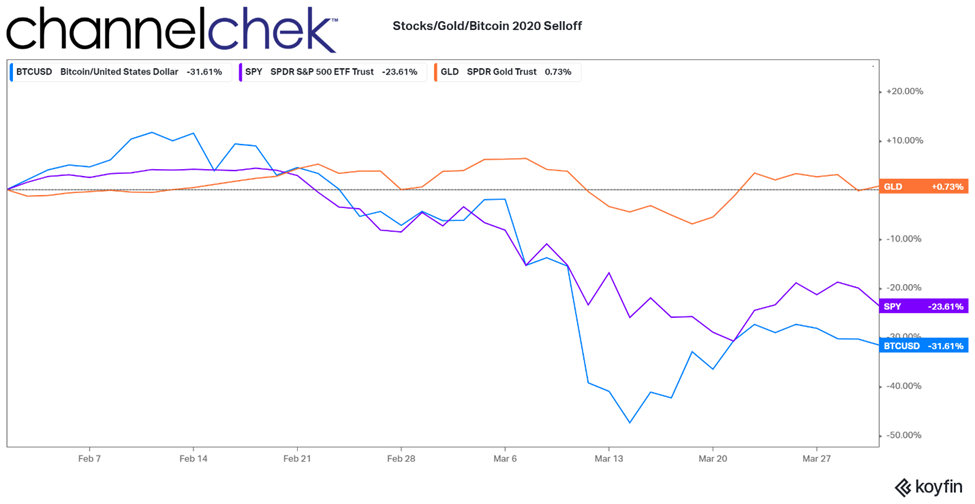
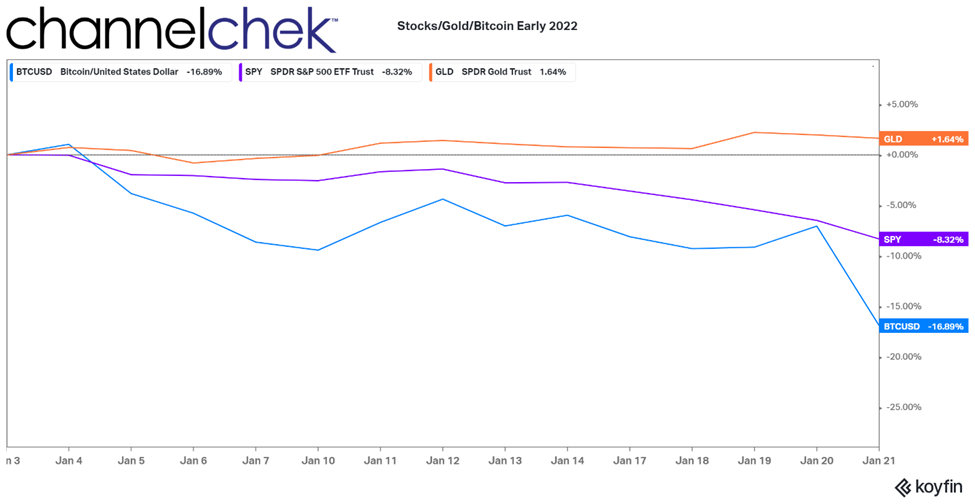
The selloff spread to U.S. markets, and I was pleased to see that gold maintained its haven status. The yellow metal ended the day slightly up more than half a percent, passing an important “stress test” of its investment case in the age of Bitcoin.

The world’s biggest cryptocurrency, believed by many to be “digital gold,” plunged 8.5% on Monday as investors dumped riskier assets. Indeed, Bitcoin is more than four times as volatile as gold. Those of you who attended HIVE Blockchain Technologies’ earnings webcast on Friday know that gold bullion has a 10-day standard deviation of only ±3, while Bitcoin’s is ±14. Ether’s is even higher at ±19 over 10 trading days.

Bitcoin dipped further last week after the Chinese government banned all crypto transactions and crypto mining, prompting many to speculate that the People’s Bank of China (PBOC) is preparing to issue its own CBDC, or central
bank digital currency.

I believe this crackdown is yet more proof that people need to own some Bitcoin, which is currently on sale as we await news on whether the Xi Jinping Administration will step in to prevent another pandemic, this one of the financial kind.

Gold and Bitcoin Looking More Attractive as Contagion Fears Mount

For the record, I find it hard to believe that President Xi will do nothing. Evergrande may not be a household name in the U.S., but it’s China’s second largest real estate company, with nearly 800 projects in 234 cities. It also offers financial products, invests in electric vehicles and is even building a theme park on an artificial
island off the province of Hainan.

This growth didn’t happen organically, though, and today Evergrande is believed to be the world’s most indebted developer, saddled with more than $300 billion in total liabilities. In November 2020, the Financial
Times
 wrote that the Fortune 500 company “has enough land to house the entire population of Portugal and more debt than New Zealand.” At the end of last year, it had roughly twice as much debt as equity, putting it in a class well above other Chinese real estate firms. 

As “eye-popping” as Evergrande’s debt load is, it’s a “small drop in the ocean of debt that the world is swimming in,” CLSA’s Damian Kestel wrote last week in a note to clients. Total global debt in the second quarter stood at just under $300 trillion, a new record, according to the Institute of International Finance’s (IFF) most recent Global Debt Monitor.

“The bigger they come, the harder they fall,” as the saying goes. If Evergrande were allowed to fail without any governmental intervention, it could spark a credit crisis that would make 2007-2008 look tame by comparison.

Against this backdrop, gold and Bitcoin look very attractive to me as stores of value, and both happen to be on sale right now. I’ve always recommended a 10% weighting in gold, with 5% in bullion and 5% in gold mining stocks and ETFs. I also believe it’s prudent to have between 1% and 2% in Bitcoin.

No, They’re Not Mutually Exclusive

As someone who’s involved in both gold and Bitcoin investing, I clearly don’t subscribe to the idea that one is better than the other in all cases. I agree with Bloomberg’s James Seyffart and Eric Balchunas, who said in a note last week that gold and Bitcoin “can complement each other in a portfolio.”

Although the two assets share
obvious similarities and differences
 – one is thousands of years old while the other is brand spanking new; one is easily portable while the other isn’t—I think there are three important distinctions that investors need to be aware of: volatility, taxation and correlation to the market.

Volatility I’ve already talked about.

Looking at taxation, Bitcoin is taxed the same as a stock, with a long-term capital gains rate of between 0% and 20%, depending on income level. Gold, on the other hand, is taxed as a collectible, meaning it carries a higher fixed rate of 28%, regardless of income. Point: Bitcoin.

And then there’s correlation. Gold has no correlation to the S&P 500, making it suitable for someone who wants to hedge against market risk. As a risk-on asset, Bitcoin has a slight correlation to the S&P. Point: Gold.

When you add all of this up, I believe it shows that gold has a small advantage over Bitcoin as a diversifier and store of value—at least for now. This could change as the Bitcoin network matures and its price swings stabilize.


Channelchek invites
you subscribe to the U.S. Global Investors YouTube channel by 
clicking here!


Suggested Reading:


Afghanistan is Sitting on a Gold Mine. Literally


What Metals Prices Can Tell us About the Economy


Afghanistan’s Mineral Resources are Estimated to be Worth $1 Trillion to $3 Trillion


Will U.S. Car Companies be Handed Different EV Advantages?


Of
Importance to Finance Majors (or Related Field)

Each year Noble Capital Markets, Channelchek, and some very generous and caring sponsors hold the Channelchek College Equity Research Challenge.

The Challenge invites students to compete with one another for high cash prizes awarded to the student and the student’s school – plus more (see rules). It may also provide high-value networking opportunities with veteran equity analysts.

Who can compete?

You don’t have to be a finance, accounting, or major in a related field to understand that up to $7500 for you, and an additional $5,000 to your school can be quite helpful.  If you are fully matriculated and interested, you likely qualify.

We invite
you to learn more. 


Stay up to date. Follow us:
 

Pass Rate on Chartered Financial Analyst Exam Drops Even Lower


Image Credit: Lisa Barker (Flickr)

Why are Chartered Financial Analyst (CFA) Candidates Having So Much Trouble?


The CFA Level 1 pass rate broke all previous records by plunging 12% this summer. According to a CFA press release dated September 14, only 22% of the 28,849 candidates who sat for the Level 1 test qualify to move on to Level 2. This is the lowest pass rate since the exam’s origin back in 1963. The ten-year average rate of success is 41%. The previous low was set by those who took the exam last May. Their success rate was just
25%,
almost half of the 49% that had passed in December of 2020.


What Has Caused the Back-to-Back Declines?

Peg Jobst, CFA Managing Director, Head of Credentialing, said: “We continue to see the impact from the exam disruptions brought on by the global pandemic. We understand how difficult this period has been for our candidates, who in many cases, saw their exam schedules changed more than once as they sought to sit for Level I of the CFA Program. We can clearly see that these disruptions have impacted the overall pass rate.”

In a CFA press release following the initial fall off in passing grades earlier this year (May exam), the institute said the exam difficulty was consistent with past years. Did the pandemic cause a high level of distraction from exam prep? Did the move to computer-based testing play a role?  The CFA Institute seems to suggest the low pass rate was in large part due to poorly prepared candidates.  Each of the CFA exam levels requires at least 300 hours of study time. Candidates taking exams this year have had their studies disrupted by repeated exam postponements and cancellations due to COVID 19 preventative measures.

“Going forward, we do expect the pass rate to approach pre-COVID historical levels in time — so long as pandemic conditions subside. As we have said before, the exams and the process for setting the minimum passing score have not changed. Unfortunately, the many challenges posed by life during a pandemic have clearly made the process more daunting,” said Ms. Jobst.

Take-Away

Globally it seems the CFA candidates are not able to prepare and pass at the rate that they had previously. This is likely troubling for all candidates as well as the CFA Institute. It should be particularly concerning for those who must pass to retain a position at their firm as they are particularly hard hit if they don’t succeed.


Of Importance to Finance Majors (or Related Field)

Each year Noble Capital Markets, Channelchek, and some very generous and caring sponsors hold the Channelchek College Equity Research Challenge.

The Challenge invites students to compete with one another for high cash prizes awarded to the student and the student’s school – plus more (see rules). It may also provide high-value networking opportunities with veteran equity analysts.

Who can compete?

You don’t have to be a finance, accounting, or major in a related field to understand that up to $7500 for you, and an additional $5,000 to your school can be quite helpful.  If you are fully matriculated and interested, you likely qualify.

We
invite you to learn more.


Sources:
https://www.cfainstitute.org/about/press-releases/2021/cfa-institute-reports-results-for-testing-in-july


Stay up to date. Follow us: