Does the Fed’s Digital Currency Report Indicate They’re Dropping the Ball?


Image Credit: Eric Steinhauer (Pexels)

The Federal Reserve Continues to Equivocate on Crypto


The Federal Reserve avoided taking a stance on whether the U.S. should establish a digital currency as legal tender in a report released Thursday (January 20).  It appears to avoid taking a solid position on crypto in general.  The long-awaited paper does, however provide insight into the agency’s thinking. It then stops short of expectations that the report may have established a timeline or roadmap for the U.S. to evolve its definition of money.

The 40-page paper that was promised to be delivered by late Summer 2021 begins with a discussion of existing forms of money, the current state of the U.S. payment system, and its relative strengths and challenges. It then provides information on the various digital assets that have emerged in recent years, including stablecoins and other cryptocurrencies. The paper then turns to central bank digital currencies (CBDC), focusing on its uses and functions; potential benefits and risks; and related policy considerations.

The Federal Reserve’s initial analysis suggests that a U.S. CBDC, if one were created,

would best serve the needs of the United States by being privacy-protected, intermediated, widely

transferable, and identity-verified. The paper expressly points out throughout that it is not intended to advance a specific policy outcome and takes no position on the ultimate desirability of a U.S. CBDC. The paper says its purpose is to foster conversation and public comment.  “The paper is not intended to advance any specific policy outcome, nor is it intended to signal that the Federal Reserve will make any imminent decisions about the appropriateness of issuing a U.S. CBDC,” the report read.


Source: Money and Payments: The U.S. Dollar in the Age of Digital Transformation, Federal Reserve


The Board of Governors of the Federal Reserve also indicated that it would not proceed with the issuance of a CBDC without clear support from the executive branch and from Congress, ideally in the form of a specific law authorizing the use. “The introduction of a CBDC would represent a highly significant innovation in American money, and with it, a range of risks and benefits,” the Fed said.

The report solicits stakeholders to provide feedback by answering 22 questions beginning on page 25 of the document

Some of the benefits of a CBDC that were noted in the paper include a safe and convenient form of central bank money as well as fast and inexpensive overseas payments.

As for the risks, the Fed views a central digital currency could create problems maintaining the stability of the financial system and the objectives of monetary policy.

For now, 87 countries are exploring their own CBDCs, and 14, including major economies like China and South Korea, are already in the pilot stage. Nine have already fully launched them. Earlier this month, Fed Chairman Powell spoke  and apologized for the long delay in providing this report. He suggested other monetary challenges were being prioritized ahead of digital currencies causing the delay.

Paul Hoffman

Managing Editor, Channelchek


Suggested Reading


Powell’s Apparent Shift on Digital Currency


Digital Currency Report from the Fed is Past Due


The First Cryptocurrency Exchange Hacked in 2022


Walmart’s Metaverse, NFT, and Crypto Plans


Sources

https://www.federalreserve.gov/publications/files/money-and-payments-20220120.pdf

https://www.therams.com/news/rams-place-punters-corey-bojorquez-johnny-hekker-on-reserve-covid-19-list


Stay up to date. Follow us:


The Cat Litter Solution to Reduced Greenhouse Gases


Image Credit: Darius Siwek

This Process of Removing Greenhouse Gases Could Have Two Great Benefits


David L. Chandler | MIT News Office

 

Methane is a far more potent greenhouse gas than carbon dioxide, and it has a pronounced effect within first two decades of its presence in the atmosphere. In the recent international climate negotiations in Glasgow, abatement of methane emissions was identified as a major priority in attempts to curb global climate change quickly.

A team of researchers at MIT have come up with a promising approach to controlling methane emissions and removing it from the air, using an inexpensive and abundant type of clay called zeolite. The findings are described in the journal ACS Environment Au, in a paper by doctoral student Rebecca Brenneis, Associate Professor Desiree Plata, and two others.

Although many people associate atmospheric methane with drilling and fracking for oil and natural gas, those sources only account for about 18 percent of global methane emissions, Plata says. The vast majority of emitted methane comes from such sources as slash-and-burn agriculture, dairy farming, coal and ore mining, wetlands, and melting permafrost. “A lot of the methane that comes into the atmosphere is from distributed and diffuse sources, so we started to think about how you could take that out of the atmosphere,” she says.

The answer the researchers found was something dirt cheap — in fact, a special kind of “dirt,” or clay. They used zeolite clays, a material so inexpensive that it is currently used to make cat litter. Treating the zeolite with a small amount of copper, the team found, makes the material very effective at absorbing methane from the air, even at extremely low concentrations.

The system is simple in concept, though much work remains on the engineering details. In their lab tests, tiny particles of the copper-enhanced zeolite material, similar to cat litter, were packed into a reaction tube, which was then heated from the outside as the stream of gas, with methane levels ranging from just 2 parts per million up to 2 percent concentration, flowed through the tube. That range covers everything that might exist in the atmosphere, down to subflammable levels that cannot be burned or flared directly.

The process has several advantages over other approaches to removing methane from air, Plata says. Other methods tend to use expensive catalysts such as platinum or palladium, require high temperatures of at least 600 degrees Celsius, and tend to require complex cycling between methane-rich and oxygen-rich streams, making the devices both more complicated and more risky, as methane and oxygen are highly combustible on their own and in combination.

“The 600 degrees where they run these reactors makes it almost dangerous to be around the methane,” as well as the pure oxygen, Brenneis says. “They’re solving the problem by just creating a situation where there’s going to be an explosion.” Other engineering complications also arise from the high operating temperatures. Unsurprisingly, such systems have not found much use.

As for the new process, “I think we’re still surprised at how well it works,” says Plata, who is the Gilbert W. Winslow Associate Professor of Civil and Environmental Engineering. The process seems to have its peak effectiveness at about 300 degrees Celsius, which requires far less energy for heating than other methane capture processes. It also can work at concentrations of methane lower than other methods can address, even small fractions of 1 percent, which most methods cannot remove, and does so in air rather than pure oxygen, a major advantage for real-world deployment.

The method converts the methane into carbon dioxide. That might sound like a bad thing, given the worldwide efforts to combat carbon dioxide emissions. “A lot of people hear ‘carbon dioxide’ and they panic; they say ‘that’s bad,’” Plata says. But she points out that carbon dioxide is much less impactful in the atmosphere than methane, which is about 80 times stronger as a greenhouse gas over the first 20 years, and about 25 times stronger for the first century. This effect arises from that fact that methane turns into carbon dioxide naturally over time in the atmosphere. By accelerating that process, this method would drastically reduce the near-term climate impact, she says. And, even converting half of the atmosphere’s methane to carbon dioxide would increase levels of the latter by less than 1 part per million (about 0.2 percent of today’s atmospheric carbon dioxide) while saving about 16 percent of total radiative warming.

The ideal location for such systems, the team concluded, would be in places where there is a relatively concentrated source of methane, such as dairy barns and coal mines. These sources already tend to have powerful air-handling systems in place, since a buildup of methane can be a fire, health, and explosion hazard. To surmount the outstanding engineering details, the team has just been awarded a $2 million grant from the U.S. Department of Energy to continue to develop specific equipment for methane removal in these types of locations.

“The key advantage of mining air is that we move a lot of it,” she says. “You have to pull fresh air in to enable miners to breathe, and to reduce explosion risks from enriched methane pockets. So, the volumes of air that are moved in mines are enormous.” The concentration of methane is too low to ignite, but it’s in the catalysts’ sweet spot, she says.

Adapting the technology to specific sites should be relatively straightforward. The lab setup the team used in their tests consisted of  “only a few components, and the technology you would put in a cow barn could be pretty simple as well,” Plata says. However, large volumes of gas do not flow that easily through clay, so the next phase of the research will focus on ways of structuring the clay material in a multiscale, hierarchical configuration that will aid air flow.

“We need new technologies for oxidizing methane at concentrations below those used in flares and thermal oxidizers,” says Rob Jackson, a professor of earth systems science at Stanford University, who was not involved in this work. “There isn’t a cost-effective technology today for oxidizing methane at concentrations below about 2,000 parts per million.”

Jackson adds, “Many questions remain for scaling this and all similar work: How quickly will the catalyst foul under field conditions? Can we get the required temperatures closer to ambient conditions? How scalable will such technologies be when processing large volumes of air?”

One potential major advantage of the new system is that the chemical process involved releases heat. By catalytically oxidizing the methane, in effect the process is a flame-free form of combustion. If the methane concentration is above 0.5 percent, the heat released is greater than the heat used to get the process started, and this heat could be used to generate electricity.

The team’s calculations show that “at coal mines, you could potentially generate enough heat to generate electricity at the power plant scale, which is remarkable because it means that the device could pay for itself,” Plata says. “Most air-capture solutions cost a lot of money and would never be profitable. Our technology may one day be a counterexample.”

Using the new grant money, she says, “over the next 18 months we’re aiming to demonstrate a proof of concept that this can work in the field,” where conditions can be more challenging than in the lab. Ultimately, they hope to be able to make devices that would be compatible with existing air-handling systems and could simply be an extra component added in place. “The coal mining application is meant to be at a stage that you could hand to a commercial builder or user three years from now,” Plata says.

In addition to Plata and Brenneis, the team included Yale University PhD student Eric Johnson and former MIT postdoc Wenbo Shi. The work was supported by the Gerstner Philanthropies, Vanguard Charitable Trust, the Betty Moore Inventor Fellows Program, and MIT’s Research Support Committee.


Suggested Reading:


ESG Indicators and How Investors Use Them


The Extreme Growth of ESG Has Bumps that Include Greenwashing


Do Mandatory Holidays Mean Less Freedom and Flexibility for Workers?


Lessons from How the Back of Inflation Finally Broke in 1982


Stay up to date. Follow us:


Why a Less Dovish Fed Doesnt Translate into a Hawkish Fed


Image Credit: Nigam Machchhar, (Pexels)

Facts About the Fed Being Hawkish


In my reading last week, I came across a number of articles suggesting the US Federal Reserve (The Fed) has done a 180-degree turn to a more “hawkish” stance. This would mean that they have become inflation fighters.  As a reformed “bond guy” that participated in the Treasury’s first TIPS auction, I can’t help but mourn for the old bond market, the one that seemed to trade largely on inflation expectations rather than on kitchen sink monetary resolve. Below discusses why the Fed may actually be more “Dovish” than ever before in history with inflation above 4%. The ramifications of this have implications for the US Stock and Bond markets going into the New Year.

With year-over-year U.S. inflation running at 6.8% (CPI-U) and the Fed inflation projection for 2022 at 2.6% to 2.7%, one would expect 30-year Treasuries to be yielding higher than the annual inflation rate. Instead, it’s running 500 basis points (bp) below the pace, and 50 bp below the FOMC’s seemingly optimistic projections. Does the bond market know something that undermines the most basic tenets of interest rate movement? Or, is something else impacting bond prices?

Source: https://home.treasury.gov/


Background

During the early summer of 2020, in response to pandemic-related stress on the economy, the Fed introduced yield curve control as one of their tools. The way this seldom-used tool works is the Fed enters the open market and buys bonds across a large period of the yield curve in order to prevent rates from rising above a pre-set level. In this way, if market demand would tend to let rates rise, the Fed is there to bid prices up (keep rates down). If bond prices (yields) of targeted maturities remain above the pre-set level, the central bank does nothing. The Fed, in this way, provides unlimited demand should bonds trade-off.

Additionally, the Fed has been implementing quantitative easing (QE) since March 2020.  The result is the Fed now holds $5.64 trillion in Treasuries out of the $22.3 trillion available U.S. Treasury debt.

Along with Treasuries the Fed also holds $2.63 trillion in government-guaranteed Mortgage-Backed Securities (MBS). These securities, which are also backed by the full faith and credit of the US, trade at a small spread to similar duration Treasuries.  

When QE got underway last year, the Fed purchased roughly $110 billion a month in MBS: $40 billion a month in new money and $70 billion to replace principal pay downs. Unlike other market participants, the Fed does not trade these securities, they get put away until they pay off. Investors need not worry if the extremely large buyer may decide to sell one day. They won’t.

Out of the $5.64 trillion of Treasuries held by the Fed, only $326 billion mature within a year. The remaining $5.31 trillion impact longer rates, in fact, $1.02 trillion mature in 5-10 years, and $1.34 trillion mature in over 10 years. With over two trillion in debt securities pulled from the five years or longer end of the market, it now holds long-dated Treasury debt equivalent to 10% of U.S. GDP.


Is
Tapering Tightening?

While the Fed now regularly addresses inflation in its comments and intentionally avoids the word “transitory” when referring to it, there is very little economic brake tapping being done from a monetary policy level. Instead, it continues to suppress rates by buying bonds. While the Fed is not dropping as much money into the bond markets as they had been to control yields, they are still purchasing massive amounts. Each month they are tapering their purchases by $20 billion. But still, last month the Fed took down $120 billion in government-backed bonds – $80 billion in Treasury debt and $40 billion in mortgage-backed securities. These are now securities the market doesn’t have to absorb, which keeps rates down, but it is also stimulative as these securities were purchased on the open market.  

Bond purchases are monetary policy tools used to ease rates and stimulate the economy; they are a tool used to tighten. The purchases repress rates along the entire curve and serve to reduce borrowing costs spread to Treasuries that would include everything from mortgage borrowing to junk bonds.

Take-Away

If the Fed has become an inflation fighter and is now hawkish, the stock market, particularly companies that rely on borrowing, have a lot to be concerned about. Interest rates across the entire curve have been held down for a long time. By historical measures, interest rates should be paying inflation plus a premium for uncertainty. A rapid return to historical norms would be devastating for stocks. More directly, it would be devastating for bonds.

The Federal Reserve Act mandates that the Fed conduct monetary policy “so as to promote effectively the goals of maximum employment, stable prices, and moderate long-term interest rates.” Allowing rates to seek their natural level any time soon would impact the markets, which is not mentioned as a mandate. However, “maximum employment” is one of the goals of monetary policy. Allowing the markets to sink would likely reduce employment greatly. With this, the Fed is likely to remain accommodative using all the tools necessary to maximize employment.

As long as rates are low, savers will need to search for ways to protect their money from inflation. This could keep the stock market on its upward trend.


Suggested Reading:


How Difficult Will it be for the Fed to Control Inflation?


Inflation Seems Persistent, What Now?


Yield Curve Control, Stock Prices, and Trust (June 2020)


The Fed is Clear that they Intend to Hold Rates Down


Sources:

https://www.newyorkfed.org/markets/domestic-market-operations/monetary-policy-implementation/treasury-securities/treasury-securities-operational-details

https://www.bls.gov/opub/ted/2021/consumer-prices-up-6-8-percent-for-year-ended-november-2021.htm

https://www.usinflationcalculator.com/inflation/current-inflation-rates/

https://www.sifma.org/resources/research/us-treasury-securities-statistics/

https://www.statista.com/topics/6441/quantitative-easing-in-the-us/#:~:text=The%20Federal%20Reserve%20announced%20on,as%20quantitative%20easing%20(QE)


Stay up to date. Follow us:


Why a Less Dovish Fed Doesn’t Translate into a Hawkish Fed


Image Credit: Nigam Machchhar, (Pexels)

Facts About the Fed Being Hawkish


In my reading last week, I came across a number of articles suggesting the US Federal Reserve (The Fed) has done a 180-degree turn to a more “hawkish” stance. This would mean that they have become inflation fighters.  As a reformed “bond guy” that participated in the Treasury’s first TIPS auction, I can’t help but mourn for the old bond market, the one that seemed to trade largely on inflation expectations rather than on kitchen sink monetary resolve. Below discusses why the Fed may actually be more “Dovish” than ever before in history with inflation above 4%. The ramifications of this have implications for the US Stock and Bond markets going into the New Year.

With year-over-year U.S. inflation running at 6.8% (CPI-U) and the Fed inflation projection for 2022 at 2.6% to 2.7%, one would expect 30-year Treasuries to be yielding higher than the annual inflation rate. Instead, it’s running 500 basis points (bp) below the pace, and 50 bp below the FOMC’s seemingly optimistic projections. Does the bond market know something that undermines the most basic tenets of interest rate movement? Or, is something else impacting bond prices?

Source: https://home.treasury.gov/


Background

During the early summer of 2020, in response to pandemic-related stress on the economy, the Fed introduced yield curve control as one of their tools. The way this seldom-used tool works is the Fed enters the open market and buys bonds across a large period of the yield curve in order to prevent rates from rising above a pre-set level. In this way, if market demand would tend to let rates rise, the Fed is there to bid prices up (keep rates down). If bond prices (yields) of targeted maturities remain above the pre-set level, the central bank does nothing. The Fed, in this way, provides unlimited demand should bonds trade-off.

Additionally, the Fed has been implementing quantitative easing (QE) since March 2020.  The result is the Fed now holds $5.64 trillion in Treasuries out of the $22.3 trillion available U.S. Treasury debt.

Along with Treasuries the Fed also holds $2.63 trillion in government-guaranteed Mortgage-Backed Securities (MBS). These securities, which are also backed by the full faith and credit of the US, trade at a small spread to similar duration Treasuries.  

When QE got underway last year, the Fed purchased roughly $110 billion a month in MBS: $40 billion a month in new money and $70 billion to replace principal pay downs. Unlike other market participants, the Fed does not trade these securities, they get put away until they pay off. Investors need not worry if the extremely large buyer may decide to sell one day. They won’t.

Out of the $5.64 trillion of Treasuries held by the Fed, only $326 billion mature within a year. The remaining $5.31 trillion impact longer rates, in fact, $1.02 trillion mature in 5-10 years, and $1.34 trillion mature in over 10 years. With over two trillion in debt securities pulled from the five years or longer end of the market, it now holds long-dated Treasury debt equivalent to 10% of U.S. GDP.


Is
Tapering Tightening?

While the Fed now regularly addresses inflation in its comments and intentionally avoids the word “transitory” when referring to it, there is very little economic brake tapping being done from a monetary policy level. Instead, it continues to suppress rates by buying bonds. While the Fed is not dropping as much money into the bond markets as they had been to control yields, they are still purchasing massive amounts. Each month they are tapering their purchases by $20 billion. But still, last month the Fed took down $120 billion in government-backed bonds – $80 billion in Treasury debt and $40 billion in mortgage-backed securities. These are now securities the market doesn’t have to absorb, which keeps rates down, but it is also stimulative as these securities were purchased on the open market.  

Bond purchases are monetary policy tools used to ease rates and stimulate the economy; they are a tool used to tighten. The purchases repress rates along the entire curve and serve to reduce borrowing costs spread to Treasuries that would include everything from mortgage borrowing to junk bonds.

Take-Away

If the Fed has become an inflation fighter and is now hawkish, the stock market, particularly companies that rely on borrowing, have a lot to be concerned about. Interest rates across the entire curve have been held down for a long time. By historical measures, interest rates should be paying inflation plus a premium for uncertainty. A rapid return to historical norms would be devastating for stocks. More directly, it would be devastating for bonds.

The Federal Reserve Act mandates that the Fed conduct monetary policy “so as to promote effectively the goals of maximum employment, stable prices, and moderate long-term interest rates.” Allowing rates to seek their natural level any time soon would impact the markets, which is not mentioned as a mandate. However, “maximum employment” is one of the goals of monetary policy. Allowing the markets to sink would likely reduce employment greatly. With this, the Fed is likely to remain accommodative using all the tools necessary to maximize employment.

As long as rates are low, savers will need to search for ways to protect their money from inflation. This could keep the stock market on its upward trend.


Suggested Reading:


How Difficult Will it be for the Fed to Control Inflation?


Inflation Seems Persistent, What Now?


Yield Curve Control, Stock Prices, and Trust (June 2020)


The Fed is Clear that they Intend to Hold Rates Down


Sources:

https://www.newyorkfed.org/markets/domestic-market-operations/monetary-policy-implementation/treasury-securities/treasury-securities-operational-details

https://www.bls.gov/opub/ted/2021/consumer-prices-up-6-8-percent-for-year-ended-november-2021.htm

https://www.usinflationcalculator.com/inflation/current-inflation-rates/

https://www.sifma.org/resources/research/us-treasury-securities-statistics/

https://www.statista.com/topics/6441/quantitative-easing-in-the-us/#:~:text=The%20Federal%20Reserve%20announced%20on,as%20quantitative%20easing%20(QE)


Stay up to date. Follow us:


Tapering and What you Need to Know


Image Credit: Rafael Saldana (Flickr)

What is the Fed Taper? An Economist Explains How the Fed Withdraws Stimulus


Tapering refers to the Federal Reserve policy of unwinding the massive purchases of Treasury bonds and mortgage-backed securities it’s been making to shore up the economy during the pandemic. The unconventional monetary policy of buying assets is commonly known as quantitative easing. The Fed first adopted this policy during the 2008 financial crisis.

Normally, when a central bank wants to reduce the cost of borrowing for companies and consumers, it lowers its target short-term interest rate. But with its target rate at zero during the 2008 crisis – at the same time that there was no inflation and the economy was still hurting – the Fed was no longer able to cut rates further. And so the Fed turned to quantitative easing as a way to continue to reduce borrowing costs. When the government buys assets, their prices go up, which lowers their yield or interest rate.

The Fed again adopted this policy in March 2020 after the COVID-19 pandemic resulted in a national lockdown. By November 2021, the Fed had bought over US$4 trillion worth of Treasuries and other securities.

The U.S. central bank began tapering in November 2021, scaling back total purchases by $15 billion a month, from $120 billion to $105 billion. The Fed decided to double the pace at which it tapers on Dec. 15. Rather than $15 billion, the Fed will reduce purchases by $30 billion every month. At that pace it will no longer be purchasing new assets by early 2022.


Why it Matters

Growing concerns among economists that rising inflation could harm the economy are likely a big part of what led the Fed to begin tapering.

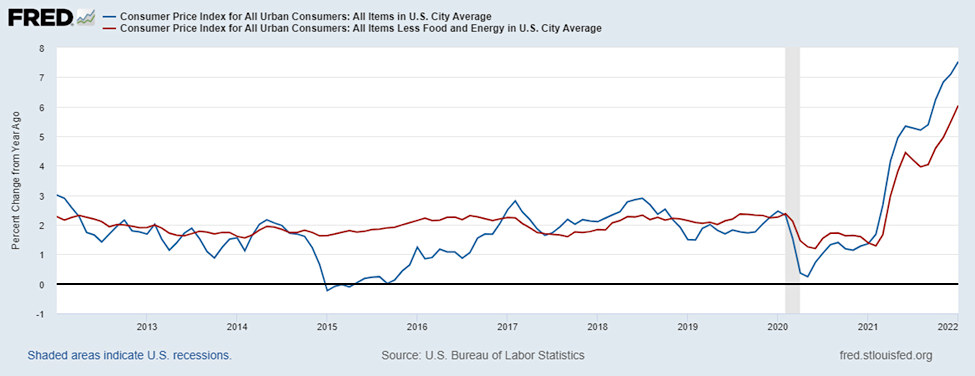
Inflation is the rate of change in the price of goods and services. The Consumer Price Index, which includes several categories of everyday items that a typical American might buy, is the measure of inflation most often reported in the media. In November 2021, it was up 6.8% from a year earlier.

By any measure, inflation is above the Fed’s target of 2%. By tapering asset purchases, the Fed may help reduce inflation – or at least slow its rise – because it is withdrawing some of the monetary stimulus that is fueling economic growth.

The reason the Fed has decided to accelerate the process is likely because it now believes inflation may be less transitory than it had hoped, at the same time that the labor market appears strong.


What this Means for You

Americans have enjoyed rock-bottom interest rates for the better part of the past 13 years, helping to make it cheaper to borrow money to buy cars and homes and start businesses.

Consumers and companies are already beginning to see slightly higher rates on mortgages, business loans and other types of borrowing.

In other words, the era of cheap money may finally be coming to an end. Enjoy it while it lasts.


This article was republished with permission from   The Conversation, a news site dedicated to sharing ideas from academic experts. It represents the research-based findings and thoughts of 
Edouard Wemy Assistant Professor of Economics, Clark University


Suggested Reading:


Inflation Seems Persistent, What Now?


Deflation Not Inflation is Risk Says Cathie Wood


Investing in U.S. Maritime Infrastructure Spending


The Detrimental Impact of Fed Policy on Savers


Stay up to date. Follow us:


Elon Musk Talks About Tesla Bots, Birth Rates, and Federal Incentives


Tesla’s CEO Surprises Reporters with Views on Robots, Subsidies, and Longevity


The Wall Street Journal CEO Summit is billed as an opportunity for CEOs to exchange best practices along with honest and candid insight. Elon Musk, who spoke Monday at the summit, had previously been sharing his thoughts on Twitter leading up to the event, at times his talk surprised reporters and peers. Among his concerns for the future are low birth rates, longevity, and excessive EV subsidies.


Robots and Birthrates

The forward-looking Tesla CEO was giving an update on the Tesla Bot project and issued this dire warning, “If people don’t start to have more children, civilization is going to crumble. Mark my words,” Musk said. Within the context of the current labor shortage, Musk believes the Tesla Bot could be a solution. “It has the potential to be a general substitute for human labor over time. The foundation of the economy is labor. Capital equipment is essentially distilled labor. I asked a friend of mine what should we optimize for, and he said, “gross profit per employee” – fully considered so you’ve got to include the supply chain in that,” said Musk. He was also candid about their robotics saying that he doesn’t know when they will get the Bot trouble-free, but building a useful humanoid robot is already a Tesla division they are hiring for.

Musk who is the father of six children said, “I think one of the biggest risks to civilization is the low birth rate and the rapidly declining birthrate.”


Longevity

At the Summit Elon Musk also shared his thoughts on humans living much longer and some older workers. He said he doesn’t think people should “try to live for a super long time.” This idea is more important to him when it comes to semi-immortality, and those that make their living in politics. “I think it is important for us to die because most of the time, people don’t change their mind, they just die. If they live forever, then we might become a very ossified society where new ideas cannot succeed,” Musk said.

In recent Tweets, Musk has been vocal about age caps for holding public national office positions.


“I’m not poking fun at aging. I just am saying if we’ve got people in very important positions that have to make decisions that are critical to the security of the country, then they need to have sufficient presence of mind and cognitive ability to make those decisions well — because the whole country is depending on them,” Musk said Monday.

Spending Bill and EV Subsidies

About two-thirds of all battery-electric vehicles in the U.S. are Teslas. Over the past two years, these sales have been without the $7,500 federal tax credit. New tax federal tax credits can be as high as $12,500 on some cars. Musk said the Senate should not pass the $2 trillion Build Back Better Act. It removes the limit of 200,000 EV deliveries per manufacturer and increases the incentives but that only applies if the electric vehicles are coming from US factories that are unionized. During his response, his concerns seemed more about the high federal expenditures than anything specifically related to the treatment of his car company versus the treatment of others. “Honestly, it might be better if the bill doesn’t pass. We’ve spent so much money, the federal budget deficit is insane. It’s like $3 trillion. Federal expenditures are $7 trillion. Federal revenues are $3 trillion. If it was a company, it would be a $3 trillion dollar loss. I don’t know we should be adding to that loss. Somethings gotta give. You can’t just spend $3 trillion more than you own every year and don’t expect something bad to happen,” Musk said.


Take-Away

One doesn’t become a self-made billionaire and then achieve richest person-in-the-world status by thinking like everyone else. Open forums of thought like the Wall Street Journal CEO Summit help, and even short Tweets help better understand the mindsets of those in positions that are helping to shape tomorrow’s world.


Paul Hoffman

Managing Editor, Channelchek


Suggested Reading:


The Gas Tax’s History Shows How Hard it is to Fund Infrastructure Spending


With Ford’s Electric F-150 Pickup, the EV Transition Shifts into High Gear


Will Uranium, Natural Gas, and Coal be Severely Impacted by EU Taxonomy


ESG Investors May Have Missed What’s Happening with Green Chemical Companies


Sources:

https://ceocouncil.wsj.com/videos/

https://youtu.be/lSD_vpfikbE

https://www.yahoo.com/news/elon-musk-says-not-enough-070626755.html

Twitter
Link


Stay up to date. Follow us:


Can the Fed Stop Inflation?


Image Crediit: Rick (flickr)

How Difficult Will it be for the Fed to Control Inflation?


The financial markets have a paradigm shift to contend with. This includes stocks, bonds, commodities, and cryptocurrency. For decades, the U.S. Central Bank was concerned with managing to avoid a deflationary spiral, any inflationary risk was minimal. The tide has turned, and those nominated and presumed to be filling the top two spots at the Fed now list inflation fighting as a priority.

Inflation’s
Impact on Market Moves

Generally speaking, in order for an investor to want to be involved in a stock or other investment it’s in part because they expect the outcome will place them even with or ahead of future price growth. Even at the most conservative end of the investment spectrum, U.S. Treasuries, and bank overnight lending rates, those involved demanded returns higher than the future expected level of inflation. When deflation was the expectation, rates below the recent inflation reports were accepted and had little difficulty attracting capital.

Yield/Inflation
Comparison

The chart below covers November 1976 through September 2021. It compares the inflation rate with overnight Fed Funds. The inflation measure used here is the conservative Trimmed PCE Inflation
Rate
, which includes personal consumption expenditures (PCE) and only half the food and energy component (trimmed). This is typically lower than the consumer price index, which measures a basket of goods rather than what is actually consumed during the period. The trimmed PCE Inflation rate takes into account that people can substitute goods if one price goes up. The second line in the chart is the base overnight lending rate that banks charge each other to close out each day with the required reserves. This level is typically the lowest data point on the entire yield curve.


Even in this most conservative comparison, we see that the Fed Funds rate (green line) trades well above the inflation rate (red line). For this 45 year period, inflation averaged 3%, while the overnight interest rate averaged 4.72%. This is 58% higher. Fed funds is not a rate set by the market, it’s orchestrated through the Fed’s monetary policy. Currently, the Fed’s targeted rate is 0.00%-0.25%.  The most recent Trimmed PCE number is from September at 5.08% (the last point on chart).

Even at the high end of today’s overnight target (0.25%), inflation averaged 4.83% above Fed Funds. So while overnight interest rates have been historically 58% higher, currently, inflation is 2083% higher.

To stay within historic norms the Fed Funds target would be 7.75%-8.00%.

Plight of
the Fed

Outside of the U.S., countries are experiencing a resurgence of Covid-19. Some are responding with lockdowns and other steps that are sure to lower economic output and consumption. The U.S. has not experienced this yet, but the possibility looms over economic activity and projections for the future. The economy is not at full employment and is considered too frail for the Fed to start tapping the economic brakes. However, with inflation’s high potential to linger or grow, the Fed shouldn’t be tapping the brakes, they should be jumping on them. This, of course, presumes that reeling in inflation is among their top priorities, as they have stated.

Plight of
the Treasury

The coming month of December will bring with it a lot of give-and-take between the two parties in Congress and the U.S. Secretary of the Treasury Janet Yellen. The problem is the United States is expected to run out of cash by mid-December. Without cash, it can’t pay its bills, it can’t pay employees, and won’t be able to retain reserve currency status. It would probably even suffer a severe drop in its credit rating if it defaulted on its debts.

This debt ceiling struggle has happened before; negotiations to raise the debt ceiling are common each year. This year is a bit different because, with the advent of the pandemic, Congress voted to suspend the debt ceiling until August 1, 2021. At that time, it was reinstated to $28.5 trillion. At its most basic, it allows the U.S. Treasury to go deeper in debt. While the wrestling match will go on before passing, either a stop-gap measure or a new ceiling could cause volatility in the markets.

Another concern is the cost of the debt. Congress could pass a debt ceiling limit that impacts the amount borrowed, but the amount paid back is impacted by prevailing interest rates when issued. Should, for example, rates rise to their more historical norm of 1.75% the rate of expected inflation, the cost of servicing new debt could increase to 20 times what it is now.

Take-Away

For decades investors were unconcerned about inflation or the erosive impact on spending power. Interest rates were brought down to help prop up an economy that had been challenged at times during these years. Because inflation was low, the Fed had room to do this. The mindset of investors should begin to include inflation and the Fed using tools to fight inflation. There will be a different impact on the various asset classes; for instance, stocks are considered a good hedge against inflation, bonds prices go down as rates tick up naturally or through Fed policy implementation.

The paradigm shift toward a Fed fighting inflation will take some more time to adopt than others. What is important to note in the tricky balance all of the policy-makers are contending with. There probably won’t be abrupt or surprising moves as policy adjusts.


Paul Hoffman

Managing Editor, Channelchek


Suggested Reading:


The Last Time Inflation Was This High Fed Funds Were 14.5%


The Detrimental Impact of Fed Policy on Savers


Will Small Cap Stocks Outperform in 2022?


Does Insider Selling Indicate Bearishness on the Company


Sources:

https://home.treasury.gov/policy-issues/financial-markets-financial-institutions-and-fiscal-service/debt-limit

https://home.treasury.gov/system/files/136/Debt-Limit-Letter-to-Congress_20211119.pdf

https://www.cbo.gov/publication/57371


Stay up to date. Follow us:


The Detrimental Impact of Fed Policy on Savers


Image Credit: Federal Reserve (Flickr)

Since 2008, Monetary Policy Has Cost American Savers about $4 Trillion


Interest rates naturally move in the direction of the measured or expected inflation rate, plus an additional “real rate” of return to compensate for other risks. The below article was written by Alex J. Pollock, a former Deputy Director at the U.S. Treasury, and former President and CEO of the Federal Home Loan Bank of Chicago. He argues the negative real returns orchestrated by the Federal Reserve Bank since 2008 have been costly to savers and investors, he asks they be reviewed by Congress semi-annually at the scheduled Fed Monetary Policy Report.

Should his thinking become more widespread, it could have significant impact on how a future Fed would conduct interest rate policy.  – Paul Hoffman, Channelchek


By Alex J. Pollock

With inflation running at over 6 percent and interest rates on savings near zero, the Federal Reserve is delivering a negative 6 percent real (inflation-adjusted) return on trillions of dollars in savings. This is effectively expropriating American savers’ nest eggs at the rate of 6 percent a year. It is not only a problem in 2021, however, but an ongoing monetary policy problem of long standing. The Fed has been delivering negative real returns on savings for more than a decade. It should be discussing with the legislature what it thinks about this outcome and its impacts on savers.

The effects of central bank monetary actions pervade society and transfer wealth among various groups of people—a political action. Monetary policies can cause consumer price inflations, like we now have, and asset price inflations, like those we have in equities, bonds, houses, and cryptocurrencies. They can feed bubbles, which turn into busts. They can by negative real yields push savers into equities, junk bonds, houses, and cryptocurrencies, temporarily inflating prices further while substantially increasing risk. They can take money away from conservative savers to subsidize leveraged speculators, thus encouraging speculation. They can transfer wealth from the people to the government by the inflation tax. They can punish thrift, prudence, and self-reliance.

Savings are essential to long-term economic progress and to personal and family financial well-being and responsibility. However, the Federal Reserve’s policies, and those of the government in general, have subsidized and emphasized the expansion of debt, and unfortunately appear to have forgotten savings. The original theorists of the savings and loan movement, to their credit, were clear that first you had “savings,” to make possible the “loans.” Our current unbalanced policy could be described, instead of “savings and loans,” as “loans and loans.”

As one immediate step, Congress should require the Federal Reserve to provide a formal savers impact analysis as a regular part of its Humphrey-Hawkins reports on monetary policy and targets. This savers impact analysis should quantify, discuss, and project for the future the effects of the Fed’s policies on savings and savers, so that these effects can be explicitly and fairly considered along with the other relevant factors. The critical questions include: What impact is Fed monetary policy having on savers? Who is affected? How will the Fed’s plans for monetary policy affect savings and savers going forward?

Consumer price inflation year over year as of October 2021 is running, as we are painfully aware, at 6.2 percent. For the ten months of 2021 year-to-date, the pace is even worse than that—an annualized inflation rate of 7.5 percent.

Facing that inflation, what yields are savers of all kinds, but notably including retired people and savers of modest means, getting on their savings? Basically nothing. According to the Federal Deposit Insurance Corporation’s October 18, 2021, national interest rate report, the national average interest rate on savings account was a trivial 0.06 percent. On money market deposit accounts, it was 0.08 percent; on three-month certificates of deposit, 0.06 percent; on six-month CDs, 0.09 percent; on six-month Treasury bills, 0.05 percent; and if you committed your money out to five years, a majestic CD rate of 0.27 percent. 

I estimate, as shown in the table below, that monetary policy since 2008 has cost American savers about $4 trillion. The table assumes savers can invest in six-month Treasury bills, then subtracts from their average interest rate the matching inflation rate, giving the real interest rate to the savers. This is on average quite negative for these years. I calculate the amount of savings effectively expropriated by negative real rates. Then I compare the actual real interest rates to an estimate of the normal real interest rate for each year, based on the fifty-year average of real rates from 1958 to 2007. This gives us the gap the Federal Reserve has created between the actual real rates over the years since 2008 and what would have been historically normal rates. This gap is multiplied by household savings, which shows us by arithmetic the total gap in dollars.


To repeat the answer: a $4 trillion hit to savers.

The Federal Reserve through a regular savers impact analysis should be having substantive discussions with Congress about how its monetary policy is affecting savings, what the resulting real returns to savers are, who the resulting winners and losers are, what the alternatives are, and how its plans will impact savers going forward.

After thirteen years with on average negative real returns to conservative savings, it is time to require the Federal Reserve to address its impact on savers.


About the Author:

Alex J. Pollock is a Senior Fellow at the Mises Institute. Previously he served as the Principal Deputy Director of the Office of Financial Research in the U.S. Treasury Department (2019-2021), Distinguished Senior Fellow at the R Street Institute (2015-2019 and 2021), Resident Fellow at the American Enterprise Institute (2004-2015), and President and CEO, Federal Home Loan Bank of Chicago (1991-2004). He is the author of Finance and Philosophy—Why We’re
Always Surprised
 (2018) and Boom and Bust: Financial Cycles
and Human Prosperity
 (2011), as well as numerous articles and Congressional testimony. Pollock is a graduate of Williams College, the University of Chicago, and Princeton University.


Suggested Reading:


What Infrastructure Law Does for Investors


Money Supply is Like Caffeine for Stocks


Winners and Losers with Low Interest Rates


Was the Inflation of 1982 Like Today’s?


The above article was written by Alex J. Pollock and republished with permission by Channelchek.  The ideas and opinions stated in the article are those of Mr. Pollock’s and do not necessarily reflect the ideas and opinions of Channelchek.  The republication of this article is not intended to be used as investment advice.  Please refer to the full Channelchek Disclosures & Disclaimers in the footer for more information.


Source:

https://mises.org/wire/2008-monetary-policy-has-cost-american-savers-about-4-trillion


Stay up to date. Follow us:


Was the Inflation of 1982 Like Todays?


Image: President Reagan addresses the nation, July 1981 (Public Domain)

Lessons from How the Back of Inflation Finally Broke in 1982


by Tim Sablik – Federal Reserve Bank of Richmond

Prior to the 2007-09 recession, the 1981-82 recession was the worst economic downturn in the United States since the Great Depression. Indeed, the nearly 11 percent unemployment rate reached late in 1982 remains the apex of the post-World War II era (Federal Reserve Bank of St. Louis). Unemployment during the 1981-82 recession was widespread, but manufacturing, construction, and the auto industries were particularly affected. Although goods producers accounted for only 30 percent of total employment at the time, they suffered 90 percent of job losses in 1982. Three-fourths of all job losses in the goods-producing sector were in manufacturing, and the residential construction industry and auto manufacturers ended the year with 22 percent and 24 percent unemployment, respectively (Urquhart and Hewson 1983, 4-7).


The economy was already in weak shape coming into the downturn, as a recession in 1980 had left unemployment at about 7.5 percent. Both the 1980 and 1981-82 recessions were triggered by tight monetary policy in an effort to fight mounting inflation. During the 1960s and 1970s, economists and policymakers believed that they could lower unemployment through higher inflation, a tradeoff known as the Phillips Curve. In the 1970s, the Fed pursued what economists would call “stop-go” monetary policy, which alternated between fighting high unemployment and high inflation. During the “go” periods, the Fed lowered interest rates to loosen the money supply and target lower unemployment. During the “stop” periods, when inflation mounted, the Fed would raise interest rates to reduce inflationary pressure. However, the Phillips Curve tradeoff proved unstable in the long-run, as inflation and unemployment increased together in the mid-1970s. While unemployment trended down slightly by the end of the decade, inflation continued to rise, reaching 11 percent in June 1979 (Federal Reserve Bank of St. Louis).


Paul Volcker was appointed chairman of the Fed in August 1979 in large part because of his anti-inflation views. He had previously served as president of the New York Fed and had dissented from Fed policies he regarded as contributing to inflation expectations. He felt strongly that mounting inflation should be the primary concern for the Fed: “In terms of economic stability in the future, [inflation] is what is likely to give us the most problems and create the biggest recession” (FOMC transcript 1979, 16). He also believed that the Fed faced a credibility problem when it came to keeping inflation in check. During the previous decade, the Fed had demonstrated that it did not place much emphasis on maintaining low inflation, and public expectation of such continued behavior would make it increasingly difficult for the Fed to bring inflation down. “[F]ailure to carry through now in the fight on inflation will only make any subsequent effort more difficult,” he remarked (Volcker 1981b).


Chairman of the Federal Reserve Board of Governors Paul Volcker holds his head in his hand at a meeting in Washington, D.C.(Photo: Bettmann/Bettmann/Getty Images)


Volcker shifted Fed policy to aggressively target the money supply rather than interest rates. He took this approach for two reasons. First, mounting inflation made it difficult to know which interest rates targets were appropriately tight. While the nominal rates the Fed targeted could be quite high, the real interest rates (that is, the effective interest rates after adjusting for inflation) could still be quite low due to the expectation of inflation. Second, the new policy was meant to signal to the public that the Fed was serious about low inflation. The expectation of low inflation was important, as current inflation is driven in part by expectations of future inflation.


Volcker’s first attempt to lower inflation and inflationary expectations proved insufficient. The credit-control program initiated in March 1980 by the Carter administration precipitated a sharp recession (Schreft 1990). As unemployment mounted, the Fed eased up, an action reminiscent of the “stop-go” policies the public had come to expect. In late 1980 and early 1981, the Fed once again tightened the money supply, allowing the federal funds rate to approach 20 percent. Despite this, long-run interest rates continued to rise. The ten-year Treasury bond rate increased from about 11 percent in October 1980 to more than 15 percent a year later, possibly because the market believed the Fed would back down from its tight policy when unemployment rose (Goodfriend and King 2005). This time, however, Volcker was adamant that the Fed not back down: “We have set our course to restrain growth in money and credit. We mean to stick with it” (Volcker 1981a).


The economy officially entered a recession in the third quarter of 1981, as high interest rates put pressure on sectors of the economy reliant on borrowing, like manufacturing and construction. Unemployment grew from 7.4 percent at the start of the recession to nearly 10 percent a year later. As the recession worsened, Volcker faced repeated calls from Congress to loosen monetary policy, but he maintained that failing to bring down long-run inflation expectations now would result in “more serious economic circumstances over a much longer period of time” (Monetary Policy Report 1982, 67).


Ultimately, this persistence paid off. By October 1982, inflation had fallen to 5 percent and long-run interest rates began to decline. The Fed allowed the federal funds rate to fall back to 9 percent, and unemployment declined quickly from the peak of nearly 11 percent at the end to 1982 to 8 percent one year later (Federal Reserve Bank of St. Louis; Goodfriend and King 2005). The threat of inflation was not completely gone, as the Fed would face a number of “inflation scares” throughout the 1980s. However, the commitment of Volcker and his successors to aggressively targeting price stability helped ensure that the double-digit inflation of the 1970s would not return.


Suggested Reading:


CPI and PPI Both Suggests Persistent Inflation


Why the Most Conservative Investors Could Help Small Stock Performance


Sources:

https://www.federalreservehistory.org/essays/recession-of-1981-82


Stay up to date. Follow us:


Was the Inflation of 1982 Like Today’s?


Image: President Reagan addresses the nation, July 1981 (Public Domain)

Lessons from How the Back of Inflation Finally Broke in 1982


by Tim Sablik – Federal Reserve Bank of Richmond

Prior to the 2007-09 recession, the 1981-82 recession was the worst economic downturn in the United States since the Great Depression. Indeed, the nearly 11 percent unemployment rate reached late in 1982 remains the apex of the post-World War II era (Federal Reserve Bank of St. Louis). Unemployment during the 1981-82 recession was widespread, but manufacturing, construction, and the auto industries were particularly affected. Although goods producers accounted for only 30 percent of total employment at the time, they suffered 90 percent of job losses in 1982. Three-fourths of all job losses in the goods-producing sector were in manufacturing, and the residential construction industry and auto manufacturers ended the year with 22 percent and 24 percent unemployment, respectively (Urquhart and Hewson 1983, 4-7).


The economy was already in weak shape coming into the downturn, as a recession in 1980 had left unemployment at about 7.5 percent. Both the 1980 and 1981-82 recessions were triggered by tight monetary policy in an effort to fight mounting inflation. During the 1960s and 1970s, economists and policymakers believed that they could lower unemployment through higher inflation, a tradeoff known as the Phillips Curve. In the 1970s, the Fed pursued what economists would call “stop-go” monetary policy, which alternated between fighting high unemployment and high inflation. During the “go” periods, the Fed lowered interest rates to loosen the money supply and target lower unemployment. During the “stop” periods, when inflation mounted, the Fed would raise interest rates to reduce inflationary pressure. However, the Phillips Curve tradeoff proved unstable in the long-run, as inflation and unemployment increased together in the mid-1970s. While unemployment trended down slightly by the end of the decade, inflation continued to rise, reaching 11 percent in June 1979 (Federal Reserve Bank of St. Louis).


Paul Volcker was appointed chairman of the Fed in August 1979 in large part because of his anti-inflation views. He had previously served as president of the New York Fed and had dissented from Fed policies he regarded as contributing to inflation expectations. He felt strongly that mounting inflation should be the primary concern for the Fed: “In terms of economic stability in the future, [inflation] is what is likely to give us the most problems and create the biggest recession” (FOMC transcript 1979, 16). He also believed that the Fed faced a credibility problem when it came to keeping inflation in check. During the previous decade, the Fed had demonstrated that it did not place much emphasis on maintaining low inflation, and public expectation of such continued behavior would make it increasingly difficult for the Fed to bring inflation down. “[F]ailure to carry through now in the fight on inflation will only make any subsequent effort more difficult,” he remarked (Volcker 1981b).


Chairman of the Federal Reserve Board of Governors Paul Volcker holds his head in his hand at a meeting in Washington, D.C.(Photo: Bettmann/Bettmann/Getty Images)


Volcker shifted Fed policy to aggressively target the money supply rather than interest rates. He took this approach for two reasons. First, mounting inflation made it difficult to know which interest rates targets were appropriately tight. While the nominal rates the Fed targeted could be quite high, the real interest rates (that is, the effective interest rates after adjusting for inflation) could still be quite low due to the expectation of inflation. Second, the new policy was meant to signal to the public that the Fed was serious about low inflation. The expectation of low inflation was important, as current inflation is driven in part by expectations of future inflation.


Volcker’s first attempt to lower inflation and inflationary expectations proved insufficient. The credit-control program initiated in March 1980 by the Carter administration precipitated a sharp recession (Schreft 1990). As unemployment mounted, the Fed eased up, an action reminiscent of the “stop-go” policies the public had come to expect. In late 1980 and early 1981, the Fed once again tightened the money supply, allowing the federal funds rate to approach 20 percent. Despite this, long-run interest rates continued to rise. The ten-year Treasury bond rate increased from about 11 percent in October 1980 to more than 15 percent a year later, possibly because the market believed the Fed would back down from its tight policy when unemployment rose (Goodfriend and King 2005). This time, however, Volcker was adamant that the Fed not back down: “We have set our course to restrain growth in money and credit. We mean to stick with it” (Volcker 1981a).


The economy officially entered a recession in the third quarter of 1981, as high interest rates put pressure on sectors of the economy reliant on borrowing, like manufacturing and construction. Unemployment grew from 7.4 percent at the start of the recession to nearly 10 percent a year later. As the recession worsened, Volcker faced repeated calls from Congress to loosen monetary policy, but he maintained that failing to bring down long-run inflation expectations now would result in “more serious economic circumstances over a much longer period of time” (Monetary Policy Report 1982, 67).


Ultimately, this persistence paid off. By October 1982, inflation had fallen to 5 percent and long-run interest rates began to decline. The Fed allowed the federal funds rate to fall back to 9 percent, and unemployment declined quickly from the peak of nearly 11 percent at the end to 1982 to 8 percent one year later (Federal Reserve Bank of St. Louis; Goodfriend and King 2005). The threat of inflation was not completely gone, as the Fed would face a number of “inflation scares” throughout the 1980s. However, the commitment of Volcker and his successors to aggressively targeting price stability helped ensure that the double-digit inflation of the 1970s would not return.


Suggested Reading:


CPI and PPI Both Suggests Persistent Inflation


Why the Most Conservative Investors Could Help Small Stock Performance


Sources:

https://www.federalreservehistory.org/essays/recession-of-1981-82


Stay up to date. Follow us:


CPI and PPI Both Suggests Persistent Inflation


The Last Time Inflation Was This High Fed Funds Were 14.5%


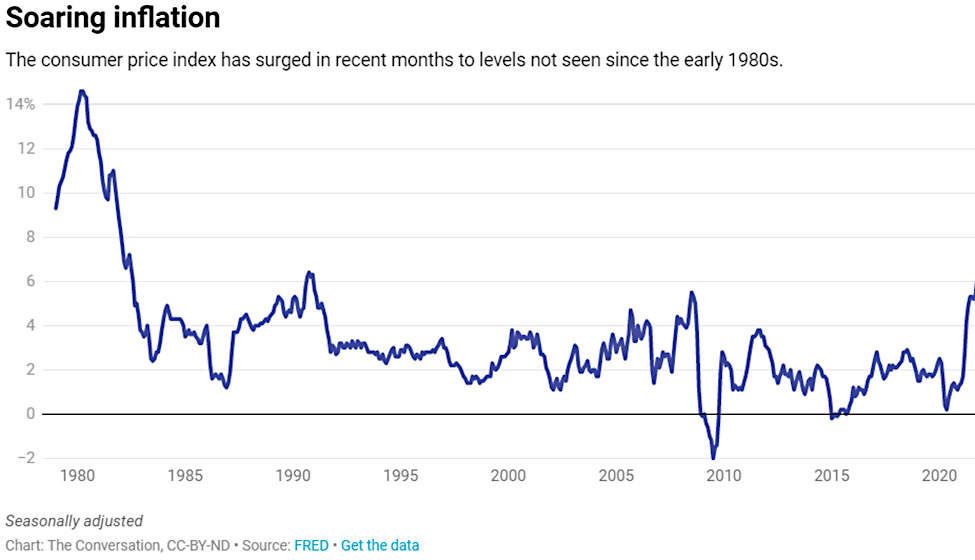
The year-over-year inflation rate ending October, as measured by CPI-U, is 6.2%. During the month of October alone, prices rose nearly 1% (0.9%). This is the largest increase since July 1982. And yesterday’s PPI report suggests consumer inflation may be persistent. The question now is, will Fed Chairman Powell continue extending the length of time in his definition of “transitory,” and will the Fed move quicker than initially presented to pull in the price pressures that continue to surprise on the high side?

October CPI Data

  • October Consumer Price Index (CPI-U): +0.9% vs. +0.5% consensus and +0.4% prior.
  • +6.2% YOY vs. +5.8% consensus and +5.4% prior.
  • Core CPI:
     +0.6% vs. +0.4% consensus and +0.2% prior.
  • +4.6% YoY vs. +4.3% consensus and +4.0% prior.
  • The increases are broad-based, with continued increases in energy, shelter, food, used cars, and new vehicles.

By itself, the rampant rise in prices does not necessarily argue against Chairman Powell’s expectations that what the U.S. is experiencing is the result of bottlenecks that will begin to fade. But, investors do have to stay aware of market expectations, even if they deviate from the Federal Reserve Bank chairman’s mindset – and with each new inflation report, market participants are questioning it more. 

The question for investors of all stripes (stocks, bonds, precious metals, real estate, crypto, etc.) is whether the Fed will show less patience than it has to date and act soon to tighten economic activity.

A Fed tightening in the form of targeting higher overnight bank rates and slowing the pace of bond purchases (tapering) would not necessarily be bad for stock investors but could signal the end of easy money, which many believe has been the tailwind behind the substantial growth in stocks. As for current bond portfolios, they would experience their bond values decline as newer investors would expect higher returns on their bond investments. Bond prices would be present-valued for the new rate environment, which mathematically pushes values down (rates up).

If Powell is wrong on inflation being transitory, or if the Fed keeps lengthening their definition of what that means, holding rates down could cause larger problems down the road. Recent indications are that the inflation growth we’re seeing now could stay in the manufacturing pipeline a while.

Manufacturing Pipeline Inflation

Yesterday the Producer Price Index (PPI) was reported for October. PPI measures the increases at the producer not consumer level. These are input costs at various stages of manufacturing that are part of the pipeline. These either work their way into consumer prices months later, or serve to hurt corporate profits. Part of the series of numbers in the PPI release is PPI Final Demand. This covers the input prices for consumer-facing industries whose prices go on to enter headline CPI. As reported yesterday (November 9), the PPI Final Demand jumped by 0.6% in October from September. This means the year-over-year increase is 8.6% (same as September). These are the biggest jumps in this data going back to eleven years.

This high PPI Final Demand number suggests future CPI releases could easily continue climbing into next year.

Take-Away

The one-year inflation rate for the period ending October 31, 2021, is 6.2%. Investors that did not earn 6.2% or more on their money will find they have lower purchasing power today. While the Federal Reserve stimulus is slowing, earlier this month, the Fed Chairman reiterated the term transitory in relation to his future price expectations. He also left the window open to act sooner if this expectation changes.

For perspective, the last time year-over-year inflation was this high was July of 1982; Fed Funds traded at 14.5%. By October of that year, inflation had fallen and was running at a 5% pace. With the new lower pace, then Chairman Volcker reduced the overnight Fed Funds rate to 9%.

Stay up to date on market-moving information by registering (no cost) for Channelchek email.

Paul Hoffman

Managing Editor, Channelchek


Suggested Reading:


Inflation Seems Persistent, What Now?


Deflation Not Inflation is Risk Says Cathie Wood


The Fed is Clear that they Intend to Hold Rates Down


The Limits of Government Economic Tinkering (July 2020)


Sources:

https://www.bls.gov/news.release/cpi.nr0.htm

https://www.providentmetals.com/knowledge-center/precious-metals-resources/inflation-precious-metals.html#:~:text=Unlike%20paper%20currency%20and%20stocks,general%20health%20of%20the%20economy.

https://www.bls.gov/ppi/

https://www.federalreservehistory.org/essays/recession-of-1981-82


Stay up to date. Follow us:


Knowing How the Government Buys Infrastructure is Useful to Investors


IImage Credit: Payton Chung

Congress Passes $1 Trillion infrastructure bill – How Does the Government Go About Spending that Much Money?


The U.S. Congress passed an infrastructure bill that funds more than a trillion dollars in nationwide federal spending on Nov. 5, 2021.

The bill puts about US$240 billion toward building or rebuilding roads, bridges, public transit, airports and railways. More than $150 billion is slated for projects that address climate change, like building electric vehicle charging stations, upgrading energy grids and production to work better with renewables, and making public transit more environmentally sustainable.

There’s funding for cybersecurity, clean water and waste treatment systems, broadband internet connections and more.

The bill is the largest investment in the nation’s infrastructure in decades.


This article was republished with permission from The Conversation, a news site dedicated to sharing ideas from academic experts. It was written by and represents the research-based opinions of Ana Maria Dimand, Assistant Professor of Public Policy and Administration, Boise State University


So How Does the Government Go About Spending All That Money?

Officials are required to follow certain procedures, regulations and guidelines for advertising and gathering bids, reviewing them and then hiring contractors to do the work. This process is called “public procurement.”

What’s interesting to me and my colleagues who study public procurement policy is how this massive influx of spending can be used as an innovative policy tool to further the government’s social, economic and environmental goals.

Judging from President Joe Biden’s executive orders prioritizing action on climate change in contracting and procurement and ensuring equitable compensation for workers employed by federal government contractors, his administration will encourage the use of the power of procurement to achieve environmental, social and economic policy goals.

To understand how public procurement can be used to improve social equity or speed up climate action, it helps to know the basics of how it works.


How do Government Officials Buy Infrastructure?

The process starts with a formal demand from an agency like the Department of Transportation or Public Works and the selection of the best procedure for awarding the contract for a funded project.

For several decades, government infrastructure procurement processes have generally taken one of two forms: “design-bid-build” or “design-build.”

In the design-bid-build option, governments separate the contracts into two tracks – project design and project construction, one following the other. A major advantage of design-bid-build is that agencies are familiar with this traditional way of building things. The main disadvantage is that it requires a three-way relationship – with the government working with both the designer and the builder, and the designer and builder also working together – that heightens the potential for conflict during the project. And that can sometimes lead to increased costs.

An example of the design-bid-build method is the Virginia Department of Transportation’s I-95/Telegraph Road Interchange project, which involved building 11 new bridges and highway flyover ramps in Alexandria. A professional services firm named Dewberry designed the project – winning engineering awards as well as praise for avoiding negative impacts on local residents and businesses – and the separate construction firm was Corman Kokosing.

In the design-build procurement process, potential contractors bid to do both the design and construction of the infrastructure as a single package. The main advantage of this type of contract is the direct relationship between the contractor and the government. The designer and construction firm work together as a unified project team, which may significantly decrease project completion time.

However, design-build also requires a high level of expertise in drafting design and construction specifications from the government, because decisions need to be made early in the process, and changes may lead to an increase in costs.

With both of these infrastructure procurement options, the process is typically competitive among contractors, and the government owns, operates, finances and maintains the final bridge, roadway, mass transit line or other asset.


Public-Private Partnerships

The Biden administration has also proposed using another common type of procurement for infrastructure spending – public-private partnerships.

These partnerships divide the costs of designing, building, operating and maintaining a project between a private sector firm and the government over 25 or 30 years before the agreement phases out. The private firm may receive some or all of the revenues the project generates during that time.

Let’s say the infrastructure needed is a new toll road. The government enters into a contract with a private company to design, finance, construct, operate and maintain this new highway for a certain period of time. In exchange, the private company makes back its costs by collecting the revenues from the tolls.

The Capital Beltway High Occupancy Toll Lanes project in Fairfax County, Virginia, also called the 495 Express Lanes project, is just such a public-private partnership. The government agency is the Virginia Department of Transportation, and the private partner is a company formed specifically for this project called Capital Beltway Express LLC.

Proponents argue that public-private partnerships may help the government provide better infrastructure without increasing public debt.

Public policy researchers in the Netherlands have also found that by supporting the development of trust and commitment between the partners, public-private infrastructure partnerships can lead to better results in many ways, such as effective design solutions, reduced environmental impact, lower costs and better relations with and support from local communities or organizations.

But there are also critics. Policy scholars have noted that these partnerships may not really save governments money. Other scholars have raised concerns that these arrangements cede too much public control of infrastructure to the private sector, which may look out more avidly for its own financial interests than those of the public.

By inserting demands into government contracts, the new infrastructure spending could be used to promote fair wages, health care benefits, fair working conditions for people employed by government contractors and ensure that products are sourced in a sustainable and ethical manner. This approach can also be used to demand locally produced goods and services, support for veteran-, minority- and women-owned businesses and spur market innovation, environmentally friendly products and services.


Suggested Reading:


$1.9 Trillion in Terms We Can Better Relate To


Bitcoin and Ethereum are Usually Grouped Together, Should They Be?


SEC Investigates Digital Engagement Practices in Broker Apps


The Fed is Clear that they Intend to Hold Rates Down


Stay up to date. Follow us:


Economy Getting Back to Prepandemic Normal?


Wages Up as Americans are Encouraged Back to Work and Into the Office – Three Takeaways from the Latest Jobs Report


This article was republished with permission from The Conversation, a news site dedicated to sharing ideas from academic experts. It was written by and represents the research-based opinions of Christopher Decker, Professor of Economics, University of Nebraska Omaha.


After a lackluster jobs report in September 2021, the latest news on employment gives Americans plenty of cheer about ahead of the holiday season.

In total, 531,000 jobs were added in October – outstripping the already optimistic predictions of economists. This caused the unemployment rate to fall 0.2 percentage points to 4.6%.

Even with those gains, the U.S. is still below pre-pandemic employment levels. But as an economist, I see details in the latest jobs report that suggest the workforce is emerging from 18 months of what has been the “new normal” and getting back to, well, the “normal normal.”

Remote Working in the Rear-View
Mirror?

Americans are returning to offices after a year-and-a-half of Zoom meetings and digital water cooler moments. The pandemic had opened the eyes of many potential workers to the possibility that working from home might be preferable to on-site work.

But the jobs report shows that this may be passing. In October, 11.6% of employees worked remotely due to the pandemic, down from 13.2% in the previous month.

Working from home offered flexibility, especially to people who held down two jobs. A lot of people found they could get by with one job, work from home and save money on commuting and child care. The drop in remote working could indicate that some families came to realize that while this worked to cover a shorter-term period during the pandemic, it ate away at household savings, getting to a point where working on-site was necessary again.

It also signifies a change of attitude that may explain why employment in the leisure and hospitality sector has bounced back. One possible reason for lower-than-expected job gains in September was that people were hesitant to return to worksites where they would have to mix with people – such as at bars, restaurants and in stores – preferring to spend more time at home.

October’s jobs report – which saw strong gains in leisure and hospitality – suggests that peoples’ ability to delay returning to work may be coming to an end and potentially that they are more open to returning to on-site jobs, perhaps encouraged by vaccination rates and falling case numbers.

Wages Up, Workers Back … Time
for the Fed to Act?

There is some evidence that the “great resignation” – or more accurately, the great “not taking up low-paid jobs” – era was short-lived and winding down.

Many potential workers had seemingly been hesitant to return to lower-paid food service jobs as well as employment in the leisure and hospitality sector due to relative low wages and rigid work schedules.

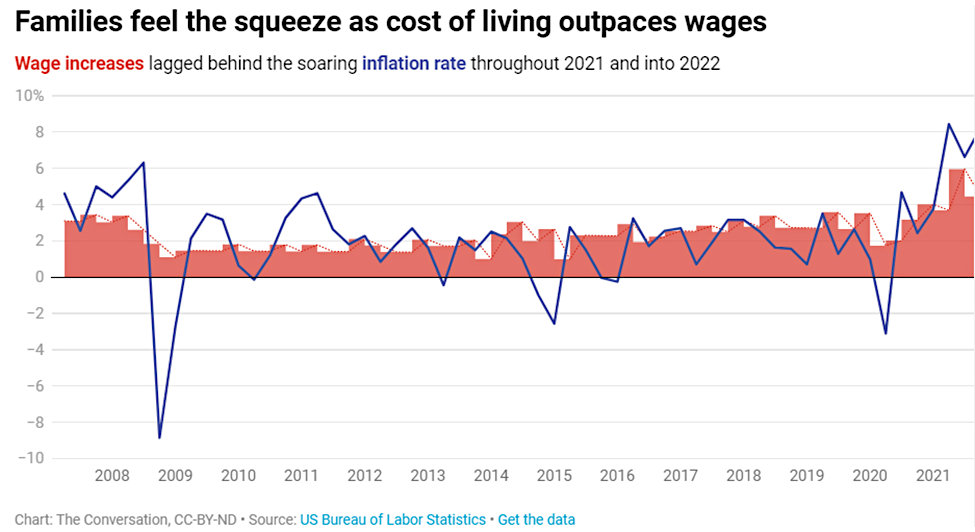
But the latest report shows evidence of increases in wages and salaries. In October, average hourly earnings increased by 11 cents to US$30.96 – continuing the upward trend of recent months. It means that average earnings are almost 5% higher that they were a year ago.


Wage increases look set to continue for some time. The latest report shows that labor costs increased 8.3% year-on-year in the third quarter as job opening rates remained pretty high, putting further upward pressure on pay.

This is great for workers but does pose a challenge to the Federal Reserve, which must keep inflation in check.

On Nov. 3, the Fed said it would begin scaling down its pandemic-era policy of buying Treasury bonds and other assets, which has the effect of gently reducing the supply of money in the economy. The Fed has also said it might lift interest rates earlier than planned if necessary to tamp down inflation risks.

The stronger-than-expected jobs report and increases in employment costs may prompt it to act more quickly. That said, the Fed may still want to tread cautiously here. Supply chain concerns remain and will need to be worked out before central bankers can conclude that overall inflation is more than a short-term issue.


Not All American Workers Are Seeing the Bounce

There is no doubt that the October jobs report was encouraging. But public sector employment was down, and that is important. This is largely a result of the pandemic. Retail sales were down significantly in 2020 and as a result state budgets are tight – in short, they have suffered from lackluster tax revenue sources.

This might make it harder for public sector jobs – in local government and schools – to bounce back as robustly as the rest of the economy.


Suggested Reading:


Study Says Investors Would Benefit if Weren’t so Confident


Bill Ackman Says ESG Investing Contributes to Inflation


Deflation Not Inflation is Risk Says Cathie Wood


Index Funds Still May Fall Apart Over Time


Stay up to date. Follow us: