Why Investors Are Obsessed with the Fed “Pivot”
“Investors should not care whether the Fed pivots or not if they analyze investment opportunities based on fundamentals and not on monetary laughing gas,” writes economist Daniel Lacalle, PhD. In his latest article, published below. LaCalle takes on the journalists and economists that see market risk differently than himself. This is a thought-provoking read for anyone who has been living on a diet of mostly CNBC, and Yahoo Finance, as exposure to diverse market viewpoints is considered healthy. – Paul Hoffman, Channelchek
Obsessed Investors
In a recent Bloomberg article, a group of economists voiced their fears that the Federal Reserve’s inflation fight may create an unnecessarily deep downturn. However, the Federal Reserve does not create a downturn due to rate hikes; it creates the foundations of a crisis by unnecessarily lowering rates to negative territory and aggressively increasing its balance sheet. It is the malinvestment and excessive risk-taking fuelled by cheap money that lead to a recession.
Those same economists probably saw no risk in negative rates and massive money printing. It is profoundly concerning to see that experts who remained quiet as the world accumulated $17 trillion in negative yielding bonds and central banks’ balance sheets soared to more than $20 trillion now complain that rate hikes may create a debt crisis. The debt crisis, like all market imbalances, was created when central banks led investors to believe that a negative yielding bond was a worthwhile investment because the price would rise and compensate for the loss of yield. A good old bubble.
Multiple expansion has been an easy investment thesis. Earnings downgrades? No problem. Macro weakness? Who cares. Valuations soared simply because the quantity of money was rising faster than nominal GDP (gross domestic product). Printing money made investing in the most aggressive stocks and the riskiest bonds the most lucrative alternative. And that, my friends, is massive asset inflation. The Keynesian crowd repeated that this time would be different and consistently larger quantitative easing programs would not create inflation because it did not happen in the past. And it happened.
Inflation was already evident in assets all over the investment spectrum, but no one seemed to care. It was also evident in non-replicable goods and services. The FAO food price index already reached all-time highs in 2019 without any “supply chain disruption” excuse or blaming it on the Ukraine war. House prices, insurance, healthcare, education… The bubble of cheap money was clear everywhere.
Now many market participants want the Fed to pivot and stop hiking rates. Why? Because many want the easy multiple expansion carry trade back. The fact that investors see a Fed pivot as the main reason to buy tells you what an immensely perverse incentive monetary policy is and how poor the macro and earnings’ outlook are.
Earnings estimates have been falling for 2022 and 2023 all year. The latest S&P 500 earnings’ growth estimates published by Morgan Stanley show a modest 8 and 7 percent rise for this and next year respectively. Not bad? The pace of downgrades has not stopped, and the market is not even adjusting earnings to the downgrade in macroeconomic estimates. When I look at the details of these expectations, I am amazed to see widespread margin growth in 2023 and a backdrop of rising sales and low inflation. Excessively optimistic? I think so.
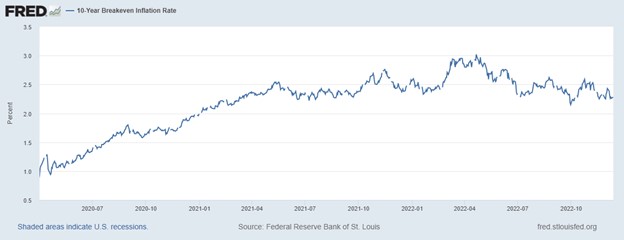
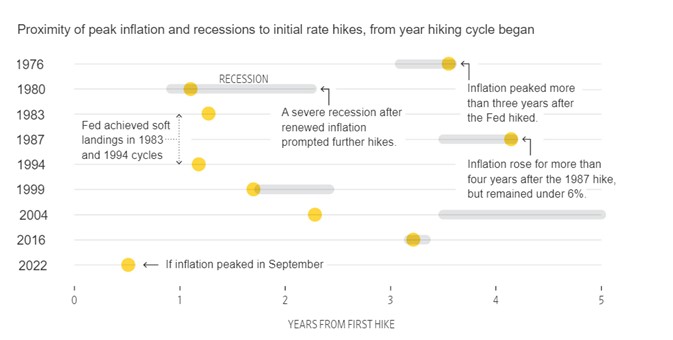
Few of us seem to realize a Fed pivot is a bad idea, and, in any case, it will not be enough to drive markets to a bull run again because inflationary pressures are stickier than what consensus would want. I find it an exercise in wishful thinking to read so many predictions of a rapid return to 2% inflation, even less, when history shows that once inflation rises above 5% in developed economies, it takes at least a decade to bring it down to 2%, according to Deutsche Bank. Even the OECD expects persistent inflation in 2023 against a backdrop of weakening growth.
Stagflation. That is the risk ahead, and a Fed pivot would do nothing to bring markets higher in that scenario. Stagflation periods have proven to be extremely poor for stocks and bonds, even worse when governments are unwilling to cut deficit spending, because the crowding out of the private sector works against a rapid recovery.
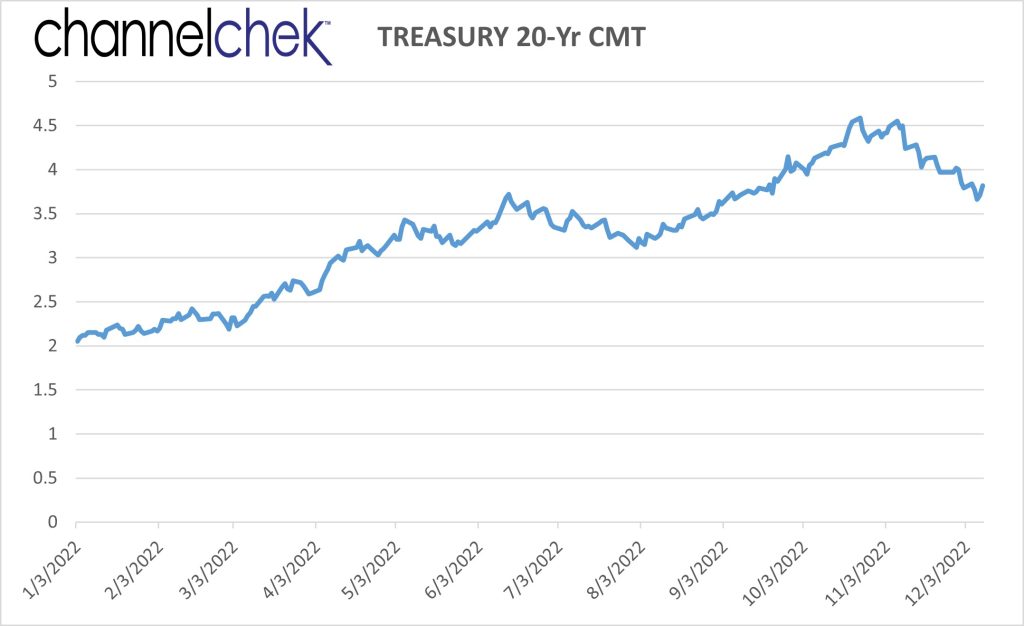
Current inflation expectations suggest the Fed will pivot in the first quarter of 2023. That is an awfully long time in the investment world if you want to bet on a V-shaped market recovery. Even worse, that pivot expectation is based on a surprisingly accelerated reduction in inflation. How can it happen when central banks’ balance sheets have barely moved in local currency, reverse repo liquidity injections reach trillion-dollar levels every month and money supply has barely corrected from the all-time highs of 2022? Many are betting on statistical bodies tweaking the calculation of CPI (consumer price index), and believe me, it will happen, but it will not disguise earnings and margin erosion.
To cut inflation drastically three things need to happen, and only one is not enough. 1) Hike rates. 2) Reduce the balance sheet of central banks meaningfully. 3) Stop deficit spending. This is unlikely to happen anytime soon.
Investors that see the Fed as too hawkish look at money supply growth and how it is falling, but they do not look at broad money accumulation and the insanity of the size of central banks’ balance sheets that have barely moved in local currency. By looking at money supply growth as a variable of tightness in monetary policy they may make the mistake of believing that the tightening cycle is over too soon.
Investors should not care whether the Fed pivots or not if they analyze investment opportunities based on fundamentals and not on monetary laughing gas. Betting on a Fed pivot by adding risk to cyclical and extremely risky assets may be an extremely dangerous position even if the Fed does revert its pace, because it would be ignoring the economic cycle and the earnings reality.
Central banks do not print growth. Governments do not boost productivity. However, both perpetuate inflation and have an incentive to increase debt. Adding these facts to our investment analysis may not guarantee high returns, but it will prevent enormous losses.
About the Author
Daniel Lacalle, PhD, economist and fund manager, is the author of the bestselling books Freedom or Equality (2020), Escape from the Central Bank Trap (2017), The Energy World Is Flat (2015), and Life in the Financial Markets (2014).