AMN Healthcare (NYSE: AMN), a prominent player in total talent solutions for healthcare organizations across the United States, has announced its plans to acquire MSDR, marking a significant move in the healthcare staffing sector. The definitive agreement, with a purchase price of $300 million, encompasses two healthcare staffing companies, Medical Search International (MSI) and DRW Healthcare Staffing (DRW), both of which specialize in locum tenens and advanced practices.
Meet the Companies:
MSI, established in 2002, is renowned for its services in placing high-quality healthcare professionals specializing in psychiatry, anesthesia, radiology, and surgery, serving healthcare systems throughout the United States. DRW, founded in 2011, boasts expertise in psychiatry, anesthesia, and surgery placements, making it a valued leader in the locum tenens industry. Notably, Chris Wang, the Chief Executive Officer and Managing Partner of DRW, will continue to contribute as the President of MSDR.
Growth Prospects and Financials:
This strategic acquisition positions AMN Healthcare for substantial revenue growth within the locum tenens sector. In 2022, MSDR generated $104 million in revenue, and the annualized revenue for 2023 stands at approximately $155 million. AMN anticipates the deal to be modestly accretive to adjusted earnings per share (EPS) within the first 12 months of integration.
The acquisition is slated to close in the fourth quarter of 2023, contingent on regulatory approvals and closing conditions. It will be treated as an asset purchase, creating a step-up in the tax basis for the intangible assets acquired.
Expanding Solutions and Expertise:
With the integration of MSDR, AMN Healthcare’s extensive portfolio of solutions is set to expand significantly. Clients will gain access to a larger and more diverse candidate pool, including healthcare professionals specializing in some of the most sought-after and in-demand services.
Moreover, the acquisition brings the wealth of expertise and knowledge of the MSDR team in recruitment, placement, and operations, coupled with candidate matching technology tailored for locum tenens. This move underscores AMN Healthcare’s commitment to delivering high-quality, tailored workforce solutions.
Commentary from Leadership:
AMN Healthcare President and Chief Executive Officer Cary Grace expressed enthusiasm about the acquisition, stating, “We are very excited to welcome the MSDR team into the AMN Healthcare family and expand the workforce solutions available to our clients across the country.” The move signifies a strategic growth opportunity that positions AMN Healthcare as a stronger and more comprehensive player in the healthcare staffing industry, ultimately benefitting both healthcare organizations and the dedicated professionals they serve.
Explore more healthcare and biotechnology stocks covered by Noble Senior Analysts Gregory Aurand and Robert LeBoyer
In a recent rally, Bitcoin briefly surpassed the $35,000 mark, marking a significant milestone not seen since May 2022. This resurgence has breathed new life into the world’s foremost cryptocurrency and left many wondering if Bitcoin is poised for a remarkable comeback.
A Rally of Remarkable Proportions:
The year 2023 has unfolded with tremendous vigor for Bitcoin enthusiasts. The cryptocurrency has ascended over 100% since the year’s inception, igniting optimism among investors and speculators alike. This remarkable rally could, in part, be attributed to a phenomenon known as a “short squeeze.” In essence, some investors who had bet against Bitcoin found themselves in a precarious position, compelled to buy Bitcoin to cover their short positions, thus driving its price higher.
Short Liquidations and Regulatory Hopes:
A staggering $167 million in short liquidations, predominantly on offshore exchanges, serves as evidence of the short squeeze’s impact. However, the Bitcoin market’s dynamics extend beyond short-term speculation. The recent decision by the U.S. Securities and Exchange Commission (SEC) not to appeal a ruling in Grayscale’s lawsuit has sparked optimism in the cryptocurrency community. The hope is that this decision could pave the way for the approval of a Bitcoin-related exchange-traded fund (ETF) in the coming months. Momentum has been building as firms vying for a Bitcoin ETF updated their filings, and prominent investors such as Ark’s Cathie Wood and Galaxy’s Mike Novogratz have highlighted a shift in the SEC’s tone. The regulatory body appears to be engaging more positively with the cryptocurrency industry, increasing the odds of a Bitcoin ETF receiving the green light.
The Significance of a Bitcoin ETF:
A Bitcoin ETF would represent a pivotal development for both seasoned and novice investors. It would provide a structured and regulated way for individuals to gain exposure to Bitcoin’s price movements without the need to directly own the cryptocurrency. Such an ETF could bridge the gap between traditional financial markets and the digital asset realm, further legitimizing Bitcoin as a viable investment.
Bitcoin’s Checkered History:
To understand the significance of this potential resurgence, it’s crucial to reflect on Bitcoin’s journey. Since its inception in 2009, Bitcoin has weathered numerous storms, experiencing extreme volatility and wild price swings. It reached its all-time high of nearly $65,000 in April 2021 before experiencing a sharp decline.
Regulatory Scrutiny and Industry Challenges:
Bitcoin and the broader cryptocurrency industry have faced increasing regulatory scrutiny in recent years. The high-profile FTX bankruptcy case and Terraform’s legal troubles, where they are charged with defrauding investors, serve as stark reminders of the challenges the industry faces. Furthermore, the SEC has been actively cracking down on cryptocurrency companies. Firms like Coinbase and Ripple are currently embroiled in legal battles with the SEC, accused of violating securities laws. These legal skirmishes, along with others in the crypto space, have underscored the pressing need for regulatory clarity in the United States. As the industry navigates these challenges, the question that looms is whether Bitcoin is indeed primed for a resurgence. The recent rally, the prospects of a Bitcoin ETF, and the evolving regulatory landscape all point to a cryptocurrency with the potential for a triumphant return, promising exciting times ahead for Bitcoin enthusiasts and investors.
The United Auto Workers (UAW) strike against General Motors (GM) has escalated, now including a full-size SUV plant in Texas. The latest developments unfolded just hours after GM reported third-quarter earnings that exceeded Wall Street’s expectations, underscoring the high-stakes nature of the ongoing labor dispute.
Approximately 5,000 workers at GM’s Arlington Assembly plant, responsible for producing full-size Cadillac, GMC, and Chevrolet SUVs, have joined the strike action, amplifying the economic impact of the labor unrest.
GM’s Earnings Report and Ongoing Strike Impact:
General Motors’ robust third-quarter performance showcased adjusted earnings per share of $2.28, surpassing the estimated $1.88. Revenue also exceeded expectations, with GM reporting $44.13 billion against the anticipated $43.68 billion.
However, the labor strike, which commenced on September 15 and has intensified since then, has cast a shadow over GM’s otherwise impressive financial results. The strikes have proven costly, with GM estimating a loss of around $200 million per week due to disrupted production.
The volatility caused by the ongoing strikes has prompted GM to withdraw its previously announced earnings guidance for the year. Furthermore, the company has adjusted its near-term targets for electric vehicles (EVs), citing slower-than-expected demand for electric vehicles.
UAW’s Stance and Worker Impact:
UAW President Shawn Fain has been steadfast in the union’s demands during the labor dispute, emphasizing the principle of equitable compensation for GM workers. In a statement, Fain noted, “Another record quarter, another record year. As we’ve said for months: record profits equal record contracts. It’s time GM workers, and the whole working class, get their fair share.”
With over 45,000 UAW members at Detroit automakers currently on strike, which constitutes roughly 31% of union members covered by expired contracts, the strike has already left a considerable impact. Additionally, around 7,000 workers, approximately 5% of the workforce, have been laid off due to the ripple effects of the strikes, according to the affected companies.
It’s worth noting that this recent escalation of the strike was initially planned earlier in the month, but GM proposed a last-minute inclusion of workers at the company’s joint-venture battery cell plants in the master agreement, leading to a temporary pause in strike activities. However, recent developments suggest that progress in negotiations may have stalled, reigniting tensions between the UAW and GM.
The ongoing UAW strike against General Motors, coupled with GM’s impressive earnings report and its subsequent decision to withdraw guidance due to the labor unrest, highlights the delicate balance between corporate success and labor demands in the auto industry. As negotiations continue, the stakes remain high for both the automaker and its dedicated workforce.
In a significant move that underscores the ongoing transformation within the energy sector, Chevron (NYSE: CVX) has recently announced its acquisition of Hess (NASDAQ: HES) in a monumental $53 billion all-stock deal. This mega-merger comes on the heels of Exxon Mobil’s $60 billion bid for Pioneer Natural Resources, marking the second colossal consolidation among major U.S. oil players this month.
The strategic significance of this merger revolves around the ambitions of both Chevron and Exxon to unlock the untapped potential of Guyana’s burgeoning oil industry. Guyana, once an inconspicuous player in the oil sector, has rapidly ascended the ranks to become one of Latin America’s foremost oil producers, second only to industry giants Brazil and Mexico, thanks to substantial oil discoveries in recent years.
This high-stakes deal positions Chevron in direct competition with its formidable rival, Exxon, in the race to capitalize on Guyana’s newfound prominence. Chevron’s offer, consisting of 1.025 of its shares for each share of Hess or $171 per share, represents a premium of approximately 4.9% to the stock’s most recent closing price. The total value of the transaction, encompassing debt, amounts to a staggering $60 billion.
Upon the successful completion of this transaction, John Hess, CEO of Hess Corp, is set to join Chevron’s board of directors, cementing the collaborative vision of the two energy giants. Chevron has also expressed its commitment to fortify its share repurchase program, intending to bolster it by an additional $2.5 billion, reaching the upper limit of its annual $20 billion range. This decision underscores Chevron’s confidence in future energy prices and its robust cash generation.
Notably, this merger serves as a testament to Chevron’s unwavering dedication to fossil fuels. In a climate where global energy dynamics are evolving rapidly, Chevron’s move underscores a resolute belief in the enduring strength of oil demand. Large energy producers continue to employ acquisitions as a strategy to replenish their reserves after years of underinvestment, further highlighting the industry’s drive to secure its future in a dynamically shifting landscape.
This merger between Chevron and Hess not only signals the industry’s determination to harness the full potential of Guyana’s oil reserves but also represents a pivotal moment in the evolution of the energy sector, as established players seek new avenues for growth and consolidation in a rapidly changing world. The deal is expected to close around the first half of 2024, setting the stage for a new chapter in the energy industry’s ongoing narrative.
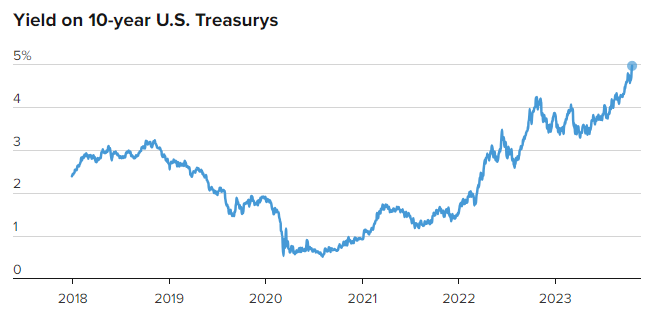
The yield on the 10-year Treasury note has once again crossed the 5% threshold. This benchmark yield has far-reaching implications for both the financial markets and the general public, serving as a barometer of economic conditions and influencing investment decisions, interest rates, and the cost of borrowing for governments, businesses, and individuals.
The 10-year Treasury yield is a crucial indicator of the economy’s health and the state of the financial markets. It reflects the interest rate that the U.S. government pays on its debt with a 10-year maturity, which is considered a relatively safe investment. As such, it provides a reference point for other interest rates in the financial system.
Impact on Investors:
Fixed-Income Investments: The 10-year Treasury yield directly impacts the pricing and performance of bonds and other fixed-income investments. When the yield rises, the value of existing bonds tends to decrease, which can lead to capital losses for bondholders.
Stock Market: Higher Treasury yields can put pressure on stock prices. As bond yields increase, investors may shift from equities to bonds in search of better returns with lower risk. This shift can lead to stock market volatility and corrections.
Cost of Capital: Rising Treasury yields can increase the cost of capital for businesses. This may result in higher borrowing costs for companies, which can impact their profitability and, subsequently, their stock prices.
Impact on the General Public:
Mortgage Rates: Mortgage rates are closely tied to the 10-year Treasury yield. When yields rise, mortgage rates tend to follow suit. As a result, homebuyers may face higher borrowing costs, potentially limiting their ability to purchase homes or leading to higher monthly payments for existing homeowners with adjustable-rate mortgages.
Consumer Loans: The yield on the 10-year Treasury note also influences interest rates for various consumer loans, including auto loans and personal loans. When yields rise, the cost of borrowing for individuals increases, affecting their spending capacity.
Inflation Expectations: An increase in the 10-year Treasury yield can signal rising inflation expectations. In response, consumers may anticipate higher prices for goods and services, which can impact their spending and savings decisions.
Retirement and Savings: For retirees and savers, rising Treasury yields can be a mixed bag. While it can translate into higher returns on savings accounts and CDs, it can also result in increased volatility in investment portfolios, which may be a concern for those relying on their investments for income.
Market Sentiment and Economic Outlook:
A sustained rise in the 10-year Treasury yield is often seen as an indication of a strengthening economy. However, if the yield surges too quickly, it can raise concerns about the pace of economic growth and the potential for the Federal Reserve to implement tighter monetary policy to combat inflation.
In conclusion, the 10-year Treasury yield is not just a number on a financial ticker; it’s a critical metric that touches the lives of investors, borrowers, and everyday consumers. Its movements provide valuable insights into the state of the economy and financial markets, making it a figure closely watched by experts and the public alike.
INVO Bioscience (NASDAQ: INVO) and NAYA Biosciences have unveiled a definitive merger agreement. The primary objective of this union is to establish a robust, publicly traded life science conglomerate with a shared mission: to enhance patient access to life-altering treatments in the fields of oncology, fertility, and regenerative medicine.
The newly formed entity, to be known as “NAYA Biosciences,” will bring together the unique strengths and capabilities of both organizations, representing a significant leap forward in the healthcare landscape. NAYA Biosciences intends to chart a course that includes expanding revenue streams in the fertility sector, forging revenue-generating pharmaceutical partnerships for therapeutic initiatives, and strategically acquiring complementary technologies and companies.
Merger Details and Leadership Transition:
Under the terms of the agreement, INVO will acquire NAYA Biosciences in an all-stock transaction. Shareholders of NAYA Biosciences will receive 7.3333 shares of INVO for each share of NAYA Biosciences at the time of closing. This arrangement equates to approximately 18,150,000 shares of INVO. Dr. Daniel Teper, the current Chairman & CEO of NAYA Biosciences, will assume the position of Chairman & CEO of the combined company.
The merger is contingent on several closing conditions, including shareholder approval, an estimated $5 million or more (at NAYA’s discretion) in interim private financing in INVO at a premium relative to INVO’s market price at the time of financing (“Interim PIPE”), and a private offering by the combined company at a target price of $5.00 per share.
Valuation and Ownership Structure:
The merger values INVO at $12,373,780 and NAYA at $90,750,000. Subject to the successful execution of the Interim PIPE, post-transaction and prior to the private offering, INVO and NAYA shareholders will have ownership stakes of approximately 12% and 88%, respectively, in the combined company. This carefully structured deal is a testament to the alignment of interests and strategic vision.
A New Era for NAYA Biosciences:
Upon completion of the merger, NAYA Biosciences aims to operate as a NASDAQ-listed consortium comprising agile, disruptive, high-growth companies dedicated to expanding patient access to transformative treatments in three core areas:
NAYA Oncology: Focused on pioneering solutions in the field of oncology, NAYA Oncology aims to revolutionize cancer treatments.
NAYA Fertility: Committed to advancing fertility care, NAYA Fertility seeks to make assisted reproductive technology (ART) more accessible and inclusive for people worldwide.
NAYA Regenerative Medicine: This division is at the forefront of regenerative medicine, with a mission to develop breakthrough treatments that can transform lives.
NAYA Biosciences brings together a unique set of capabilities, including expertise in biology, cell and gene therapy, and artificial intelligence (AI). This expertise, combined with INVO’s established network of fertility clinics (INVO Centers) and the innovative INVOcell® medical device for intravaginal culture, sets the stage for accelerated clinical development and the commercialization of groundbreaking treatments.
About NAYA Biosciences:
NAYA Biosciences is poised to become a leader in the life sciences arena, fostering a cluster of high-growth companies dedicated to advancing oncology, fertility, and regenerative medicine. Leveraging its proficiency in biology, cell and gene therapy, and AI, NAYA Biosciences is on a mission to redefine the landscape of healthcare.
About INVO Bioscience:
INVO Bioscience is a healthcare services fertility company committed to broadening access to assisted reproductive technology (ART) worldwide. The company’s strategy centers on the establishment of dedicated “INVO Centers” offering the INVOcell® and intravaginal culture procedure, acquisition of U.S.-based profitable in vitro fertilization (IVF) clinics, and the distribution of its proprietary technology into existing fertility clinics. INVOcell® represents a pioneering approach to fertilization and early embryo development within the woman’s body, offering a promising alternative to traditional IVF and intrauterine insemination (IUI) treatments.
The merger between INVO Bioscience and NAYA Biosciences represents a major milestone in the life sciences industry, poised to drive innovation and bring transformative treatments to patients worldwide.
Michael Kupinski, Director of Research, Noble Capital Markets, Inc.
Jacob Mutchler, Research Associate, Noble Capital Markets, Inc.
Refer to the bottom of the report for important disclosures
Overview: A new small-cap cycle?Small cap stocks have underperformed the large cap stocks for the past several years. Notably, there is a sizable valuation disparity between the two classes, one of the largest in over 20 years. Some of the small cap stocks we follow trade at a modest 2 times Enterprise Value to EBITDA, compared with large cap valuations as high as 13 to 15 times. Are we on a cusp of a small cap cycle?
Digital Media & Technology:Stocks Outperform – But Don’t Get Too Excited. Each of Noble’s Internet and Digital Media Indices, which are market cap weighted, outperformed the S&P 500 in the third quarter, but the double-digit gains from the previous quarter moderated significantly. Despite these relatively positive results, the prevailing theme within each sector was that the largest cap stocks performed the best, while smaller cap stocks across a variety of sectors struggled.
Television Broadcasting:Advertising Stabilizing?As we look toward the third quarter, local advertising appears to be weakening as the economy appears to be slowing. But, national appears to be improving. In addition, while it was assumed that Political would increase in the fourth quarter due to the run-off of the Republican presidential candidates, we believe that President Biden has recently stepped-up advertising in the third quarter, particularly in Hispanic communities.
Radio Broadcasting:Shoring up balance sheets.As many radio companies face a challenged revenue environment and at the same time invested in faster growth digital revenue, some companies have been caught carrying a substantial amount of debt. In this report, we highlight one company that was able to shore up its balance sheet through asset sales.
Publishing:Stocks outperform. It may be hard to imagine for some investors, but the Publishing stocks outperformed in both the latest quarter and for the trailing 12 months the S&P 500! But, there is still a wide valuation gap between most of Publishers and the shares of The New York Times, with the NYT shares at 15 times cash flow and the rest near 5.
Overview
The case for small caps
Small cap investors have gone through a rough period. For the past several years, investors have anticipated an economic downturn. With these concerns, investors turned toward “safe haven” large cap stocks, which typically have the ability to weather the economic headwinds and have enough trading volume should investors need to exit the position. Since 2018, small cap stocks have underperformed the general stock market, with annualized returns of just 3.7% as measured by the S&P 600 Small Cap Index versus the general market of 10.2% as measured by the S&P 500 Index. Another small cap index, the Russell 2000, increased a more modest 2.9% annually over the comparable period. The S&P 500 is larger cap, with the minimum market cap of $14.6 billion. The S&P 600 is smaller cap, a range of $850 million to $3.7 billion, with the Russell 2000 median market cap $950 million. Some of the even smaller cap stocks, those between $100 million to $850 million, have significantly underperformed the S&P 600. This is the first time that small caps underperformed a bullish period for all stocks since the 1940s. Notably, there is a sizable valuation disparity between the two classes, large and small cap, one of the largest in over 20 years.
Some of the small cap stocks we follow trade at a modest 2 times Enterprise Value to EBITDA, compared with large cap valuations as high as 13 to 15 times. By another measure, small cap stocks may be the only class trading below historic 25 year average to the median Enterprise Value to EBIT. Why the large valuation disparity? We believe that there is higher risk in the small cap stocks, especially given that some companies may not be cash flow positive, have capital needs, or have limited share float. But, investors seem to have thrown the baby out with the bathwater. While those small cap stocks are on the more speculative end of the scale, many small cap stocks are growing revenues and cash flow, have capable balance sheets, and/or are cash flow positive. For attractive emerging growth companies, the trading activity will resolve itself over time. Some market strategists suggest that small cap stocks trade at the most undervalued in the market, as much as a 30% to 40% discount to fair value.
Are we on a cusp of a small cap cycle? Some fund managers think so. Such a cycle could last 10 years or longer. In this report, we highlight a few of our small cap favorites in the Media sector, those include companies that have attractive growth characteristics, some with or without an improving economy, capable balance sheets, and limited capital needs. Our current favorites based on growth opportunity and stock valuation include: Direct Digital (DRCT), Entravision (EVC), E.W. Scripps (SSP), Gray Television (GTN), and Townsquare Media (TSQ).
After increasing by 8% in the second quarter of 2023, the S&P 500 was unable to hold onto those gains in the third quarter. The S&P Index decreased by 3.6% in the third quarter, a decline which we attribute to the market revising its interest rate expectations to one in which rates would remain “higher for longer”. Large cap stocks that weighed on the broad market index included tech stocks such as Apple (AAPL: -12%), Microsoft (MSFT: -7%) and Tesla (TSLA: -4%). Despite this small step backwards, the S&P 500 Index increased by 20% through the first nine months of the year.
Each of Noble’s Internet and Digital Media Indices, which are market cap weighted, outperformed the S&P 500 in the third quarter, but the double-digit gains from the previous quarter (2Q 2023) moderated significantly. Digital Media 3-Month Performance Sectors that outperformed the S&P 500’s 4% decrease include Noble’s Digital Media Index (+6%), Social Media Index (+4%), Gaming Index (+3%), Ad Tech Index (+1%) and MarTech Index (-3%). Despite these relatively positive results, the prevailing theme within each sector was that the largest cap stocks performed the best while smaller cap stocks across a variety of sectors struggled.
Figure #1 Digital Media 3-Month Performance
Source: Capital IQ
Perhaps more importantly, each of Noble’s Internet and Digital Media Indices have outperformed the S&P 500 over the latest twelve months as illustrated in Figure #2 Digital Versus S&P 500 LTM. The S&P 500 Index has increased by 20% over the last year (through 9/30/2023), which trailed the performance of the each of Noble’s Internet and Digital Media Indices, as shown in Figure #3 Digital Media LTM Performance.
Figure #2 Digital Versus S&P 500 LTM
Figure #3 Digital Media LTM Performance
Source: Capital IQ
Alphabet Powers Digital Media Index Higher Despite Broader-Based Sector Weakness
The best performing index during the quarter was the Noble’s Digital Media Index, but the sector’s “strong” performance is deceiving. Shares of Alphabet (a.k.a. Google: GOOGL) increased by 9% during the quarter, and the company size relative to its peers helps explain the vast majority of the sector’s performance. Google’s market cap is 8x larger than its next largest “peer” in Netflix, and it is 160 times that of the average market cap of its Digital Media peers. Google beat expectations across all metrics (revenue, EBITDA, free cash flow) and guided to improved profitability as it streamlines workflows. The company is also increasingly perceived as a beneficiary of AI. While Alphabet shares performed well, they mask the fact that shares of only 2 of the sector’s 12 stocks were up during the third quarter. The other Digital Media stock that performed well in the quarter was FUBO (FUBO), whose shares increased by 29% in 3Q 2023. Of the 10 other digital content providers in the sector, 7 of them posted double-digit stock price declines in the third quarter.
Large Cap Meta Powers the Social Media Index Higher
Shares in Meta Platforms (formerly Facebook) rose for the third straight quarter. Shares increased by 5% and were up 150% through the first nine months of the year. Meta shares increased by 8% at the start of the third quarter due to excitement around the launch of Threads, Meta’s answer to Twitter. Over 100 million people signed up for Threads within the first five days of its rollout and positions the company well for continued revenue growth once it begins to monetize this new opportunity.
As with the Digital Media Index, the Social Media Index masked underlying weakness across several smaller cap stocks. Of the 6 stocks in the Social Media Index, only Meta shares increased during the quarter. Several social media companies performed poorly during the quarter including Spark Networks (LOVL.Y: -59%), which filed to delist its shares, Nextdoor Holdings (KIND: -44%), which has struggled to reach profitability, and Snap (SNAP: -25%), which guided to revenue declines in 3Q 2023.
“No Love” For Small Cap Stocks
As was the case in the Digital Media and Social Media sectors, the same trends held true in the other sectors: in general, large cap stocks outperformed small cap stocks. For example, Noble’s Video Gaming Index increased by 3% in the third quarter, driven by Activision Blizzard (ATVI: +11%), and to a lesser extent SciPlay Corp (SCP: +16%). However, 7 other stocks in the video gaming sector posted stock price declines in the third quarter. Larger cap names such as EA Sports (EA: -7%) and Take-Two Interactive (TTWO: -5%) posted mid-single digit stock price declines while every small cap video gaming stock posted double digit declines.
Noble’s Ad Tech Index increased by 1% during the quarter driven by shares of AppLovin (APP: +55%), and Taboola (TBLA: +22%). However, just 7 of the sector’s 20 stocks were up for the quarter, and 10 stocks in the sector posted double digit declines. One of our favorites is an attractive growth, small cap company, Direct Digital. The DRCT shares declined 20% in the quarter, in spite of posting favorable Q2 revenue that beat expectations and raising full year revenue estimates. Direct Digital leads our list of favorites in the digital Ad Tech companies. As Figure #4 Ad Tech Comparables indicate, Direct Digital is among the cheapest in the industry trading at 4.7 Enterprise Value to our 2024 adj. EBITDA estimate, well below larger cap peers trading at multiples of 12, 13, or even much higher. Finally, Noble’s MarTech Index decreased by 3% (the only index that declined during the quarter), with the sector’s largest companies, Adobe (ADBE: +4%) and Shopify (SHOP: -16%) posting mixed results. Outside of these mega-cap stocks, the theme of underlying weakness prevailed: only 5 of the 20 stocks in the sector posted stock price increases, while one was flat and the other 14 were down. Eleven of the 20 stocks in the MarTech sector posted double digit stock price declines. One of our favorites in the sector, Harte Hanks performed well in the quarter up 18.8%. This was a welcomed bounce from the steep decline in the shares over the past 12 months, down 44%. The company stumbled on quarterly expectations. We believe that the sell-off was over done, providing a compelling opportunity for investors. As Figure #5 MarTech Comparables illustrates, the HHS shares trade at 3.8 times Enterprise Value to our 2024 adj. EBITDA estimate, a fraction of the multiples of many of its larger cap peers. We view the HHS shares as among our favorites in the sector.
Figure #4 Ad Tech Comparables
Source: Company filings & Eikon
Figure #5 MarTech Comparables
Source: Noble estimates & Company filings
Traditional Media
Virtually all traditional media stocks underperformed the general market in the past quarter and trailing 12 months, as illustrated in Figure #6 Traditional Media LTM Performance, save the Publishing group. In the latest quarter, Publishing stocks outperformed the general market, up 3.0% versus down 3.6% for the general market as measured by the S&P 500 Index. The average Publishing stock is up 6.9% over the past 12 months, with some of the larger cap publishing stocks up significantly more, over 20%. More details on the Publishing performance is in the Publishing section of this report. In the last quarter, the Radio stocks were the worse performing group, down on average 10.2%, As illustrated in Figure #7 Traditional Media 3-Month Performance. In addition, the Radio stocks were the worst performing group in the third quarter as well, down and average of 12.7% for the quarter.
Figure #6 Traditional Media LTM Performance
Source: Capital IQ
Figure #7 Traditional Media 3-Month Performance
Source: Capital IQ
Television Broadcasting
Have the TV stocks discounted too much?
We believe that the economic headwinds of rising interest rates and inflation have begun to hit local advertising. Local advertising had been relatively stable, favorably influenced by a resurgence of Auto advertising. Notably, local advertising fared much better than national advertising, which was down in the absence of Political advertising. As we look toward the fourth quarter, local advertising appears to be weakening. But, notably, national advertising appears to be doing much better, driven by an early influx of Political advertising. While it was assumed that Political would increase in the fourth quarter due to the run-off of the Republican presidential candidates, especially in early primary States, we believe that President Biden has recently stepped-up advertising, particularly to the Hispanic community. We have noticed Biden advertising even in Florida! So, what does this mean for media fundamentals?
It is difficult to predict where Political dollars will be spent and not all Political dollars will be spent evenly, geographically or by stations in a particular market. Furthermore, Political dollars may be pulled back in a market should a particular candidate pull ahead in the polls. Political dollars were anticipated to be spent in early primary States, specifically for the Republican candidates. But, the Biden money is a surprise. Biden appears to be spending early and in areas to solidify a key voting block, Hispanics. Of course, the Biden campaign may broaden its spending to other voting blocks as well. In our view, 2024 will be a banner year for Political advertising given the large amount of Political fundraising by the candidates and by Political Action Committees. The prospect of weak local advertising, however, may cast a pall over the current expected strong revenue growth in 2024. Many analysts, including myself, expected that economic prospects would improve in 2024, which would have provided a favorable tailwind for a significant improvement in total TV advertising in 2024. Certainly, it is likely that the Fed may lower interest rates in 2024, potentially providing a boost to local advertising prospects, but that improvement may come late in the year. But, overall, in spite of the weakening Local advertising environment, given the improving National advertising trends, overall TV advertising appears to have stabilized.
For now, we are cautiously optimistic about 2024, with the caveat that revenue growth may be somewhat tempered given the current weak local advertising trends. Nonetheless, we believe that we are nearing the trough for this economic cycle. Some companies, like E.W. Scripps, are in a favorable cycle for Retransmission renewals. Retransmission revenues now account for a hefty 50% of Scripps’ total broadcast revenue. In Scripps’ case, 75% of its subscribers are under renewal, which it recently announced was completed. As such, the company reaffirmed guidance that Retransmission revenue will increase 15% in 2024 and lead to a substantial increase in net Retransmission revenue. We remain constructive on TV stocks, as high margin Political advertising should boost balance sheets and improve stock valuations.
In the latest quarter, TV stocks underperformed the general market. As Figure #7 Traditional Media 3-Month Performanceillustrates, the Noble TV Index decreased 13.2%, underperforming the 3.6% decline in the general market as measured by the S&P 500. The poor performance of the latest quarter adversely affected the trailing 12 month performance, bringing the Noble TV Index to a 17.6% decline for the trailing 12 months. Individual stocks performed more poorly, with only the shares of Fox Corporation registering a modest gain for the trailing 12 months of 2.7%. The Noble TV Index is market cap weighted, and, as such, Fox with a $15 billion market cap, carried the index. Outside of the relatively strong performance of this large cap stock, all of the TV stocks were down and down big, between 18% to 59% over the past 12 months.
We believe that investors have shied away from cyclicals, smaller cap stocks, and from companies with higher debt levels. This accounts for the poor performance of Gray Television and E.W. Scripps, both of which have elevated debt leverage given recent acquisitions. Both were among the poorest performers for the latest quarter and for the trailing 12 months. The GTN shares were down 12% in the third quarter and 38% for the last 12 months; the SSP shares down 40% and 58%, respectively.
We believe that the sell-off has been overdone, especially as the industry is expected to cycle toward an improved fundamental environment in 2024. As Figure #8 TV Industry Comparables indicate, the Broadcast TV stocks trade at a modest 5.3 times Enterprise Value to our 2024 adj. EBITDA estimates, well below historic 20 year average trading multiples of 8 to 12 times. We believe that the depressed valuations largely discount the prospect of an economic downturn and do not reflect the revenue and cash flow upside as we cycle into a Political year. Given the steep valuation discount to historic levels, we believe that the stocks are 15% to 20% below levels where the stocks normally would be given a favorable Political cycle. Our favorites in the TV space include: Entravision (EVC), one of the beneficiaries of the influx of Political advertising to Hispanics; E.W. Scripps (SSP), a play on Political, with the favorable fundamental tailwind of strong Retransmission revenue growth; and, Gray Television (GTN), one of the leading Political advertising plays.
Figure #8 TV Industry Comparables
Source: Noble estimates & Eikon
Radio Broadcasting
Shoring up balance sheets.
The Radio industry has struggled in the first half as National advertising weakened throughout the year. On average National advertising was down roughly20% or more for many Radio broadcasters. Local held up relatively well, although down in the range of 3% to 5%. Fortunately, for many broadcasters, a push into Digital, which grew in the first half, helped to stabilize total company revenues. As we look to the fourth quarter, we believe that Local advertising is weakening, expected to be down in the range of 5% to 7%, or more in some of the larger markets. But, for some, National advertising is improving, driven by Political advertising. But, Political is not evenly spread. As such, we anticipate that there will be a cautious outlook for many in the industry for the second half of the year.
For some in the industry, the challenged revenue environment has put a strain on managing cash flows to maintain hefty debt loads. We believe that debt leverage is among the top concern for investors. Many of the poorest performing stocks in the quarter and for the trailing 12 months carry some of the highest debt leverage in the industry. The Noble Radio Index decreased a significant 13.7% in the latest quarter compared with a 3.7% decline for the general market. But, a look at the individual stock performance tells a more disappointing story. The shares of Salem Media declined 38% in the latest quarter, bringing 12 month performance to a 44% decline. The shares of iHeart Media decline 49% for the year.
Notably, Salem Media assuaged much of its liquidity concerns with recent asset sales. Such sales will bring in roughly $30 million, allowing it to fully pay off its $22 million revolver and have some flexibility with remaining cash on its balance sheet. We do not believe that investors have fully credited the significance of the recent asset sales.
One bright spot in the group has been the shares of Townsquare Media. While the TSQ shares gave back a significant 27% in the third quarter, the shares are still up 20% over the past 12 months, among one of the best performance in the industry. We believe that the company’s initiation of a substantial dividend resonated with investors.
While the industry faces fundamental headwinds given the current economic challenges, we believe that most companies have made a shift toward faster growth, digital business models. In addition, we believe that Radio will see a lift from Political advertising in 2024, although not to the extent that the TV industry will see. Nonetheless, we look for an improving advertising scenario in 2024. As such, we are constructive on the industry. One of our current favorites leads the industry in its Digital transition, Townsquare Media. As Figure #9 Radio Industry Comparables indicates, the TSQ shares are among the cheapest in the industry, trading at 5.1 times EV to our 2024 adj. EBITDA estimate, well below the average of 7.1 times for the industry. In addition, we like Saga Communications, one of the cheapest stocks in the industry, trading near 4 times EV to 2024 adj. EBITDA.
Figure #9 Radio Industry Comparables
Source: Noble estimates & Eikon
Publishing
Further cost cutting will cut deep.
Publishers are not likely to be spared from the weakening local advertising business. But, publishers have a play book on areas to cut expenses to manage cash flows. Certainly, we believe that its Digital businesses should help offset some of the anticipated revenue declines on its print legacy business. We believe that publishers are eliminating print days. Such a move likely will indicate further pressure on print revenues, but would not proportionately decrease cash flow. Some print days have very little advertising and/or advertisers may shift some spending to other print days. Lee Enterprises indicated in its last call that it will go down to 3 print days in 44 of its smaller markets. We believe that the move has been a success. While revenues may have decreased slightly more than expected given the current weak advertising environment, we believe that cost savings have been more than anticipated.
While many publishers would like to have a long runway for its cash flowing print business, such possible moves would necessarily increase the digital transition. Notably, with just some stabilization of revenues on the print side, many publishers have the potential to show total company revenue growth given benefit from digital revenue. With the prospect of strategies that may cut print days and the current weak local advertising environment, we believe that total revenue growth may be pushed out to 2025.
Many of the Publishing stocks were written off long ago. But, surprisingly, the Publishing stocks have been among the best stock performers in the latest quarter and for the trailing 12 months. The Noble Publishing Index increased a solid 36% in the trailing 12 months, outperforming the general market (as measured by the S&P 500) of 19% in the comparable time frame. In the third quarter, Publishing stocks increased 3.5%, outperforming the S&P 500, which declined 3.7%. All of the publishers increased, with the exception of Lee Enterprises. The Lee shares increased substantially a year earlier on takeover rumors. Since then the shares have come back down to earth, while the rest of the industry moved higher. The stronger performers in the industry, however, were the larger cap companies, such as News Corp and The New York Times. In the latest quarter, the shares of The New York Times increased roughly 5% and the shares are up 27% for the trailing 12 months. The shares of Gannett increased a solid 9% in the latest quarter, as well.
As Figure #10 Publishing Industry Comparables illustrate, there is a disparity among some of the larger, more diversified companies, like The New York Times and News Corporation. The NYT shares trade at a hefty 15.7 times EV to 2024 adj. EBITDA estimates, well above much of the pack currently trading in the 5 multiple range. We believe that this valuation gap should narrow, especially as many of the companies, like Lee and Gannett, have a burgeoning Digital business. While the industry faces secular challenges of its Print business and there are economic headwinds in the very near term, we believe that companies like Lee Enterprises have the ability to manage cash flows and grow its Digital businesses. Given the compelling stock valuation disparity, the shares of Lee Enterprises lead our list of favorites in the sector.
Figure #10 Publishing Industry Comparables
Source: Noble estimates & Eikon
For more information and disclosures on companies mentioned in this report, click on the following:
All statements or opinions contained herein that include the words “we”, “us”, or “our” are solely the responsibility of Noble Capital Markets, Inc.(“Noble”) and do not necessarily reflect statements or opinions expressed by any person or party affiliated with the company mentioned in this report. Any opinions expressed herein are subject to change without notice. All information provided herein is based on public and non-public information believed to be accurate and reliable, but is not necessarily complete and cannot be guaranteed. No judgment is hereby expressed or should be implied as to the suitability of any security described herein for any specific investor or any specific investment portfolio. The decision to undertake any investment regarding the security mentioned herein should be made by each reader of this publication based on its own appraisal of the implications and risks of such decision.
This publication is intended for information purposes only and shall not constitute an offer to buy/sell or the solicitation of an offer to buy/sell any security mentioned in this report, nor shall there be any sale of the security herein in any state or domicile in which said offer, solicitation or sale would be unlawful prior to registration or qualification under the securities laws of any such state or domicile. This publication and all information, comments, statements or opinions contained or expressed herein are applicable only as of the date of this publication and subject to change without prior notice. Past performance is not indicative of future results. Noble accepts no liability for loss arising from the use of the material in this report, except that this exclusion of liability does not apply to the extent that such liability arises under specific statutes or regulations applicable to Noble. This report is not to be relied upon as a substitute for the exercising of independent judgement. Noble may have published, and may in the future publish, other research reports that are inconsistent with, and reach different conclusions from, the information provided in this report. Noble is under no obligation to bring to the attention of any recipient of this report, any past or future reports. Investors should only consider this report as single factor in making an investment decision.
IMPORTANT DISCLOSURES
This publication is confidential for the information of the addressee only and may not be reproduced in whole or in part, copies circulated, or discussed to another party, without the written consent of Noble Capital Markets, Inc. (“Noble”). Noble seeks to update its research as appropriate, but may be unable to do so based upon various regulatory constraints. Research reports are not published at regular intervals; publication times and dates are based upon the analyst’s judgement. Noble professionals including traders, salespeople and investment bankers may provide written or oral market commentary, or discuss trading strategies to Noble clients and the Noble proprietary trading desk that reflect opinions that are contrary to the opinions expressed in this research report. The majority of companies that Noble follows are emerging growth companies. Securities in these companies involve a higher degree of risk and more volatility than the securities of more established companies. The securities discussed in Noble research reports may not be suitable for some investors and as such, investors must take extra care and make their own determination of the appropriateness of an investment based upon risk tolerance, investment objectives and financial status.
Company Specific Disclosures
The following disclosures relate to relationships between Noble and the company (the “Company”) covered by the Noble Research Division and referred to in this research report. Noble is not a market maker in any of the companies mentioned in this report. Noble intends to seek compensation for investment banking services and non-investment banking services (securities and non-securities related) with any or all of the companies mentioned in this report within the next 3 months
ANALYST CREDENTIALS, PROFESSIONAL DESIGNATIONS, AND EXPERIENCE
Senior Equity Analyst focusing on Basic Materials & Mining. 20 years of experience in equity research. BA in Business Administration from Westminster College. MBA with a Finance concentration from the University of Missouri. MA in International Affairs from Washington University in St. Louis. Named WSJ ‘Best on the Street’ Analyst and Forbes/StarMine’s “Best Brokerage Analyst.” FINRA licenses 7, 24, 63, 87
WARNING
This report is intended to provide general securities advice, and does not purport to make any recommendation that any securities transaction is appropriate for any recipient particular investment objectives, financial situation or particular needs. Prior to making any investment decision, recipients should assess, or seek advice from their advisors, on whether any relevant part of this report is appropriate to their individual circumstances. If a recipient was referred to Noble Capital Markets, Inc. by an investment advisor, that advisor may receive a benefit in respect of transactions effected on the recipients behalf, details of which will be available on request in regard to a transaction that involves a personalized securities recommendation. Additional risks associated with the security mentioned in this report that might impede achievement of the target can be found in its initial report issued by Noble Capital Markets, Inc.. This report may not be reproduced, distributed or published for any purpose unless authorized by Noble Capital Markets, Inc..
RESEARCH ANALYST CERTIFICATION
Independence Of View All views expressed in this report accurately reflect my personal views about the subject securities or issuers.
Receipt of Compensation No part of my compensation was, is, or will be directly or indirectly related to any specific recommendations or views expressed in the public appearance and/or research report.
Ownership and Material Conflicts of Interest Neither I nor anybody in my household has a financial interest in the securities of the subject company or any other company mentioned in this report.
Mark Reichman, Senior Research Analyst, Natural Resources, Noble Capital Markets, Inc.
Refer to the bottom of the report for important disclosures
Mining companies outperform the broader market. During the third quarter, mining companies (as measured by the XME) rose 3.3% compared to a decline of 3.6% for the S&P 500 index. The VanEck Vectors Gold Miners (GDX) and Junior Gold Miners (GDXJ) ETFs were down 10.6% and 9.6%, respectively. Gold, silver, and copper futures prices fell 3.3%, 1.6%, and 0.6%, respectively, while zinc and lead were up 8.7% and 6.2%. Gold was likely negatively impacted by the Federal Reserve’s higher rates for longer messaging coupled with a 3.2% increase in the U.S. Dollar Index. Year-to-date through September 30th, the XME, GDX, and GDXJ have all lagged the S&P 500 index return of 11.7%.
Looking ahead to 2024. While we expected weakness in the second half of 2023, prices have remained relatively resilient, and we are increasingly bullish going into 2024. Factors supporting our view include: 1) the Federal Reserve appears to be nearing the end of its tightening cycle, 2) a new norm of heightened geopolitical uncertainty, 3) unsustainable growth in U.S. deficit spending and national debt, and 4) increasing investments in gold by central banks. Given the level of uncertainty reinforced by a dysfunctional U.S. political environment, we think portfolio allocations to precious metals could increase. While much will depend on monetary policy which appears to be working, we think the higher for longer mantra makes for nice messaging but actual policy will be data driven.
Outlook for industrial metals. While a potential economic downturn in the U.S. coupled with sluggish growth abroad could weigh on industrial metals demand and prices, longer-term secular trends such as electrification remain supportive of supply and demand fundamentals for metals such as copper. In the intermediate term, government support for infrastructure spending and strong demand from certain sectors such as aerospace, defense, and electronics are supportive of industrial metals.
Putting it all together. We think precious metals equities may be poised for outperformance in 2024. While well-diversified portfolios should have exposure to precious metals, mining equities may offer a stronger current alternative to bullion. In our opinion, junior companies remain attractive based on valuation and we expect industry consolidation to increase as senior producers seek to replenish reserves and resources. For industrial metals stocks, investors may need to be more selective by focusing on suppliers to end use markets with favorable demand growth fundamentals.
GENERAL DISCLAIMERS
All statements or opinions contained herein that include the words “we”, “us”, or “our” are solely the responsibility of Noble Capital Markets, Inc.(“Noble”) and do not necessarily reflect statements or opinions expressed by any person or party affiliated with the company mentioned in this report. Any opinions expressed herein are subject to change without notice. All information provided herein is based on public and non-public information believed to be accurate and reliable, but is not necessarily complete and cannot be guaranteed. No judgment is hereby expressed or should be implied as to the suitability of any security described herein for any specific investor or any specific investment portfolio. The decision to undertake any investment regarding the security mentioned herein should be made by each reader of this publication based on its own appraisal of the implications and risks of such decision.
This publication is intended for information purposes only and shall not constitute an offer to buy/sell or the solicitation of an offer to buy/sell any security mentioned in this report, nor shall there be any sale of the security herein in any state or domicile in which said offer, solicitation or sale would be unlawful prior to registration or qualification under the securities laws of any such state or domicile. This publication and all information, comments, statements or opinions contained or expressed herein are applicable only as of the date of this publication and subject to change without prior notice. Past performance is not indicative of future results. Noble accepts no liability for loss arising from the use of the material in this report, except that this exclusion of liability does not apply to the extent that such liability arises under specific statutes or regulations applicable to Noble. This report is not to be relied upon as a substitute for the exercising of independent judgement. Noble may have published, and may in the future publish, other research reports that are inconsistent with, and reach different conclusions from, the information provided in this report. Noble is under no obligation to bring to the attention of any recipient of this report, any past or future reports. Investors should only consider this report as single factor in making an investment decision.
IMPORTANT DISCLOSURES
This publication is confidential for the information of the addressee only and may not be reproduced in whole or in part, copies circulated, or discussed to another party, without the written consent of Noble Capital Markets, Inc. (“Noble”). Noble seeks to update its research as appropriate, but may be unable to do so based upon various regulatory constraints. Research reports are not published at regular intervals; publication times and dates are based upon the analyst’s judgement. Noble professionals including traders, salespeople and investment bankers may provide written or oral market commentary, or discuss trading strategies to Noble clients and the Noble proprietary trading desk that reflect opinions that are contrary to the opinions expressed in this research report. The majority of companies that Noble follows are emerging growth companies. Securities in these companies involve a higher degree of risk and more volatility than the securities of more established companies. The securities discussed in Noble research reports may not be suitable for some investors and as such, investors must take extra care and make their own determination of the appropriateness of an investment based upon risk tolerance, investment objectives and financial status.
Company Specific Disclosures
The following disclosures relate to relationships between Noble and the company (the “Company”) covered by the Noble Research Division and referred to in this research report. Noble is not a market maker in any of the companies mentioned in this report. Noble intends to seek compensation for investment banking services and non-investment banking services (securities and non-securities related) with any or all of the companies mentioned in this report within the next 3 months
ANALYST CREDENTIALS, PROFESSIONAL DESIGNATIONS, AND EXPERIENCE
Senior Equity Analyst focusing on Basic Materials & Mining. 20 years of experience in equity research. BA in Business Administration from Westminster College. MBA with a Finance concentration from the University of Missouri. MA in International Affairs from Washington University in St. Louis. Named WSJ ‘Best on the Street’ Analyst and Forbes/StarMine’s “Best Brokerage Analyst.” FINRA licenses 7, 24, 63, 87
WARNING
This report is intended to provide general securities advice, and does not purport to make any recommendation that any securities transaction is appropriate for any recipient particular investment objectives, financial situation or particular needs. Prior to making any investment decision, recipients should assess, or seek advice from their advisors, on whether any relevant part of this report is appropriate to their individual circumstances. If a recipient was referred to Noble Capital Markets, Inc. by an investment advisor, that advisor may receive a benefit in respect of transactions effected on the recipients behalf, details of which will be available on request in regard to a transaction that involves a personalized securities recommendation. Additional risks associated with the security mentioned in this report that might impede achievement of the target can be found in its initial report issued by Noble Capital Markets, Inc.. This report may not be reproduced, distributed or published for any purpose unless authorized by Noble Capital Markets, Inc..
RESEARCH ANALYST CERTIFICATION
Independence Of View All views expressed in this report accurately reflect my personal views about the subject securities or issuers.
Receipt of Compensation No part of my compensation was, is, or will be directly or indirectly related to any specific recommendations or views expressed in the public appearance and/or research report.
Ownership and Material Conflicts of Interest Neither I nor anybody in my household has a financial interest
Michael Heim, CFA, Senior Research Analyst, Noble Capital Markets, Inc.
Refer to the bottom of the report for important disclosures
Oil price rose 30% in the third quarter helping propel the XLE Energy Index up 11.4%. Natural gas prices also rose after twelve months of decline. Higher oil prices reflect declining inventories due to rising demand that is not being met by rising supply.
Domestic oil demand is rising. Oil demand largely tracks the economy. And, while monetary tightening has slowed growth, demand is still growing. Recently, domestic demand has increased due to warm summer weather and increased propane exports to Europe.
Oil supply is not keeping pace. OPEC+ extended its production cuts. In previous decades, domestic producers would respond to production cuts by accelerating drilling. In recent years, producers have not increased drilling as noted by a sharp decline in domestic oil rig activity. Oil drilling rigs even declined this quarter despite the rise in oil prices. Limited drilling, combined with sharper well decline curves, has meant supply is not keeping up with demand.
Small cap producers are uniquely positioned to take advantage of higher prices. The production gains that came from horizontal drilling and fracking in the Permian Basin appear to be waning. That means well profitability has declined as producers move on to secondary and tertiary targets. This is especially an issue for larger production companies that need a large number of wells drilled to provide growth. In addition, large companies face regulatory and investor pressures regarding fossil fuel production that the smaller companies may avoid.
Energy Stocks
Energy stocks, as measured by the XLE Energy Index, rose 11.4% in the 2023 third quarter as compared to a 3.6% decline in the S&P 500 Index. The outperformance was largely due to rising oil prices. The November 2023 futures contract rose 30% during the quarter. Natural gas prices rose 4.9% during the quarter largely reflecting normal seasonal trends.
Oil Prices
The rise in oil prices corresponds to a drop in inventories. After a covid-induced spike in early 2020, domestic inventories have fallen steadily. During this period of monetary tightening, demand growth has slowed but remained positive. Supply, on the other hand, has stagnated. OPEC+ has extended cutbacks and domestic drilling activity has declined.
Figure #1
Source: EIA
The decline in drilling activity can best be seen by looking at domestic oil rig activity. Where once there were more than 1600 active wells, now there are one-third that number. What’s more, oil drilling activity has continued to decline in the third quarter even as oil prices have risen.
Figure #2
Source: Baker Hughes
Weather has also played a part as warm temperatures have meant increased use of oil for electric generations. Although oil represents a small portion of the generation load, it is an important component in the summer months when generation demand is greatest. Temperatures in the United States have been warmer than average each month this summer and 17 of the 24 months over the last four years.
Figure #3
Finally, it is worth noting that petroleum exports have been growing. Exports jumped after the Ukraine invasion as the United States rushed to ship petroleum to Europe to offset Russian supply disruptions. Note the large jump in propane exports since 2021 in the chart below. Propane, a component of the crude oil barrel, is one of the easier fuels to export until additional liquified natural gas export terminals are completed.
Figure #4
The combination of limited drilling, growing demand for electric generation and exports, and OPEC production cuts bodes well for oil prices.
Natural Gas Prices
The story for natural gas is less positive but improving. Sharp declines last winter bottomed out in April and have slowly begun to creep back upward. Natural gas production profitability is not great at prices near $3.00 per thousand cubic feet (mcf) but still profitable.
Figure #5
Source: Nymex, EIA
Outlook
We believe the outlook for energy companies remains favorable. Oil prices are high and do not show signs of falling due to OPEC cuts, reduced domestic drilling and rising demand for power generation and exports. We believe the case for smaller cap energy stocks is especially strong because they are less liquid and slower to react to rising energy prices. Smaller energy companies also face less political and investor pressure to shift away from carbon-based production.
GENERAL DISCLAIMERS
All statements or opinions contained herein that include the words “we”, “us”, or “our” are solely the responsibility of Noble Capital Markets, Inc.(“Noble”) and do not necessarily reflect statements or opinions expressed by any person or party affiliated with the company mentioned in this report. Any opinions expressed herein are subject to change without notice. All information provided herein is based on public and non-public information believed to be accurate and reliable, but is not necessarily complete and cannot be guaranteed. No judgment is hereby expressed or should be implied as to the suitability of any security described herein for any specific investor or any specific investment portfolio. The decision to undertake any investment regarding the security mentioned herein should be made by each reader of this publication based on its own appraisal of the implications and risks of such decision.
This publication is intended for information purposes only and shall not constitute an offer to buy/sell or the solicitation of an offer to buy/sell any security mentioned in this report, nor shall there be any sale of the security herein in any state or domicile in which said offer, solicitation or sale would be unlawful prior to registration or qualification under the securities laws of any such state or domicile. This publication and all information, comments, statements or opinions contained or expressed herein are applicable only as of the date of this publication and subject to change without prior notice. Past performance is not indicative of future results. Noble accepts no liability for loss arising from the use of the material in this report, except that this exclusion of liability does not apply to the extent that such liability arises under specific statutes or regulations applicable to Noble. This report is not to be relied upon as a substitute for the exercising of independent judgement. Noble may have published, and may in the future publish, other research reports that are inconsistent with, and reach different conclusions from, the information provided in this report. Noble is under no obligation to bring to the attention of any recipient of this report, any past or future reports. Investors should only consider this report as single factor in making an investment decision.
IMPORTANT DISCLOSURES
This publication is confidential for the information of the addressee only and may not be reproduced in whole or in part, copies circulated, or discussed to another party, without the written consent of Noble Capital Markets, Inc. (“Noble”). Noble seeks to update its research as appropriate, but may be unable to do so based upon various regulatory constraints. Research reports are not published at regular intervals; publication times and dates are based upon the analyst’s judgement. Noble professionals including traders, salespeople and investment bankers may provide written or oral market commentary, or discuss trading strategies to Noble clients and the Noble proprietary trading desk that reflect opinions that are contrary to the opinions expressed in this research report. The majority of companies that Noble follows are emerging growth companies. Securities in these companies involve a higher degree of risk and more volatility than the securities of more established companies. The securities discussed in Noble research reports may not be suitable for some investors and as such, investors must take extra care and make their own determination of the appropriateness of an investment based upon risk tolerance, investment objectives and financial status.
Company Specific Disclosures
The following disclosures relate to relationships between Noble and the company (the “Company”) covered by the Noble Research Division and referred to in this research report. Noble is not a market maker in any of the companies mentioned in this report. Noble intends to seek compensation for investment banking services and non-investment banking services (securities and non-securities related) with any or all of the companies mentioned in this report within the next 3 months
ANALYST CREDENTIALS, PROFESSIONAL DESIGNATIONS, AND EXPERIENCE
Senior Equity Analyst focusing on Basic Materials & Mining. 20 years of experience in equity research. BA in Business Administration from Westminster College. MBA with a Finance concentration from the University of Missouri. MA in International Affairs from Washington University in St. Louis. Named WSJ ‘Best on the Street’ Analyst and Forbes/StarMine’s “Best Brokerage Analyst.” FINRA licenses 7, 24, 63, 87
WARNING
This report is intended to provide general securities advice, and does not purport to make any recommendation that any securities transaction is appropriate for any recipient particular investment objectives, financial situation or particular needs. Prior to making any investment decision, recipients should assess, or seek advice from their advisors, on whether any relevant part of this report is appropriate to their individual circumstances. If a recipient was referred to Noble Capital Markets, Inc. by an investment advisor, that advisor may receive a benefit in respect of transactions effected on the recipients behalf, details of which will be available on request in regard to a transaction that involves a personalized securities recommendation. Additional risks associated with the security mentioned in this report that might impede achievement of the target can be found in its initial report issued by Noble Capital Markets, Inc.. This report may not be reproduced, distributed or published for any purpose unless authorized by Noble Capital Markets, Inc..
RESEARCH ANALYST CERTIFICATION
Independence Of View All views expressed in this report accurately reflect my personal views about the subject securities or issuers.
Receipt of Compensation No part of my compensation was, is, or will be directly or indirectly related to any specific recommendations or views expressed in the public appearance and/or research report.
Ownership and Material Conflicts of Interest Neither I nor anybody in my household has a financial interest in the securities of the subject company or any other company mentioned in this report.
Today’s news brings the release of the August data for the Personal Consumption Expenditures (PCE) Index by the U.S. Bureau of Economic Analysis. This report, a crucial indicator of inflation and consumer spending in the United States, has set a positive tone for financial markets as they rally in early trading.
In August, the PCE Index recorded a year-over-year growth rate of 3.5%, showing a modest increase from the previous month’s 3.4%. On a monthly basis, the core PCE, the Federal Reserve’s preferred measure of inflation, inched up by 0.1%, slightly lower than the 0.2% increase in July.
The Federal Reserve has long regarded the core PCE as its favored measure of inflation. While the August PCE report has provided insight into inflation trends, it’s important to note that the Fed made a decision to keep interest rates steady earlier this week. Federal Reserve Chair Jerome Powell consistently references the core PCE figures when assessing inflation. Powell has emphasized that inflation remains above the Fed’s 2% target, which has informed the central bank’s recent decision to maintain interest rates within a range of 5.25%-5.50%. This decision underscores the Fed’s cautious approach to managing inflation while fostering economic growth.
Historically, PCE reports have played a significant role in guiding monetary policy and influencing market dynamics. When inflationary pressures rise, the Fed may respond by raising interest rates to curb price increases. Conversely, when PCE growth moderates, the central bank may opt for rate cuts to stimulate economic activity.
While the report suggests a slower pace of inflation growth in August compared to July, inflation remains a pertinent issue. Investors will closely monitor subsequent reports and Federal Reserve actions to gain insight into the trajectory of inflation and its potential impact on financial markets and the broader economy. The early market rally reflects the market’s optimism following the release of the latest PCE data, as it continues to navigate the evolving economic landscape.
Blue Apron Holdings, Inc. (Nasdaq: APRN), a pioneer in the meal kit industry, has announced a definitive merger agreement with Wonder Group, a company founded by entrepreneur Marc Lore, known for redefining at-home dining and food delivery. The merger agreement, unanimously approved by Blue Apron’s Board of Directors, is set to create a leading mealtime platform and offers Blue Apron stockholders $13.00 per share in cash, totaling approximately $103 million.
Blue Apron’s merger agreement with Wonder Group comes as part of a strategic shift for the company, which had recently transitioned to an asset-light business model following the sale of its operational infrastructure and a strategic partnership with FreshRealm. The $13.00 per share purchase price represents a substantial 137% premium to the closing price on September 28, 2023, and a noteworthy 77% premium to the 30-day volume-weighted average price of the company’s Class A common stock.
Wonder’s acquisition of Blue Apron aims to revolutionize mealtime, offering consumers greater choice, flexibility, and convenience through their combined brands. The partnership is expected to enhance both companies’ abilities to provide chef-curated meals with high-quality ingredients to a broader customer base across the United States. Following the completion of the transaction, Wonder intends to maintain Blue Apron’s current nationwide operations under the Blue Apron brand, leveraging synergies between consumer-facing apps and delivery logistics.
Linda Findley, President, and CEO of Blue Apron, expressed her excitement about the merger, stating, “The Blue Apron brand and products that our customers know and love will stay the same, with more opportunity for product expansion in the future. Further, the transaction delivers immediate and certain value for Blue Apron stockholders at a significant premium over recent trading prices.”
Marc Lore, Founder and CEO of Wonder Group, also shared his enthusiasm for the partnership, saying, “We couldn’t be more excited to welcome Blue Apron to the Wonder platform and look forward to working with Linda and her exceptional team.”
In response to this significant development, Blue Apron shares have surged by over 130% today, reflecting investor optimism about the merger agreement. This marks a remarkable shift in fortunes for the company, which had faced challenges since its initial public offering in 2017. Year-to-date, Blue Apron shares had been down by 44%.
Since its initial public offering in 2017, Blue Apron has faced numerous challenges that have significantly impacted its fortunes. Despite having achieved a valuation of $2 billion just six years ago, the company encountered hurdles including layoffs, struggles in expanding its customer base, and fierce competition from industry giants such as Amazon and Kroger. While Blue Apron experienced a brief boost in demand during the height of the COVID-19 pandemic, this momentum proved challenging to sustain. Today’s merger agreement with Wonder Group represents a pivotal moment for the pioneering meal kit company, offering the potential for renewed growth and innovation in an evolving food delivery landscape. The acquisition of Blue Apron by Wonder Group represents a pivotal moment for the pioneering meal kit company. Blue Apron’s merger with Wonder is set to redefine at-home dining and food delivery, offering customers enhanced mealtime experiences with chef-curated meals. The substantial premium offered to Blue Apron stockholders demonstrates the confidence in this strategic partnership. As Blue Apron transitions into the Wonder platform, it will be interesting to observe how this union revitalizes the company and expands its presence in the evolving food delivery landscape.
LAKE ZURICH, Ill.–(BUSINESS WIRE)– ACCO Brands Corporation (NYSE: ACCO) a leading global consumer, technology, and business branded products company, today published its 2022 Environmental, Social and Governance (ESG) Report.
“At ACCO Brands, we are committed to operating our business with the highest ethical standards. We foster accountability to our stakeholders with strong governance and risk management policies and practices,” noted Tom Tedford, President, and Chief Operating Officer. “Our ESG report highlights our progress in delivering on our commitments to our employees, the environment, and the communities in which we live and work. Our work is organized under the pillars of People, Planet and Products and is guided by our long-standing values: to act with integrity, embrace diversity and act responsibly in our global community,” concluded Mr. Tedford.
To access the Company’s 2022 ESG Report and learn more about the Company’s ESG efforts, read the full report by clicking here.
About ACCO Brands
ACCO Brands, the Home of Great Brands Built by Great People, designs, manufactures and markets consumer and end-user products that help people work, learn, play and thrive. Our widely recognized brands include AT-A-GLANCE®, Five Star®, Kensington®, Leitz®, Mead®, PowerA®, Swingline®, Tilibra® and many others. More information about ACCO Brands Corporation (NYSE: ACCO) can be found at www.accobrands.com.
Lori Conley Corporate Communications lori.conley@acco.comSource: ACCO Brands Corporation
Schwazze (OTCQX:SHWZ, NEO:SHWZ) is building a premier vertically integrated regional cannabis company with assets in Colorado and New Mexico and will continue to take its operating system to other states where it can develop a differentiated regional leadership position. Schwazze is the parent company of a portfolio of leading cannabis businesses and brands spanning seed to sale. The Company is committed to unlocking the full potential of the cannabis plant to improve the human condition. Schwazze is anchored by a high-performance culture that combines customer-centric thinking and data science to test, measure, and drive decisions and outcomes. The Company’s leadership team has deep expertise in retailing, wholesaling, and building consumer brands at Fortune 500 companies as well as in the cannabis sector. Schwazze is passionate about making a difference in our communities, promoting diversity and inclusion, and doing our part to incorporate climate-conscious best practices.
Joe Gomes, Managing Director, Equity Research Analyst, Generalist , Noble Capital Markets, Inc.
Joshua Zoepfel, Research Associate, Noble Capital Markets, Inc.
Refer to the full report for the price target, fundamental analysis, and rating.
Insider Buying. From August 15th through August 26th, Schwazze Director Jeff Garwood purchased 128,155 SHWZ shares on the open market at prices ranging from $0.65 to $0.75 per share. The additional purchases increased Mr. Garwood’s overall Schwazze common stock ownership to 452,783 shares. We positively view insiders putting their own money into share purchases.
Garwood Background. Mr. Garwood joined the Schwazze Board in March 2021, Mr. Garwood is the founder and is currently the managing member of Liberation Capital, LLC, a private equity fund that is focused on providing modular, repeatable waste to value project finance. Prior to Liberation Capital, Mr. Garwood held a variety of senior leadership positions with General Electric including President and CEO of GE Water and Process Technologies, and President and CEO of GE Fanuc. He was also President of Garrett Aviation, and worked for numerous years at the strategic consulting firm McKinsey and Company.
Equity Research is available at no cost to Registered users of Channelchek. Not a Member? Click ‘Join’ to join the Channelchek Community. There is no cost to register, and we never collect credit card information.
This Company Sponsored Research is provided by Noble Capital Markets, Inc., a FINRA and S.E.C. registered broker-dealer (B/D).
*Analyst certification and important disclosures included in the full report. NOTE: investment decisions should not be based upon the content of this research summary. Proper due diligence is required before making any investment decision.