WEST HARRISON, N.Y.–(BUSINESS WIRE)– Sky Harbour Group Corporation (NYSE: SKYH, SKYH WS) (“SHG” or the “Company”), an aviation infrastructure company building the first nationwide network of Home Base Operator (HBO) campuses for business aircraft, announced the release of its audited financial results for the year ended December 31, 2025 on Form 10-K. The Company also announced the filing of its unaudited financial results for the year ended December 31, 2025 for Sky Harbour Capital (Obligated Group) with MSRB/EMMA. Please see the following links to access the filings:
Financial Highlights on a Consolidated Basis include:
Constructed Assets or In-Construction exceeded $328 million as of December 31, 2025.
2025 full-year consolidated revenues increased 87% as compared to the prior year.
Net cash used in operating activities was reported at $2.3 million for 2025, versus $9.1 million used in 2024.
Strong liquidity and capital resources consisted of consolidated cash and U.S. Treasuries totaling $48 million and $200 million of availability under the J.P. Morgan term bank facility as of December 31st, 2025.
Refer to 10-K for presentation of full-year GAAP net income and Adjusted EBITDA (Non-GAAP) results.
Sky Harbour met guidance of reaching operating cash flow/adjusted EBITDA run-rate breakeven on a consolidated basis by year end 2025, driven by the positive cash flows generated from campuses opened in 2025 and the receipt last December of $5.9 million in upfront rent payment as part of a single hangar lease renewal.
Financial Highlights at Sky Harbour Capital (Obligated Group) include:
Full year Obligated Group Revenues increased 49% in 2025 as compared to 2024.
Net cash provided by operating activities reached positive $15.7 million in 2025, an increase from $6.5 million in 2024, driven by new campus openings, increased occupancy, increased rents and the upfront receipt of $5.9 million in rent in December 2025 as part of a lease extension with an existing tenant.
Debt Service Coverage Tests, calculated as per the Bond Indenture for the period ending December 31, 2025, and as budgeted for 2026, are both in compliance with covenant ratios.
Cash and U.S. Treasuries at the Obligated Group totaled $24 million as of December 31, 2025, with the future capital expenditures on the remaining construction at OPF phase II and Addison phase II to be covered from expected Obligated Group revenues through the end of construction, proceeds of the 2026 Series Bonds and capital contributions from the Company as needed.
Update on Site Acquisition
Sky Harbour currently has campuses operating at Houston’s Sugar Land Regional Airport (SGR), Nashville International Airport (BNA), Miami Opa-Locka Executive Airport (OPF), San Jose Mineta International Airport (SJC), Camarillo Airport (CMA), Phoenix Deer Valley Airport (DVT) Dallas’s Addison Airport (ADS), and Denver’s Centennial Airport (APA).
Sky Harbour currently has campuses in construction at Bradley International Airport (BDL), Salt Lake City International Airport (SLC), the second phase at OPF, and the second phase at ADS and campuses in development at Chicago Executive Airport (PWK), Hudson Valley Regional Airport (POU), New York Stewart International Airport (SWF), Orlando Executive Airport (ORL), Dulles International Airport (IAD), Trenton-Mercer Airport (TTN), Portland-Hillsboro Airport (HIO), Long Beach Airport (LGB), and Fort Worth Meacham International Airport (FTW).
We met our prior guidance of nine additional ground leases in 2025, for a total portfolio of 23 airport ground leases announced by year end. In addition, we secured new land leases at two existing airports. Once fully developed, the 23 ground leases are expected to include approximately 4 million in aggregate rentable square feet.
Update on Construction and Development Activities
As reported on our monthly construction reports filed with MSRB/EMMA and available on our website, the first phases at DVT, APA and ADS were completed and began operations in 2025. We are currently in construction at the second phases at OPF and ADS as well as BDL in Hartford, CT, and SLC in Salt Lake City, UT. Please see the following link for the last month construction report: https://emma.msrb.org/P11937008-P11478849-P11929703.pdf
Phase I in POU, ORL and TTN are expected to start construction in the coming months. The Company has significantly increased resources dedicated to development and construction in anticipation of the upcoming surge in activity.
Update on Leasing Activities
Occupancy is at or near 100% in all campuses opened prior to 2025, with the newer campuses at DVT, ADS and APA at 77%, 84%, and 35% respectively as of March 16th, 2026.
The pre-leasing program is now in operation, with leases and LOIs in place at some of the campuses in development.
Update on Airport Operations
During the fourth quarter the Company focused on optimizing their recently opened campuses as occupancy increased, and on launching portfolio-wide initiatives to deliver superior service and safety while targeting improved cost efficiencies.
Funding and Capital Formation
In September 2025, Sky Harbour completed the previously announced $200 million 5-year SOFR based bank facility with J.P. Morgan (“JPMorgan Facility”). We also entered into a floating-for-fixed interest rate swap with an affiliate of J.P. Morgan that effectively locked in the cost of our draws to approximately 4.73%. Although there were no draws at year end, we have subsequently drawn $17.9 million as of March 15th, 2026 to cover capital expenditures at BDL and to reimburse ourselves for a portion of the issuance costs. We expect to continue to draw in the coming weeks and months as we accelerate our construction program.
On February 12, 2026, we closed on a $150 million private activity tax-exempt financing issued through the Public Finance Authority (the “2026 Series Bonds”). The 2026 Series Bonds were issued at par with a 6.00% fixed interest rate, are subordinated to the 2021 Series Bonds and the JPMorgan Facility and have a mandatory tender on January 1, 2031 (5-year financing). We have invested the net proceeds of the 2026 Series Bonds in short and medium US Treasury bills and notes until these funds are used to fund capital expenditures or pay interest on the bonds.
The combined net proceeds of this issuance are expected to be combined with the expected draws from the JPMorgan Facility and other available cash to fully fund the capital expenditures of our next six projects totaling over one million of rentable hangar square footage. Combined with the existing or soon to be completed one million rentable square feet of hangar space, our funded projects total over 2.1 million rentable square feet.
CEO, Tal Keinan commented: “The Company is generating operating cash at an increasing rate as additional hangar campuses come online. More than 1,000,000 square feet of new hangar development is fully funded, and our construction resources are prepared to meet the upcoming surge with growing speed and cost-efficiency. The Sky Harbour HBO offering is the solution of choice for the country’s top flight departments. Our focus for 2026 is scale.”
About Sky Harbour
Sky Harbour Group Corporation is an aviation infrastructure company developing the first nationwide network of Home-Basing campuses for business aircraft. The company develops, leases, and manages general aviation hangar campuses across the United States. Sky Harbour’s Home-Basing offering aims to provide private and corporate residents with the best physical infrastructure in business aviation, coupled with dedicated service, tailored specifically to based aircraft, offering the shortest time to wheels-up in business aviation. To learn more, visit www.skyharbour.group.
Forward Looking Statements
Certain statements made in this release are “forward looking statements” within the meaning of the “safe harbor” provisions of the United States Private Securities Litigation Reform Act of 1995, including statements about the financial condition, results of operations, earnings outlook and prospects of SHG, including statements regarding our expectations for future results, our expectations for future ground leases, our expectations on future construction and development activities and lease renewals, and our plans for future financings. When used in this press release, the words “plan,” “believe,” “expect,” “anticipate,” “intend,” “outlook,” “estimate,” “forecast,” “project,” “continue,” “could,” “may,” “might,” “possible,” “potential,” “predict,” “should,” “would” and other similar words and expressions (or the negative versions of such words or expressions) are intended to identify forward-looking statements, but the absence of these words does not mean that a statement is not forward-looking. The forward-looking statements are based on the current expectations of the management of Sky Harbour Group Corporation (the “Company”) as applicable and are inherently subject to uncertainties and changes in circumstances. These forward-looking statements involve a number of risks, uncertainties or other assumptions that may cause actual results or performance to be materially different from those expressed or implied by these forward-looking statements. For more information about risks facing the Company, see the Company’s annual report on Form 10-K for the year ended December 31, 2025 and other filings the Company makes with the SEC from time to time. The Company’s statements herein speak only as of the date hereof, and the Company undertakes no obligation to update or revise any forward-looking statements, whether as a result of new information, future events or otherwise, except as required by law.
Key Performance Indicators
We use a number of metrics, including annualized revenue run rate per leased rentable square foot, to help us evaluate our business, measure our performance, identify trends affecting our business, formulate business plans, and make strategic decisions. Our key performance indicators may be calculated in a manner different than similar key performance indicators used by other issuers. These metrics are estimated operating metrics and not projections, nor actual financial results, and are not indicative of current or future performance.
Reported updated results from 12 patients with type 1 diabetes treated with tegoprubart following islet transplantation in UChicago Medicine-led study
Presented 24-month follow-up data from Phase 1b long-term extension study which continues to support the favorable safety and tolerability profile of tegoprubart
Tegoprubart granted Orphan Drug designation by the FDA for the prevention of allograft rejection in liver transplantation
IRVINE, Calif., March 19, 2026 (GLOBE NEWSWIRE) — Eledon Pharmaceuticals, Inc. (“Eledon”) (Nasdaq: ELDN) today reported its fourth quarter and full year 2025 operating and financial results and reviewed recent business highlights.
“Over the past year, Eledon has made significant progress advancing tegoprubart, our anti-CD40L antibody, as a potential next-generation immunosuppressive therapy across multiple transplantation settings,” said David-Alexandre C. Gros, M.D., Chief Executive Officer of Eledon. “The over 100 patients treated across our transplantation programs to date provide a growing body of evidence that reinforces our conviction that tegoprubart can address key safety and efficacy issues with current standard-of-care transplant immunosuppression. Looking ahead, we anticipate multiple important milestones this year, including regulatory engagement to support advancement into Phase 3 development in kidney transplantation, initiation of an additional islet transplantation trial in type 1 diabetes, and the start of a clinical trial in liver transplantation.”
Fourth Quarter 2025 and Recent Corporate Developments
Announced that tegoprubart has been granted Orphan Drug designation by the U.S. Food and Drug Administration (FDA) for the prevention of allograft rejection in liver transplantation. Tegoprubart previously received Orphan Drug designation from the FDA for the prevention of allograft rejection in pancreatic islet cell transplantation and for the treatment of amyotrophic lateral sclerosis (ALS).
Presented 24-month follow-up data from eight patients enrolled in the Phase 1b long-term extension trial evaluating tegoprubart in kidney transplantation at the American Society of Transplant Surgeons Winter Symposium. The data continue to support the favorable safety and tolerability profile of tegoprubart with no episodes of biopsy-proven acute rejection, graft loss, death, new-onset diabetes mellitus, or de novo donor-specific antibody formation reported during the study period. Mean estimated glomerular filtration rate (eGFR) increased over the measurement period, from 67.0 mL/min/1.73 m² at 12 months to 74.2 mL/min/1.73 m² at 24 months.
Reported updated results from 12 patients with type 1 diabetes treated with tegoprubart as the core immunosuppressant following islet transplantation in an investigator-initiated trial conducted at the University of Chicago Medicine Transplant Institute. All 10 patients who were more than four weeks post-transplant achieved 100% insulin independence and a most recent hemoglobin A1C (HbA1c) below 6.0%, with a mean most recent HbA1c across the 10 patients of approximately 5.35%. Tegoprubart-based immunosuppression was generally well tolerated with reported post-transplant immunosuppression-related adverse events successfully treated by lowering the mycophenolic acid dose, if necessary. There were no rejection episodes, and no patients developed de novo donor-specific HLA antibodies. Additionally, no evidence of nephrotoxicity, hypertension or neurotoxicity, which are commonly associated with tacrolimus-based immunosuppression regimens, was observed. The study continues to generate significant patient demand with inquiries received from several hundred T1D patients.
Anticipated Upcoming Milestones
Receive FDA guidance on the Phase 3 trial design assessing tegoprubart in kidney transplantation, followed by initiation of the Phase 3 trial pending regulatory alignment.
Report long-term data from Phase 1 and Phase 2 BESTOW studies evaluating tegoprubart in kidney transplantation.
Receive FDA regulatory guidance on path to market for tegoprubart in islet cell transplantation and xenotransplantation.
Initiate an investigator-led study evaluating tegoprubart for the prevention of organ rejection in patients with renal dysfunction receiving an islet cell transplant.
Initiate an investigator-led study evaluating tegoprubart for the prevention of organ rejection in patients receiving a de novo liver transplant.
Initiate an investigator-led study evaluating tegoprubart for kidney transplant tolerance induction.
Full Year 2025 Financial Results
Research and development (R&D) expenses for the year ended December 31, 2025 were $66.3 million, including $4.2 million of non-cash stock-based compensation expense, compared to $52.0 million, including $4.3 million of non-cash stock-based compensation expense, for the comparable period in 2024. The increase was primarily driven by continued advancement of the tegoprubart clinical development programs, including expanded clinical trial activity and manufacturing scale-up, as well as increased personnel to support these efforts.
General and administrative expenses for the year ended December 31, 2025 were $17.0 million, including $6.2 million of non-cash stock-based compensation expense, compared to $18.6 million, including $8.8 million of non-cash stock-based compensation expense, for the comparable period in 2024. The decrease was primarily driven by lower stock-based compensation expense, partially offset by higher professional services and personnel-related costs.
Net loss for the year ended December 31, 2025 was $45.6 million, or $0.52 per basic share of common stock, compared to a net loss of $36.2 million, or $0.66 per basic share of common stock, for the comparable period in 2024. The 2025 net loss included a non-cash gain of $33.4 million from changes in the fair value of warrant liabilities, while the 2024 net loss included a non-cash gain of $30.9 million from such changes. Excluding the non-cash items related to changes in the fair value of warrant liabilities, Eledon would have recorded a net loss of $79.1 million for the year ended December 31, 2025 and $67.1 million for the year ended December 31, 2024.
About Eledon Pharmaceuticals and tegoprubart
Eledon Pharmaceuticals, Inc. is a clinical stage biotechnology company that is developing immune-modulating therapies for the management and treatment of life-threatening conditions. The Company’s lead investigational product is tegoprubart, an anti-CD40L antibody with high affinity for the CD40 Ligand, a well-validated biological target that has broad therapeutic potential. The central role of CD40L signaling in both adaptive and innate immune cell activation and function positions it as an attractive target for non-lymphocyte depleting, immunomodulatory therapeutic intervention. The Company is building upon a deep historical knowledge of anti-CD40 Ligand biology to conduct preclinical and clinical studies in kidney allograft transplantation, xenotransplantation, islet cell transplantation, liver transplantation and amyotrophic lateral sclerosis (ALS). Eledon is headquartered in Irvine, California. For more information, please visit the Company’s website at www.eledon.com.
Follow Eledon Pharmaceuticals on social media: LinkedIn; Twitter
Forward-Looking Statements
This press release contains forward-looking statements that involve substantial risks and uncertainties. Any statements about the company’s future expectations, plans and prospects, including statements about planned clinical trials, the development of product candidates, expected timing for initiation of future clinical trials, expected timing for receipt of data from clinical trials, the company’s capital resources and ability to finance planned clinical trials, as well as other statements containing the words “believes,” “anticipates,” “plans,” “expects,” “estimates,” “intends,” “predicts,” “projects,” “targets,” “looks forward,” “could,” “may,” and similar expressions, constitute forward-looking statements within the meaning of the Private Securities Litigation Reform Act of 1995. Forward-looking statements are inherently uncertain and are subject to numerous risks and uncertainties, including: our short operating history and shifts in our business strategy; our operating losses since inception; our need for additional funding to develop our lead drug candidate and our ability to secure additional funding on acceptable terms or at all; the impact of issuances of our common stock, including in the possibility of dilution or a decline in our stock price; our ability to successfully develop our product candidates; unfavorable global economic and financial market conditions; the regulatory environment of our business and our ability to obtain required regulatory approvals; results of non-clinical studies and clinical trials, and risks that non-clinical studies or early clinical trials may not be predictive of results of later-stage clinical trials; delays or difficulties in enrollment of patients in clinical trials; our ability to attract and retain our executives and key employees; legislation of the pharmaceutical and healthcare industries; cybersecurity and data privacy risks; the ability of our products to achieve marketing approval; competition in our industry; our ability to obtain insurance coverage; our dependence on contract research organizations; our ability to protect our intellectual property; public health crises; our ability to maintain proper and effective internal control over financial reporting and other risks disclosed in our Annual Report on Form 10-K for the year ended December 31, 2025, filed with the Securities and Exchange Commission on March 19, 2026. Actual results may differ materially from those indicated by such forward-looking statements as a result of various factors. These risks and uncertainties, as well as other risks and uncertainties that could cause the company’s actual results to differ materially from the forward-looking statements contained herein, are discussed in our Annual 10-K, and other filings with the U.S. Securities and Exchange Commission, which can be found at www.sec.gov. Any forward-looking statements contained in this press release speak only as of the date hereof and not of any future date, and the company expressly disclaims any intent to update any forward-looking statements, whether as a result of new information, future events or otherwise.
CULVER CITY, Calif., March 19, 2026 (GLOBE NEWSWIRE) — Snail, Inc. (Nasdaq: SNAL) (“Snail Games” or the “Company”), a leading global independent developer and publisher of interactive digital entertainment, today announced financial results for the fourth quarter and full year ended December 31, 2025.
Fourth Quarter 2025 and Recent Operational Highlights
ARK Franchise Updates:
ARK: Survival Evolved (“ASE”):
Units sold were approximately 579,248 for the fourth quarter 2025
During the fourth quarter of 2025, average daily active users (“DAU”) was 105,468 and peak DAU was 137,404
ARK: Survival Ascended (“ASA”):
Units sold were approximately 691,872 for the fourth quarter 2025
During the fourth quarter of 2025, average DAU was 91,123 and peak DAU was 147,572
Launched ARK Lost Colony DLC
Launched ‘ARK x Teenage Mutant Ninja Turtles’ Cosmetic Pack in collaboration with Look North World
ARK: Ultimate Mobile Edition (“ARK Mobile”):
Surpassed 10 million downloads as of December 31, 2025
During the fourth quarter of 2025, average DAU was 129,861
2026 / 2027 ASA Content Roadmap
2026
ARK World Creator (scheduled for May 2026)
ARK Bob’s True Tales – Tides of Fortune (scheduled for June 2026)
ARK Genesis Part 1 (ASA remake)
ARK Survival of the Fittest (“SOTF”)
ARK Dragontopia (scheduled for December 2026)
2027
ARK Atlantis
ARK Bob’s True Tales – Galaxy Wars
ARK Legacy of Santiago
Game Portfolio Updates:
2026 Games Developers Conference (“GDC”)
Introduced PixARK Worlds, a new title in development that features revolutionary user-generated content designed to expand the ARK universe onto the Nintendo Switch 2
Revealed event-exclusive trailer for upcoming AAA title For The Stars
Unveiled new indie title, Gobby Gang
Bellwright surpassed 1 million downloads on Steam Early Access, announced console port plans to Xbox and PlayStation, and launched the Maiden Voyage update. Following the launch of the update, the title achieved its highest Steam concurrent user peak of the year and sold over 166,000 units in Q4 2025
Launched Echoes of Elysium on Steam Early Access in partnership with Loric Games
Participated in the Steam Winter Sale, resulting in double digit sales multiples for ASA and Bellwright
Launched Rebel Engine in partnership with Seven Leaf Clover. The title demonstrated notable creator engagement, partnering with VTuber Hakos Baelz and Spanish gaming creator Joseju
Announced strategic collaboration with Noiz at TwitchCon to strengthen gaming portfolio visibility with streamers
Business Updates:
Minted the first official $USDO stablecoin during the Company’s December 2025 Investor Day
Debuted Golden Poop, a commemorative digital meme collectible created to humorously acknowledge gaming culture and industry satire
As of December 31, 2025, SaltyTV released 100+ short film dramas
Three of SaltyTV’s titles were recognized by the International Short Drama Association:
My Ex’s Best Friend recognized for Best Revenge-Driven Narrative
Hollywood Heartthrob recognized for Most Charismatic Screen Presence
Faux Fiancé recognized for Best Destiny-Bound Narrative
Management Commentary
“The fourth quarter provided strong visibility into the momentum we expect across the ARK franchise over the next two years. In addition to launching ARK: Lost Colony, ASA’s first standalone DLC expansion pack, we introduced robust ASA content and DLC roadmap during our December Investor Day. The 2026 slate includes the ARK SOTF remake, ARK World Creator for consoles,ARK Bob’s True Tales – Tides of Fortune, the ASA remake of ARK Genesis Part 1, and ARK:Dragontopia. Since launching in October 2023, ASA has surpassed 4 million units sold, and our expanded roadmap reflects our commitment to sustained franchise growth and increased revenue visibility through 2027.
“Beyond ARK, we are continuing to invest, advance, and scale our broader game portfolio. We are particularly encouraged by the meaningful progress made across our developing AAA games; For The Stars, Nine Yin Sutra: Immortal, and Nine Yin Sutra: Wushu. AAA games are high-budget, high-profile projects that are designed to deliver expansive worlds, cutting-edge visuals, and robust marketing campaigns that far exceed those of typical indie releases. These games, while still in development, represent Snail’s investment and expansion into other AAA games outside of ASE and ASA. These three games have represented a core pillar of our long-term investment strategy over the past few years. Being classified as an AAA game, we believe these titles offer substantial upside with an attractive profit margin profile compared to many of our other games. The progress made has been encouraging, and we are excited to continue developing and sharing updates. At the recent GDC event, we shared an event-exclusive trailer for For The Stars that provided some early insights into the gameplay and concept art.
“Across our other business units, we also made meaningful progress. We minted the first official $USDO stablecoin during the Investor Day and debuted the Golden Poop digital collectible coin. We are currently working towards a potential partnership opportunity tied to our stablecoin initiative and look forward to sharing additional information later this year. Within our short film vertical, SaltyTV has now released 100+ short film dramas, with three productions receiving recognition from the International Short Drama Association. Our Interactive Films division also expanded into narrative-driven game development in 2025, which we view as a strategic adjacency that builds on existing creative capabilities.
“We remain excited about our gaming pipeline for the next two years. ARK will continue to remain the foundational backbone of our company, while we also invest in and grow other arms of the business. Many of our projects are approaching the final stages of development, and we believe we are well-positioned to broaden our portfolio, diversify revenue streams, and drive long-term shareholder value.”
Fourth Quarter 2025 Financial Highlights
Net revenues were $25.1 million compared to $26.2 million in the same period last year. The decrease was primarily due to a decrease in deferred revenues that were recognized in 2025 of $3.5 million, partially offset by increases in ARK sales of $1.3 million and an increase in Bellwright sales of $1.2 million.
Total units sold were 1.5 million units compared to 1.3 million units in the same period last year, primarily driven by an increase in sales of ASA of 0.2 million units, an increase in Bellwright sales of 0.1 million units, partially offset by a decrease in sales of ASE and our other titles of 0.1 million units.
Net loss was $(0.9) million compared to net income of $1.1 million in the same period last year, primarily due to a decrease in gross profit of $1.7 million and an increase in operating expenses of $2.8 million, partially offset by an increase in other income (expense) of $2.0 million and benefit from income taxes of $0.5 million.
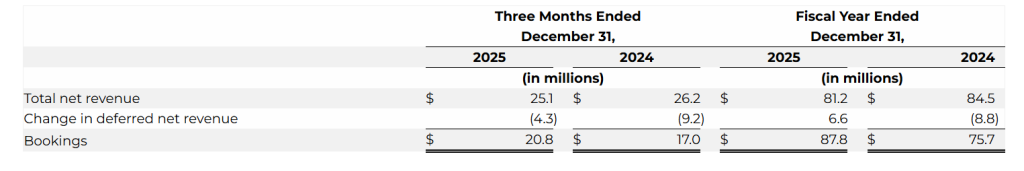
Bookings were $20.8 million compared to $17.0 million in the same period last year. The increase was primarily due to a lower portion of sales deferred in 2025. Changes in deferred revenues decreased by $4.9 million while net revenue decreased $1.1 million.
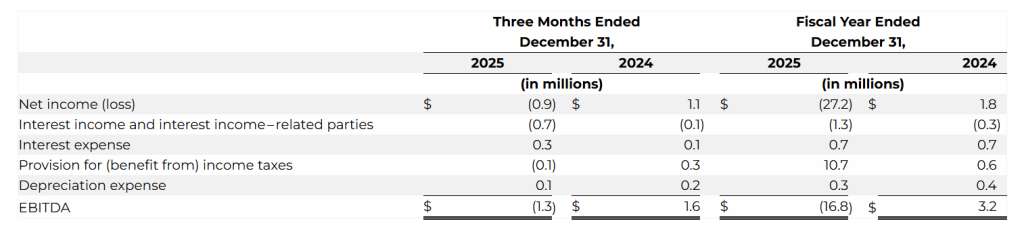
EBITDA was $(1.3) million compared to $1.6 million in the same period last year. The decrease was primarily due to an increase in operating expenses of $2.8 million.
As of December 31, 2025, unrestricted cash was $8.6 million compared to $7.3 million as of December 31, 2024.
Full Year 2025 Financial Highlights
Net revenues were $81.2 million compared to $84.5 million in the same period last year. The decrease was primarily due to a decrease in recognition of deferred revenues of $15.5 million related to the ARK franchise, decrease in Bellwright and Myth of Empires sales of $1.5 million and $1.3 million respectively, partially offset by an increase in ASA sales of $11.3 million, ARK Mobile sales of $2.4 million, and revenue generated from the SaltyTV application of $0.8 million.
Total units sold increased 32.7% to 6.3 million units compared to 4.7 million units in the same period last year, primarily driven by an increase in ARK franchise units sold by 1.7 million units, partially offset by a slight decrease in Bellwright and West Hunt sales of 0.1 million units.
Net loss was $(27.2) million compared to net income of $1.8 million in the same period last year, primarily due to a non-cash tax expense related to the full valuation of our deferred tax assets of $10.1 million, increase in general and administrative expenses of $5.2 million, increase in research and development of $2.9 million, increase in advertising and marketing of $3.7 million, and impairment expenses of $1.5 million.
Bookings increased 16.2% to $87.8 million compared to $75.7 million in the same period last year. The increase was primarily due to the increased ASA sales driven by the launch of ARK: Lost Colony, ARK: Astraeos, and ASE’s first sales event in June 2025 since the price drop in August 2023.
EBITDA was $(16.8) million compared to $3.2 million in the same period last year. The decrease was due to the increase in general and administrative expenses of $5.2 million, an increase in research and development of $2.9 million, an increase in advertising and marketing of $3.7 million and an additional $1.5 million in impairment expenses.
Use of Non-GAAP Financial Measures
In addition to the financial results determined in accordance with U.S. generally accepted accounting principles, or GAAP, Snail believes Bookings and EBITDA, as non-GAAP measures, are useful in evaluating its operating performance. Bookings and EBITDA are non-GAAP financial measures that are presented as supplemental disclosures and should not be construed as alternatives to net income (loss) or revenue as indicators of operating performance, nor as alternatives to cash flow provided by operating activities as measures of liquidity, both as determined in accordance with GAAP. Snail supplementally presents Bookings and EBITDA because they are key operating measures used by management to assess financial performance. Bookings adjusts for the impact of deferrals and, Snail believes, provides a useful indicator of sales in a given period. Management believes Bookings and EBITDA are useful to investors and analysts in highlighting trends in Snail’s operating performance, while other measures can differ significantly depending on long-term strategic decisions regarding capital structure, the tax jurisdictions in which Snail operates and capital investments.
Bookings is defined as the net amount of products and services sold digitally or physically in the period. Bookings is equal to revenues, excluding the impact from deferrals. Below is a reconciliation of total net revenue to Bookings, the closest GAAP financial measure.
We define EBITDA as net income (loss) before (i) interest expense, (ii) interest income, (iii) provision for (benefit from) income taxes and (iv) depreciation expense. The following table provides a reconciliation from net income (loss) to EBITDA:
Webcast Details
The Company will host a webcast at 4:30 PM ET today to discuss its fourth quarter and full year 2025 financial and operational results. Participants may access the live webcast and replay via the link here or on the Company’s investor relations website at https://investor.snail.com/.
Forward-Looking Statements
This press release contains statements that constitute forward-looking statements. Many of the forward-looking statements contained in this press release can be identified by the use of forward-looking words such as “anticipate,” “believe,” “could,” “expect,” “should,” “plan,” “intend,” “may,” “predict,” “continue,” “estimate” and “potential,” or the negative of these terms or other similar expressions. Forward-looking statements appear in a number of places in this press release and include, but are not limited to, statements regarding Snail’s intent, belief or current expectations. These forward-looking statements include information about possible or assumed future results of Snail’s business, financial condition, results of operations, liquidity, plans and objectives. The statements Snail makes regarding the following matters are forward-looking by their nature: Snail’s 2026 / 2027 ASA content roadmap; plans to port Bellwright to the Xbox and Playstation consoles; Snail’s announced strategic collaboration with Noiz and its potential to strengthen the visibility of Snail’s gaming portfolio with streamers; the momentum Snail expects across the ARK franchise over the next two years and the visibility regarding the same provided by Snail’s fourth quarter; Snail’s expanded roadmap and commitment to sustained franchise growth and increased revenue visibility through 2027; Snail’s continued investment, advancement, and scaling of its broader game portfolio; progress made across the development of AAA games; the intention for AAA games to deliver expansive worlds, cutting-edge visuals, and robust marketing campaigns that far exceed those of typical indie releases; Snail’s investment and expansion into other AAA games outside of ASE and ASA and the potential for its existing AAA games to form a core pillar of its long-term investment strategy; For The Stars, Nine Yin Sutra: Immortal, and Nine Yin Sutra: Wushu offering substantial upside with an attractive profit margin profile compared to many of our other games; the occurrence and timing of a potential partnership opportunity tied to Snail’s stablecoin initiative; Snail’s interactive films division serving as a strategic adjacency and building on Snail’s existing creative capabilities; ARK remaining the foundational backbone of Snail and its gaming pipeline; Snail investing in and growing other arms of its business; Snail’s in-house projects are approaching the final stages of development; Snail being positioned to broaden its portfolio, diversify revenue streams, and drive long-term shareholder value;and assumptions underlying any of the foregoing.
Further information on risks, uncertainties and other factors that could affect Snail’s financial results and business include Snail’s ability to strengthen its gaming portfolio’s visibility; its ability to expand and grow its franchise and increase its revenue; and the risks that are included in its filings with the Securities and Exchange Commission (the “SEC”) from time to time, including its annual reports on Form 10-K and quarterly reports on Form 10-Q filed, or to be filed, with the SEC. You should not rely on these forward-looking statements, as actual outcomes and results may differ materially from those expressed or implied in the forward-looking statements as a result of such risks and uncertainties. All forward-looking statements in this press release are based on management’s beliefs and assumptions and on information currently available to Snail, and Snail does not assume any obligation to update the forward-looking statements provided to reflect events that occur or circumstances that exist after the date on which they were made.
About Snail, Inc.
Snail, Inc. (Nasdaq: SNAL) is a leading, global independent developer and publisher of interactive digital entertainment for consumers around the world, with a premier portfolio of premium games designed for use on a variety of platforms, including consoles, PCs, and mobile devices. For more information, please visit: https://snail.com/.
Investor Contact:
John Yi and Steven Shinmachi Gateway Group, Inc. 949-574-3860 [email protected]
STAFFORD, Texas, March 19, 2026 (GLOBE NEWSWIRE) — Greenwich LifeSciences, Inc. (Nasdaq: GLSI) (the “Company”), a clinical-stage biopharmaceutical company focused on its Phase III clinical trial, FLAMINGO-01, which is evaluating Fast Track designated GLSI-100, an immunotherapy to prevent breast cancer recurrences, today announced the initiation of new clinical sites in the US.
The Phase III clinical trial has recently been activated at City of Hope, one of the largest and most advanced cancer research and treatment organizations in the United States – specifically at its network sites in Los Angeles and Orange counties, Arizona, Atlanta, and Illinois. Principal investigator at City of Hope, Hope S. Rugo, M.D., continues her participation on the Steering Committee. Her prior site at University of California San Francisco, where she is Professor Emeritus, is still participating in the study.
Dr. Rugo is division chief of breast medical oncology and a professor in the Department of Medical Oncology & Therapeutics Research at City of Hope. She also serves as director of the Women’s Cancers Program for City of Hope’s national network of cancer centers. A world-renowned expert in breast cancer and clinical trial design and execution, Dr. Rugo oversees women’s cancer research initiatives and clinical care at City of Hope. She is focused on expanding breast cancer clinical trials, advancing translational research, and standardizing care to improve patient outcomes. She is deeply committed to improving access to innovative new therapies for breast cancer patients everywhere and takes a compassionate, collaborative approach in her work.
Dr. Rugo has been directly involved in numerous projects that have established new standards of care for breast cancer. She has served on the steering committees of multiple clinical trials that led to the approval of agents such as PARP inhibitors, CDK4/6 inhibitors, PI3K inhibitors, checkpoint inhibitors, and antibody-drug conjugates, among others. Additionally, Dr. Rugo has led several studies aimed at minimizing therapy-related toxicity. She also served as co-chair of the Triple Negative Working Group of the Translational Breast Cancer Research Consortium, where she spearheaded groundbreaking multicenter clinical trials in collaboration with researchers, pharmaceutical companies, and clinical providers. As a physician-scholar with more than 500 peer-reviewed publications, Dr. Rugo served on the editorial board of the American Society of Clinical Oncology’s Education Committee, which included co-chairing the creation of new guidelines for the hormonal treatment of metastatic breast cancer.
Dr. Rugo commented, “I am excited to open this important trial across our City of Hope sites, expanding treatment opportunities for our patients with high-risk early stage HER2 positive breast cancer. It is truly an honor to now represent City of Hope on the Steering Committee. This study aligns with City of Hope’s interest in and the importance of harnessing the host immune system to reduce the risk of breast cancer recurrence.”
Last year City of Hope launched a national clinical trials model that includes clinical sites across the United States in order to accelerate cancer research.
Dr. Jaye Thompson, VP Clinical and Regulatory Affairs, commented, “We are honored to have Dr. Rugo, a globally recognized leader in breast cancer, now participating in FLAMINGO-01 through her leadership at City of Hope. Her site’s expertise and commitment to advancing patient care, which I personally experienced when training these sites, is invaluable as we continue to study GLSI-100. The four City of Hope locations also strengthen our study footprint in some regions of the US where we were not previously covered, providing the study with access to additional population centers.”
CEO Snehal Patel commented, “We started working with Dr. Rugo when she was the breast cancer leader at UCSF and joined our Phase III study and Steering Committee. We quickly benefited from her recommendations as the study was starting up and expanding into Europe. Her extensive experience in developing novel therapies, while minimizing toxicities, will guide us through the development of GLSI-100 as an effective and safe vaccine to prevent metastatic breast cancer in high-risk breast cancer survivors. With the addition of these new sites at City of Hope, planned expansion of US Oncology/Sarah Cannon sites, addition of sites in new countries, including potentially the United Kingdom and Canada, the total sites participating in FLAMINGO-01 could increase from the current 160 sites to up to 190-200 sites.”
About FLAMINGO-01 Open Label Phase III Data
More than 1,000 patients have been screened with a current screen rate of approximately 800 patients per year. The 250 patient non-HLA-A*02 arm is now fully enrolled, where all patients received GLSI-100, which is 5 times more treated patients and recurrence rate data than the approximately 50 patients treated in the Phase IIb trial. The Primary Immunization Series (PIS), which includes the first 6 GLSI-100 injections over the first 6 months and is required to reach peak protection, is followed by 5 booster injections given every 6 months to prolong the immune response, thereby providing longer-term protection.
In the non-HLA-A*02 arm, a preliminary analysis of recurrence rates after the PIS is completed shows an approximately 70-80% reduction in recurrence rate.
This observation is trending similarly to the Phase IIb trial results and hazard ratio where HLA-A*02 patients were treated and where breast cancer recurrences were reduced up to 80% compared to a 20-50% reduction in recurrence rate by other approved products.
The immune response at baseline prior to any GLSI-100 treatment, the increasing immune response during the PIS, and the safety profile of non-HLA-A*02 patients is trending similarly to the HLA-A*02 arms of FLAMINGO-01 and to the Phase IIb study.
Analysis of the open label data from FLAMINGO-01 has been conducted in a manner that maintains the study blind. The open label recurrence rate, immune response, and safety data is based on the patients enrolled to date in FLAMINGO-01 and the data provided by the clinical sites so far, which is not completed or fully reviewed, and is thus preliminary. While comparing any preliminary FLAMINGO-01 data to the Phase IIb clinical trial data may be possible, these preliminary results are not a prediction of future results, and the results at the end of the study may differ.
About GLSI-100 Phase IIb Study
In the prospective, randomized, single-blinded, placebo-controlled, multi-center (16 sites led by MD Anderson Cancer Center) Phase IIb clinical trial of HLA-A*02 breast cancer patients, 46 HER2/neu 3+ over-expressor patients were treated with GLSI-100, and 50 placebo patients were treated with GM-CSF alone. After 5 years of follow-up, there was an 80% or greater reduction in cancer recurrences in the HER2/neu 3+ patients who were treated with GLSI-100, followed, and remained disease free over the first 6 months, which we believe is the time required to reach peak immunity and thus maximum efficacy and protection. The Phase IIb results can be summarized as follows:
80% or greater reduction in metastatic breast cancer recurrence rate over 5 years of follow-up with a peak immune response at 6 months and well-tolerated safety profile.
The PIS elicited a potent immune response as measured by local skin tests and immunological assays.
About FLAMINGO-01 and GLSI-100
FLAMINGO-01 (NCT05232916) is a Phase III clinical trial designed to evaluate the safety and efficacy of Fast Track designated GLSI-100 (GP2 + GM-CSF) in HER2 positive breast cancer patients who had residual disease or high-risk pathologic complete response at surgery and who have completed both neoadjuvant and postoperative adjuvant trastuzumab based treatment. The trial is led by Baylor College of Medicine and currently includes US and European clinical sites from university-based hospitals and academic and cooperative networks with plans to open up to 150 sites globally. In the double-blinded arms of the Phase III trial, approximately 500 HLA-A*02 patients are planned to be randomized to GLSI-100 or placebo, and up to 250 patients of other HLA types are planned to be treated with GLSI-100 in a third arm. The trial has been designed to detect a hazard ratio of 0.3 in invasive breast cancer-free survival, where 28 events will be required. An interim analysis for superiority and futility will be conducted when at least half of those events, 14, have occurred. This sample size provides 80% power if the annual rate of events in placebo-treated subjects is 2.4% or greater.
For more information on FLAMINGO-01, please visit the Company’s website here and clinicaltrials.gov here. Contact information and an interactive map of the majority of participating clinical sites can be viewed under the “Contacts and Locations” section. Please note that the interactive map is not viewable on mobile screens. Related questions and participation interest can be emailed to: [email protected]
About Breast Cancer and HER2/neu Positivity
One in eight U.S. women will develop invasive breast cancer over her lifetime, with approximately 300,000 new breast cancer patients and 4 million breast cancer survivors. HER2 (human epidermal growth factor receptor 2) protein is a cell surface receptor protein that is expressed in a variety of common cancers, including in 75% of breast cancers at low (1+), intermediate (2+), and high (3+ or over-expressor) levels.
About Greenwich LifeSciences, Inc.
Greenwich LifeSciences is a clinical-stage biopharmaceutical company focused on the development of GP2, an immunotherapy to prevent breast cancer recurrences in patients who have previously undergone surgery. GP2 is a 9 amino acid transmembrane peptide of the HER2 protein, a cell surface receptor protein that is expressed in a variety of common cancers, including expression in 75% of breast cancers at low (1+), intermediate (2+), and high (3+ or over-expressor) levels. Greenwich LifeSciences has commenced a Phase III clinical trial, FLAMINGO-01. For more information on Greenwich LifeSciences, please visit the Company’s website at www.greenwichlifesciences.com and follow the Company’s Twitter at https://twitter.com/GreenwichLS.
Forward-Looking Statement Disclaimer
Statements in this press release contain “forward-looking statements” that are subject to substantial risks and uncertainties. All statements, other than statements of historical fact, contained in this press release are forward-looking statements. Forward-looking statements contained in this press release may be identified by the use of words such as “anticipate,” “believe,” “contemplate,” “could,” “estimate,” “expect,” “intend,” “seek,” “may,” “might,” “plan,” “potential,” “predict,” “project,” “target,” “aim,” “should,” “will,” “would,” or the negative of these words or other similar expressions, although not all forward-looking statements contain these words. Forward-looking statements are based on Greenwich LifeSciences Inc.’s current expectations and are subject to inherent uncertainties, risks and assumptions that are difficult to predict, including statements regarding the intended use of net proceeds from the public offering; consequently, actual results may differ materially from those expressed or implied by such forward-looking statements. Further, certain forward-looking statements are based on assumptions as to future events that may not prove to be accurate. These and other risks and uncertainties are described more fully in the section entitled “Risk Factors” in Greenwich LifeSciences’ Annual Report on the most recent Form 10-K for the year ended December 31, 2024, and other periodic reports filed with the Securities and Exchange Commission. Forward-looking statements contained in this announcement are made as of this date, and Greenwich LifeSciences, Inc. undertakes no duty to update such information except as required under applicable law.
Preclinical results in therapy-resistant HER2-low breast cancer models demonstrate enhanced antitumor activity and reversal of resistance with PLK1 inhibition
SAN DIEGO, March 19, 2026 (GLOBE NEWSWIRE) — Cardiff Oncology, Inc. (Nasdaq: CRDF), a clinical-stage biotechnology company leveraging PLK1 inhibition to develop novel therapies across a range of cancers, today announced that new preclinical data highlighting the potential of its highly specific oral PLK1 inhibitor, onvansertib, in combination with trastuzumab deruxtecan (T-DXd) will be presented at the American Association for Cancer Research Annual Meeting 2026, taking place April 17-22, 2026 in San Diego, California.
The poster presentation will showcase findings demonstrating that onvansertib enhanced the antitumor activity of T-DXd and reversed resistance in therapy-resistant HER2-low breast cancer models.
Poster Presentation Details:
Title:PLK1 inhibitor onvansertib potentiates the antitumor efficacy of trastuzumab deruxtecan (T-DXd) and reverses its resistance in therapy-resistant HER2-low breast cancer models
Date & Time: April 19, 2026 | 2:00 PM – 5:00 PM PT
Abstract Number: 329
The poster will be made available on the Scientific Publications page of the Company’s website following the presentation.
About Onvansertib Onvansertib is a highly specific, oral PLK1 inhibitor currently in mid-stage clinical development for RAS-mutated metastatic colorectal cancer. It is also being evaluated in multiple other cancers through investigator-initiated studies, including metastatic pancreatic ductal adenocarcinoma (mPDAC), small cell lung cancer (SCLC), triple-negative breast cancer (TNBC), and chronic myelomonocytic leukemia (CMML).
About Cardiff Oncology, Inc. Cardiff Oncology is a clinical-stage biotechnology company advancing innovative cancer treatments focused on PLK1 inhibition, a validated oncology target with practice-changing potential. Our lead asset, onvansertib, is a highly specific, oral PLK1 inhibitor currently being evaluated in a Phase 2 trial for first-line treatment of RAS-mutated metastatic colorectal cancer (“mCRC”), addressing a large, underserved patient population with high unmet need. Onvansertib is also under investigation in other PLK1-driven cancers through ongoing investigator-initiated trials and has shown robust single agent clinical activity in hard-to-treat tumors. By targeting tumor vulnerabilities, we aim to overcome treatment resistance and deliver improved clinical outcomes for patients.
VANCOUVER, BC, March 19, 2026 – Nicola Mining Inc. (the “Company” or “Nicola”) (TSX: NIM) (OTCQB: HUSIF) (FSE: HLIA) is pleased to announce that Warren Wagner has completed his Master of Science (M.Sc.) thesis, at the university of British Columba’s (UBC) Mineral Deposit Research Unit (MRDU), on the New Craigmont copper project[1]. His thesis is titled The Skarn to Porphyry Transition: Establishing Links Between Skarn and Porphyry-Type Mineralization at New Craigmont British Columbia. The full publication and supplementary data tables are available for download on the UBC website: https://open.library.ubc.ca/soa/cIRcle/collections/ubctheses/24/items/1.0451531
The purpose of the thesis was to examine the potential connection between the historically mined Craigmont skarn and undiscovered porphyry systems in the surrounding area. Using field observations, petrography, whole-rock and mineral chemistry, and integrated geochronology, Warren’s thesis has redefined Craigmont as a porphyry-linked skarn system genetically tied to multi-pulsed Late Triassic magmatism within the Guichon Creek batholith’s Border Phase.
Mineral ages determined through geochronology lab work defined two discrete hydrothermal stages: massive calcsilicate skarn alteration at ~215 Ma related to the earliest Border Phase intrusions and overprinting, vein-hosted porphyry-type mineralization at ~209 Ma associated with later, oxidized intrusions.
Potassic, phyllic, calc-potassic, and propylitic alteration styles indicate the presence of a larger porphyry system proximal to the skarn deposit. Epidote mineral chemistry from propylitic assemblages further supports this. New Craigmont epidote contains elevated porphyry indicator trace elements consistent with other porphyry deposits in British Columbia and worldwide. Finally, epidote mineral chemistry systematics within the Guichon Creek batholith reveal that New Craigmont contains a separate, porphyry centre, unrelated to those of the Highland Valley district. The study also highlights the importance of structural permeability and reactive Nicola Group host rocks in focusing hydrothermal fluids and controlling the distribution of skarn and porphyry-style mineralization.
Conclusions of the study have positive implications for ongoing exploration at New Craigmont. The study confirms Nicola’s ongoing hypothesis that the historical skarn is driven by a nearby porphyry system. Detailed geochemistry work has helped narrow exploration to broadly two regions within the property: West Craigmont (where the Draken target is located), and east of the historical mine (where the Jotun target is located). Nicola is integrating MRDU data into ongoing vectoring work and target generation.
Peter Espig, CEO of Nicola, stated, “We applaud Warren and MRDU on two years of fruitful work at our New Craigmont Copper Project. The thesis’ conclusion aligns with our growing confidence in our three years of geological work, mapping and 2025 porphyry vectoring. Given the size of our land package and location, which includes sharing Guichon Batholith with Highland Valley Copper, the prospect of having one or more porphyries at New Craigmont is increasingly compelling, as highlighted in the thesis. We are very encouraged to commence our 2026 Exploration Program.”
Qualified Person
The scientific and technical disclosures included in this news release have been reviewed and approved by Will Whitty, P.Geo., who is the Qualified Person as defined by NI 43-101. Mr. Whitty is Vice President, Exploration for the Company.
About Nicola Mining
Nicola Mining Inc. is a junior mining company listed on the TSX-V Exchange and Frankfurt Exchange that maintains a 100% owned mill and tailings facility, located near Merritt, British Columbia. It has signed Mining and Milling Profit Share Agreements with high-grade BC-based gold projects. Nicola’s fully permitted mill can process both gold and silver mill feed via gravity and flotation processes.
The Company owns 100% of the New Craigmont Project, a property that hosts historical high-grade copper mineralization and covers an area of over 10,800 hectares along the southern end of the Guichon Batholith and is adjacent to Highland Valley Copper, Canada’s largest copper mine. The Company also owns 100% of the Treasure Mountain Property, which includes 30 mineral claims and a mineral lease, spanning an area exceeding 2,200 hectares.
Neither the TSX Venture Exchange nor its Regulation Services Provider (as that term is defined in the policies of the TSX Venture Exchange) accepts responsibility for the adequacy or accuracy of this release.
WEST CHICAGO, Ill., March 18, 2026 /PRNewswire/ — Titan International, Inc. (NYSE: TWI) (“Titan” or the “Company”), a leading global manufacturer of off-highway wheels, tires, assemblies, and undercarriage products, today announced a decision to consolidate production within its North American manufacturing footprint, which will result in the closure of its manufacturing facility in Jackson, Tennessee by the end of October 2026.
The Company expects production currently performed in Jackson to be transitioned to other existing Titan facilities over the coming months. This action is part of Titan’s ongoing efforts to optimize its manufacturing footprint and improve capacity utilization.
“The decision to consolidate production and close the Jackson facility is difficult knowing the impact it has on our team members and their families,” said Paul Reitz, President and CEO of Titan International. “Titan continues to take deliberate actions to improve its operating efficiency while maintaining the flexibility and scale required to serve our customers.”
The closure of the Jackson, TN facility will impact approximately 140 people and Titan is committed to supporting affected employees through this transition. The Company will work closely with local leadership and provide assistance to impacted team members, including severance, benefits continuation and job placement support. The Company will continue to operate a robust network of manufacturing facilities across North America to support its customers across outdoor power equipment, powersports, agriculture, construction, earthmoving, and other off‑highway end markets.
About Titan: Titan International, Inc. (NYSE: TWI) is a leading global manufacturer of off-highway wheels, tires, assemblies, and undercarriage products. Headquartered in West Chicago, Illinois, the company globally produces a broad range of products to meet the specifications of original equipment manufacturers (OEMs) and aftermarket customers in the agricultural, earthmoving/construction, and consumer markets. For more information, visit www.titan-intl.com.
CHARLOTTE, N.C., March 18, 2026 (GLOBE NEWSWIRE) — NN, Inc. (“NN” or the “Company”) (NASDAQ: NNBR), a global diversified industrial company that engineers and manufactures high-precision components and assemblies with six sigma quality, today provided an update on its growing presence in the data center market, a key targeted growth market for the Company.
NN has secured multiple new awards with a leading global provider of AI infrastructure and data center computing equipment. As this industry moves into liquid cooled equipment, it transitions into a natural market for NN. AI reasoning racks are based on an industry-leading chip that requires liquid cooling, and NN has secured liquid cooling positions on these AI reasoning racks which will be installed in the US for AI cloud computing. NN’s existing liquid management products precisely fit the requirements of these applications, and the demanding performance and quality requirements of AI data center and cloud customers are a direct use of the Company’s existing capabilities. Furthermore, next generation computing designs require even higher power use and even higher heat generation, which will lead to next-generation liquid-cooled computing systems and components. The Company can already make products that are advanced beyond today’s requirements. NN has delivered six sigma quality, micron-level tolerance parts for combustion engines for decades. The Company’s decades of global experience and footprint are directly applicable to this new area.
Harold Bevis, President and Chief Executive Officer of NN, Inc., commented, “The liquid-cooled data center market is one of the Company’s new end markets that it is pursuing along with medical, defense and electronics, and electric grid components. The AI data center market fits precisely into NN’s decades of know-how in fluid management and six sigma quality levels. For NN, it is a strategic and straightforward application of existing know-how with managing gas, diesel and hydraulic fluids and applying that know-how to managing cooling fluids. The material science and technical requirements are extremely similar. As we say ‘never leak, never fail’. We have been doing this successfully for decades as a leading global provider of ‘never leak, never fail’ parts that go into vehicle solutions around the world. Our reputation covers billions of parts made over several decades with many customers. We step into this arena as a formidable competitor from Day 1.”
“We have won a multi-year set of awards which is leading NN to invest in a large installation of 17 next-generation high-speed, high-precision CNC machines that will meet and exceed these requirements. This expansion and ramp up is happening now across 2026. These machines will add to NN’s portfolio of over 100 of these similar machines already in-house. We can do this type of production in the US, China, Europe, and South America. This is a gateway strategic win for NN globally. The AI data center expansion for cloud providers is happening globally. This is a multi-billion market that is hyper scaling now, and these computing racks are the hardware behind the expanding use of AI and cloud computing. Financially, these wins fit within NN’s guidance for achieving $70 to $80 million of accretive new business during 2026. These wins contribute to achieving that goal globally.”
“NN is intentionally shifting its business mix into non-automotive, higher-growth, higher-margin markets. The data center AI reasoning computing approaches use a high amount of power and generate a high level of heat. Liquid cooling and cooling fluid management are vital to the success of these approaches, and NN is an expert at handling fluids under these 24/7 operating conditions. The series of wins that NN is announcing today validates that the Company’s capabilities are directly applicable to these customers and this market. ‘Never leak, never fail’. This is precisely the type of accretive, high-value business that we have been intentionally pursuing as part of our ongoing revenue transformation, and we believe it positions NN for a better future with sustained top line growth and continued margin expansion. We are actively prospecting with other AI reasoning and data center equipment providers. Additionally, the fast-charge Electric Vehicle recharging approaches have the same basic issue; they use a lot of power and quickly create a lot of heat, and liquid cooling approaches are coming to this market as well. NN’s products also fit these requirements.”
Rob Esch, NN’s CTO of Machined Parts, said, “Data center and AI infrastructure customers demand above all else precision, reliability, and a supplier with the deep technical know-how to repetitively deliver manufacturing solutions at scale, and that is exactly what NN brings to the table. Our decades of expertise in high-precision machining, six sigma quality, the use of advanced materials, and our well-developed manufacturing methods for precise fluid management give NN a genuine and differentiated capability to serve this market. We can already meet the stringent performance requirements of liquid-cooled computing architectures. As NN builds its capabilities and reputation in this market, we are poised to flex our technical know-how to continue winning next-generation programs with the world’s leading AI hardware developers and hyperscalers. It is a global phenomenon, and we are organized globally for technical product management, and thus we see this happening in multiple markets. It is very exciting and we bring real value to this market and these customers.”
ABOUT NN
NN, Inc., a global diversified industrial company, combines advanced engineering and production capabilities with in-depth materials science expertise to design and manufacture high-precision components and assemblies for a variety of markets on a global basis. Headquartered in Charlotte, North Carolina, NN has facilities in North America, Europe, South America, and China. For more information about the Company and its products, please visit www.nninc.com.
Forward-Looking Statements
This press release contains express and implied forward-looking statements within the meaning of the Private Securities Litigation Reform Act of 1995, including, but not limited to, statements regarding NN’s pursuit of new end markets, NN’s competitive position in the data center market, the success of NN’s investments to meet the requirements of awarded business, and expected new business wins for 2026 and other statements that are not historical facts. Forward-looking statements generally will be accompanied by words such as “anticipate,” “believe,” “could,” “estimate,” “expect,” “forecast,” “growth,” “guidance,” “intend,” “may,” “will,” “possible,” “potential,” “predict,” “project”, “trajectory” or other similar words, phrases or expressions. Forward-looking statements involve a number of risks and uncertainties that are outside of management’s control and that may cause actual results to be materially different from such statements. Such factors include, among others, general economic conditions and economic conditions in the industrial sector; material changes in the costs and availability of raw materials; the level of our indebtedness; our ability to secure, maintain or enforce patents or other appropriate protections for our intellectual property; and cyber liability or potential liability for breaches of our or our service providers’ information technology systems or business operations disruptions. The foregoing factors should not be construed as exhaustive and should be read in conjunction with the sections entitled “Risk Factors” and “Management’s Discussion and Analysis of Financial Condition and Results of Operations” included in the Company’s filings made with the U.S. Securities and Exchange Commission. The Company undertakes no obligation to publicly update or review any forward-looking statement, whether as a result of new information, future developments or otherwise, except as required by law. New risks and uncertainties may emerge from time to time, and it is not possible for the Company to predict their occurrence or how they will affect the Company. The Company qualifies all forward-looking statements by these cautionary statements.
Investor Relations: Joseph Caminiti or Abe Plimpton [email protected] 312-445-2870
March 17, 2026 – Limassol, Cyprus – GDEV Inc. (Nasdaq: GDEV), an international gaming and entertainment company (“GDEV” or the “Company”), today announced that Andrey Fadeev, Chief Executive Officer and Chairman of the Board of Directors, has notified the Company of his purchase of 2,730,384 GDEV ordinary shares from Boris Gertsovskiy, co-founder and former director of the Company, in a private transaction.
Following the transaction, Mr. Fadeev beneficially owns 6,709,391 GDEV ordinary shares, representing 37.0% of the Company’s issued and outstanding shares as of December 31, 2025. Mr. Gertsovskiy has divested himself of the entirety of his remaining shareholding in the Company. At the time of the transaction, Mr. Gertsovskiy did not hold any position of employment (including as a director or officer) at GDEV Inc.
The transaction was conducted by Mr. Fadeev solely in a personal capacity and is not connected with his role as Chief Executive Officer and/or Chairman of the Company. The Company was not a party to the transaction and did not act in concert with Mr. Fadeev in any manner in relation thereto.
About GDEV Inc.
GDEV is a gaming and entertainment holding company, focused on development and growth of its franchise portfolio across various genres and platforms. With a diverse range of subsidiaries including Nexters, Cubic Games, Royal Ark, Game Gears, Light Hour Games among others, GDEV strives to create games that will inspire and engage millions of players for years to come. Its franchises, such as Hero Wars, Island Hoppers, Pixel Gun 3D, Zombie Miner and others have accumulated over 550 million installs and $2.7 billion of bookings worldwide. For more information, please visit www.gdev.inc
Contacts:
Investor Relations Roman Safiyulin | Chief Corporate Development Officer [email protected]
The Company recently announced an exclusive distribution agreement with Innomedica CCB S.A. for its Kinesiology Line, AVERSA products and Mosquito repellent patches
ORLANDO, Fla., March 18, 2026 (GLOBE NEWSWIRE) — Nutriband Inc. (NASDAQ: NTRB) (NASDAQ: NTRBW) today announced that The Costa Rica Ministry of Health has approved the Company’s line of Kinesiology Tapes for import and Sale. Innomedica CCB, the company’s exclusive distribution partner for Costa Rica oversaw and financed the regulatory approval process.
The Company, partnering with Innomedica plans to begin ramping up marketing efforts for these products and its mosquito repellant patch line following this latest approval.
About AVERSA™ Abuse-Deterrent Transdermal Technology
Nutriband’s AVERSA™ abuse-deterrent transdermal technology incorporates aversive agents into transdermal patches to prevent the abuse, diversion, misuse, and accidental exposure of drugs with abuse potential. The AVERSA™ abuse-deterrent technology has the potential to improve the safety profile of transdermal drugs susceptible to abuse, including opioids and stimulant drugs, while making sure that these drugs remain accessible to those patients who really need them. The technology is covered by a broad intellectual property portfolio with patents granted in the United States, Europe, Japan, Korea, Russia, China, Canada, Mexico, and Australia.
About Nutriband Inc.
We are primarily engaged in the development of a portfolio of transdermal pharmaceutical products. Our lead product under development is an abuse-deterrent fentanyl patch incorporating our AVERSA™ abuse-deterrent technology. AVERSA™ technology can be incorporated into any transdermal patch to prevent the abuse, misuse, diversion, and accidental exposure of drugs with abuse potential.
The Company’s website is www.nutriband.com. Any material contained in or derived from the Company’s websites or any other website is not part of this press release.
Forward-Looking Statements
Certain statements contained in this press release, including, without limitation, statements containing the words ‘’believes,” “anticipates,” “expects” and words of similar import, constitute “forward-looking statements” within the meaning of the Private Securities Litigation Reform Act of 1995. Such forward-looking statements involve both known and unknown risks and uncertainties. The Company’s actual results may differ materially from those anticipated in its forward-looking statements as a result of a number of factors, including those including the Company’s ability to develop its proposed abuse-deterrent fentanyl transdermal system and other proposed products, its ability to obtain patent protection for its abuse technology, its ability to obtain the necessary financing to develop products and conduct the necessary clinical testing, its ability to obtain Federal Food and Drug Administration approval to market any product it may develop in the United States and to obtain any other regulatory approval necessary to market any product in other countries, including countries in Europe, its ability to market any product it may develop, its ability to create, sustain, manage or forecast its growth; its ability to attract and retain key personnel; changes in the Company’s business strategy or development plans; competition; business disruptions; adverse publicity and international, national and local general economic and market conditions and risks generally associated with an undercapitalized developing company, as well as the risks contained under “Risk Factors” and “Management’s Discussion and Analysis of Financial Condition and Results of Operations” in the Company’s periodic and current reports on Form 10-K, Forms 10-Q and 8-K and the Company’s other filings with the Securities and Exchange Commission. Except as required by applicable law, we undertake no obligation to revise or update any forward-looking statements to reflect any event or circumstance that may arise after the date hereof.
Dr. Christian Lunetta to Present “From PARADIGM to PARAGON: Advancing PrimeC for ALS through Phase 2 Clinical and Biomarker Insights toward a Global Phase 3 Trial”
CAMBRIDGE, Mass., March 18, 2026 /PRNewswire/ — NeuroSense Therapeutics Ltd. (NASDAQ: NRSN) (“NeuroSense”), a late-stage clinical biotechnology company focused on developing disease-modifying treatments for neurodegenerative diseases, today announced that Dr. Christian Lunetta will present new data and insights on the development of PrimeC, the company’s investigational therapy for amyotrophic lateral sclerosis (ALS), at the AD/PD™ 2026 International Conference on Alzheimer’s and Parkinson’s Diseases and Related Neurological Disorders, to be held in Copenhagen, Denmark, on March 19, 2026.
Dr. Lunetta’s presentation, titled “From PARADIGM to PARAGON: Advancing PrimeC for ALS through Phase 2 Clinical and Biomarker Insights toward a Global Phase 3 Trial,” will take place during the symposium “Mechanisms and Therapeutics in the ALS-FTD Spectrum (SOD-1, TDP-43, C9ORF72 and TMEM106B).”
The presentation will review key clinical and biomarker findings from the Phase 2b PARADIGM trial, which evaluated PrimeC in people living with ALS. The data provide important insights into disease mechanisms and treatment effects that helped inform the design of the company’s global Phase 3 PARAGON trial, currently being advanced to further evaluate PrimeC’s safety and efficacy.
“ALS is one of the most complex neurodegenerative diseases, and advancing therapeutic development requires the integration of rigorous clinical research with deeper biological insight,” said Dr. Christian Lunetta. “The clinical findings emerging from the PARADIGM trial, together with the expanding biomarker analyses, provide an important scientific foundation as we advance toward the PARAGON Phase 3 study. I look forward to sharing these results with the scientific community at AD/PD 2026 and to contributing, together with fellow investigators, to the next stage of clinical development as we work to advance meaningful therapeutic options for people living with ALS.”
“We are deeply appreciative of Dr. Lunetta’s role in presenting these findings and of his contribution as part of the clinical investigator community behind this work,” said Dr. Shiran Zimri, NeuroSense VP of Research and Development and Canada Country Lead. “The timing of this presentation, coming just days after the publication of the PARADIGM results in JAMA Neurology and at such a highly regarded scientific forum, is especially meaningful. It creates a unique moment where robust, peer-reviewed data can immediately be brought into scientific exchange and critical discussion. For us, this is not only about sharing results, but about engaging the field in a deeper understanding of the clinical and biomarker insights from PARADIGM as we advance with urgency toward our global Phase 3 PARAGON study.”
The PARAGON Phase 3 trial is planned as a multinational, randomized, double-blind, placebo-controlled study designed to further evaluate PrimeC’s potential to slow disease progression in people living with ALS.
NeuroSense continues active engagement with regulatory authorities to advance PrimeC toward potential marketing authorization.
About NeuroSense
NeuroSense Therapeutics is a clinical-stage biotechnology company focused on discovering and developing treatments for patients suffering from debilitating neurodegenerative diseases. NeuroSense believes that these diseases, which include amyotrophic lateral sclerosis (ALS), Alzheimer’s disease and Parkinson’s disease, among others, represent one of the most significant unmet medical needs of our time, with limited effective therapeutic options available for patients to date. Due to the complexity of neurodegenerative diseases and based on strong scientific research on a large panel of related biomarkers, NeuroSense’s strategy is to develop combined therapies targeting multiple pathways associated with these diseases.
For additional information, we invite you to visit our website and follow us on LinkedIn, YouTube and X. Information that may be important to investors may be routinely posted on our website and these social media channels.
About PrimeC
PrimeC, NeuroSense’s lead drug candidate, is a novel extended-release oral formulation composed of a unique fixed-dose combination of two FDA-approved drugs: ciprofloxacin and celecoxib. PrimeC is designed to synergistically target several key mechanisms of ALS and AD, that contribute to neuron degeneration, inflammation, iron accumulation and impaired ribonucleic acid (“RNA”) regulation to potentially inhibit the progression of ALS and AD.
About ALS
Amyotrophic lateral sclerosis (“ALS”) is an incurable neurodegenerative disease that causes complete paralysis and death within 2-5 years from diagnosis. Every year, more than 5,000 people are diagnosed with ALS in the U.S. alone, with an annual disease burden of $1 billion. The number of people living with ALS is expected to grow by 24% by 2040 in the U.S. and EU.
Forward-Looking Statements
This press release contains “forward-looking statements” that are subject to substantial risks and uncertainties. All statements, other than statements of historical fact, contained in this press release are forward-looking statements. Forward-looking statements contained in this press release may be identified by the use of words such as “anticipate,” “believe,” “contemplate,” “could,” “estimate,” “expect,” “intend,” “seek,” “may,” “might,” “plan,” “potential,” “predict,” “project,” “target,” “aim,” “should,” “will” “would,” or the negative of these words or other similar expressions, although not all forward-looking statements contain these words. Forward-looking statements are based on NeuroSense Therapeutics’ current expectations and are subject to inherent uncertainties, risks and assumptions that are difficult to predict and include statements regarding the timing of regulatory filings, meetings and regulatory decisions. Further, certain forward-looking statements, including statements regarding future development of PrimeC, are based on assumptions as to future events that may not prove to be accurate. The future events and trends may not occur and actual results could differ materially and adversely from those anticipated or implied in the forward looking statements. These risks include the uncertainty regarding outcomes and the timing of current and future clinical trials; the risk the PrimeC will not advance towards later-stage development, timing for reporting data, including from the study of PrimeC in Alzheimer’s disease; that the study will not be successful; the ability of NeuroSense to remain listed on Nasdaq; and other risks and uncertainties set forth in NeuroSense’s filings with the Securities and Exchange Commission (SEC). You should not rely on these statements as representing our views in the future. More information about the risks and uncertainties affecting NeuroSense is contained under the heading “Risk Factors” in the Annual Report on Form 20-F filed with the Securities and Exchange Commission on April 7, 2025 and NeuroSense’s subsequent filings with the SEC. Forward-looking statements contained in this announcement are made as of this date, and NeuroSense undertakes no duty to update such information except as required under applicable law.
Tender Offer Made in Connection with Parties’ Pending Business Combination Expected to Close Early in the Second Quarter
HOUSTON and SEATTLE, March 18, 2026 (GLOBE NEWSWIRE) — Saltchuk Resources, Inc. (the “Offeror”) and Great Lakes Dredge & Dock Corporation (NASDAQ:GLDD) (the “Company”) announced that the Offeror has commenced a cash tender offer (the “Tender Offer”) for any and all of the Company’s 5.25% Senior Notes due 2029 (the “Notes”).
In conjunction with the Tender Offer, the Offeror is soliciting (the “Consent Solicitation”) consents (each, a “Consent” and, collectively, the “Consents”) from holders of the Notes (each, a “Holder” and, collectively, the “Holders”) to amend certain provisions (the “Proposed Amendments”) of the indenture, dated as of May 25, 2021 (as supplemented from time to time prior to the date hereof, the “Indenture”), between Computershare Trust Company, N.A., as successor to Wells Fargo Bank, National Association, as trustee (the “Trustee”), the Company and the subsidiary guarantors party thereto, under which the Notes were issued. In order for the Proposed Amendments to be approved with respect to the Notes, Holders of a majority in principal amount of the outstanding Notes must consent to the Proposed Amendments (the “Requisite Consents”). If the Requisite Consents with respect to the Notes are received, the Proposed Amendments would, among other things, eliminate substantially all of the restrictive covenants, eliminate certain events of default and modify certain redemption notice requirements with respect to the Notes.
Holders may not tender their Notes without delivering their Consents pursuant to the Consent Solicitation and may not deliver Consents without tendering their Notes pursuant to the Tender Offer. The terms and conditions of the Tender Offer and Consent Solicitation are described in an Offer to Purchase and Consent Solicitation Statement, dated March 18, 2026 (the “Offer to Purchase and Consent Solicitation Statement”). Capitalized terms used herein, but not otherwise defined, have the meanings ascribed to such terms in the Offer to Purchase and Consent Solicitation Statement.
Upon the terms and subject to the conditions set forth in the Offer to Purchase and Consent Solicitation Statement, the Offeror will pay to each Holder who validly tenders (and does not validly withdraw) their Notes and validly delivers (and does not validly revoke) Consents on or prior to 5:00 P.M., New York City time, on March 31, 2026, unless extended or earlier terminated (such date and time, as the same may be extended, the “Early Tender Deadline”), an amount in cash equal to the Tender Offer Consideration, plus the Early Tender Payment for the Notes (as described in the table below and in the Offer to Purchase and Consent Solicitation Statement) on the Early Settlement Date or Final Settlement Date, as applicable (each of which is defined below and either of which may be referred to herein as a “Settlement Date”), if such Notes are accepted for purchase by the Offeror. Tendered Notes may be withdrawn any time on or prior to 5:00 P.M., New York City time, on March 31, 2026 (such date and time, as the same may be extended, the “Withdrawal Deadline”) but not thereafter. Holders who validly tender their Notes and validly deliver Consents after the Early Tender Deadline but on or prior to the Expiration Time (as defined below) will be entitled to receive the Tender Offer Consideration (as described in the table below and in the Offer to Purchase and Consent Solicitation Statement) but not the Early Tender Payment on the Final Settlement Date, if such Notes are accepted for purchase.
In addition to the Tender Offer Consideration or the Total Consideration (as described in the table below), as applicable, such Holders will also receive accrued and unpaid interest on the Notes that the Offeror accepts for purchase in the Tender Offer up to, but excluding, the applicable Settlement Date (“Accrued Interest”).
The following table summarizes the material pricing terms of the Tender Offer.
The Tender Offer and Consent Solicitation are scheduled to expire at 5:00 P.M., New York City time, on April 15, 2026, unless extended or earlier terminated by the Offeror in its sole discretion (such date and time, as the same may be extended, the “Expiration Time”). If, as anticipated, the Offeror’s pending Equity Offer (as defined below) is consummated prior to the Expiration Time, the Offeror may, in its sole discretion, accept for purchase the Notes that have been validly tendered and not validly withdrawn on or prior to the Early Tender Deadline at or promptly following the consummation of the Equity Offer (the “Early Settlement Date”). If the Offeror elects to schedule an Early Settlement Date, the Offeror will provide a notice of such date by press release or other public announcement. If the Equity Offer is not consummated prior to the Expiration Time, there will be no Early Settlement Date. The Offeror expects to accept for purchase the Notes validly tendered and not validly withdrawn on or prior to the Expiration Time promptly following the Expiration Time (the “Final Settlement Date”), subject to the satisfaction of all conditions to the Tender Offer and Consent Solicitation. In the event that the Equity Offer is not consummated prior to the Expiration Time, the Offeror intends to extend the Expiration Time.
Pending Business Combination and Financing Transactions
The Tender Offer and the Consent Solicitation are being made in connection with, and are expressly conditioned upon the closing of, the acquisition of the Company pursuant to the Agreement and Plan of Merger, dated February 10, 2026 (as it may be amended, supplemented or otherwise modified from time to time, the “Merger Agreement”), by and among the Company, the Offeror, and Huron MergeCo., Inc., a Delaware corporation and wholly owned subsidiary of the Offeror (the “Acquisition Sub”). Pursuant to the terms and conditions of the Merger Agreement, Acquisition Sub commenced a tender offer (the “Equity Offer”) on March 4, 2026 to purchase all of the outstanding shares of common stock, par value $0.0001 per share, of the Company (“Company Common Stock”), for $17.00 per share of Company Common Stock, net to the seller thereof in cash, without interest, subject to any required tax withholdings (subject to the conditions described in the offer to purchase filed with the U.S. Securities and Exchange Commission (the “SEC”) on March 4, 2026, by the Offeror and Acquisition Sub (together with any amendments or supplements thereto, the “Equity Offer to Purchase”). The Merger Agreement also provides that, as soon as practicable on the same business day that Acquisition Sub irrevocably accepts for payment all shares of Company Common Stock that are validly tendered (and not validly withdrawn) pursuant to the Equity Offer, or at another date mutually agreed upon by the Company, the Offeror and Acquisition Sub, upon the terms and subject to the conditions set forth in the Merger Agreement, Acquisition Sub will be merged with and into the Company (the “Merger” and, collectively with the Equity Offer, the “Acquisition Transactions”), with the Company continuing as the surviving corporation and a wholly owned subsidiary of the Offeror.
The Offeror and the Company expect (i) to close the Acquisition Transactions early in the second quarter of 2026, subject to the satisfaction (or, to the extent permitted, waiver) of the conditions set forth in the Merger Agreement, and (ii) the Early Settlement Date to occur on or about the closing date of the Acquisition Transactions, as more fully described in the Offer to Purchase and Consent Solicitation Statement. Assuming the satisfaction or waiver of the conditions to the Equity Offer and the Merger Agreement, the Acquisition Transactions are currently scheduled to close on April 1, 2026. The closing of the Acquisition Transactions is not conditioned on (i) any minimum amount of Notes being tendered, (ii) the receipt of the Requisite Consents or (iii) the closing of the Tender Offer or the Consent Solicitation.
The Offeror intends to finance the cash consideration for the Acquisition Transactions, the refinancing of certain of its existing indebtedness, the discharge of the Notes, and certain related transaction expenses using available cash and either the proceeds of borrowings under the New Credit Agreement (as defined below) or a combination of the Offeror’s existing credit facilities and the proceeds from borrowings under the Bridge Facility (as defined below).
Certain lenders, including an affiliate of the Dealer Manager, have agreed to enter into new senior unsecured credit facilities, which are expected to be provided in the form of either (i) a fully committed, senior unsecured bridge term loan facility (the “Bridge Facility”) or (ii) a new senior unsecured credit agreement (the “New Credit Agreement” and, together with the Bridge Facility, the “New Senior Credit Facilities”) providing for (x) a five-year $1.5 billion revolving credit facility and (y) a five-year $1.25 billion term loan facility.
General Information
The Offeror’s obligation to accept for purchase, and to pay for, Notes validly tendered and not validly withdrawn and to accept accompanying Consents validly delivered and not validly revoked pursuant to the Tender Offer and Consent Solicitation is conditioned upon the following having occurred or having been waived by the Offeror: (1) the consummation of the Equity Offer on the terms and conditions set forth in the Merger Agreement and Equity Offer to Purchase, and (2) the satisfaction of the General Conditions described in the Offer to Purchase and Consent Solicitation Statement. In addition, our obligation to accept Consents that have been validly delivered and not validly revoked pursuant to the Consent Solicitation is further conditioned upon supplemental conditions described in the Offer to Purchase and Consent Solicitation Statement. There can be no assurance that the Tender Offer or the Consent Solicitation will be consummated. The Offeror may amend, extend or terminate the Tender Offer and the Consent Solicitation, in its sole discretion. The Tender Offer is not conditioned on any minimum amount of Notes being tendered or the receipt of the Requisite Consents.
The Offeror intends to fund the Total Consideration and the Tender Offer Consideration (including, in each case, the Accrued Interest), plus all related fees and expenses, using available cash and the borrowings described above under Pending Business Combination and Financing Transactions.
Any Notes not tendered and purchased pursuant to the Tender Offer will remain outstanding. If the Requisite Consents are received with respect to the Notes, and the Proposed Amendments become operative with respect to the Indenture, then the Notes that are not purchased pursuant to the Tender Offer will be subject to the Proposed Amendments as set forth in a supplemental indenture with respect to the Indenture.
To the extent any Notes remain outstanding following the consummation of the Tender Offer and Consent Solicitation, the Offeror intends, but is not obligated, to redeem such remaining Notes at par on or after June 1, 2026 and satisfy and discharge the Company’s obligations under the Indenture pursuant to the terms thereof. Alternatively, the Offeror may cause the Company to leave any such remaining Notes outstanding or effect any of the alternative transactions described in the Offer to Purchase and Consent Solicitation Statement.
BofA Securities has been retained as the Dealer Manager in connection with the Tender Offer and as the Solicitation Agent in connection with the Consent Solicitation. In such capacities, they may contact Holders regarding the Tender Offer and the Consent Solicitation and may request brokers, dealers, banks, trust companies and other nominees or intermediaries to forward the Offer to Purchase and Consent Solicitation Statement and related materials to beneficial owners of Notes. Questions and requests for assistance regarding the terms of the Tender Offer and the Consent Solicitation should be directed to the Dealer Manager at (888) 292-0070 (toll-free) or (980) 388-3646 (collect). Questions regarding the procedures for tendering Notes and delivering Consents relating to the Tender Offer and the Consent Solicitation or requests for additional copies of the Offer to Purchase and Consent Solicitation Statement may be directed to Global Bondholder Services Corporation, the Tender and Information Agent for the Tender Offer, at (212) 430-3774 (for banks and brokers only) or (855) 654-2014 (toll-free) (for all others) or [email protected].
This press release is for informational purposes only. The Tender Offer and the Consent Solicitation are being made solely pursuant to the Offer to Purchase and Consent Solicitation Statement. This press release does not constitute an offer to purchase or the solicitation of an offer to sell any securities. Full details of the terms and conditions of the Tender Offer and the Consent Solicitation are described in the Offer to Purchase and Consent Solicitation Statement, which is being furnished by the Offeror to Holders of the Notes. Holders of the Notes are encouraged to read the Offer to Purchase and Consent Solicitation Statement and the information incorporated therein by reference, as they contain important information regarding the Tender Offer and the Consent Solicitation. The Tender Offer and the Consent Solicitation are not being made to Holders in any jurisdiction in which the making or acceptance thereof would not be in compliance with the securities, blue sky or other laws of such jurisdiction. In any jurisdiction in which the securities laws or blue sky laws require the Tender Offer or the Consent Solicitation to be made by a licensed broker or dealer, the Tender Offer and the Consent Solicitation will be deemed to be made on behalf of the Offeror by the Dealer Manager, or one or more registered brokers or dealers that are licensed under the laws of such jurisdiction.
This press release is for information purposes only and does not constitute an offer to buy or the solicitation of an offer to sell any securities. The Offeror’s solicitation and offer to buy shares of Company Common Stock is being made only pursuant to the Equity Offer to Purchase and related materials that the Offeror and Acquisition Sub have filed with the SEC. In connection with the Equity Offer, the Offeror and Acquisition Sub have filed a Tender Offer Statement on Schedule TO with the SEC and the Company has filed a Solicitation/Recommendation Statement on Schedule 14D-9. Before making any investment decision with respect to the Equity Offer, investors and security holders of the Company are urged to read the tender offer materials, the solicitation/recommendation statement and any other relevant documents filed with the SEC. In addition, all of these materials (and all other tender offer documents filed with the SEC) are available at no charge from the SEC through its website at www.sec.gov and upon request to MacKenzie Partners, Inc., the information agent for the Equity Offer, at 7 Penn Plaza, New York, New York 10001, by calling toll free (800) 322-2885. Broadridge Corporate Issuer Solutions, LLC is acting as depositary and paying agent for the Equity Offer.
None of the Offeror, the Company, the Trustee, the Dealer Manager, the Tender and Information Agent, or any of their respective affiliates makes any recommendation as to whether Holders should tender or refrain from tendering their Notes in response to the Tender Offer or delivering Consents pursuant to the Consent Solicitation, and no person or entity has been authorized by any of them to make such a recommendation. Holders must make their own independent decision as to whether to tender Notes and deliver accompanying Consents and, if so, the principal amount of the Notes as to which action is to be taken.
Nothing contained herein shall constitute a notice of redemption of the Notes or an obligation to issue a notice of redemption or satisfy or discharge the Indenture.
About Saltchuk Resources, Inc.
Saltchuk is a privately owned family of diversified freight transportation, marine service, and energy distribution companies, with consolidated annual revenue of approximately $5.5 billion and 8,800 employees. We make multi-generational investments, championing our companies’ individual brands while providing strategic leadership and resources through our Corporate Home. Our companies maintain independent operations guided by shared values: safety comes first, reliability defines our customer relationships, and integrity shapes how we conduct business. We’re committed to each other, to environmental stewardship, and to contributing to our communities, fostering places where anyone would be proud for their children to work. Headquartered in Seattle, additional information is available at www.saltchuk.com.
About Great Lakes Dredge & Dock Corporation
Great Lakes Dredge & Dock Corporation is the largest provider of dredging services in the United States, which is complemented with a long history of performing significant international projects. In addition, Great Lakes is fully engaged in expanding its core business into the offshore energy industry. GLDD employs experienced civil, ocean and mechanical engineering staff in its estimating, production, and project management functions. In its over 136-year history, GLDD has never failed to complete a marine project. Great Lakes owns and operates the largest and most diverse fleet in the U.S. dredging industry, comprised of approximately 200 specialized vessels. Great Lakes has a disciplined training program for engineers that ensures experience-based performance as they advance through GLDD operations. GLDD’s Incident-and Injury-Free® (IIF®) safety management program is integrated into all aspects of the GLDD’s culture. GLDD’s commitment to the IIF® culture promotes a work environment where employee safety is paramount.
Forward-looking statements made herein with respect to the Tender Offer and Consent Solicitation and related transactions, including, for example, the timing of the completion of the Tender Offer and Consent Solicitation, Equity Offer and the Merger or the potential benefits of any such transactions, reflect the current analysis of existing information and are subject to various risks and uncertainties. As a result, caution must be exercised in relying on forward-looking statements. Due to known and unknown risks, the Company and the Offeror’s actual results may differ materially from its expectations or projections. All statements other than statements of historical fact are statements that could be deemed forward-looking statements. Forward-looking statements can be identified by, among other things, the use of forward-looking language, such as the words “plan,” “believe,” “expect,” “anticipate,” “intend,” “estimate,” “target,” “project,” “contemplate,” “predict,” “potential,” “continue,” “may,” “would,” “could,” “should,” “seeks,” “scheduled to,” or other similar words, or the negative of these terms or other variations of these terms or comparable language.
The following factors, among others, could cause actual plans and results to differ materially from those described in forward-looking statements. Such factors include, but are not limited to, the effect of the announcement of the Acquisition Transactions and the Tender Offer and Consent Solicitation on the Company and the Offeror’s relationships with employees, governmental entities and other business relationships, operating results and business generally; the occurrence of any event, change or other circumstances that could give rise to the termination of the Merger Agreement, and the risk that the Merger Agreement may be terminated in circumstances that require the Company to pay a termination fee; the possibility that competing offers will be made; the outcome of any legal proceedings that may be instituted against the Company and the Offeror related to the transactions contemplated by the Merger Agreement, including the Acquisition Transactions; uncertainties as to the timing of the consummation of the Tender Offer and Consent Solicitation and the Acquisition Transactions; uncertainties as to the number of stockholders of the Company who may tender their stock in the Equity Offer and number of Holders who may tender their Notes and deliver accompanying Consents in the Tender Offer and Consent Solicitation; the failure to satisfy other conditions to consummate the Acquisition Transactions on the anticipated timeframe or at all; risks that the Tender Offer and Consent Solicitation and the Acquisition Transactions disrupt current plans and operations and the potential difficulties in employee retention as a result of the proposed transactions; the effects of local and national economic, credit and capital market conditions on the economy in general, and other risks and uncertainties; and those risks and uncertainties discussed from time to time in the reports or other public filings of the Company, the Offeror or the Acquisition Sub with the SEC.
Additional information concerning these and other factors that may impact the Company’s expectations and projections can be found in its periodic filings with the SEC, including its Annual Report on Form 10-K for the year ended December 31, 2025. GLDD’s SEC filings are available publicly on the SEC’s website at www.sec.gov, on GLDD’s website at gldd.com under “Investors—Financials & Filings—SEC filings” or upon request via email to [email protected]. All forward-looking statements contained in this communication are based on information available to the Company and the Offeror as of the date hereof and are made only as of the date of this communication. The Company and the Offeror disclaim any obligation or undertaking to update or revise the forward-looking statements contained herein, whether as a result of new information, future events or otherwise, except as required under applicable law. These forward-looking statements should not be relied upon as representing the Company and the Offeror’s views as of any date subsequent to the date of this communication. Furthermore, any information about our intentions contained in any of our forward-looking statements reflects our intentions as of the date of such forward-looking statement, and is based upon, among other things, existing regulatory, industry, competitive, economic and market conditions, and our assumptions as of such date. We may change our intentions, strategies or plans (including our plans expressed herein) without notice at any time and for any reason. In light of the foregoing, investors are urged not to rely on any forward-looking statement in reaching any conclusion or making any investment decision about any securities of the Company and the Offeror.
Contact:
Eric Birge, Vice President of Investor Relations of the Company, 313-220-3053
NEW YORK–(BUSINESS WIRE)– Perfect Corp. (NYSE: PERF) (“Perfect” or the “Company”), a leading artificial intelligence (“AI”) company offering AI and augmented reality (“AR”) powered solutions to beauty, fashion, photo and video creative industries, today announced that its board of directors (the “Board”) has received a preliminary non-binding proposal letter, dated March 18, 2026 (the “Proposal”), from CyberLink International Technology Corp. (“CyberLink”) and Ms. Alice H. Chang, Chairwoman of the Board and Chief Executive Officer of Perfect, and her controlled entities (collectively, the “Consortium Members”) that proposes a “going-private” transaction for US$1.95 in cash per ordinary share (the “Transaction”).
According to the Proposal, the Consortium Members will establish an acquisition vehicle to implement the Transaction. The Transaction is expected to be financed through equity contributions from the Consortium Members in the form of rollover equity in the Company and available unrestricted cash from the Company. Debt financing may also be arranged as necessary at the discretion of Consortium Members. A copy of the Proposal is attached hereto as Exhibit A.
The Board intends to convene in the near future to review the Proposal and to establish a special committee of independent and disinterested directors for the purpose of evaluating and considering the Proposal. In connection with its review, the special committee, once formed, will be authorized to retain independent legal, financial and other advisors to assist in its evaluation.
The Company cautions its shareholders and others considering trading in its securities that the Board and its relevant committees have not made any decision with respect to the Company’s response to the Proposal. There can be no assurance that any definitive offer will be received, that any definitive agreement will be executed relating to the Transaction or that the Transaction or any other similar transaction will be approved or consummated. The Company does not undertake any obligation to provide any updates with respect to any transaction, except as required under applicable law.
About Perfect Corp.
Founded in 2015, Perfect Corp. is a leading AI company offering self-developed AI- and AR- powered solutions dedicated to transforming the world with digital tech innovations that make your virtual world beautiful. On Perfect’s direct consumer business side, Perfect operates a family of YouCam consumer apps and web-editing services for photo, video and camera users, centered on unleashing creativity with AI-driven features for creation, beautification and enhancement. On Perfect’s enterprise business side, Perfect empowers major beauty, skincare, fashion, jewelry, and watch brands and retailers by supplying them with omnichannel shopping experiences through AR product try-ons and AI-powered skin diagnostics. With cutting-edge technologies such as Generative AI, real-time facial and hand 3D AR rendering and cloud solutions, Perfect enables personalized, enjoyable, and engaging shopping journey and helps brands elevate customer engagement, increase conversion rates, and propel sales growth. Throughout this journey, Perfect maintains its unwavering commitment to environmental sustainability and fulfilling social responsibilities. For more information, visit https://ir.perfectcorp.com/.
Forward-Looking Statements
This communication contains forward-looking statements within the meaning of Section 27A of the U.S. Securities Act of 1933, as amended, or the Securities Act, and Section 21E of the U.S. Securities Exchange Act of 1934, as amended, or the Exchange Act, that are based on beliefs and assumptions and on information currently available to Perfect. In some cases, you can identify forward-looking statements by the following words: “may,” “will,” “could,” “would,” “should,” “expect,” “intend,” “plan,” “anticipate,” “believe,” “estimate,” “predict,” “project,” “potential,” “continue,” “ongoing,” “target,” “seek” or the negative or plural of these words, or other similar expressions that are predictions or indicate future events or prospects, although not all forward-looking statements contain these words. Any statements that refer to expectations, projections or other characterizations of future events or circumstances, including strategies or plans, are also forward-looking statements. These statements involve risks, uncertainties and other factors that may cause actual results, levels of activity, performance or achievements to be materially different from those expressed or implied by these forward-looking statements. These statements are based on Perfect’s reasonable expectations and beliefs concerning future events and involve risks and uncertainties that may cause actual results to differ materially from current expectations. These factors are difficult to predict accurately and may be beyond Perfect’s control. Forward-looking statements in this communication or elsewhere speak only as of the date made. New uncertainties and risks arise from time to time, and it is impossible for Perfect to predict these events or how they may affect Perfect. In addition, risks and uncertainties are described in Perfect’s filings with the Securities and Exchange Commission. These filings may identify and address other important risks and uncertainties that could cause actual events and results to differ materially from those contained in the forward-looking statements. Perfect cannot assure you that the forward-looking statements in this communication will prove to be accurate. There may be additional risks that Perfect presently does not know or that Perfect currently does not believe are immaterial that could also cause actual results to differ from those contained in the forward-looking statements. In light of the significant uncertainties in these forward-looking statements, you should not regard these statements as a representation or warranty by Perfect, its directors, officers or employees or any other person that Perfect will achieve its objectives and plans in any specified time frame, or at all. Except as required by applicable law, Perfect does not have any duty to, and does not intend to, update or revise the forward-looking statements in this communication or elsewhere after the date of this communication. You should, therefore, not rely on these forward-looking statements as representing the views of Perfect as of any date subsequent to the date of this communication.
Exhibit A
March 18, 2026
The Board of Directors Perfect Corp. 14F, No. 98 Minquan Road Xindian District New Taipei City 231 Taiwan
Dear Sirs and Madam:
Ms. Alice H. Chang (“Ms. Chang”), and her controlled entities GOLDEN EDGE CO., LTD., DVDonet.com. Inc. and World Speed Company Limited (collectively, the “Chairwoman Parties”), and CyberLink International Technology Corp. (“CyberLink”, together with Chairwoman Parties, the “Consortium Members”) are pleased to submit this preliminary non-binding proposal to acquire Perfect Corp. (the “Company”) in a going private transaction (the “Acquisition”).
We believe that our proposal provides a very attractive opportunity to the Company’s shareholders. Our proposal represents a premium of 44.4% to the Company’s closing price on March 17, 2026 and a premium of 35.4% and 23.4% to the volume-weighted average closing price during the last 30 and 60 trading days, respectively.
Consortium. The Consortium Members have entered into a consortium agreement dated March 18, 2026, pursuant to which the Consortium Members will form an acquisition company for the purpose of implementing the Acquisition, and the Consortium Members have agreed to work exclusively in pursuing the Acquisition.
Purchase Price. The consideration payable for each Class A ordinary share of the Company will be US$1.95 per ordinary share in cash (in each case other than those ordinary shares held by the Consortium Members that may be rolled over in connection with the Acquisition).
Closing Certainty. We believe that our proposal offers a high degree of closing certainty and are well positioned to negotiate and complete the proposed Acquisition on an expedited basis.
Financing. We intend to finance the Acquisition with equity capital from the Consortium Members in the form of rollover equity in the Company and available unrestricted cash from the Company. Debt financing may also be arranged to the extent necessary or desirable at the sole discretion of the Consortium Members.
Definitive Agreements. We are prepared to promptly negotiate and finalize definitive agreements (the “Definitive Agreements”) providing for the Acquisition and related transactions. These documents will provide for representations, warranties, covenants and conditions that are typical, customary and appropriate for transactions of this type.
Process. We believe that the Acquisition will provide superior value to the Company’s shareholders. We recognize that the Company’s Board of Directors (the “Board”) will evaluate the Acquisition independently before it can make its determination to endorse it, and we expect that the Board will establish a special committee comprised of independent and disinterested directors of the Company (the “Special Committee”).
Given the involvement of the Chairwoman Parties and CyberLink in the Acquisition, we appreciate that the independent members of the Board will proceed to consider the proposed Acquisition, and that each of Ms. Chang and Mr. Jau-Hsiung Huang will recuse herself / himself, as director of the Board, from participating in any Board deliberations and decisions related to the Acquisition. We expect that the Special Committee and its advisors will be exclusively authorized to consider and negotiate with us the proposed Acquisition, including the Definitive Agreements, and that no other members of management or any directors other than the members of the Special Committee will participate in any deliberations and decisions related to the Acquisition unless their involvement is approved by the Special Committee.
Consortium Members in the aggregate beneficially own approximately 53.4% of the total issued and outstanding share capital of the Company (excluding any ordinary shares issuable upon the Consortium Members’ exercise of options or warrants within 60 days), representing 81.2% of the total voting power of the Company, as calculated based on a total number of 101,848,671 issued and outstanding ordinary shares (consisting of 85,059,953 Class A ordinary shares and 16,788,718 Class B ordinary shares) of the Company as of December 31, 2025.
Confidentiality. Each of the Consortium Members will, as required by law, promptly file an amendment to its respective Schedule 13D to disclose this letter and the agreement among the Consortium Members. However, we are sure you will agree with us that it is in all of our interests to ensure that we proceed in a strictly confidential manner, unless otherwise required by law, until we have executed Definitive Agreements or terminated our discussions.
No Binding Commitment. This letter constitutes only a preliminary indication of our interest, and does not constitute any binding commitment with respect to the Acquisition. A binding commitment will result only from the execution of Definitive Agreements, and then will be on terms and conditions provided in such documentation.
In closing, we would like to express our commitment to working together to bring this Acquisition to a successful and timely conclusion. Should you have any questions regarding this proposal, please do not hesitate to contact us. We look forward to hearing from you.