CULVER CITY, Calif., Nov. 10, 2025 (GLOBE NEWSWIRE) — Snail, Inc. (Nasdaq: SNAL) (“Snail Games” or the “Company”), a leading global independent developer and publisher of interactive digital entertainment, will hold a conference call and webcast on Wednesday, November 12, 2025 at 4:30 p.m. Eastern time (1:30 p.m. Pacific time) to discuss its financial results for the third quarter ended September 30, 2025.
Snail Games management will host the conference call and webcast, followed by a question-and-answer period. Participants may listen to the live webcast and replay via the link here or on the Company’s investor relations website at https://investor.snail.com/.
About Snail, Inc. Snail, Inc. (Nasdaq: SNAL) is a leading, global independent developer and publisher of interactive digital entertainment for consumers around the world, with a premier portfolio of premium games designed for use on a variety of platforms, including consoles, PCs, and mobile devices. For more information, please visit: https://snail.com/.
Investor Contact: John Yi and Steven Shinmachi Gateway Group, Inc. 949-574-3860 SNAL@gateway-grp.com
BRENTWOOD, Tenn., Nov. 10, 2025 (GLOBE NEWSWIRE) — CoreCivic, Inc. (NYSE: CXW) (“CoreCivic”) announced today that its Board of Directors authorized an increase to its existing share repurchase program pursuant to which CoreCivic may purchase up to an additional $200 million in shares of CoreCivic’s outstanding common stock. As a result of the increase, the aggregate authorization under CoreCivic’s repurchase program increased from up to $500.0 million shares of common stock to up to $700.0 million shares of common stock.
Since the share repurchase program was authorized in May 2022, through November 7, 2025, we have repurchased a total of 21.5 million shares of our common stock at an aggregate cost of $322.1 million, or $14.98 per share, excluding fees, commissions and other costs related to the repurchases. As of November 7, 2025, including the additional authorization, we have $377.9 million of repurchase authorization available under the share repurchase program.
Damon T. Hininger, CoreCivic’s Chief Executive Officer, commented, “We are pleased to announce an increase to our stock repurchase authorization. We remain committed to deploying capital in ways that we believe will enhance long-term shareholder value. While our share price is influenced by many factors outside our control, we believe our current valuation does not fully reflect the progress and opportunities we see in our business.”
Patrick D. Swindle, CoreCivic’s President and Chief Operating Officer, added, “We believe our recently announced contract awards and the overall strength of our business position us well to execute on our capital allocation strategy. Given our earnings trajectory, alternative opportunities to deploy capital, and our current share price, we are prioritizing the allocation of our cash flows to our share repurchase program.”
About CoreCivic
CoreCivic is a diversified, government-solutions company with the scale and experience needed to solve tough government challenges in flexible, cost-effective ways. We provide a broad range of solutions to government partners that serve the public good through high-quality corrections and detention management, a network of residential and non-residential alternatives to incarceration to help address America’s recidivism crisis, and government real estate solutions. We are the nation’s largest owner of partnership correctional, detention and residential reentry facilities, and one of the largest operators of such facilities in the United States. We have been a flexible and dependable partner for government for more than 40 years. Our employees are driven by a deep sense of service, high standards of professionalism and a responsibility to help government better the public good. Learn more at www.corecivic.com.
This press release includes statements as to our beliefs and expectations of the outcome of future events that are forward-looking statements within the meaning of Section 21E of the Securities Exchange Act of 1934, as amended, and the Private Securities Litigation Reform Act of 1995, as amended. These forward-looking statements may include such words as “anticipate,” “estimate,” “expect,” “project,” “plan,” “intend,” “believe,” “may,” “will,” “should,” “can have,” “likely,” and other words and terms of similar meaning in connection with any discussion of the timing or nature of future operating or financial performance or other events. Such forward-looking statements may be affected by risks and uncertainties in CoreCivic’s business and market conditions. These forward-looking statements are subject to risks and uncertainties that could cause actual results to differ materially from the statements made. Important factors that could cause actual results to differ are described in the filings made from time to time by CoreCivic with the Securities and Exchange Commission (“SEC”) and include the risk factors described in CoreCivic’s Annual Report on Form 10-K for the fiscal year ended December 31, 2024, filed with the SEC on February 21, 2025. Except as required by applicable law, CoreCivic undertakes no obligation to update forward-looking statements made by it to reflect events or circumstances occurring after the date hereof or the occurrence of unanticipated events.
Strong grossmargins of 15.1%, expansion of 80basis points
Reaffirming Adjusted EBITDA guidance for full year
CHICAGO, Nov. 10, 2025 (GLOBE NEWSWIRE) — FreightCar America, Inc. (NASDAQ: RAIL) (“FreightCar America” or the “Company”), a diversified manufacturer and supplier of railroad freight cars, railcar parts and components, today reported results for the third quarter ended September 30, 2025.
ThirdQuarter 2025Highlights
Revenues of $160.5 million, compared to $113.3 million in the third quarter of 2024, with railcar deliveries of 1,304 units compared to 961 units in the prior year period
Gross margin of 15.1% with gross profit of $24.2 million, compared to gross margin of 14.3% with gross profit of $16.2 million in the third quarter of 2024
Recorded a $17.6 million non-cash adjustment due to share price appreciation resulting in a Net loss of $(7.4) million, or $(0.23) per share, and Adjusted net income of $7.8 million, or $0.24 per share
Adjusted EBITDA was $17.0 million, representing a margin of 10.6%, compared to $10.9 million and a margin of 9.6% in the third quarter of 2024
Ended the quarter with a backlog of 2,750 units valued at $222.0 million, reflecting a diversified mix of railcar conversion programs and new railcar builds
Well-positioned to deploy capital for growth, with $62.7 million in cash and equivalents and no borrowings under the company’s revolving credit facility
“Our third quarter results highlight the strength of our operating platform and the continued execution of our commercial strategy,” said Nick Randall, President and Chief Executive Officer of FreightCar America. “We delivered record third quarter Adjusted EBITDA at our new facility, reflecting the benefits of improved production efficiency and favorable product mix. Our team continues to demonstrate manufacturing flexibility which, coupled with our customer-centric approach, differentiates FreightCar America in the market. While overall industry demand remains subdued, we continue to support customers by leveraging our expertise in conversions and customized solutions to create value for our customers.”
Randall continued, “This quarter’s strong bottom line performance reflects our manufacturing discipline and commercial excellence. By building for value and meeting complex customer requirements instead of commoditized throughput, we delivered exceptional Adjusted EBITDA performance and strengthened the Company’s financial position. With this momentum, we enter the final quarter well-positioned to deliver profitable growth, generate positive free cash flow and advance our long-term growth initiatives.”
FiscalYear2025 Outlook
The Company has updated its outlook for fiscal year 2025 as follows:
Fiscal2025 Outlook
Year-over-Year ChangeatMidpoint of Range
Railcar Deliveries
4,500 – 4,900 Railcars
7.7
%
Revenue
$500 – $530 million
(7.9
)%
AdjustedEBITDA1
$43 – $49 million
7.0
%
1. The Company does not provide a reconciliation of forward-looking Adjusted EBITDA guidance due to the inherent difficulty in forecasting and quantifying adjustments necessary to calculate such non-GAAP measure without unreasonable effort. Material changes to such adjustments, including warrant liability and non-core operating items, could affect future GAAP results.
Mike Riordan, Chief Financial Officer of FreightCar America, added, “We delivered another quarter of solid financial results, including strong deliveries, margin performance and operating cash flow. Looking ahead, while our change in revenue guidance reflects product mix as we saw a larger number of conversion railcars compared to new railcars in the second half of 2025, our profitability and positive cash performance remain on track, underscoring the resilience of our business model, which fuels our capital strength and positions us to drive long-term sustainable growth.”
ThirdQuarter 2025 ConferenceCall&Webcast Information
The Company will host a conference call and live webcast on Monday, November 10, at 11:00 a.m. (Eastern Time) to discuss its third quarter 2025 financial results. FreightCar America invites shareholders and other interested parties to listen to its financial results conference call. Teleconference details are as follows:
An audio replay of the conference call will be available beginning at 3:00 p.m. (Eastern Time) on Monday, November 10, 2025, until 11:59 p.m. (Eastern Time) on Monday, November 24, 2025. To access the replay, please dial (844) 512-2921 or (412) 317-6671. The replay passcode is 13756539. An archived version of the webcast will also be available on the FreightCar America Investor Relations website.
AboutFreightCarAmerica
FreightCar America, headquartered in Chicago, Illinois, is a leading designer, producer and supplier of railroad freight cars, railcar parts and components. We also specialize in railcar repairs, complete railcar rebody services and railcar conversions that repurpose idled rail assets back into revenue service. Since 1901, our customers have trusted us to build quality railcars that are critical to economic growth and instrumental to the North American supply chain. To learn more about FreightCar America, visit www.freightcaramerica.com.
Forward-LookingStatements
This press release contains statements relating to our expected financial performance, financial condition, and/or future business prospects, events and/or plans that are “forward-looking statements” as defined under the Private Securities Litigation Reform Act of 1995. Forward-looking statements represent our estimates and assumptions only as of the date of this press release. Our actual results may differ materially from the results described in or anticipated by our forward-looking statements due to certain risks and uncertainties. These risks and uncertainties relate to, among other things, the cyclical nature of our business; adverse geopolitical, economic and market conditions, including inflation; material disruption in the movement of rail traffic for deliveries; fluctuating costs of raw materials, including steel and aluminum; delays in the delivery of raw materials; our ability to maintain relationships with our suppliers of railcar components; our reliance upon a small number of customers that represent a large percentage of our sales; the variable purchase patterns of our customers and the timing of completion; delivery and customer acceptance of orders; the highly competitive nature of our industry; the risk of lack of acceptance of our new railcar offerings; potential unexpected changes in laws, rules, and regulatory requirements, including tariffs and trade barriers (including recent United States tariffs imposed or threatened to be imposed on China, Canada, Mexico and other countries and any retaliatory actions taken by such countries); the scope and duration of the government shutdown; and other competitive factors. The factors listed above are not exhaustive. New factors emerge from time to time that may cause our business not to develop as we expect, and it is not possible for us to predict all of them. We expressly disclaim any duty to provide updates to any forward-looking statements made in this press release, whether as a result of new information, future events or otherwise.
Non-GAAPFinancialMeasures
This press release includes measures not derived in accordance with generally accepted accounting principles (“GAAP”), such as EBITDA, Adjusted EBITDA, Adjusted net income (loss), Adjusted EPS, Free cash flow and Adjusted free cash flow. These non-GAAP measures should not be considered in isolation or as a substitute for any measure derived in accordance with GAAP and may also be inconsistent with similar measures presented by other companies. Reconciliations of these measures to the applicable most closely comparable GAAP measures, and reasons for the Company’s use of these measures, are presented in the attached pages.
The GEO Group, Inc. (NYSE: GEO) is a leading diversified government service provider, specializing in design, financing, development, and support services for secure facilities, processing centers, and community reentry centers in the United States, Australia, South Africa, and the United Kingdom. GEO’s diversified services include enhanced in-custody rehabilitation and post-release support through the award-winning GEO Continuum of Care®, secure transportation, electronic monitoring, community-based programs, and correctional health and mental health care. GEO’s worldwide operations include the ownership and/or delivery of support services for 103 facilities totaling approximately 83,000 beds, including idle facilities and projects under development, with a workforce of up to approximately 18,000 employees.
Joe Gomes, CFA, Managing Director, Equity Research Analyst, Generalist , Noble Capital Markets, Inc.
Refer to the full report for the price target, fundamental analysis, and rating.
Overview. GEO Group reported 3Q25 results at or above expectations, excluding one-time impacts. Nonetheless, the shares sold off on concerns about the pace of detentions and uncertain additional facility activations. Notably, since the beginning of the year, GEO has entered into new or expanded contracts that represent over $460 million in new incremental annualized revenues that are already under contract and are expected to normalize in 2026. This represents the largest amount of new business the Company has won in a single year in its history.
3Q25 Results. Revenue of $682.3 million rose 13.1% y-o-y. We were at $650 million. Adjusted EBITDA came in at $120.1 million, or a 17.6% margin compared to $118.6 million, or a 19.7% margin. GAAP EPS was impacted by a $232.4 million gain from the sale of Lawton and a $37.7 million non-cash charge in connection with litigation. Adjusted EPS was $0.25 versus $0.21 last year and our $0.22 estimate.
Equity Research is available at no cost to Registered users of Channelchek. Not a Member? Click ‘Join’ to join the Channelchek Community. There is no cost to register, and we never collect credit card information.
This Company Sponsored Research is provided by Noble Capital Markets, Inc., a FINRA and S.E.C. registered broker-dealer (B/D).
*Analyst certification and important disclosures included in the full report. NOTE: investment decisions should not be based upon the content of this research summary. Proper due diligence is required before making any investment decision.
Robert LeBoyer, Senior Vice President, Equity Research Analyst, Biotechnology, Noble Capital Markets, Inc.
Refer to the full report for the price target, fundamental analysis, and rating.
Quarter Sales Were Driven By Etuary. Gyre reported Net Income of $5.9 million or $0.04 per basic share. Revenue of $30.6 million showed year-over-year growth of 20.0%. This was driven by strength in Etuary with sales of $27.7 million. Sales of Etorel and Contiva sales were of $1.5 million and $1.2 million respectively. At the end of 3Q25 on September 30, the company had $80.3 in cash, equivalents, and securities.
The Company Made Progress In Several Important Clinical Programs. During 3Q, Gyre continued working to submit its NDA for Hydronidone approval in China. The Phase 3 trial testing Etuary in pneumonoconiosis completed enrollment, while a Phase 2/3 trial for pulmonary complications in oncology (radiation induced lung injury/pneumonitis) is planned to begin in 4Q25. The IND for a Phase 2 trial in MASH in the US is now expected to be filed in early 2026, within the timeframe we had expected.
Equity Research is available at no cost to Registered users of Channelchek. Not a Member? Click ‘Join’ to join the Channelchek Community. There is no cost to register, and we never collect credit card information.
This Company Sponsored Research is provided by Noble Capital Markets, Inc., a FINRA and S.E.C. registered broker-dealer (B/D).
*Analyst certification and important disclosures included in the full report. NOTE: investment decisions should not be based upon the content of this research summary. Proper due diligence is required before making any investment decision.
Robert LeBoyer, Senior Vice President, Equity Research Analyst, Biotechnology, Noble Capital Markets, Inc.
Refer to the full report for the price target, fundamental analysis, and rating.
Phase 2 BESTOW Trial Data Reported. On Thursday evening, November 6, the results of the Phase 2 BESTOW trial in kidney transplant patients were presented. The trial did not meet its primary endpoint of tegoprubart superiority to the control arm but showed improvements in several important endpoints. We believe tegoprubart performed well and that the sharp decline in stock price is unwarranted.
Design Of The Phase 2 BESTOW Trial. The trial enrolled 126 patients into and randomized them into two arms. The first received tegoprubart and the second received tacrolimus, the standard of care, as a control arm. The primary endpoint was a difference in eGFR, a measure of kidney filtration and function. Additional endpoints reported were for the iBOX composite and measures of adverse events.
Equity Research is available at no cost to Registered users of Channelchek. Not a Member? Click ‘Join’ to join the Channelchek Community. There is no cost to register, and we never collect credit card information.
This Company Sponsored Research is provided by Noble Capital Markets, Inc., a FINRA and S.E.C. registered broker-dealer (B/D).
*Analyst certification and important disclosures included in the full report. NOTE: investment decisions should not be based upon the content of this research summary. Proper due diligence is required before making any investment decision.
Joe Gomes, CFA, Managing Director, Equity Research Analyst, Generalist , Noble Capital Markets, Inc.
Refer to the full report for the price target, fundamental analysis, and rating.
Overview. In the third quarter, Twin Peaks delivered a solid performance, expanding restaurant-level contribution margin to 17.0%. Sales within core markets also grew year-over-year despite regional headwinds. The conversions of certain Smokey Bones locations continues, with converted locations performing well.
3Q25 Results. Revenue decreased 1.6% y-o-y to $82.3 million, reflecting the loss of revenue from closed Smokey Bones locations as well as a decline in SSS. Twin Peaks System-wide sales declined 1.4%, with SSS off 4.1%. Adjusted EBITDA of $3 million in 3Q25 improved modestly from $2.3 million in 3Q24. Twin Hospitality reported a loss of $24.5 million compared to a net loss of $16.2 million last year.
Equity Research is available at no cost to Registered users of Channelchek. Not a Member? Click ‘Join’ to join the Channelchek Community. There is no cost to register, and we never collect credit card information.
This Company Sponsored Research is provided by Noble Capital Markets, Inc., a FINRA and S.E.C. registered broker-dealer (B/D).
*Analyst certification and important disclosures included in the full report. NOTE: investment decisions should not be based upon the content of this research summary. Proper due diligence is required before making any investment decision.
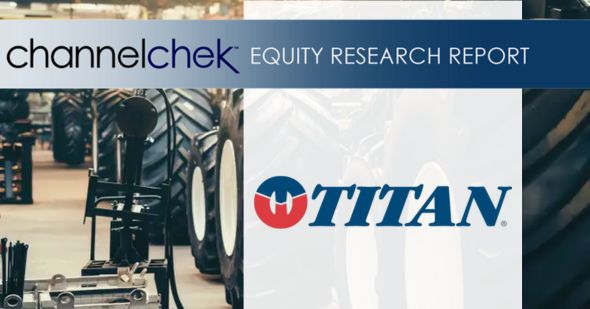
Joe Gomes, CFA, Managing Director, Equity Research Analyst, Generalist , Noble Capital Markets, Inc.
Refer to the full report for the price target, fundamental analysis, and rating.
Overview. Titan reported 3Q25 results at the high end of expectations. The Ag and EMC segments each reported revenue growth compared with the prior year period, along with expanded gross margins. The Consumer segment saw improved gross margins despite marginally lower revenues due to tariffs continuing to have some dampening effect on new equipment demand. Notably, Titan continued to generate gross and EBITDA margins meaningfully above where they were during the last cyclical trough.
3Q25 Results. Net sales for 3Q25 were $466.5 million, compared to $448.0 million in the comparable period of 2024. The increase was primarily driven by pricing related to passing on increases in input costs. We were at $455 million. Gross margin improved to 15.2% from 13.1%. We were at 15.2%. Adjusted EBITDA was $29.8 million in 3Q25, compared to $20.5 million in 3Q24, and our $28.5 million estimate. Adjusted EPS was $0.04 versus a loss of $0.19/sh last year and our projected $0.04/sh loss.
Equity Research is available at no cost to Registered users of Channelchek. Not a Member? Click ‘Join’ to join the Channelchek Community. There is no cost to register, and we never collect credit card information.
This Company Sponsored Research is provided by Noble Capital Markets, Inc., a FINRA and S.E.C. registered broker-dealer (B/D).
*Analyst certification and important disclosures included in the full report. NOTE: investment decisions should not be based upon the content of this research summary. Proper due diligence is required before making any investment decision.
Saga Communications, Inc. is a broadcast company whose business is primarily devoted to acquiring, developing and operating radio stations. Saga currently owns or operates broadcast properties in 27 markets, including 79 FM and 33 AM radio stations. Saga’s strategy is to operate top billing radio stations in mid sized markets, defined as markets ranked (by market revenues) from 20 to 200. Saga’s radio stations employ a myriad of programming formats, including Active Rock, Adult Album Alternative, Adult Contemporary, Country, Classic Country, Classic Hits, Classic Rock, Contemporary Hits Radio, News/Talk, Oldies and Urban Contemporary. In operating its stations, Saga concentrates on the development of strong decentralized local management, which is responsible for the day-to-day operations of the stations in their market area and is compensated based on their financial performance as well as other performance factors that are deemed to effect the long-term ability of the stations to achieve financial objectives. Saga began operations in 1986 and became a publicly traded company in December 1992. The stock trades on NASDAQ under the ticker symbol “SGA”.
Michael Kupinski, Director of Research, Equity Research Analyst, Digital, Media & Technology , Noble Capital Markets, Inc.
Jacob Mutchler, Research Associate, Noble Capital Markets, Inc.
Refer to the full report for the price target, fundamental analysis, and rating.
Q3 Results. Third quarter revenue of $28.2 million was in line with our $28.3 million estimate, representing a modest 1.8% decline against a Political advertising infused prior year period. Adj. EBITDA, excluding an extraordinary music licensing settlement expense, was $3.3 million, in line with our $3.4 million estimate.
Q3 revenues stabilize. Excluding Political advertising, the strength in Digital advertising more than offset the weakness in its core broadcast advertising. Digital advertising was up roughly 40% in the quarter. Digital advertising continues to have strong momentum into the fourth quarter, pacing up 32%.
Equity Research is available at no cost to Registered users of Channelchek. Not a Member? Click ‘Join’ to join the Channelchek Community. There is no cost to register, and we never collect credit card information.
This Company Sponsored Research is provided by Noble Capital Markets, Inc., a FINRA and S.E.C. registered broker-dealer (B/D).
*Analyst certification and important disclosures included in the full report. NOTE: investment decisions should not be based upon the content of this research summary. Proper due diligence is required before making any investment decision.
Joe Gomes, CFA, Managing Director, Equity Research Analyst, Generalist , Noble Capital Markets, Inc.
Refer to the full report for the price target, fundamental analysis, and rating.
Overview. Third quarter results were below expectations as operations were impacted by factors that temporarily reduced traffic in certain markets. Rising commodity costs outpaced pricing adjustments, impacting margins. The Benihana integration continues to exceed management expectations, and the new Benihana prototype is delivering strong results.
3Q25 Results. Revenue was $180.2 million, down from $194 million in 3Q24 and our $193.5 million estimate. Adjusted EBITDA totaled $10.6 million, down from $14.9 million in 3Q24 and below our $17.6 million estimate. ONE Group reported a GAAP loss of $85.3 million, or a loss of $2.75/sh, versus a loss of $16.4 million, or $0.53/sh last year.
Equity Research is available at no cost to Registered users of Channelchek. Not a Member? Click ‘Join’ to join the Channelchek Community. There is no cost to register, and we never collect credit card information.
This Company Sponsored Research is provided by Noble Capital Markets, Inc., a FINRA and S.E.C. registered broker-dealer (B/D).
*Analyst certification and important disclosures included in the full report. NOTE: investment decisions should not be based upon the content of this research summary. Proper due diligence is required before making any investment decision.
Joe Gomes, CFA, Managing Director, Equity Research Analyst, Generalist , Noble Capital Markets, Inc.
Refer to the full report for the price target, fundamental analysis, and rating.
Brand Strength. To illustrate the strength of MariMed’s brands, during the quarter in Illinois, the Company experienced a 23% sequential sales increase despite sales being down statewide 1.5%, according to Hoodie. In Massachusetts, MariMed sales increased 5% sequentially, compared to a 2% decline in the state, again according to Hoodie.
Wholesale. In terms of Wholesale, MariMed has achieved 75% penetration across all of its markets, excluding Missouri, leaving significant white space for future growth. The next step is to increase the breadth of relationship with customers, garnering additional shelf space for MariMed product.
Equity Research is available at no cost to Registered users of Channelchek. Not a Member? Click ‘Join’ to join the Channelchek Community. There is no cost to register, and we never collect credit card information.
This Company Sponsored Research is provided by Noble Capital Markets, Inc., a FINRA and S.E.C. registered broker-dealer (B/D).
*Analyst certification and important disclosures included in the full report. NOTE: investment decisions should not be based upon the content of this research summary. Proper due diligence is required before making any investment decision.
Kelly (Nasdaq: KELYA, KELYB) connects talented people to companies in need of their skills in areas including Science, Engineering, Education, Office, Contact Center, Light Industrial, and more. We’re always thinking about what’s next in the evolving world of work, and we help people ditch the script on old ways of thinking and embrace the value of all workstyles in the workplace. We directly employ nearly 350,000 people around the world and connect thousands more with work through our global network of talent suppliers and partners in our outsourcing and consulting practice. Revenue in 2021 was $4.9 billion. Visit kellyservices.com and let us help with what’s next for you.
Joe Gomes, CFA, Managing Director, Equity Research Analyst, Generalist , Noble Capital Markets, Inc.
Refer to the full report for the price target, fundamental analysis, and rating.
Overview. Kelly reported 3Q25 results below expectations, even after scrubbing away a number of one-time events. Lower demand from the federal government and a few large customers negatively impacted results. Nonetheless, Kelly continued to capture growth in certain markets.
3Q25 Results. 3Q25 revenue fell 9.9% to $935 million from $1.04 billion last year. Consensus was $973 million, and we were at $975 million. Adjusted EBITDA was $16.5 million, or a 1.9% margin, compared to $26.2 million, or a 2,5% margin, in 3Q24. Consensus was $33 million, and we were at $33.5 million. Adjusted EPS was $0.18 vs $0.21 last year. Consensus was $0.42, we were at $0.45.
Equity Research is available at no cost to Registered users of Channelchek. Not a Member? Click ‘Join’ to join the Channelchek Community. There is no cost to register, and we never collect credit card information.
This Company Sponsored Research is provided by Noble Capital Markets, Inc., a FINRA and S.E.C. registered broker-dealer (B/D).
*Analyst certification and important disclosures included in the full report. NOTE: investment decisions should not be based upon the content of this research summary. Proper due diligence is required before making any investment decision.
FAT Brands (NASDAQ: FAT) is a leading global franchising company that strategically acquires, markets, and develops fast casual, quick-service, casual dining, and polished casual dining concepts around the world. The Company currently owns 17 restaurant brands: Round Table Pizza, Fatburger, Marble Slab Creamery, Johnny Rockets, Fazoli’s, Twin Peaks, Great American Cookies, Hot Dog on a Stick, Buffalo’s Cafe & Express, Hurricane Grill & Wings, Pretzelmaker, Elevation Burger, Native Grill & Wings, Yalla Mediterranean and Ponderosa and Bonanza Steakhouses, and franchises and owns over 2,300 units worldwide. For more information on FAT Brands, please visit www.fatbrands.com.
Joe Gomes, CFA, Managing Director, Equity Research Analyst, Generalist , Noble Capital Markets, Inc.
Refer to the full report for the price target, fundamental analysis, and rating.
Overview. While the restaurant industry continues to face headwinds, FAT Brands did see some positives from the operating side. Most encouraging is the momentum in same-store sales performance. The Company narrowed the SSS decline to just 3.5%, down from 4.2% in the second quarter, representing the strongest quarterly performance so far this year.
3Q25 Financials. Quarterly revenue totaled $140 million, a 2.3% decrease from $143.4 million in last year’s quarter. The decline was driven primarily by the closure of 11 underperforming Smokey Bones locations as planned. Adjusted EBITDA was $13.1 million, compared to $14.1 million a year ago. The Company reported a GAAP net loss of $58.2 million versus a net loss of $44.8 million a year ago. Adjusted net loss was $45.4 million, or $2.67/sh, compared to adjusted net loss of $38.0 million, or $2.34/sh, in 3Q24.
Equity Research is available at no cost to Registered users of Channelchek. Not a Member? Click ‘Join’ to join the Channelchek Community. There is no cost to register, and we never collect credit card information.
This Company Sponsored Research is provided by Noble Capital Markets, Inc., a FINRA and S.E.C. registered broker-dealer (B/D).
*Analyst certification and important disclosures included in the full report. NOTE: investment decisions should not be based upon the content of this research summary. Proper due diligence is required before making any investment decision.