Bitcoin ATM Leader Strengthens C-Suite to Support Expansion and Navigate Industry Progression
ATLANTA, March 14, 2025 (GLOBE NEWSWIRE) — Bitcoin Depot (NASDAQ: BTM), a U.S.-based Bitcoin ATM (“BTM”) operator and leading fintech company, announced today that Chris Ryan has been appointed Chief Legal Officer. With a strong background in financial services, cryptocurrency, and regulatory compliance, Ryan will be instrumental in guiding the company’s legal operations as it continues expanding access to Bitcoin.
As Chief Legal Officer, Ryan will lead Bitcoin Depot’s legal and compliance strategy, advising the executive team on governance, risk management, and regulatory matters. He will also oversee partnerships, legal operations, and policy initiatives to support the company’s continued expansion.
Before joining Bitcoin Depot, Ryan served as Deputy General Counsel at MoneyGram International, where he led global legal teams working on cryptocurrency initiatives, regulatory strategy, and commercial partnerships across North America, Latin America, Europe, and Africa. With over a decade of experience, he has negotiated high-profile fintech deals, advised on blockchain product strategies, and developed compliance frameworks for digital assets and payments. He has also worked closely with policymakers on evolving cryptocurrency regulations and overseen key areas like AML, KYC, and financial compliance. His expert understanding of risk management, corporate transactions, and regulatory affairs will be key as Bitcoin Depot continues to strengthen its position as the largest Bitcoin ATM operator in the U.S.
“Chris has spent his career navigating complex financial and regulatory landscapes while leading high-performing legal and compliance teams,” said Brandon Mintz, CEO and founder of Bitcoin Depot. “His experience in fintech, blockchain, and global regulatory strategy will be invaluable as we continue expanding access to Bitcoin, enhancing compliance, and positioning Bitcoin Depot for long-term success. With the cryptocurrency industry evolving rapidly, Chris’s leadership will ensure we remain ahead of the curve.”
“Bitcoin Depot is at the forefront of making Bitcoin more accessible to people everywhere, and I’m excited to join at such a transformational time,” said Ryan. “With the crypto industry rapidly evolving, building a strong regulatory and compliance foundation is more important than ever. I look forward to working alongside the team to support Bitcoin Depot’s growth and advance its mission of bringing Bitcoin to the masses through its cash-to-crypto model.”
Ryan holds a J.D. from the Florida Coastal School of Law and a B.S. in Political Science from the University of Dayton.
About Bitcoin Depot Bitcoin Depot Inc. (Nasdaq: BTM) was founded in 2016 with the mission to connect those who prefer to use cash to the broader, digital financial system. Bitcoin Depot provides its users with simple, efficient and intuitive means of converting cash into Bitcoin, which users can deploy in the payments, spending and investing space. Users can convert cash to bitcoin at Bitcoin Depot kiosks in 48 states and at thousands of name-brand retail locations in 29 states through its BDCheckout product. The Company has the largest market share in North America with approximately 8,400 kiosk locations as of December 31, 2024. Learn more at www.bitcoindepot.com.
Cautionary Note Regarding Forward-Looking Statements This press release and any oral statements made in connection herewith include “forward-looking statements” within the meaning of Section 27A of the Securities Act of 1933, as amended, and Section 21E of the Exchange Act of 1934, as amended. Forward-looking statements are any statements other than statements of historical fact, and include, but are not limited to, statements regarding the expectations of plans, business strategies, objectives and growth and anticipated financial and operational performance, including our growth strategy and ability to increase deployment of our products and services, our ability to strengthen our financial profile, and worldwide growth in the adoption and use of cryptocurrencies. These forward-looking statements are based on management’s current beliefs, based on currently available information, as to the outcome and timing of future events. Forward-looking statements are often identified by words such as “anticipate,” “appears,” “approximately,” “believe,” “continue,” “could,” “designed,” “effect,” “estimate,” “evaluate,” “expect,” “forecast,” “goal,” “initiative,” “intend,” “may,” “objective,” “outlook,“ ”plan,“ ”potential,“ ”priorities,“ ”project,“ ”pursue,“ ”seek,“ ”should,“ ”target,“ ”when,“ ”will,“ ”would,” or the negative of any of those words or similar expressions that predict or indicate future events or trends or that are not statements of historical matters, although not all forward-looking statements contain such identifying words. In making these statements, we rely upon assumptions and analysis based on our experience and perception of historical trends, current conditions, and expected future developments, as well as other factors we consider appropriate under the circumstances. We believe these judgments are reasonable, but these statements are not guarantees of any future events or financial results. These forward-looking statements are provided for illustrative purposes only and are not intended to serve as, and must not be relied on by any investor as, a guarantee, an assurance, a prediction or a definitive statement of fact or probability. Actual events and circumstances are difficult or impossible to predict and will differ from assumptions. Many actual events and circumstances are beyond our control.
These forward-looking statements are subject to a number of risks and uncertainties, including changes in domestic and foreign business, market, financial, political and legal conditions; failure to realize the anticipated benefits of the business combination; risks relating to the uncertainty of our projected financial information; future global, regional or local economic and market conditions; the development, effects and enforcement of laws and regulations; our ability to manage future growth; our ability to develop new products and services, bring them to market in a timely manner and make enhancements to our platform; the effects of competition on our future business; our ability to issue equity or equity-linked securities; the outcome of any potential litigation, government and regulatory proceedings, investigations and inquiries; and those factors described or referenced in filings with the Securities and Exchange Commission. If any of these risks materialize or our assumptions prove incorrect, actual results could differ materially from the results implied by these forward-looking statements. There may be additional risks that we do not presently know or that we currently believe are immaterial that could also cause actual results to differ from those contained in the forward-looking statements. In addition, forward-looking statements reflect our expectations, plans or forecasts of future events and views as of the date of this press release. We anticipate that subsequent events and developments will cause our assessments to change.
We caution readers not to place undue reliance on forward-looking statements. Forward-looking statements speak only as of the date they are made, and we undertake no obligation to update publicly or otherwise revise any forward-looking statements, whether as a result of new information, future events, or other factors that affect the subject of these statements, except where we are expressly required to do so by law. All written and oral forward-looking statements attributable to us are expressly qualified in their entirety by this cautionary statement.
CALGARY, AB, March 14, 2025 /CNW/ – InPlay Oil Corp. (TSX: IPO) (OTCQX: IPOOF) (“InPlay” or the “Company”) is pleased to announce its financial and operating results for the three and twelve months ended December 31, 2024, along with the results of its independent oil and gas reserves evaluation effective December 31, 2024 (the “Reserve Report”) prepared by Sproule Associates Limited (“Sproule”). InPlay’s audited annual financial statements and notes, and Management’s Discussion and Analysis (“MD&A”) for the year ended December 31, 2024 will be available at “www.sedarplus.ca” and the Company’s website at “www.inplayoil.com“. An updated presentation will be available after closing of the Pembina Cardium asset acquisition which is expected in April.
Message to Shareholders:
The upcoming year is set to be a transformational year for InPlay. We believe that the highly accretive acquisition of Pembina Cardium assets from Obsidian Energy Ltd. announced on February 19, 2025 will fundamentally shift the future of the Company. The acquired assets strategically complement InPlay’s existing holdings in the Pembina Cardium, an area where the Company has proven operational expertise. The acquisition will significantly expand our operational scale, with attributes including large oil in place, a higher oil weighting, strong netbacks, low decline rates and a robust inventory of high-quality drilling locations, enhancing our overall sustainability. This is expected to strengthen free adjusted funds flow (“FAFF”)(4) generation, allowing for debt reduction while supporting our shareholder return strategy, with over three times FAFF coverage of our existing base dividend (11.3%) expected for 2025. We are excited to begin operations of these newly acquired assets acquired in this synergistic acquisition and to demonstrate our expertise and ability to unlock the intrinsic value of our share price. We will remain committed to financial discipline maintaining our strong balance sheet, to ultimately generate shareholder value through FAFF growth and return of capital to shareholders.
The resumption of development of our Pembina Cardium Unit # (“PCU7”) asset was a key highlight in 2024. This area is our most prolific asset as it offers high production rates and lower declines. As a result of significantly improved capital costs, PCU7 yields the highest returns and strongest capital efficiencies in our current asset portfolio. Our 2024 development of PCU7 exceeded internal expectations. Operational enhancements since our last PCU7 drilling program in spring of 2022 resulted in costs 25% below budget. These new techniques can be leveraged across our Cardium asset base, including those acquired as part of the Pembina Cardium asset acquisition. Three additional 100% PCU7 extended reach horizontal (“ERH”) wells were drilled in the first quarter of 2025 and recently brought on production.
During 2024, InPlay remained focused on operational execution, disciplined capital allocation and prioritizing FAFF while preserving a strong balance sheet which resulted in adjusting our operational and capital activities accordingly. InPlay’s disciplined approach allowed the Company to capitalize on the transformational Pembina Cardium asset acquisition.
Following closing of the Pembina Cardium asset acquisition, InPlay will provide updated development plans and revised full-year 2025 guidance. The acquisition is currently expected to close in April 2025.
2024 was a year of disciplined execution, operational efficiency, and delivering shareholder returns. We remain focused on financial strength, sustainable production, and value creation for our shareholders. As we move into 2025, we believe the Pembina Cardium asset acquisition positions InPlay for significant growth and long-term success. On behalf of our employees, management team and Board of Directors, we would like to thank our shareholders for their support.
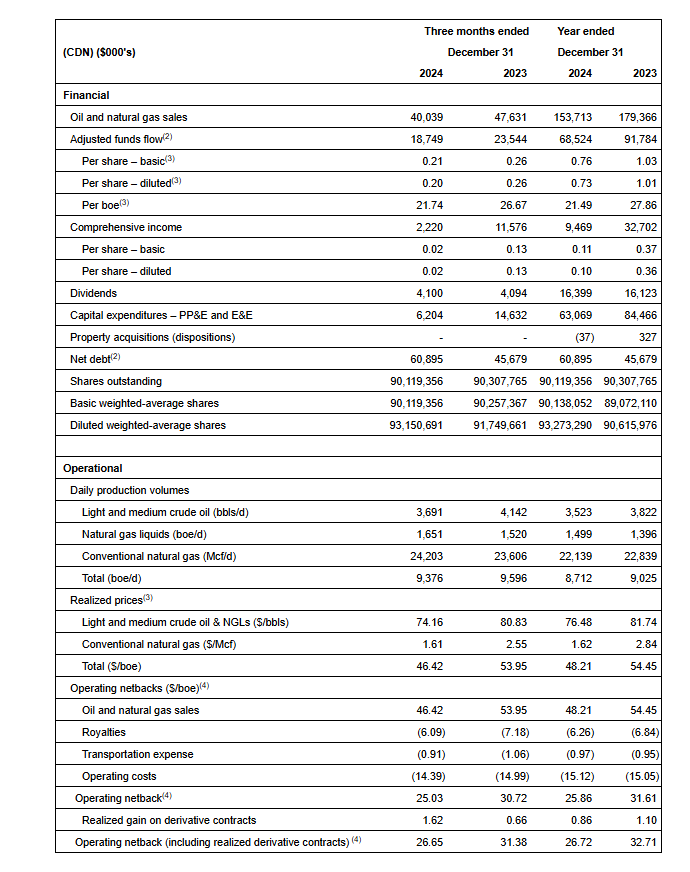
2024 Financial and Operating Results:
Achieved average annual production of 8,712 boe/d(1) (58% light crude oil and NGLs) with fourth quarter production average of 9,376 boe/d(1) (57% light crude oil and NGLs).
Generated adjusted funds flow (“AFF”)(2) of $68.5 million ($0.76 per basic share(3)) despite a 44% drop in AECO natural gas prices compared to 2023.
Distributed $16.4 million in dividends, equating to a 10.4% yield relative to year-end market capitalization. Since November 2022, total dividends distributed amounted to $39.2 million ($0.435 per share, including dividends declared to date in 2025).
Invested $63 million in development capital which was $2.5 million below the mid-range of our $64 – $67 million budget and 25% less than 2023. The majority of capital was spent on our drilling program, consisting of 12 (11.9) operated horizontal wells and three (0.65 net) non-operated horizontal wells, including strategic infrastructure projects, and an extensive downhole optimization program. $5.4 million was spent on the optimization program to replace plunger lifts with downhole pumps and lowering pumps in horizontal wells, helping to decrease our base decline rate to 26%.
Materially enhanced capital efficiencies through a 25% reduction in drilling and completion costs experienced in PCU7 as a result of operational enhancements on our four H2 2024 wells drilled in the area.
Exited 2024 at 0.8x net debt to earnings before interest, taxes and depletion (“EBITDA”)(4) which is among the lowest among industry peers.
Generated a strong operating income profit margin(4) of 54% and net income of $9.5 million ($0.11 per basic share, $0.10 per diluted share).
Renewed our $110 million revolving Senior Credit Facility, providing significant liquidity for tactical capital investment and strategic acquisitions.
Allocated $3.4 million to the successful abandonment of 40 wellbores, 37 pipelines and the reclamation of 25 wellsites.
2024 Financial & Operations Overview:
Our 2024 results reflect our disciplined capital allocation approach to maintain financial strength while delivering strong returns to shareholders. We executed our capital program under budget, generated meaningful adjusted funds flow and returned $16.4 million to shareholders. Production averaged 9,376 boe/d(1) (57% light crude oil & NGLs) in the fourth quarter of 2024.
InPlay’s capital program for 2024 consisted of $63.1 million of exploration and development capital. Efficient operational execution in 2024 led to capital expenditures coming in $2.5 million below the mid-point of our $64 – $67 million budget and approximately 25% less than 2023. The Company drilled, completed and brought on production two (1.9 net) ERH wells in Willesden Green, two (2.0 net) one-mile horizontal wells in Willesden Green, three (3.0 net) ERH wells in Pembina, four (4.0 net) PCU7 ERH wells, one (1.0 net) Belly River well, and three (0.65 net) non-operated Willesden Green ERH wells during 2024. This activity amounted to the drilling of 15 (12.6 net) wells. Additionally, the Company incurred drilling costs on one (1.0 net) Glauconite well where drilling challenges resulted in casing failure and led to the termination of drilling operations. In addition, $5.4 million was spent on the optimization of wells during 2024 to change plunger lifts to downhole pumps and lowering pumps in horizontal wells which has led to improved base decline rates. Going forward, InPlay’s improved decline rate results in reduced drilling capital required to maintain production and further enhancing our ability to generate FAFF.
Natural gas prices remained low in 2024 due to production growth in North America with higher than normal inventory levels in North America and Europe. This resulted in a 44% decrease in AECO pricing compared to already low prices in 2023. These lower prices resulted in a 11% decline in our realized boe sales price, which was partially offset by realized hedging gains.
Financial and Operating Results:
Operations Update:
InPlay’s capital program for 2025 is underway with three (3.0 net) ERH wells drilled in PCU7 recently coming on production and are in the early cleanup stage. These wells will offset the three well pad drilled in 2024 which has exceeded internal expectations. Despite the extreme cold temperatures in February, the costs for our first three wells of 2025 came in on time and on budget. Building on the success of our 2024 PCU7 development, we are excited to continue the focused development of this highly prolific area with an additional three net wells planned for the second half of 2025 included in our pre-acquisition 2025 budget. The majority of our remaining 2025 pre-acquisition capital program was scheduled for the second half of the year with minimal spending planned in the second quarter resulting in strong forecasted FAFF.
On March 4, 2025 the government of the United Stated announced tariffs on goods imported from Canada, including a 10% tariff on Canadian energy imports. The situation continues to be fluid and we believe the volatility surrounding these tariffs is already impacting valuations in the energy industry. We continue to monitor the impact of these tariffs on the Company and will make decisions keeping our strategy of disciplined capital allocation, financial flexibility and returns to shareholders at the forefront. InPlay’s financial hedges and a resulting weaker Canadian dollar are expected to mitigate the impact of these tariffs on the Company.
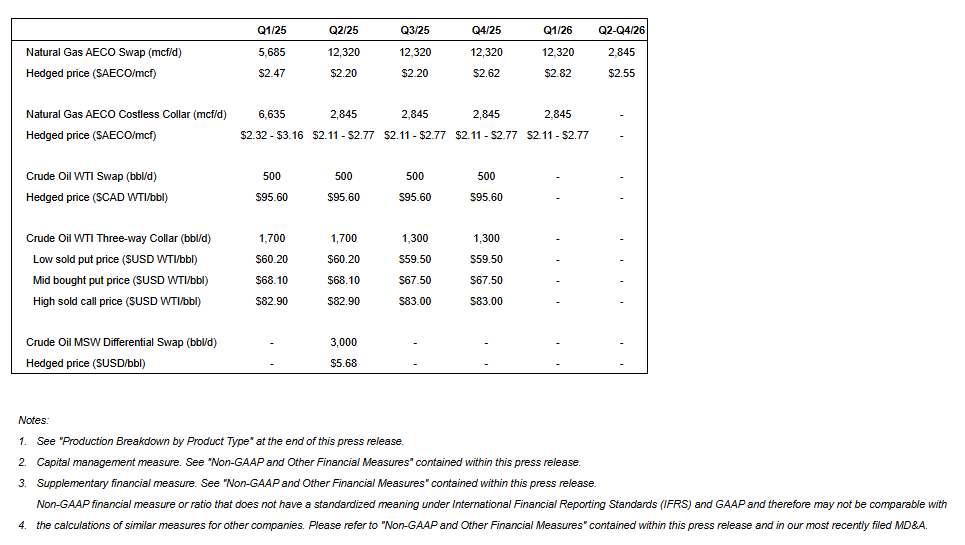
Hedging Update
The Company has reacted to commodity price volatility by securing commodity hedges extending through 2025 and into 2026. InPlay has hedged over 60% of pre-acquisition natural gas production and approximately 55% of pre-acquisition light crude oil production during 2025 at favorable pricing levels. Refer below for a summary of the Company’s commodity-based hedges.
2024 Reserves Results(1):
An organic 2024 capital program without acquisition/disposition (“A&D”) activity resulted in:
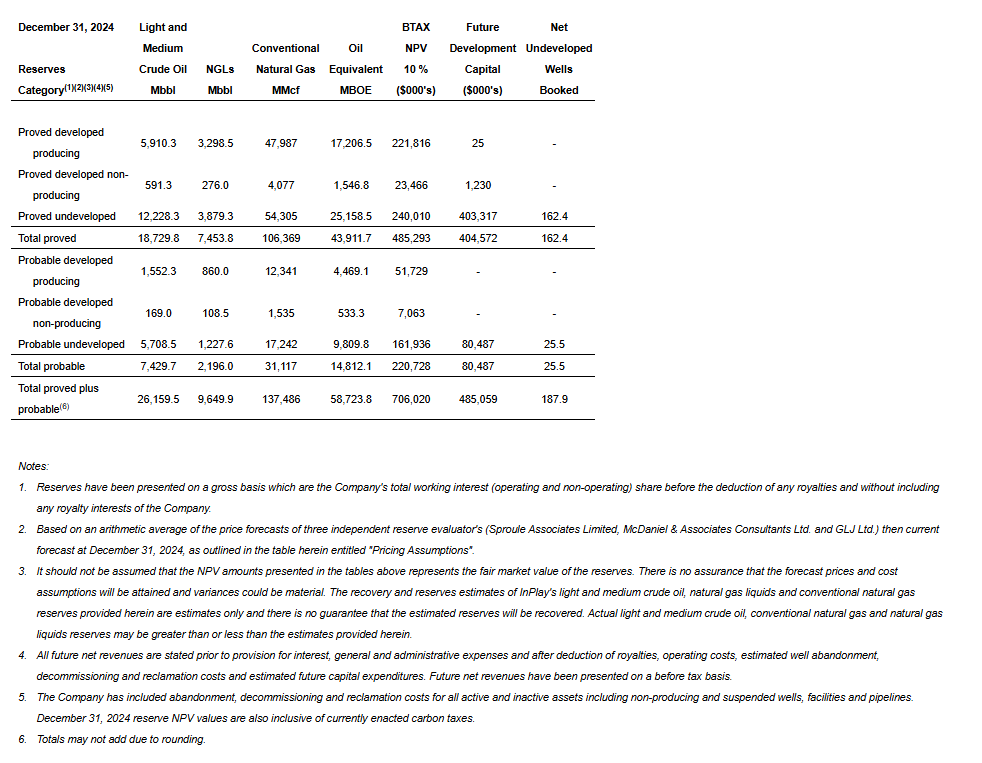
Proved developed producing (“PDP”) reserves of 17,207 mboe (54% light and medium crude oil & NGLs)
Total proved (“TP”) reserves of 43,912 mboe (60% light and medium crude oil & NGLs)
Total proved plus probable (“TPP”) reserves of 58,724 mboe (61% light and medium crude oil & NGLs)
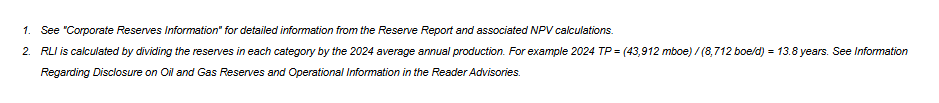
Reserves life index (“RLI”)(2) for PDP, TP and TPP of approximately 5.4 years, 13.8 years and 18.5 years, respectively highlights a sizable drilling inventory for long-term development potential.
Achieved NPV BT10 reserve values(1) of:
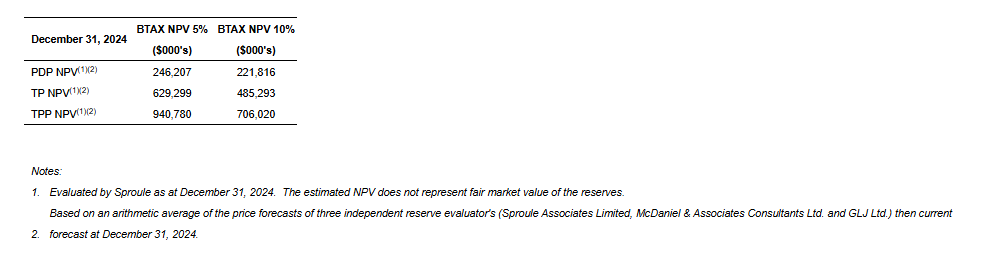
PDP: $222 million
TP: $485 million
TPP: $706 million
Corporate Reserves Information:
The following summarizes certain information contained in the Reserve Report. The Reserve Report was prepared in accordance with the definitions, standards and procedures contained in the COGE Handbook and National Instrument 51-101 Standards of Disclosure for Oil and Gas Activities (“NI 51-101”). Additional reserve information as required under NI 51-101 will be included in the Company’s Annual Information Form (“AIF”) which will be filed on SEDAR+ by the end of March 2025.
Net Present Values of Reserves:
InPlay achieved strong before tax estimated net present values (“NPV”) of future net revenues associated with our 2024 year-end reserves discounted at 10% (“NPV BT10”), although impacted by weaker future commodity prices in comparison to December 31, 2023. Forecasted WTI and AECO prices used in the Reserve Report decreased by 5% and 30% in year one and 2% and 18% in year two, respectively, compared to 2023. The Company achieved NPV BT10 reserve values of $222 million (PDP), $485 million (TP) and $706 million (TPP) based on the three independent reserve evaluator average pricing, cost forecast and foreign exchange rates as at December 31, 2024 used in the Reserve Report.
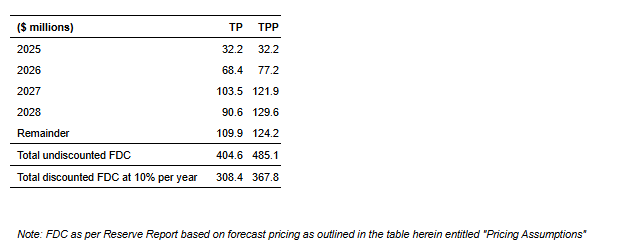
Future Development Costs (“FDCs”):
The following FDCs are included in the 2024 Reserve Report:
The $485 million of total FDC in the Reserve Report generates approximately $484 million in future net present value discounted at 10%.
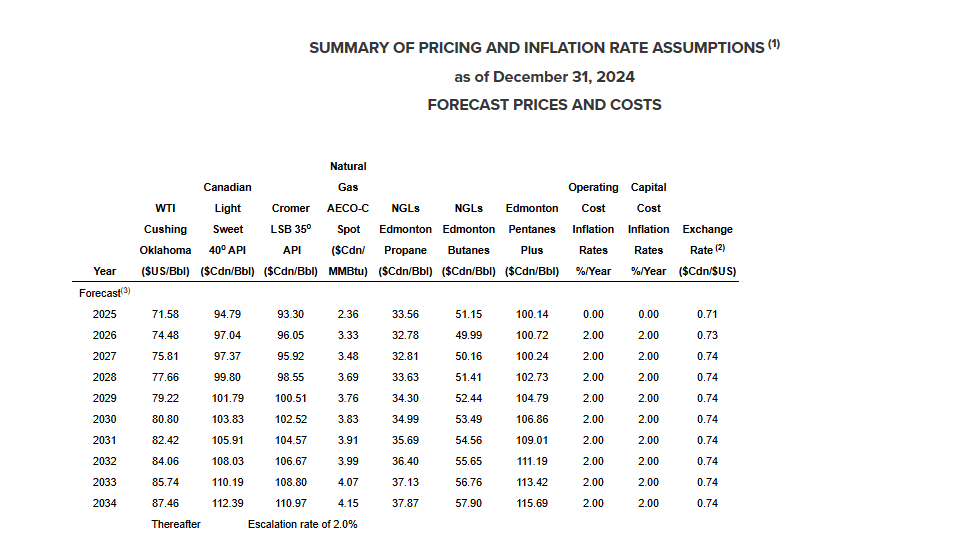
Pricing Assumptions:
The following tables set forth the benchmark reference prices, as at December 31, 2024, reflected in the Reserve Report. These price and cost assumptions were an arithmetic average of the price forecasts of three independent reserve evaluator’s (Sproule, McDaniel & Associates Consultants Ltd. and GLJ Ltd.) then current forecast and Sproule’s foreign exchange rate forecast at the effective date of the Reserve Report.
Forecasted WTI and AECO prices used in the Reserve Report decreased by 5% and 30% in year one and 2% and 18% in year two respectively compared to 2023.
InPlay also confirms that the management information circular (the “Circular”) and form of proxy with respect to the proposed Pembina Cardium asset acquisition and related matters have been mailed to the InPlay shareholders of record as of February 28, 2025. InPlay confirms that the Circular and form of proxy can be accessed and viewed on the Company’s website (www.inplayoil.com) or on the Company’s profile on SEDAR+ (www.sedarplus.ca).
For further information please contact:
Doug Bartole President and Chief Executive Officer InPlay Oil Corp. Telephone: (587) 955-0632
Throughout this document and other materials disclosed by the Company, InPlay uses certain measures to analyze financial performance, financial position and cash flow. These non-GAAP and other financial measures do not have any standardized meaning prescribed under GAAP and therefore may not be comparable to similar measures presented by other entities. The non-GAAP and other financial measures should not be considered alternatives to, or more meaningful than, financial measures that are determined in accordance with GAAP as indicators of the Company performance. Management believes that the presentation of these non-GAAP and other financial measures provides useful information to shareholders and investors in understanding and evaluating the Company’s ongoing operating performance, and the measures provide increased transparency and the ability to better analyze InPlay’s business performance against prior periods on a comparable basis.
Non-GAAP Financial Measures and Ratios
Included in this document are references to the terms “free adjusted funds flow”, “operating income”, “operating netback per boe”, “operating income profit margin” and “Net Debt to EBITDA”. Management believes these measures and ratios are helpful supplementary measures of financial and operating performance and provide users with similar, but potentially not comparable, information that is commonly used by other oil and natural gas companies. These terms do not have any standardized meaning prescribed by GAAP and should not be considered an alternative to, or more meaningful than “profit before taxes”, “profit and comprehensive income”, “adjusted funds flow”, “capital expenditures”, “net debt” or assets and liabilities as determined in accordance with GAAP as a measure of the Company’s performance and financial position.
Free Adjusted Funds Flow/FAFF per share
Management considers FAFF and FAFF per share important measures to identify the Company’s ability to improve its financial condition through debt repayment and its ability to provide returns to shareholders. FAFF should not be considered as an alternative to or more meaningful than AFF as determined in accordance with GAAP as an indicator of the Company’s performance. FAFF is calculated by the Company as AFF less exploration and development capital expenditures and property dispositions (acquisitions) and is a measure of the cashflow remaining after capital expenditures before corporate acquisitions that can be used for additional capital activity, corporate acquisitions, repayment of debt or decommissioning expenditures or potentially return of capital to shareholders. FAFF per share is calculated by the Company as FAFF divided by weighted average shares outstanding. Refer to the “Forward Looking Information and Statements” section for a calculation of forecast FAFF.
Free Adjusted Funds Flow Yield
InPlay uses “free adjusted funds flow yield” as a key performance indicator. When presented on a corporate basis, free adjusted funds flow is calculated by the Company as free adjusted funds flow divided by the market capitalization of the Company. When presented on an asset basis for acquisition purposes, free adjusted funds flow is calculated by the Company as free adjusted funds flow divided by the operating income of the Acquired Assets. Management considers FAFF yield to be an important performance indicator as it demonstrates a Company or asset’s ability to generate cash to pay down debt and provide funds for potential distributions to shareholders. Refer to the “Forward Looking Information and Statements” section for a calculation of forecast FAFF Yield.
Operating Income/Operating Netback per boe/Operating Income Profit Margin
InPlay uses “operating income”, “operating netback per boe” and “operating income profit margin” as key performance indicators. Operating income is calculated by the Company as oil and natural gas sales less royalties, operating expenses and transportation expenses and is a measure of the profitability of operations before administrative, share-based compensation, financing and other non-cash items. Management considers operating income an important measure to evaluate its operational performance as it demonstrates its field level profitability. Operating income should not be considered as an alternative to or more meaningful than net income as determined in accordance with GAAP as an indicator of the Company’s performance. Operating netback per boe is calculated by the Company as operating income divided by average production for the respective period. Management considers operating netback per boe an important measure to evaluate its operational performance as it demonstrates its field level profitability per unit of production. Operating income profit margin is calculated by the Company as operating income as a percentage of oil and natural gas sales. Management considers operating income profit margin an important measure to evaluate its operational performance as it demonstrates how efficiently the Company generates field level profits from its sales revenue. Refer below for a calculation of operating income, operating netback per boe and operating income profit margin. Refer to the “Forward Looking Information and Statements” section for a calculation of forecast operating income, operating netback per boe and operating income profit margin.
(thousands of dollars)
Three Months EndedDecember 31
Year EndedDecember 31
2024
2023
2024
2023
Revenue
40,039
47,631
153,713
179,366
Royalties
(5,253)
(6,339)
(19,964)
(22,516)
Operating expenses
(12,413)
(13,233)
(48,198)
(49,576)
Transportation expenses
(786)
(940)
(3,083)
(3,130)
Operating income
21,587
27,119
82,468
104,144
Sales volume (Mboe)
862.6
882.8
3,188.5
3,294.1
Per boe
Revenue
46.42
53.95
48.21
54.45
Royalties
(6.09)
(7.18)
(6.26)
(6.84)
Operating expenses
(14.39)
(14.99)
(15.12)
(15.05)
Transportation expenses
(0.91)
(1.06)
(0.97)
(0.95)
Operating netback per boe
25.03
30.72
25.86
31.61
Operating income profit margin
54 %
57 %
54 %
58 %
Net Debt to EBITDA
Management considers Net Debt to EBITDA an important measure as it is a key metric to identify the Company’s ability to fund financing expenses, net debt reductions and other obligations. EBITDA is calculated by the Company as adjusted funds flow before interest expense. When this measure is presented quarterly, EBITDA is annualized by multiplying by four. When this measure is presented on a trailing twelve month basis, EBITDA for the twelve months preceding the net debt date is used in the calculation. This measure is consistent with the EBITDA formula prescribed under the Company’s Senior Credit Facility. Net Debt to EBITDA is calculated as Net Debt divided by EBITDA. Refer to the “Forward Looking Information and Statements” section for a calculation of forecast Net Debt to EBITDA.
Capital Management Measures
Adjusted Funds Flow
Management considers adjusted funds flow to be an important measure of InPlay’s ability to generate the funds necessary to finance capital expenditures. Adjusted funds flow is a GAAP measure and is disclosed in the notes to the Company’s financial statements for the year ended December 31, 2024. All references to adjusted funds flow throughout this document are calculated as funds flow adjusting for decommissioning expenditures. Decommissioning expenditures are adjusted from funds flow as they are incurred on a discretionary and irregular basis and are primarily incurred on previous operating assets. The Company also presents adjusted funds flow per share whereby per share amounts are calculated using weighted average shares outstanding consistent with the calculation of profit per common share.
Net Debt
Net debt is a GAAP measure and is disclosed in the notes to the Company’s financial statements for the year ended December 31, 2024. The Company closely monitors its capital structure with the goal of maintaining a strong balance sheet to fund the future growth of the Company. The Company monitors net debt as part of its capital structure. The Company uses net debt (bank debt plus accounts payable and accrued liabilities less accounts receivables and accrued receivables, prepaid expenses and deposits and inventory) as an alternative measure of outstanding debt. Management considers net debt an important measure to assist in assessing the liquidity of the Company.
Free Funds Flow
Management considers free funds flow to be an important measure of InPlay’s ability to generate the funds necessary after capital expenditures and decommissioning expenditures to improve its financial condition through debt repayment and its ability to provide returns to shareholders. Free funds flow is comprised of GAAP measures disclosed in the notes to the Company’s financial statements for the year ended December 31, 2024. All references to free funds flow throughout this document are calculated as funds flow less exploration and development capital expenditures and property dispositions (acquisitions).
Supplementary Measures
“Average realized crude oil price” is comprised of crude oil commodity sales from production, as determined in accordance with IFRS, divided by the Company’s crude oil volumes. Average prices are before deduction of transportation costs and do not include gains and losses on financial instruments.
“Average realized NGL price” is comprised of NGL commodity sales from production, as determined in accordance with IFRS, divided by the Company’s NGL volumes. Average prices are before deduction of transportation costs and do not include gains and losses on financial instruments.
“Average realized natural gas price” is comprised of natural gas commodity sales from production, as determined in accordance with IFRS, divided by the Company’s natural gas volumes. Average prices are before deduction of transportation costs and do not include gains and losses on financial instruments.
“Average realized commodity price” is comprised of commodity sales from production, as determined in accordance with IFRS, divided by the Company’s volumes. Average prices are before deduction of transportation costs and do not include gains and losses on financial instruments.
“Adjusted funds flow per weighted average basic share” is comprised of adjusted funds flow divided by the basic weighted average common shares.
“Adjusted funds flow per weighted average diluted share” is comprised of adjusted funds flow divided by the diluted weighted average common shares.
“Adjusted funds flow per boe” is comprised of adjusted funds flow divided by total production.
Forward-Looking Information and Statements
This document contains certain forward–looking information and statements within the meaning of applicable securities laws. The use of any of the words “expect”, “anticipate”, “continue”, “estimate”, “may”, “will”, “project”, “should”, “believe”, “plans”, “intends”, “forecast” and similar expressions are intended to identify forward-looking information or statements. In particular, but without limiting the foregoing, this document contains forward-looking information and statements pertaining to the following: the Company’s business strategy, milestones and objectives; the Company’s expectation that an updated presentation will be available after closing of the Pembina Cardium asset acquisition and the timing of such closing; the Company’s belief that the upcoming year will be transformational for InPlay; the Company’s beliefs and expectations regarding the Pembina Cardium asset acquisition, including that it will fundamentally shift the future of the Company, expand the Company’s operational scale, enhance the Company’s overall sustainability, and strengthen FAFF generation, enabling debt reduction and supporting the Company’s shareholder return strategy; the Company’s belief that the acquired assets will strategically complement InPlay’s existing holdings in the Pembina Cardium; the Company’s expectations regarding its expertise and ability to unlock the intrinsic value of its share price; the Company’s belief that it will remain committed to financial discipline maintaining its strong balance sheet, to ultimately generate shareholder value through FAFF growth and return of capital to shareholders; the Company’s belief that the operational enhancements to the drilling PCU7 program can be leveraged to the Company’s other Cardium assets, including those acquired as part of the Pembina Cardium asset acquisition; the Company’s expectation that it following closing of the Pembina Cardium asset acquisition, it will provide updated development plans and revised full-year 2025 guidance; expectations regarding the Company’s PCU7 asset; expectations regarding the Company’s 2025 capital program; the Company’s belief that it will monitor the impact of tariffs and will make decisions keeping the Company’s strategy of disciplined capital allocation, financial flexibility and returns to shareholders at the forefront; expectations regarding the Company’s hedges, including that its financial hedges and a resulting weaker Canadian dollar will mitigate the impact of tariffs on the Company; 2025 forecast production; 2025 guidance and 2025 pro-forma estimates related to the proposed Pembina asset acquisition based on the planned capital program and all associated underlying assumptions set forth in this document including, without limitation, forecasts of 2025 annual average production levels, adjusted funds flow, free adjusted funds flow, Net Debt/EBITDA ratio, operating income profit margin, net debt and Management’s belief that the Company can grow some or all of these attributes and specified measures; light crude oil and NGLs weighting estimates; expectations regarding future commodity prices; future oil and natural gas prices; future liquidity and financial capacity; future results from operations and operating metrics; future costs, expenses and royalty rates; future interest costs; the exchange rate between the $US and $Cdn; future development, exploration, acquisition, development and infrastructure activities and related capital expenditures, including InPlay’s planned 2025 capital program; the amount and timing of capital projects; and methods of funding our capital program.
The internal projections, expectations, or beliefs underlying our Board approved 2025 capital budget and associated guidance are subject to change in light of, among other factors, changes to U.S. economic, regulatory and/or trade policies (including tariffs), the impact of world events including the Russia/Ukraine conflict and war in the Middle East, ongoing results, prevailing economic circumstances, volatile commodity prices, and changes in industry conditions and regulations. InPlay’s 2025 financial outlook and revised guidance provides shareholders with relevant information on management’s expectations for results of operations, excluding any potential acquisitions or dispositions, for such time periods based upon the key assumptions outlined herein. Readers are cautioned that events or circumstances could cause capital plans and associated results to differ materially from those predicted and InPlay’s revised guidance for 2025 may not be appropriate for other purposes. Accordingly, undue reliance should not be placed on same.
Forward-looking statements or information are based on a number of material factors, expectations or assumptions of InPlay which have been used to develop such statements and information, but which may prove to be incorrect. Although InPlay believes that the expectations reflected in such forward-looking statements or information are reasonable, undue reliance should not be placed on forward-looking statements because InPlay can give no assurance that such expectations will prove to be correct. In addition to other factors and assumptions which may be identified herein, assumptions have been made regarding, among other things: the current U.S. economic, regulatory and/or trade policies; the impact of increasing competition; the general stability of the economic and political environment in which InPlay operates; the timely receipt of any required regulatory approvals; the ability of InPlay to obtain qualified staff, equipment and services in a timely and cost efficient manner; drilling results; the ability of the operator of the projects in which InPlay has an interest in to operate the field in a safe, efficient and effective manner; the ability of InPlay to obtain debt financing on acceptable terms; the anticipated tax treatment of the monthly base dividend; that other than the tariffs that came into effect on March 4, 2025 (some of which were subsequently paused on March 6, 2025), neither the U.S. nor Canada (i) increases the rate or scope of such tariffs (if they come into effect in the future), or imposes new tariffs, on the import of goods from one country to the other, including on oil and natural gas, and/or (ii) imposes any other form of tax, restriction or prohibition on the import or export of products from one country to the other, including on oil and natural gas; the potential scope and duration of tariffs, export taxes, export restrictions or other trade actions; magnitude and duration of potential new or increased tariffs may be imposed on goods imported from Canada into the United States, which could adversely impact InPlay’s revenues; the potential for new and increased U.S. tariffs and protectionist trade measures on Canadian oil and gas imports; changes in political and economic conditions, including risks associated with tariffs, export taxes, export restrictions or other trade actions; impacts of any tariffs imposed on Canadian exports into the United States by the Trump administration and any retaliatory steps taken by the Canadian federal government; that InPlay’s results and operations could be adversely affected by economic or geopolitical developments, including protectionist trade policies such as tariffs, or other events; conditions in international markets, including social and political conditions, civil unrest, terrorist activity, governmental changes, restrictions on the ability to transfer capital across borders, tariffs and other protectionist measures; field production rates and decline rates; the ability to replace and expand oil and natural gas reserves through acquisition, development and exploration; the timing and cost of pipeline, storage and facility construction and the ability of InPlay to secure adequate product transportation; future commodity prices; that various conditions to a shareholder return strategy can be satisfied; the ongoing impact of the Russia/Ukraine conflict and war in the Middle East; currency, exchange and interest rates; regulatory framework regarding royalties, taxes and environmental matters in the jurisdictions in which InPlay operates; and the ability of InPlay to successfully market its oil and natural gas products.
Without limitation of the foregoing, readers are cautioned that the Company’s future dividend payments to shareholders of the Company, if any, and the level thereof will be subject to the discretion of the Board of Directors of InPlay. The Company’s dividend policy and funds available for the payment of dividends, if any, from time to time, is dependent upon, among other things, levels of FAFF, leverage ratios, financial requirements for the Company’s operations and execution of its growth strategy, fluctuations in commodity prices and working capital, the timing and amount of capital expenditures, credit facility availability and limitations on distributions existing thereunder, and other factors beyond the Company’s control. Further, the ability of the Company to pay dividends will be subject to applicable laws, including satisfaction of solvency tests under the Business Corporations Act (Alberta), and satisfaction of certain applicable contractual restrictions contained in the agreements governing the Company’s outstanding indebtedness. Further, the actual amount, the declaration date, the record date and the payment date of any dividend are subject to the discretion of the InPlay Board of Directors. There can be no assurance that InPlay will pay dividends in the future.
The forward-looking information and statements included herein are not guarantees of future performance and should not be unduly relied upon. Such information and statements, including the assumptions made in respect thereof, involve known and unknown risks, uncertainties and other factors that may cause actual results or events to defer materially from those anticipated in such forward-looking information or statements including, without limitation: changes in industry regulations and legislation (including, but not limited to, tax laws, royalties, and environmental regulations); the risk that the Pembina Cardium asset acquisition may not be completed on the anticipated terms or timing; risks related to an international trade war, including the risk that the U.S. government imposes additional tariffs on Canadian goods, including crude oil and natural gas, and that such tariffs (and/or the Canadian government’s response to such tariffs) adversely affect the demand and/or market price for InPlay’s products and/or otherwise adversely affects InPlay, or lead to the termination of InPlay’s financing arrangements for the Pembina Cardium asset acquisition, including specifically that the imposition of tariffs or similar measures in excess of 10% would be an adverse tariff event for the purposes of InPlay’s new credit facilities to be entered into in connection with the transaction and that the lenders thereunder may choose not to fund the transaction; the continuing impact of the Russia/Ukraine conflict and war in the Middle East; potential changes to U.S. economic, regulatory and/or trade policies as a result of a change in government; inflation and the risk of a global recession; changes in our planned 2025 capital program; changes in our approach to shareholder returns; changes in commodity prices and other assumptions outlined herein; the risk that dividend payments may be reduced, suspended or cancelled; the potential for variation in the quality of the reservoirs in which InPlay operates; changes in the demand for or supply of InPlay’s products; unanticipated operating results or production declines; changes in tax or environmental laws, royalty rates or other regulatory matters; changes in development plans or strategies of InPlay or by third party operators of InPlay’s properties; changes in InPlay’s credit structure, increased debt levels or debt service requirements; inaccurate estimation of InPlay’s light crude oil and natural gas reserve and resource volumes; limited, unfavorable or a lack of access to capital markets; increased costs; a lack of adequate insurance coverage; the impact of competitors; and certain other risks detailed from time-to-time in InPlay’s continuous disclosure documents filed on SEDAR+ including InPlay’s Annual Information Form dated March 27, 2024 and the annual management’s discussion & analysis for the year ended December 31, 2024.
This document contains future-oriented financial information and financial outlook information (collectively, “FOFI”) about InPlay’s financial and leverage targets and objectives, potential dividends, and beliefs underlying our Board approved 2025 capital budget and associated guidance, all of which are subject to the same assumptions, risk factors, limitations, and qualifications as set forth in the above paragraphs. The actual results of operations of InPlay and the resulting financial results will likely vary from the amounts set forth in this document and such variation may be material. InPlay and its management believe that the FOFI has been prepared on a reasonable basis, reflecting management’s reasonable estimates and judgments. However, because this information is subjective and subject to numerous risks, it should not be relied on as necessarily indicative of future results. Except as required by applicable securities laws, InPlay undertakes no obligation to update such FOFI. FOFI contained in this document was made as of the date of this document and was provided for the purpose of providing further information about InPlay’s anticipated future business operations and strategy. Readers are cautioned that the FOFI contained in this document should not be used for purposes other than for which it is disclosed herein.
The forward-looking information and statements contained in this document speak only as of the date hereof and InPlay does not assume any obligation to publicly update or revise any of the included forward-looking statements or information, whether as a result of new information, future events or otherwise, except as may be required by applicable securities laws.
InPlay’s 2024 annual guidance and a comparison to 2024 actual results are outlined below.
GuidanceFY 2024(1)
ActualsFY 2024
Variance
Variance (%)
Production
Boe/d
8,700 – 8,750
8,712
–
–
Adjusted Funds Flow
$ millions
$68 – $70
$68.5
–
–
Capital Expenditures
$ millions
$63
$63
–
–
Free Adjusted Funds Flow
$ millions
$5 – $7
$5.5
–
–
Net Debt
$ millions
$59 – $61
$61
–
–
(1) As previously released February 4, 2025.
Risk Factors to FLI
Risk factors that could materially impact successful execution and actual results of the Company’s 2025 capital program and associated guidance and estimates include:
risks related to an international trade war, including the risk that the U.S. government imposes additional tariffs on Canadian goods, including crude oil and natural gas, and that such tariffs (and/or the Canadian government’s response to such tariffs) adversely affect the demand and/or market price for the Company’s products and/or otherwise adversely affects the Company;
volatility of petroleum and natural gas prices and inherent difficulty in the accuracy of predictions related thereto;
the extent of any unfavourable impacts of wildfires in the province of Alberta.
changes in Federal and Provincial regulations;
the Company’s ability to secure financing for the Board approved 2025 capital program and longer-term capital plans sourced from AFF, bank or other debt instruments, asset sales, equity issuance, infrastructure financing or some combination thereof; and
those additional risk factors set forth in the Company’s MD&A and most recent Annual Information Form filed on SEDAR+.
Key Budget and Underlying Material Assumptions to FLI
The key budget and underlying material assumptions used by the Company in the development of its 2025 guidance and 2025 pro-forma estimates(3) relating to the proposed acquisition of Pembina Cardium assets from Obsidian Energy Ltd. are as follows:
ActualsFY 2024
GuidanceFY 2024(1)
GuidanceFY 2025(1)
Pro-formaEstimateFY 2025(2)(3)(4)
WTI
US$/bbl
$75.72
$75.72
$72.00
$72.65
NGL Price
$/boe
$32.99
$32.90
35.40
48.65
AECO
$/GJ
$1.39
$1.39
$1.90
$1.85
Foreign Exchange Rate
CDN$/US$
0.73
0.73
0.70
0.70
MSW Differential
US$/bbl
$4.51
$4.50
$4.50
$4.75
Production
Boe/d
8,712
8,700 – 8,750
8,650 – 9,150
18,750
Revenue
$/boe
48.21
47.75 – 48.75
46.00 – 51.00
56.50 – 61.50
Royalties
$/boe
6.26
6.00 – 6.50
5.50 – 7.00
7.00 – 8.50
Operating Expenses
$/boe
15.12
14.50 – 15.50
13.00 – 15.00
16.00 – 18.00
Transportation
$/boe
0.97
0.90 – 1.05
0.90 – 1.15
0.90 – 1.15
Interest
$/boe
2.19
2.00 – 2.25
1.30 – 1.90
2.20 – 2.80
General and Administrative
$/boe
3.06
2.90 – 3.20
3.00 – 3.75
1.50 – 2.25
Hedging loss (gain)
$/boe
(0.86)
(0.75 – (1.00)
0.00 – 0.25
0.00 – 0.50
Decommissioning Expenditures
$ millions
$3.4
$3.2 – $3.4
$3.0 – $3.5
$6.0
Adjusted Funds Flow
$ millions
$68.5
$68 – $70
$69 – $75
$204
Dividends
$ millions
$16
$16
$16.5
$26
ActualsFY 2024
GuidanceFY 2024(1)
GuidanceFY 2025(1)
Pro-formaEstimateFY 2025(2)(3)(4)
Adjusted Funds Flow
$ millions
$68.5
$68 – $70
$69 – $75
$204
Capital Expenditures
$ millions
$63
$63
$41 – $44
$94
Free Adjusted Funds Flow
$ millions
$5.5
$5 – $7
$25 – $34
$104
Shares outstanding, end of year
# millions
90.1
90.1
90.4
158
Assumed share price
$/share
$1.73
$1.73
$1.65
1.55
Market capitalization
$ millions
$156
$156
$150
245
FAFF Yield
%
4 %
3% – 4%
17% – 23%
42 %
ActualsFY 2024
GuidanceFY 2024(1)
GuidanceFY 2025(1)
Pro-formaEstimateFY 2025(2)(3)(4)
Revenue
$/boe
48.21
47.75 – 48.75
46.00 – 51.00
56.50 – 61.50
Royalties
$/boe
6.26
6.00 – 6.50
5.50 – 7.00
7.00 – 8.50
Operating Expenses
$/boe
15.12
14.50 – 15.50
13.00 – 15.00
16.00 – 18.00
Transportation
$/boe
0.97
0.90 – 1.05
0.90 – 1.15
0.90 – 1.15
Operating Netback
$/boe
25.86
25.50 – 26.50
24.75 – 29.75
31.50 – 36.50
Operating Income Profit Margin
54 %
54 %
56 %
58 %
ActualsFY 2024
GuidanceFY 2024(1)
GuidanceFY 2025(1)
Pro-formaEstimateFY 2025(2)(3)(4)
Adjusted Funds Flow
$ millions
$68.5
$68 – $70
$69 – $75
$204
Interest
$/boe
2.19
2.00 – 2.25
1.30 – 1.90
2.20 – 2.80
EBITDA
$ millions
$76
$75 – $77
$74 – $80
$221
Net Debt
$ millions
$61
$59 – $61
$52 – $58
$203
Net Debt/EBITDA
0.8
0.8
0.6 – 0.8
0.9
(1)
As previously released February 4, 2025.
(2)
As previously released February 19, 2025.
(3)
InPlay’s pro-forma estimate for 2025 are preliminary in nature and do not reflect a Board approved capital expenditure budget. Following closing of the Pembina Cardium asset acquisition, InPlay will provide updated development plans and revised full-year 2025 guidance.
(4)
2025E pro forma estimates have been presented as though InPlay acquired the Acquired Assets at January 1, 2025 notwithstanding that income from January 1, 2025 to closing represents a purchase price adjustment and such production will not be directly attributed to InPlay.
See “Production Breakdown by Product Type” below
Quality and pipeline transmission adjustments may impact realized oil prices in addition to the MSW Differential provided above
Changes in working capital are not assumed to have a material impact between the years presented above.
Information Regarding Disclosure on Oil and Gas Reserves and Operational Information
Our oil and gas reserves statement for the year ended December 31, 2024, which will include complete disclosure of our oil and gas reserves and other oil and gas information in accordance with NI 51-101, will be contained within our Annual Information Form which will be available on our SEDAR profile at www.sedarplus.ca on or before March 31, 2025. The recovery and reserve estimates contained herein are estimates only and there is no guarantee that the estimated reserves will be recovered. In relation to the disclosure of estimates for individual properties, such estimates may not reflect the same confidence level as estimates of reserves and future net revenue for all properties, due to the effects of aggregation. The Company’s belief that it will establish additional reserves over time with conversion of probable undeveloped reserves into proved reserves is a forward-looking statement and is based on certain assumptions and is subject to certain risks, as discussed above under the heading “Forward-Looking Information and Statements”.
This press release contains metrics commonly used in the oil and natural gas industry, such as “operating netbacks” and “reserve life index” or “RLI”. Each of these terms are calculated by InPlay as described within this press release. These terms do not have standardized meanings or standardized methods of calculation and therefore may not be comparable to similar measures presented by other companies, and therefore should not be used to make such comparisons. Such metrics have been included herein to provide readers with additional information to evaluate the Company’s performance, however such metrics should not be unduly relied upon.
Management uses these oil and gas metrics for its own performance measurements and to provide shareholders with measures to compare InPlay’s operations over time, however such measures are not reliable indicators of InPlay’s future performance and future performance may not be comparable to the performance in prior periods. Readers are cautioned that the information provided by these metrics, or that can be derived from the metrics presented in this press release, should not be relied upon for investment or other purposes, however such measures are not reliable indicators on InPlay’s future performance and future performance may not be comparable to the performance in prior periods.
References to light crude oil, NGLs or natural gas production in this press release refer to the light and medium crude oil, natural gas liquids and conventional natural gas product types, respectively, as defined in National Instrument 51-101, Standards of Disclosure for Oil and Gas Activities (“Nl 51-101“).
Production Breakdown by Product Type
Disclosure of production on a per boe basis in this document consists of the constituent product types as defined in NI 51–101 and their respective quantities disclosed in the table below:
Light and Medium Crude oil(bbls/d)
NGLs(boe/d)
Conventional Natural gas(Mcf/d)
Total(boe/d)
Q4 2023 Average Production
4,142
1,520
23,606
9,596
2023 Average Production
3,822
1,396
22,839
9,025
Q4 2024 Average Production
3,691
1,651
24,203
9,376
2024 Average Production
3,523
1,499
22,139
8,712
2024 Annual Guidance
3,535
1,495
22,170
8,725(1)
2025 Annual Guidance
3,425
1,510
23,790
8,900(2)
2025 Pro Forma Estimate
9,535
2,180
42,215
18,750
Notes:
1.
This reflects the mid-point of the Company’s 2024 production guidance range of 8,700 to 8,750 boe/d.
2.
This reflects the mid-point of the Company’s 2025 production guidance range of 8,650 to 9,150 boe/d.
3.
With respect to forward–looking production guidance, product type breakdown is based upon management’s expectations based on reasonable assumptions but are subject to variability based on actual well results.
BOE equivalent
Barrel of oil equivalents or BOEs may be misleading, particularly if used in isolation. A BOE conversion ratio of 6 mcf: 1 bbl is based on an energy equivalency conversion method primarily applicable at the burner tip and does not represent a value equivalency at the wellhead. Given that the value ratio based on the current price of crude oil as compared to natural gas is significantly different than the energy equivalency of 6:1, utilizing a 6:1 conversion basis may be misleading as an indication of value.
Initial Production Rates
References in this press release to IP rates, other short-term production rates or initial performance measures relating to new wells are useful in confirming the presence of hydrocarbons; however, such rates are not determinative of the rates at which such wells will commence production and decline thereafter and are not indicative of long-term performance or of ultimate recovery. While encouraging, readers are cautioned not to place reliance on such rates in calculating the aggregate production for the Company. Accordingly, the Company cautions that the test results should be considered to be preliminary.
Key Points: -The Dow bounced 500 points but remains on track for its steepest weekly loss since March 2023. – Consumer confidence dropped sharply amid ongoing tariff-related concerns and inflationary pressures. – The market awaits next week’s Fed meeting, where rates are expected to remain unchanged.
The stock market experienced a sharp rebound on Friday, with the Dow Jones Industrial Average surging more than 500 points. The S&P 500 and Nasdaq also posted gains of 1.7% and 2.2%, respectively. Despite the rally, the major indices remain on pace for significant weekly losses, marking the worst performance for the Dow in two years and further cementing concerns over continued volatility on Wall Street.
Technology stocks were among the biggest gainers in Friday’s session, with Nvidia jumping over 4%, while Tesla, Meta, Netflix, Amazon, and Apple all posted modest gains. The positive momentum was partially driven by news that a government shutdown is likely to be avoided, as Senate minority leader Chuck Schumer signaled support for a Republican-led funding bill.
However, economic data released on Friday cast a shadow over investor sentiment. The University of Michigan’s Consumer Sentiment Index fell to 57.9 in March, well below expectations of 63.2. The decline highlights growing anxieties over inflation, trade tensions, and the broader economic outlook. A rising 10-year Treasury yield and concerns over inflation expectations have added to market uncertainty, making it difficult to gauge the sustainability of Friday’s rebound.
While large-cap stocks have seen a sharp selloff, small-cap stocks have been hit even harder. The Russell 2000, which tracks small-cap companies, has fallen nearly 18% from its recent high, pushing it closer to bear market territory. Small-cap stocks are often more sensitive to economic uncertainty and interest rate fluctuations, making them particularly vulnerable in the current environment. Rising borrowing costs and concerns over consumer demand have weighed on these companies, many of which rely heavily on domestic growth and credit availability.
However, amid market turmoil, value stocks could present an opportunity for investors seeking stability. Historically, value stocks—companies with strong fundamentals and lower valuations—tend to outperform during periods of market distress. With uncertainty surrounding inflation, interest rates, and trade policies, investors may rotate into sectors such as utilities, consumer staples, and healthcare, which typically offer defensive characteristics. Additionally, as fears of a potential recession grow, businesses with stable earnings and strong cash flow could see increased investor interest.
The week’s market selloff accelerated after the S&P 500 fell 1.4% on Thursday, officially entering correction territory with a decline of over 10% from its record high last month. The Nasdaq Composite has suffered even steeper losses, down more than 9% year-to-date. Meanwhile, the small-cap Russell 2000 index has dropped nearly 18% from its recent peak, nearing bear market territory with a 20% decline. This marks four consecutive weeks of losses for the S&P 500 and Nasdaq, as well as the second straight losing week for the Dow.
Much of the recent volatility has been attributed to President Trump’s fluctuating trade policies, which have increased uncertainty regarding tariffs and their economic implications. The unpredictable nature of the administration’s approach has led to heightened market swings, with investors struggling to navigate the changing landscape.
Looking ahead, all eyes are on next week’s Federal Reserve policy meeting. Market participants overwhelmingly expect the Fed to hold interest rates steady, with futures pricing in a 97% likelihood of no change. However, investors remain wary of any signals regarding future policy moves, particularly as inflation concerns continue to mount.
With uncertainty dominating the financial landscape, investors are bracing for more turbulence in the weeks ahead. While Friday’s rally provided a temporary reprieve, the broader trend remains cautious as economic and policy concerns continue to weigh on sentiment.
Robert LeBoyer, Senior Vice President, Equity Research Analyst, Biotechnology, Noble Capital Markets, Inc.
Refer to the full report for the price target, fundamental analysis, and rating.
Product Sales Drove Revenue Growth. Zomedica reported 4Q24 revenues of $7.9 million and FY2024 revenues $27.3 million, in line with our estimates of $8.0 million and $27.5 million. Gross Margins were 70.0% as expected, with a loss for FY2024 of $46.9 million or $(0.05) per share. Cash and equivalents on December 31 was $71.4 million.
CEO Addressed Recent Stock Delisting. At the beginning of the quarterly conference call, CEO Larry Heaton spoke about the events leading to the delisting from the New York American Exchange earlier this month. As discussed in our Research Note on March 11, the recent market weakness brought the stock below the threshold for continued listing. This weakness led to a move to the OTCQB Venture Market, causing further weakness.
Equity Research is available at no cost to Registered users of Channelchek. Not a Member? Click ‘Join’ to join the Channelchek Community. There is no cost to register, and we never collect credit card information.
This Company Sponsored Research is provided by Noble Capital Markets, Inc., a FINRA and S.E.C. registered broker-dealer (B/D).
*Analyst certification and important disclosures included in the full report. NOTE: investment decisions should not be based upon the content of this research summary. Proper due diligence is required before making any investment decision.
Robert LeBoyer, Senior Vice President, Equity Research Analyst, Biotechnology, Noble Capital Markets, Inc.
Refer to the full report for the price target, fundamental analysis, and rating.
FY2024 Was A Productive Year. Cadrenal reported a 4Q24 loss of $4.2 million or $(2.55) per share and FY2024 loss of $10.7 million or $(8.73) per share. An important development discussed in our Research Note on March 5 was Cadrenal’s announcement of a collaborative agreement with Abbott (ABT, Not Rated) for support of its pivotal trial testing tecarfarin in patients with left ventricular assist (LVAD) devices. Cash and equivalents on December 31 were $10.0 million.
Tecarfarin Is In Development For Several Patient Populations With Coagulation Needs. Many patients that are at risk for cardiovascular events (stroke, embolism, deep vein thrombosis) take anticoagulants in the direct oral anticoagulant class (DOACs, such as Eliquis or Xarelto). However, there are several patient populations that must take warfarin, an older drug, due to lack of efficacy or high bleeding risk. Tecarfarin is being developed to replace warfarin in these populations. Cadrenal has Orphan Drug designation from the FDA for implanted mechanical devices (LVADs) and prevention of systemic thromboembolism in end-stage kidney disease (ESKD) and atrial fibrillation (AFib).
Equity Research is available at no cost to Registered users of Channelchek. Not a Member? Click ‘Join’ to join the Channelchek Community. There is no cost to register, and we never collect credit card information.
This Company Sponsored Research is provided by Noble Capital Markets, Inc., a FINRA and S.E.C. registered broker-dealer (B/D).
*Analyst certification and important disclosures included in the full report. NOTE: investment decisions should not be based upon the content of this research summary. Proper due diligence is required before making any investment decision.
Mark Reichman, Managing Director, Equity Research Analyst, Natural Resources, Noble Capital Markets, Inc.
Refer to the full report for the price target, fundamental analysis, and rating.
Full year 2024 financial results. FreightCar America generated 2024 adjusted net income to common stockholders of $4.4 million or $0.15 per share compared to a loss of $11.0 million or $(0.39) per share in 2023 and our estimate of $5.5 million or $0.17 per share. Gross margin as a percentage of revenue increased to 12.0% compared to 11.7% in FY 2023. Revenue and rail car deliveries increased to $559.4 million and 4,362 compared to $358.1 million and 3,022 in 2023. We had forecast revenue of $577.4 million and deliveries of 4,550. Adjusted EBITDA increased to $43.0 million compared to $20.1 million in 2023 and our estimate of $38.3 million. Full year adjusted free cash flow amounted to $21.7 million versus $(17.6) million in 2023.
Full Year 2025 corporate guidance. Management issued full year 2025 guidance. Railcar deliveries are expected to be in the range of 4,500 to 4,900, revenue is expected to be in the range of $530 million to $595 million, and adjusted EBITDA is expected to be in the range of $43 to $49 million. Compared to 2024, railcar deliveries, revenue, and adjusted EBITDA are expected to increase 7.7%, 0.6%, and 7.0%, respectively, at the midpoints of guidance.
Equity Research is available at no cost to Registered users of Channelchek. Not a Member? Click ‘Join’ to join the Channelchek Community. There is no cost to register, and we never collect credit card information.
This Company Sponsored Research is provided by Noble Capital Markets, Inc., a FINRA and S.E.C. registered broker-dealer (B/D).
*Analyst certification and important disclosures included in the full report. NOTE: investment decisions should not be based upon the content of this research summary. Proper due diligence is required before making any investment decision.
Comtech Telecommunications Corp. engages in the design, development, production, and marketing of products, systems, and services for advanced communications solutions in the United States and internationally. It operates in three segments: Telecommunications Transmission, Mobile Data Communications, and RF Microwave Amplifiers. The Telecommunications Transmission segment provides satellite earth station equipment and systems, over-the-horizon microwave systems, and forward error correction technology, which are used in various commercial and government applications, including backhaul of wireless and cellular traffic, broadcasting (including HDTV), IP-based communications traffic, long distance telephony, and secure defense applications. The Mobile Data Communications segment provides mobile satellite transceivers, and computers and satellite earth station network gateways and associated installation, training, and maintenance services; supplies and operates satellite packet data networks, including arranging and providing satellite capacity; and offers microsatellites and related components. The RF Microwave Amplifiers segment designs, develops, manufactures, and markets satellite earth station traveling wave tube amplifiers (TWTA) and broadband amplifiers. Its amplifiers are used in broadcast and broadband satellite communication; defense applications, such as telecommunications systems and electronic warfare systems; and commercial applications comprising oncology treatment systems, as well as to amplify signals carrying voice, video, or data for air-to-satellite-to-ground communications. The company serves satellite systems integrators, wireless and other communication service providers, broadcasters, defense contractors, military, governments, and oil companies. Comtech markets its products through independent representatives and value-added resellers. The company was founded in 1967 and is headquartered in Melville, New York.
Joe Gomes, CFA, Managing Director, Equity Research Analyst, Generalist , Noble Capital Markets, Inc.
Joshua Zoepfel, Research Associate, Noble Capital Markets, Inc.
Refer to the full report for the price target, fundamental analysis, and rating.
Making Progress. Comtech made some progress in its business transformation during the fiscal second quarter, although business conditions remain challenging. The most significant change came post quarter-end with the amendment to its senior secured credit agreement that cures the covenant breaches as of January 31, 2025.
2Q25 Results. Revenue totaled $126.6 million, down 5.7% from the year ago period, but up 9.3% sequentially. Gross margin of 26.7% fell y-o-y, but improved sequentially from 12.5% in 1Q25. Comtech reported a net loss of $48.7 million, before preferred stock adjustments, compared to a net loss of $10.6 million in 2Q24. Adjusted net loss was $0.35/sh compared to a net loss of $0.15/sh last year.
Equity Research is available at no cost to Registered users of Channelchek. Not a Member? Click ‘Join’ to join the Channelchek Community. There is no cost to register, and we never collect credit card information.
This Company Sponsored Research is provided by Noble Capital Markets, Inc., a FINRA and S.E.C. registered broker-dealer (B/D).
*Analyst certification and important disclosures included in the full report. NOTE: investment decisions should not be based upon the content of this research summary. Proper due diligence is required before making any investment decision.
LOS ALTOS, Calif., March 13, 2025 (GLOBE NEWSWIRE) — Unicycive Therapeutics, Inc. (Nasdaq: UNCY), a clinical-stage biotechnology company developing therapies for patients with kidney disease, today announced that it will present patient reported outcomes data from its pivotal UNI-OLC-201 clinical study characterizing the potential impact of oxylanthanum carbonate (OLC) on the treatment of hyperphosphatemia in patients with chronic kidney disease (CKD) on dialysis. These data will be presented at three medical meetings, including the 2025 Annual Dialysis Conference (ADC), March 13-16, 2025, National Kidney Foundation (NKF) Spring Clinical Meetings, April 10-13, 2025, and the 2025 American Nephrology Nurses Association (ANNA) National Symposium, being held on May 1-4, 2025.
Unicycive’s investigational drug OLC leverages proprietary nanoparticle technology to reduce the number and size of pills that patients must take. If approved, OLC may provide patients and their physicians with a welcome new option to control hyperphosphatemia. The New Drug Application (NDA) for OLC was accepted by the U.S. Food and Drug Administration (FDA) for the treatment of hyperphosphatemia in patients with chronic kidney disease on dialysis. The FDA set a Prescription Drug User Fee Act (PDUFA) Target Action Date of June 28, 2025.
“Despite the availability of several approved phosphate binders, hyperphosphatemia remains uncontrolled in 75% of people in the U.S. on dialysis due to challenges of insufficient potency, pill burden and unpalatable formulations. There is a critical need for more effective solutions,” said Shalabh Gupta, M.D., Chief Executive Officer of Unicycive. “Innovative solutions such as OLC that improve phosphate control and minimize pill size and count have the potential to significantly improve adherence, empowering those on dialysis to manage their treatment more effectively.”
Unicycive abstracts to be presented at the upcoming medical meetings include:
ADC
Title: Patient-Reported Outcomes in a Pivotal Clinical Study of Hyperphosphatemia: Oxylanthanum Carbonate Reduces Pill Burden by Half and Improves Adherence – Poster #: A-6870
Presentation Details: Friday, March 14, 5:30-7:30 p.m. PT
Presenting Author: Doug Jermasek
NKF Spring Clinical Meetings
Title: Patient-Reported Outcomes in a Pivotal Clinical Study of Hyperphosphatemia: Oxylanthanum Carbonate Reduces Pill Burden by Half and Improves Adherence – Poster #: G-018
Presentation Details: Thursday, April 10, from 5:15-7:30 p.m. ET
Presenting Author: Guru Reddy, PhD
Title: Pill Burden and Large Tablet Size Are Key Barriers to Phosphate Binder Adherence in Dialysis Patients – Poster #: G-297
Presentation Details: Thursday, April 10, from 5:15-7:30 p.m. ET
Presenting Author: Dr. Hill Gallant, PhD, RD, Associate Professor of Nutrition in the Department of Food Science and Nutrition at the University of Minnesota-Twin Cities
ANNA
Title: Pill Burden and Large Tablet Size Are Key Barriers to Phosphate Binder Adherence in Dialysis Patients
Presentation Details: Friday, May 2, starting at 8:45 a.m. PT
About Oxylanthanum Carbonate (OLC)
Oxylanthanum carbonate is a next-generation lanthanum-based phosphate binding agent utilizing proprietary nanoparticle technology being developed for the treatment of hyperphosphatemia in patients with chronic kidney disease (CKD). OLC has over forty issued and granted patents globally. Its potential best-in-class profile may have meaningful patient adherence benefits over currently available treatment options as it requires a lower pill burden for patients in terms of number and size of pills per dose that are swallowed instead of chewed. Based on a survey conducted in 2022, Nephrologists stated that the greatest unmet need in the treatment of hyperphosphatemia with phosphate binders is a lower pill burden and better patient compliance.1 The global market opportunity for treating hyperphosphatemia is projected to be in excess of $2.28 billion, with the North America accounting for more than $1 billion of that total.2 Despite the availability of several FDA-cleared medications, 75 percent of U.S. dialysis patients fail to achieve the target phosphorus levels recommended by published medical guidelines.3
Unicycive is seeking FDA approval of OLC via the 505(b)(2) regulatory pathway. The NDA submission package is based on data from three clinical studies (a Phase 1 study in healthy volunteers, a bioequivalence study in healthy volunteers, and a tolerability study of OLC in CKD patients on dialysis), multiple preclinical studies, and the chemistry, manufacturing and controls (CMC) data. OLC is protected by a strong global patent portfolio including issued patents on composition of matter with exclusivity until 2031, and with the potential for patent term extension until 2035.
About Hyperphosphatemia
Hyperphosphatemia is a serious medical condition that occurs in nearly all patients with End Stage Renal Disease (ESRD). If left untreated, hyperphosphatemia leads to secondary hyperparathyroidism (SHPT), which then results in renal osteodystrophy (a condition similar to osteoporosis and associated with significant bone disease, fractures and bone pain); cardiovascular disease with associated hardening of arteries and atherosclerosis (due to deposition of excess calcium-phosphorus complexes in soft tissue). Importantly, hyperphosphatemia is independently associated with increased mortality for patients with chronic kidney disease on dialysis. Based on available clinical data to date, over 80% of patients show signs of cardiovascular calcification by the time they become dependent on dialysis.4
Dialysis patients are already at an increased risk for cardiovascular disease (because of underlying diseases such as diabetes and hypertension), and hyperphosphatemia further exacerbates this. Treatment of hyperphosphatemia is aimed at lowering serum phosphate levels via two means: (1) restricting dietary phosphorus intake; and (2) using, on a daily basis, and with each meal, oral phosphate binding drugs that facilitate fecal elimination of dietary phosphate rather than its absorption from the gastrointestinal tract into the bloodstream.
About Unicycive Therapeutics
Unicycive Therapeutics is a biotechnology company developing novel treatments for kidney diseases. Unicycive’s lead drug candidate, oxylanthanum carbonate (OLC), is a novel investigational phosphate binding agent being developed for the treatment of hyperphosphatemia in chronic kidney disease patients on dialysis. Positive pivotal trial results were reported in June 2024 for OLC, and a New Drug Application (NDA) is under review by the U.S. Food and Drug Administration (FDA) with a Prescription Drug User Fee Act (PDUFA) Target Action Date of June 28, 2025. OLC is protected by a strong global patent portfolio including an issued patent on composition of matter with exclusivity until 2031, and with the potential patent term extension until 2035 after OLC approval. Unicycive’s second asset, UNI-494, is a patent-protected new chemical entity in clinical development for the treatment of conditions related to acute kidney injury. UNI-494 has successfully completed a Phase 1 trial. For more information, please visit Unicycive.com and follow us on LinkedIn, X, and YouTube.
Forward-looking statements
Certain statements in this press release are forward-looking within the meaning of the Private Securities Litigation Reform Act of 1995. These statements may be identified using words such as “anticipate,” “believe,” “forecast,” “estimated” and “intend” or other similar terms or expressions that concern Unicycive’s expectations, strategy, plans or intentions. These forward-looking statements are based on Unicycive’s current expectations and actual results could differ materially. There are several factors that could cause actual events to differ materially from those indicated by such forward-looking statements. These factors include, but are not limited to, clinical trials involve a lengthy and expensive process with an uncertain outcome, and results of earlier studies and trials may not be predictive of future trial results; our clinical trials may be suspended or discontinued due to unexpected side effects or other safety risks that could preclude approval of our product candidates; risks related to business interruptions, which could seriously harm our financial condition and increase our costs and expenses; dependence on key personnel; substantial competition; uncertainties of patent protection and litigation; dependence upon third parties; and risks related to failure to obtain FDA clearances or approvals and noncompliance with FDA regulations. Actual results may differ materially from those indicated by such forward-looking statements as a result of various important factors, including: the uncertainties related to market conditions and other factors described more fully in the section entitled ‘Risk Factors’ in Unicycive’s Annual Report on Form 10-K for the year ended December 31, 2023, and other periodic reports filed with the Securities and Exchange Commission. Any forward-looking statements contained in this press release speak only as of the date hereof, and Unicycive specifically disclaims any obligation to update any forward-looking statement, whether as a result of new information, future events or otherwise.
1Reason Research, LLC 2022 survey. Results here. 2 Fortune Business Insights™, Hyperphosphatemia Treatment Market, 2023-2030 3 US-DOPPS Practice Monitor, May 2021; http://www.dopps.org/DPM 4 Block GA, Klassen PS, Lazarus JM, Ofsthun N, Lowrie EG, Chertow GM. Mineral metabolism, mortality, and morbidity in maintenance hemodialysis. J Am Soc Nephrol. 2004 Aug;15(8):2208-18. doi: 10.1097/01.ASN.0000133041.27682.A2. PMID: 15284307.
Mark Reichman, Managing Director, Equity Research Analyst, Natural Resources, Noble Capital Markets, Inc.
Refer to the full report for the price target, fundamental analysis, and rating.
Full year 2024 financial results. FreightCar America generated 2024 adjusted net income to common stockholders of $4.5 million or $0.15 per share compared to a loss of $11.0 million or $(0.39) per share in 2023 and our estimate of $5.5 million or $0.17 per share. Gross margin as a percentage of revenue increased to 12.0% compared to 11.7% in FY 2023. Revenue and rail car deliveries increased to $559.4 million and 4,362 compared to $358.1 million and 3,022 in 2023. We had forecast revenue of $577.4 million and deliveries of 4,550. Adjusted EBITDA increased to $43.0 million compared to $20.1 million in 2023 and our estimate of $38.3 million. Full year adjusted free cash flow amounted to $21.7 million versus $(17.6) million in 2023.
Full Year 2025 corporate guidance. Management issued full year 2025 guidance. Railcar deliveries are expected to be in the range of 4,500 to 4,900, revenue is expected to be in the range of $530 million to $595 million, and adjusted EBITDA is expected to be in the range of $43 to $49 million. Compared to 2024, railcar deliveries, revenue, and adjusted EBITDA are expected to increase 7.7%, 0.6%, and 7.0%, respectively, at the midpoints of guidance. Our current 2025 estimates include railcar deliveries of 4,675 units, revenue of $580.6 million and EBITDA of $44.9 million.
Equity Research is available at no cost to Registered users of Channelchek. Not a Member? Click ‘Join’ to join the Channelchek Community. There is no cost to register, and we never collect credit card information.
This Company Sponsored Research is provided by Noble Capital Markets, Inc., a FINRA and S.E.C. registered broker-dealer (B/D).
*Analyst certification and important disclosures included in the full report. NOTE: investment decisions should not be based upon the content of this research summary. Proper due diligence is required before making any investment decision.
Key Points: – Mallinckrodt and Endo will combine to form a diversified pharmaceutical powerhouse. – The merger will create a company with $3.6 billion in projected 2025 revenue and $1.2 billion in adjusted EBITDA. – The new entity will focus on branded specialty pharmaceuticals while planning to separate its generics and sterile injectables business.
Pharmaceutical companies Mallinckrodt and Endo have agreed to merge in a $6.7 billion deal that will create a new powerhouse in the specialty medication market, the companies announced Thursday.
The stock-and-cash transaction, expected to close in the second half of 2025, combines Mallinckrodt’s rare disease portfolio with Endo’s sterile injectables business, positioning the merged entity to compete more effectively in high-margin specialty pharmaceutical segments.
Shares of both companies jumped on the news, with Mallinckrodt stock up 7.2% and Endo shares surging 12.3% in morning trading.
Under the terms of the agreement, Endo shareholders will receive $80 million in cash while maintaining a 49.9% stake in the combined company. Mallinckrodt shareholders will hold the remaining 50.1% interest, with Mallinckrodt serving as the parent company.
The merged firm projects $3.6 billion in revenue for 2025 with $1.2 billion in adjusted EBITDA. Management expects to achieve $150 million in annual cost synergies by the third year post-merger, with $75 million realized in the first year.
Goldman Sachs is providing $900 million in committed financing to support the transaction. The combined company will operate with a net leverage ratio of approximately 2.3x, giving it significant financial flexibility for future growth initiatives.
Siggi Olafsson, CEO of Mallinckrodt, will lead the combined entity. The companies emphasized that the complementary nature of their businesses would maximize operational efficiencies while maintaining focus on innovation.
A key component of the merger strategy involves the eventual separation of the combined sterile injectables and generics businesses. While these operations will initially be integrated, management plans to spin off this unit as a standalone company, pending board approval and market conditions.
The core branded specialty pharmaceuticals business will focus on rare diseases and hospital-based therapies, areas where both companies have established market positions. With 17 manufacturing facilities and 30 distribution centers predominantly in the United States, the company will employ approximately 5,700 people worldwide.
According to Endo’s interim CEO Scott Hirsch, the merger will leverage complementary strengths and create immediate scale advantages in key therapeutic areas. The planned separation of the generics business aims to further sharpen focus on high-growth specialty markets.
The Mallinckrodt-Endo merger comes amid increasing consolidation in the pharmaceutical sector as companies look to gain scale and portfolio diversification.
Analysts at Morgan Stanley noted that the deal makes strategic sense for both companies, particularly given the challenges they’ve faced individually in recent years. The combined entity will have greater resources to invest in R&D and a stronger position in negotiations with payers and hospital systems.
However, some analysts expressed caution about integration risks and the ambitious timeline for the planned business separation. Healthcare analysts at JP Morgan pointed out that executing a merger of this scale while simultaneously preparing for a business spinoff creates significant operational complexity. The management team will need to carefully balance these priorities to deliver the promised synergies.
The combined company will be listed on the New York Stock Exchange following the transaction’s completion.
Key Points: – Gold futures have surpassed $2,990 per ounce, with Wall Street forecasts predicting prices could reach $3,500 later this year. – Geopolitical uncertainty, inflation concerns, and central bank purchases are fueling demand for the precious metal. – Rising gold prices may signal investor caution, monetary policy shifts, and potential market volatility.
Gold has once again proven its status as a safe-haven asset, reaching new record highs as economic and geopolitical uncertainties continue to mount. The latest surge has pushed gold futures above $2,990 per ounce, with some analysts now predicting that prices could hit $3,500 by the third quarter of 2025.
A primary driver of gold’s rally has been increased geopolitical tensions and uncertainty surrounding global trade policies. The Trump administration’s latest tariff measures and ongoing shifts in international relations have created an environment of heightened risk, prompting investors to flock toward assets perceived as stable. Macquarie Group recently raised its gold price forecast, citing trade instability and inflationary pressures as key factors supporting higher prices. Similarly, BNP Paribas and Goldman Sachs have also adjusted their targets, expecting gold to trade above $3,100 an ounce in the near term.
Inflation expectations have played a significant role in gold’s rapid ascent. With the Federal Reserve facing ongoing pressure regarding interest rate policy, the release of softer inflation data has fueled speculation that the central bank may eventually cut rates to support economic growth. Historically, lower interest rates tend to weaken the U.S. dollar and make gold a more attractive investment, further fueling its rally. However, if inflation remains persistent, the Fed may be forced to maintain a more restrictive stance, potentially slowing gold’s upward momentum.
Another major factor driving gold’s price surge is continued central bank buying. Institutional investors and sovereign wealth funds have been stockpiling physical gold as a hedge against currency volatility and economic downturns. Reports indicate that significant amounts of gold have been shipped to vaults in New York in anticipation of potential trade restrictions and price disparities between London and U.S. markets. This surge in demand has tightened supply and contributed to rising prices.
Mark Reichman, research analyst for industrials and basic industries at Noble Capital Markets, highlighted the growing appeal of gold as a safe-haven investment. “Gold’s appeal as a safe-have asset has only grown stronger as investors fear an escalating trade war could trigger both inflation and an economic slowdown. Growing market volatility, along with anxiety associated with geopolitical tensions and the perception of chaotic policy execution in Washington and its attendant consequences, have all contributed to growing demand for gold as a hedge against uncertainty. While some of these catalysts could unwind over time, we think there are several underlying factors, including central bank buying, that could offer support for the gold price..”
The broader economic implications of gold’s record-breaking rally are worth considering. Historically, sharp increases in gold prices have often coincided with periods of financial instability or economic slowdowns. Investors tend to turn to gold during times of uncertainty, viewing it as a hedge against inflation, currency depreciation, and stock market volatility. If gold continues its upward trajectory, it could signal growing concerns over the stability of the global economy and financial markets.
For investors, the question now becomes whether gold’s rally is sustainable. While some analysts believe the precious metal still has room to run, others caution that the current surge could lead to increased volatility. If economic conditions stabilize, or if the Federal Reserve takes a more aggressive stance against inflation, gold prices could face downward pressure. On the other hand, if geopolitical risks escalate further, gold could remain a preferred asset for investors seeking protection against uncertainty.
As gold flirts with record highs, all eyes will be on central banks, inflation data, and geopolitical developments. Whether prices continue climbing or experience a pullback, gold’s performance will serve as an important barometer for global economic sentiment in the months ahead.
Key Points: – Canada imposes 25% tariffs on $21 billion of U.S. goods in response to Trump’s steel and aluminum duties. – The tariffs target steel, aluminum, computers, sports equipment, and cast iron products. – The European Union has also announced its own tariffs on U.S. goods, signaling broader economic consequences.
The ongoing trade tensions between the United States and Canada reached a new peak as Canada announced a fresh wave of retaliatory tariffs on more than $21 billion worth of American goods. The move comes in response to the Trump administration’s 25% duties on Canadian steel and aluminum, which took effect overnight. Canadian Finance Minister Dominic LeBlanc confirmed that these new tariffs, which will take effect immediately, add to the 25% counter-tariffs Ottawa imposed on $30 billion of U.S. goods earlier this month.
This latest round of tariffs escalates a trade conflict that has rattled markets and raised concerns among economists about supply chain disruptions. The affected goods include a broad range of industries, from steel and aluminum to computers, sports equipment, and cast iron products. As one of America’s largest trading partners, Canada’s decision underscores its commitment to defending its economy while further complicating trade relations with the U.S.
“This is much more than about our economy. It is about the future of our country,” said Melanie Joly, Canada’s foreign affairs minister. “Canadians have had enough, and we are a strong country.” The Canadian government’s firm stance reflects growing frustration with what it sees as aggressive economic tactics by the Trump administration.
The fallout from these tariffs is expected to ripple through multiple sectors. For businesses relying on U.S.-Canadian trade, the increased costs may lead to higher prices for consumers and disruptions in supply chains. Manufacturers, particularly in the auto and technology industries, will feel the strain as component costs rise. Meanwhile, small businesses on both sides of the border could struggle with the added burden of tariffs, limiting their competitiveness in an already volatile economic environment.
The trade dispute has also extended beyond North America. Following the U.S. steel and aluminum tariffs, the European Union announced it would impose tariffs on over $28 billion worth of U.S. goods starting in April. The global economic implications of these trade policies are becoming increasingly difficult to ignore, as countries respond with their own countermeasures, creating an environment of heightened uncertainty for businesses and investors alike.
Meanwhile, political tensions are also heating up. President Trump, a vocal advocate for tariffs, initially threatened to double the levies on Canadian steel and aluminum to 50% but later backed down after Ontario Premier Doug Ford threatened a retaliatory surcharge on electricity exports to the U.S. The back-and-forth illustrates the unpredictability of the current trade landscape and the challenges businesses face in navigating these policy shifts.
While the Trump administration argues that tariffs protect domestic industries and jobs, many economists warn that these measures can have the opposite effect. Higher costs for imported goods, potential job losses in export-dependent industries, and increased uncertainty on Wall Street are just some of the potential repercussions. As the situation continues to unfold, investors and businesses will be watching closely for signs of de-escalation or further trade confrontations.
Hub to Advance Global Vaccine and Immuno-Oncology Development
ATLANTA, GA, March 12, 2025 – GeoVax Labs, Inc. (Nasdaq: GOVX), a clinical-stage biotechnology company specializing in the development of immunotherapies and vaccines, today announced its initial steps toward establishing a strategic presence in Europe, with the UK as its initial footprint. This move aligns with the Company’s commitment to advancing its vaccine and immunotherapy pipeline through global collaborations.
Efforts are underway to identify a UK location best suited to align with GeoVax’s development and corporate strategy. The Company already has several established connections in the UK and broader European region, including:
Scientific Expertise: Professor Teresa Lambe, a principal investigator at the Oxford Vaccine Group, recently joined GeoVax’s Scientific Advisory Board. Professor Lambe played a pivotal role in the development of the Oxford/AstraZeneca COVID-19 vaccine and has extensive experience in vaccine design and evaluation.
Manufacturing Partnerships: GeoVax maintains an existing contract development and manufacturing organization (CDMO) relationship with Oxford Biomedica PLC (Oxford, UK), as well as additional collaborations with Oxford Biomedica (France), with facilities in Strasbourg and Lyon.
Technology Licensing: The Company has a broad licensing agreement with ProBioGen AG (Berlin, Germany) to utilize their AGE1 continuous avian cell line for the manufacture of MVA vaccines.
European Collaborations: GeoVax currently collaborates with multiple European-based service providers and UK academic partners, reinforcing the strategic rationale for establishing a presence within the region.
To support this initiative, GeoVax is working closely with Professor Teresa Lambe and clinical investigators and scientists in Oxford and other academic centers across the UK to develop preclinical, translational, and clinical projects supporting its pipeline. Additionally, Dr. Deborah Spencer, a highly regarded expert in industry-academic partnerships and public health development, has recently been retained to facilitate and coordinate initiatives in the UK and Europe.
Establishing a strategic presence in Europe will support GeoVax’s infectious disease vaccine development efforts and play a key role in advancing Gedeptin®, the Company’s lead immuno-oncology candidate. Currently in clinical development for the treatment of advanced head and neck cancers, Gedeptin is anticipated to be further developed for use with immune checkpoint inhibitors as a potential treatment for various other solid tumors. GeoVax holds worldwide rights to Gedeptin for all indications.
“Expanding our presence into Europe represents a critical milestone for GeoVax as we continue to develop innovative solutions for infectious diseases and oncology, especially in building upon our initial UK footprint,” said David Dodd, President and CEO of GeoVax. “The globally recognized expertise of our key European collaborators and partners will significantly enhance our research and development capabilities. This expansion underscores our commitment to global collaboration and innovation in both vaccine and immuno-oncology development. As we accelerate the development of our infectious disease vaccine candidates and Gedeptin, we look forward to providing continued updates.”
About GeoVax
GeoVax Labs, Inc. is a clinical-stage biotechnology company developing novel vaccines for many of the world’s most threatening infectious diseases and therapies for solid tumor cancers. The company’s lead clinical program is GEO-CM04S1, a next-generation COVID-19 vaccine for which GeoVax was recently awarded a BARDA-funded contract to sponsor a 10,000-participant Phase 2b clinical trial to evaluate the efficacy of GEO-CM04S1 versus an approved COVID-19 vaccine. In addition, GEO-CM04S1 is currently in three Phase 2 clinical trials, being evaluated as (1) a primary vaccine for immunocompromised patients such as those suffering from hematologic cancers and other patient populations for whom the current authorized COVID-19 vaccines are insufficient, (2) a booster vaccine in patients with chronic lymphocytic leukemia (CLL) and (3) a more robust, durable COVID-19 booster among healthy patients who previously received the mRNA vaccines. In oncology the lead clinical program is evaluating a novel oncolytic solid tumor gene-directed therapy, Gedeptin®, having recently completed a multicenter Phase 1/2 clinical trial for advanced head and neck cancers. A Phase 2 clinical trial in first recurrent head and neck cancer, evaluating Gedeptin® combined with an immune checkpoint inhibitor is planned. GeoVax has a strong IP portfolio in support of its technologies and product candidates, holding worldwide rights for its technologies and products. The Company has a leadership team who have driven significant value creation across multiple life science companies over the past several decades. For more information about the current status of our clinical trials and other updates, visit our website: www.geovax.com.
Forward-Looking Statements
This release contains forward-looking statements regarding GeoVax’s business plans. The words “believe,” “look forward to,” “may,” “estimate,” “continue,” “anticipate,” “intend,” “should,” “plan,” “could,” “target,” “potential,” “is likely,” “will,” “expect” and similar expressions, as they relate to us, are intended to identify forward-looking statements. We have based these forward-looking statements largely on our current expectations and projections about future events and financial trends that we believe may affect our financial condition, results of operations, business strategy and financial needs. Actual results may differ materially from those included in these statements due to a variety of factors, including whether: GeoVax is able to obtain acceptable results from ongoing or future clinical trials of its investigational products, GeoVax’s immuno-oncology products and preventative vaccines can provoke the desired responses, and those products or vaccines can be used effectively, GeoVax’s viral vector technology adequately amplifies immune responses to cancer antigens, GeoVax can develop and manufacture its immuno-oncology products and preventative vaccines with the desired characteristics in a timely manner, GeoVax’s immuno-oncology products and preventative vaccines will be safe for human use, GeoVax’s vaccines will effectively prevent targeted infections in humans, GeoVax’s immuno-oncology products and preventative vaccines will receive regulatory approvals necessary to be licensed and marketed, GeoVax raises required capital to complete development, there is development of competitive products that may be more effective or easier to use than GeoVax’s products, GeoVax will be able to enter into favorable manufacturing and distribution agreements, and other factors, over which GeoVax has no control.
Further information on our risk factors is contained in our periodic reports on Form 10-Q and Form 10-K that we have filed and will file with the SEC. Any forward-looking statement made by us herein speaks only as of the date on which it is made. Factors or events that could cause our actual results to differ may emerge from time to time, and it is not possible for us to predict all of them. We undertake no obligation to publicly update any forward-looking statement, whether as a result of new information, future developments or otherwise, except as may be required by law.